1. Introduction
Most engineered water distribution systems (WDSs) in urban areas are facing multiple internal and external development pressures during their lifespan, and have to be continuously adapted in order to guarantee a sufficient high level of service at all times [
1]. Therefore, future changes in demographic, climatic and socioeconomic developments are going to be the key drivers for changing the system’s structure and operation [
2]. In this context, the term “transition” is used to describe the pathway from an initial (current) to a final (planning) development stage in a WDS, including its structural and functional changes over time [
3]. The intermediate development stages (i.e., specific points in time during the transition process), also including the initial and final development stage, are hereinafter defined as transition stages.
Fast ongoing system transitions (e.g., urban development) and the contradicting long lifespan of WDS components of several decades, stress existing infrastructure and require new approaches on how WDSs are designed and operated [
4]. State-of-the-art strategies address flexible infrastructure design, where planners can react to future uncertainties [
5]. Basupi and Kapelan [
6] introduced a flexible design method under consideration of future demand uncertainties to provide cost-efficient solutions to decision makers. Creaco et al. [
7] defined the gradual and optimal WDS growth over time as phasing of construction, where structural network expansions are investigated and optimized at several time steps instead of considering only a single design phase, also taking into account demand uncertainties [
8]. As such, this strives for the optimal scheduling of pipe upgrade works. Beh et al. [
9] investigated the augmentation of WDSs from a water resource perspective, proving the benefits of adaptive plans compared with those fixed at the initial planning stage. However, from a network perspective these studies assume a certain development of future network structure and are mostly limited to small test cases. Conversely, this study focuses on an exploratory modelling approach under deep uncertainties in network structure and a case study problem of a larger scale (several thousand pipes and junctions), without seeking for optimal and computational expensive solutions [
10]. Furthermore, studies investigating the combined effects of network construction and deconstruction at the same time are lacking and therefore further investigations are necessary.
The objective of this work is to assist decision makers in testing various planning options (e.g., changing the future city layout) and design strategies (e.g., single-stage design). This paper introduces a holistic modelling framework to assess system performances of WDSs during long-term transitions. A methodology is presented to generate and assess water networks at specific points in time by considering the uncertainty in the future development. The transition process describes the disconnection and addition of pipes to the network, including the related shift in water demand. The uncertainties are addressed with the automatic creation of planning options (stochastic future network structures) and different development scenarios affecting the total water consumption. Each examined point in time during the transition process (transition stage) is evaluated with performance indicators to describe the hydraulic and water quality states of the system. They enable the detection of weak points and critical transition stages [
11]. This work includes hydraulic assessments (pressure head), qualitative statements (water age) and a capacity index (pressure surplus).
The novelty of the proposed methodology is the automatic creation of planning options, which are suitable if data for modelling are not available, limited or of poor quality. Frequently, data availability is limited by legal restrictions but also existing data of a good quality might not be suitable for the desired modelling aim. To overcome this problem, an approach using data of alternative systems (e.g., street network data) with strong structural similarities to the WDSs, represents a good alternative to complement or even compensate missing data and test developed models on a less case-study-specific perspective [
12,
13,
14]. Furthermore, newly planned networks can be developed by creating a variety of WDSs with little effort, considering different structural aspects and development scenarios for the purpose of identifying the most robust system, either for newly built WDS or existing WDS parts in poor condition, requiring redesign [
7,
15].
In this paper, the proposed methodology is applied to the Swedish town Kiruna, where a major transition of the city is taking place until the end of the century. Substantial parts of the town, including its water infrastructure, have to be moved due to expanding underground mining activities. Various planning options for the future WDS (network structure and loop degree) are tested for different scenarios and one design strategy. The results prove the proposed method is capable of identifying critical WDS stages during a transition process. The outcome can further support engineers and planners to evaluate risks and opportunities for planning and scheduling cost-efficient pipe upgrades. In this work, we tested a simple design strategy of a traditional “single-stage-design” and a “doing-all-at-the-end” approach, where necessary pipe upgrades are performed at the final stages of the transition process. For the investigated case study, we found that the sole design of the final-stage WDS is insufficient for most of the future scenarios and planning options. Owing to the drastic network deconstruction and the stepwise “loss of capacity”, critical pipes must be redesigned at earlier stages for the scenarios of constant demand and demand increase (e.g., population growth). The methodology can also be applied to investigate uncertain spatial city development and testing different expansion or deconstruction scenarios for any city.
2. Modelling Framework
The future development of water consumption is highly uncertain. It depends on multiple factors, such as changes in population and consumption patterns, climate change, variations of land use, tourism and economic trends [
16]. All these global pressures can have a significant impact on the performances of existing WDSs during their lifespan and can be investigated with a scenario analysis [
17]. Uncertainties in the network structure occur when planning new WDSs [
7]. Also in existing WDSs, the exact physical location of network parts (mostly secondary pipes) is sometimes incomplete or even unknown [
14]. Furthermore, the variation of future network structure is considered when retrofitting existing systems (e.g., provision of alternative flow paths) to enhance the reliability and robustness of the WDS. To tackle these challenges, uncertainties in the future network are considered with stochastically generated WDS structures [
18] (e.g., varying minimum spanning tree and loop degree in the network) and referred to as possible planning options for the future. In this context, the minimum spanning tree is an undirected graph (e.g., WDS network) with no loops, connecting all demand nodes with the water source(s) and the sum of all edge weights (e.g., pipe length) is minimal [
19]. The loop degree is introduced by the cycle index (CI). It defines the length ratio of alternative paths between two nodes (shortcuts) and the corresponding path obtained from the minimum spanning tree (CI = 0 is a fully branched system, for CI > 0 loops are created) [
14].
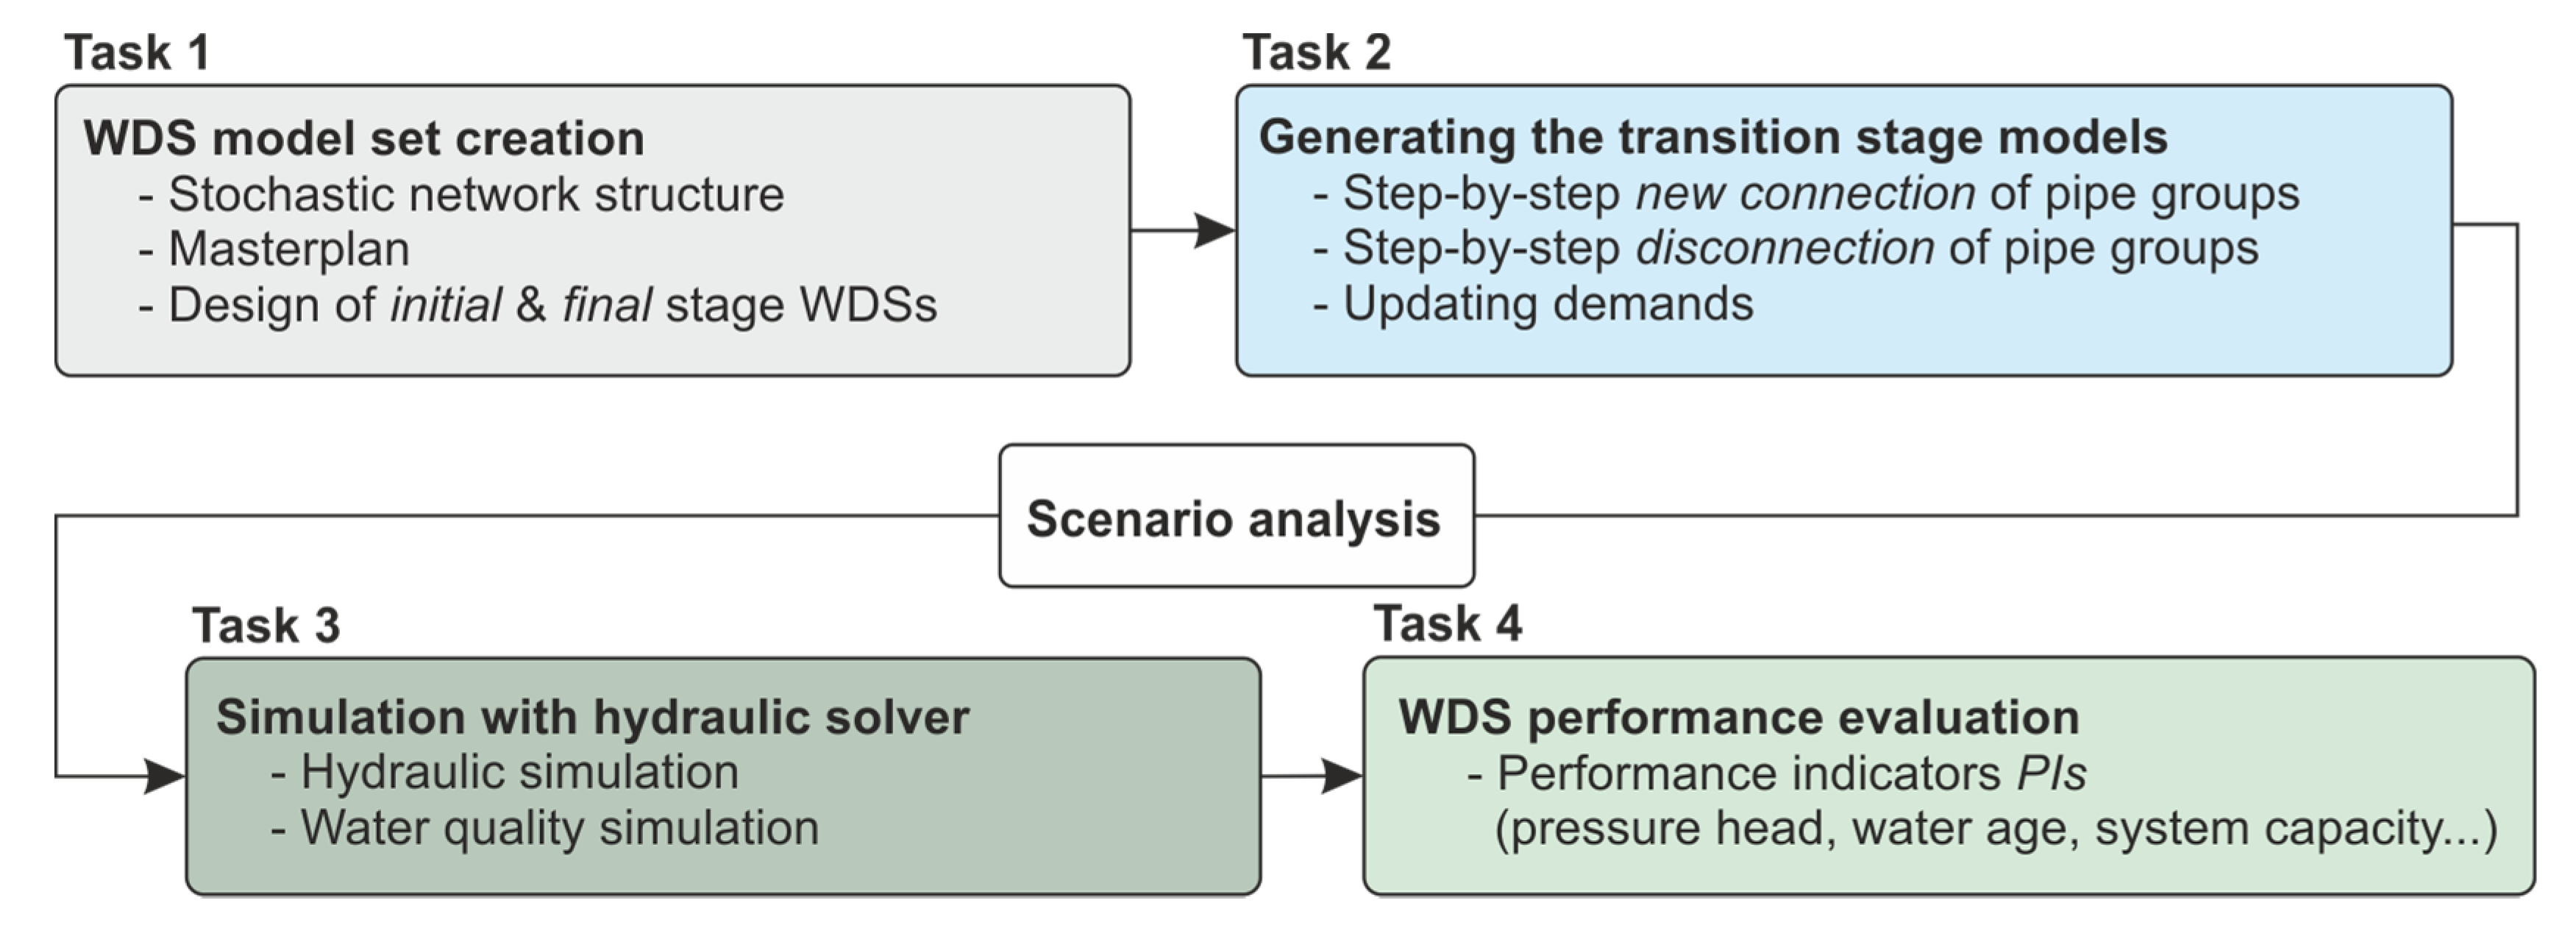
The following presents the development of a modelling tool to automatically evaluate network performances during a WDS transition process. In
Figure 1 the modelling framework is outlined in four sequential tasks and described in detail in the following paragraphs.
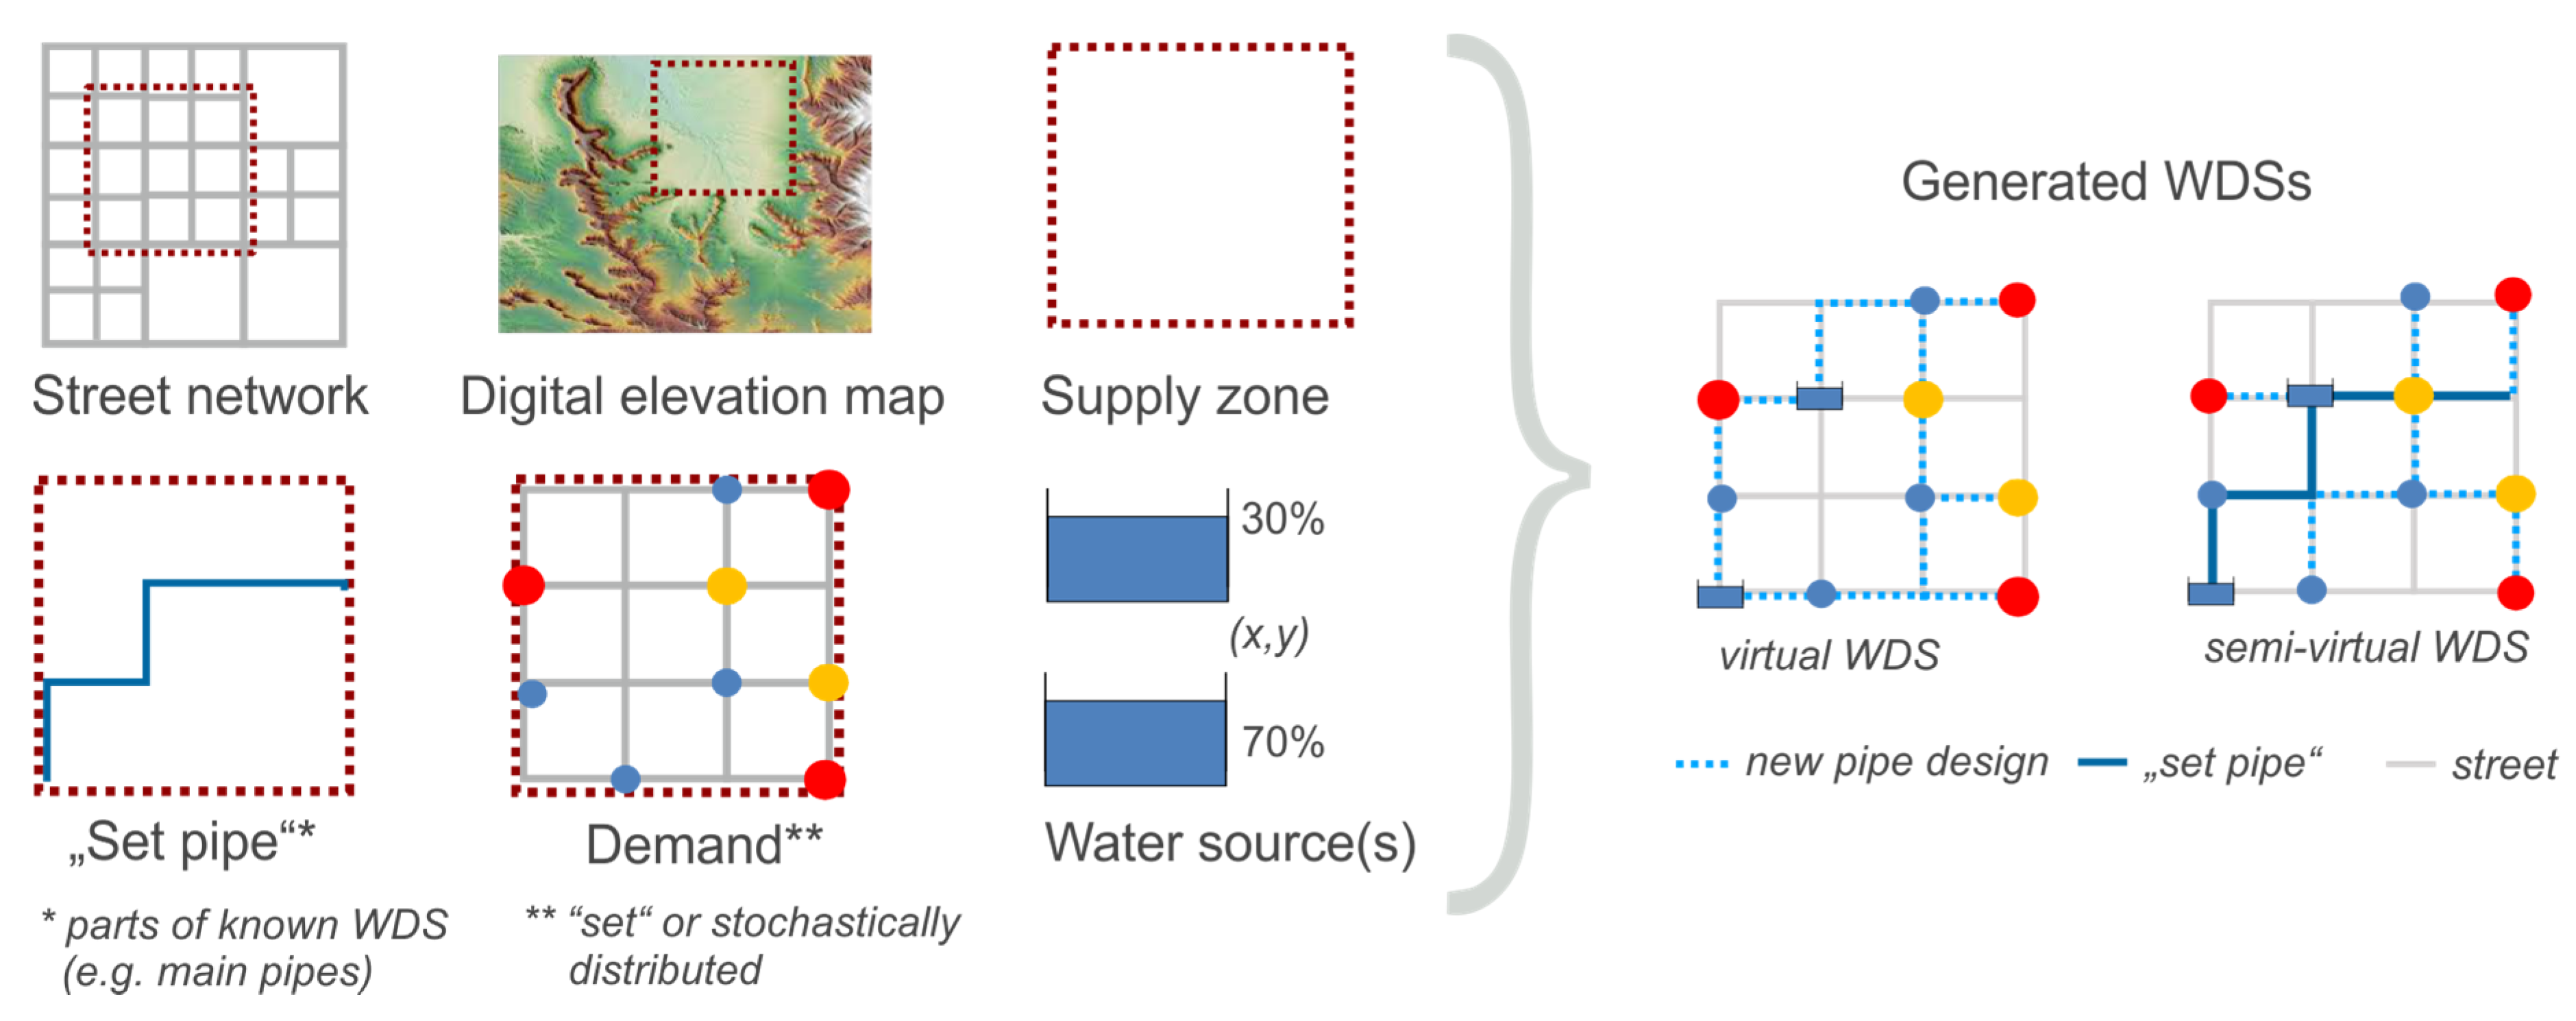
Task 1 describes the generation of networks according to the approach presented by Mair et al. [
18]. The generation algorithms are implemented in C++ and distributed as open source. (Available online:
https://github.com/iut-ibk/DynaVIBe (accessed on 15 August 2017)) The software includes: 1) a spanning tree-based algorithm for network structure design, 2) algorithms for future demand projection and 3) an automated pipe-sizing algorithm to create WDSs based on GIS data [
20,
21]. Previous studies showed the high colocation of street and water distribution networks [
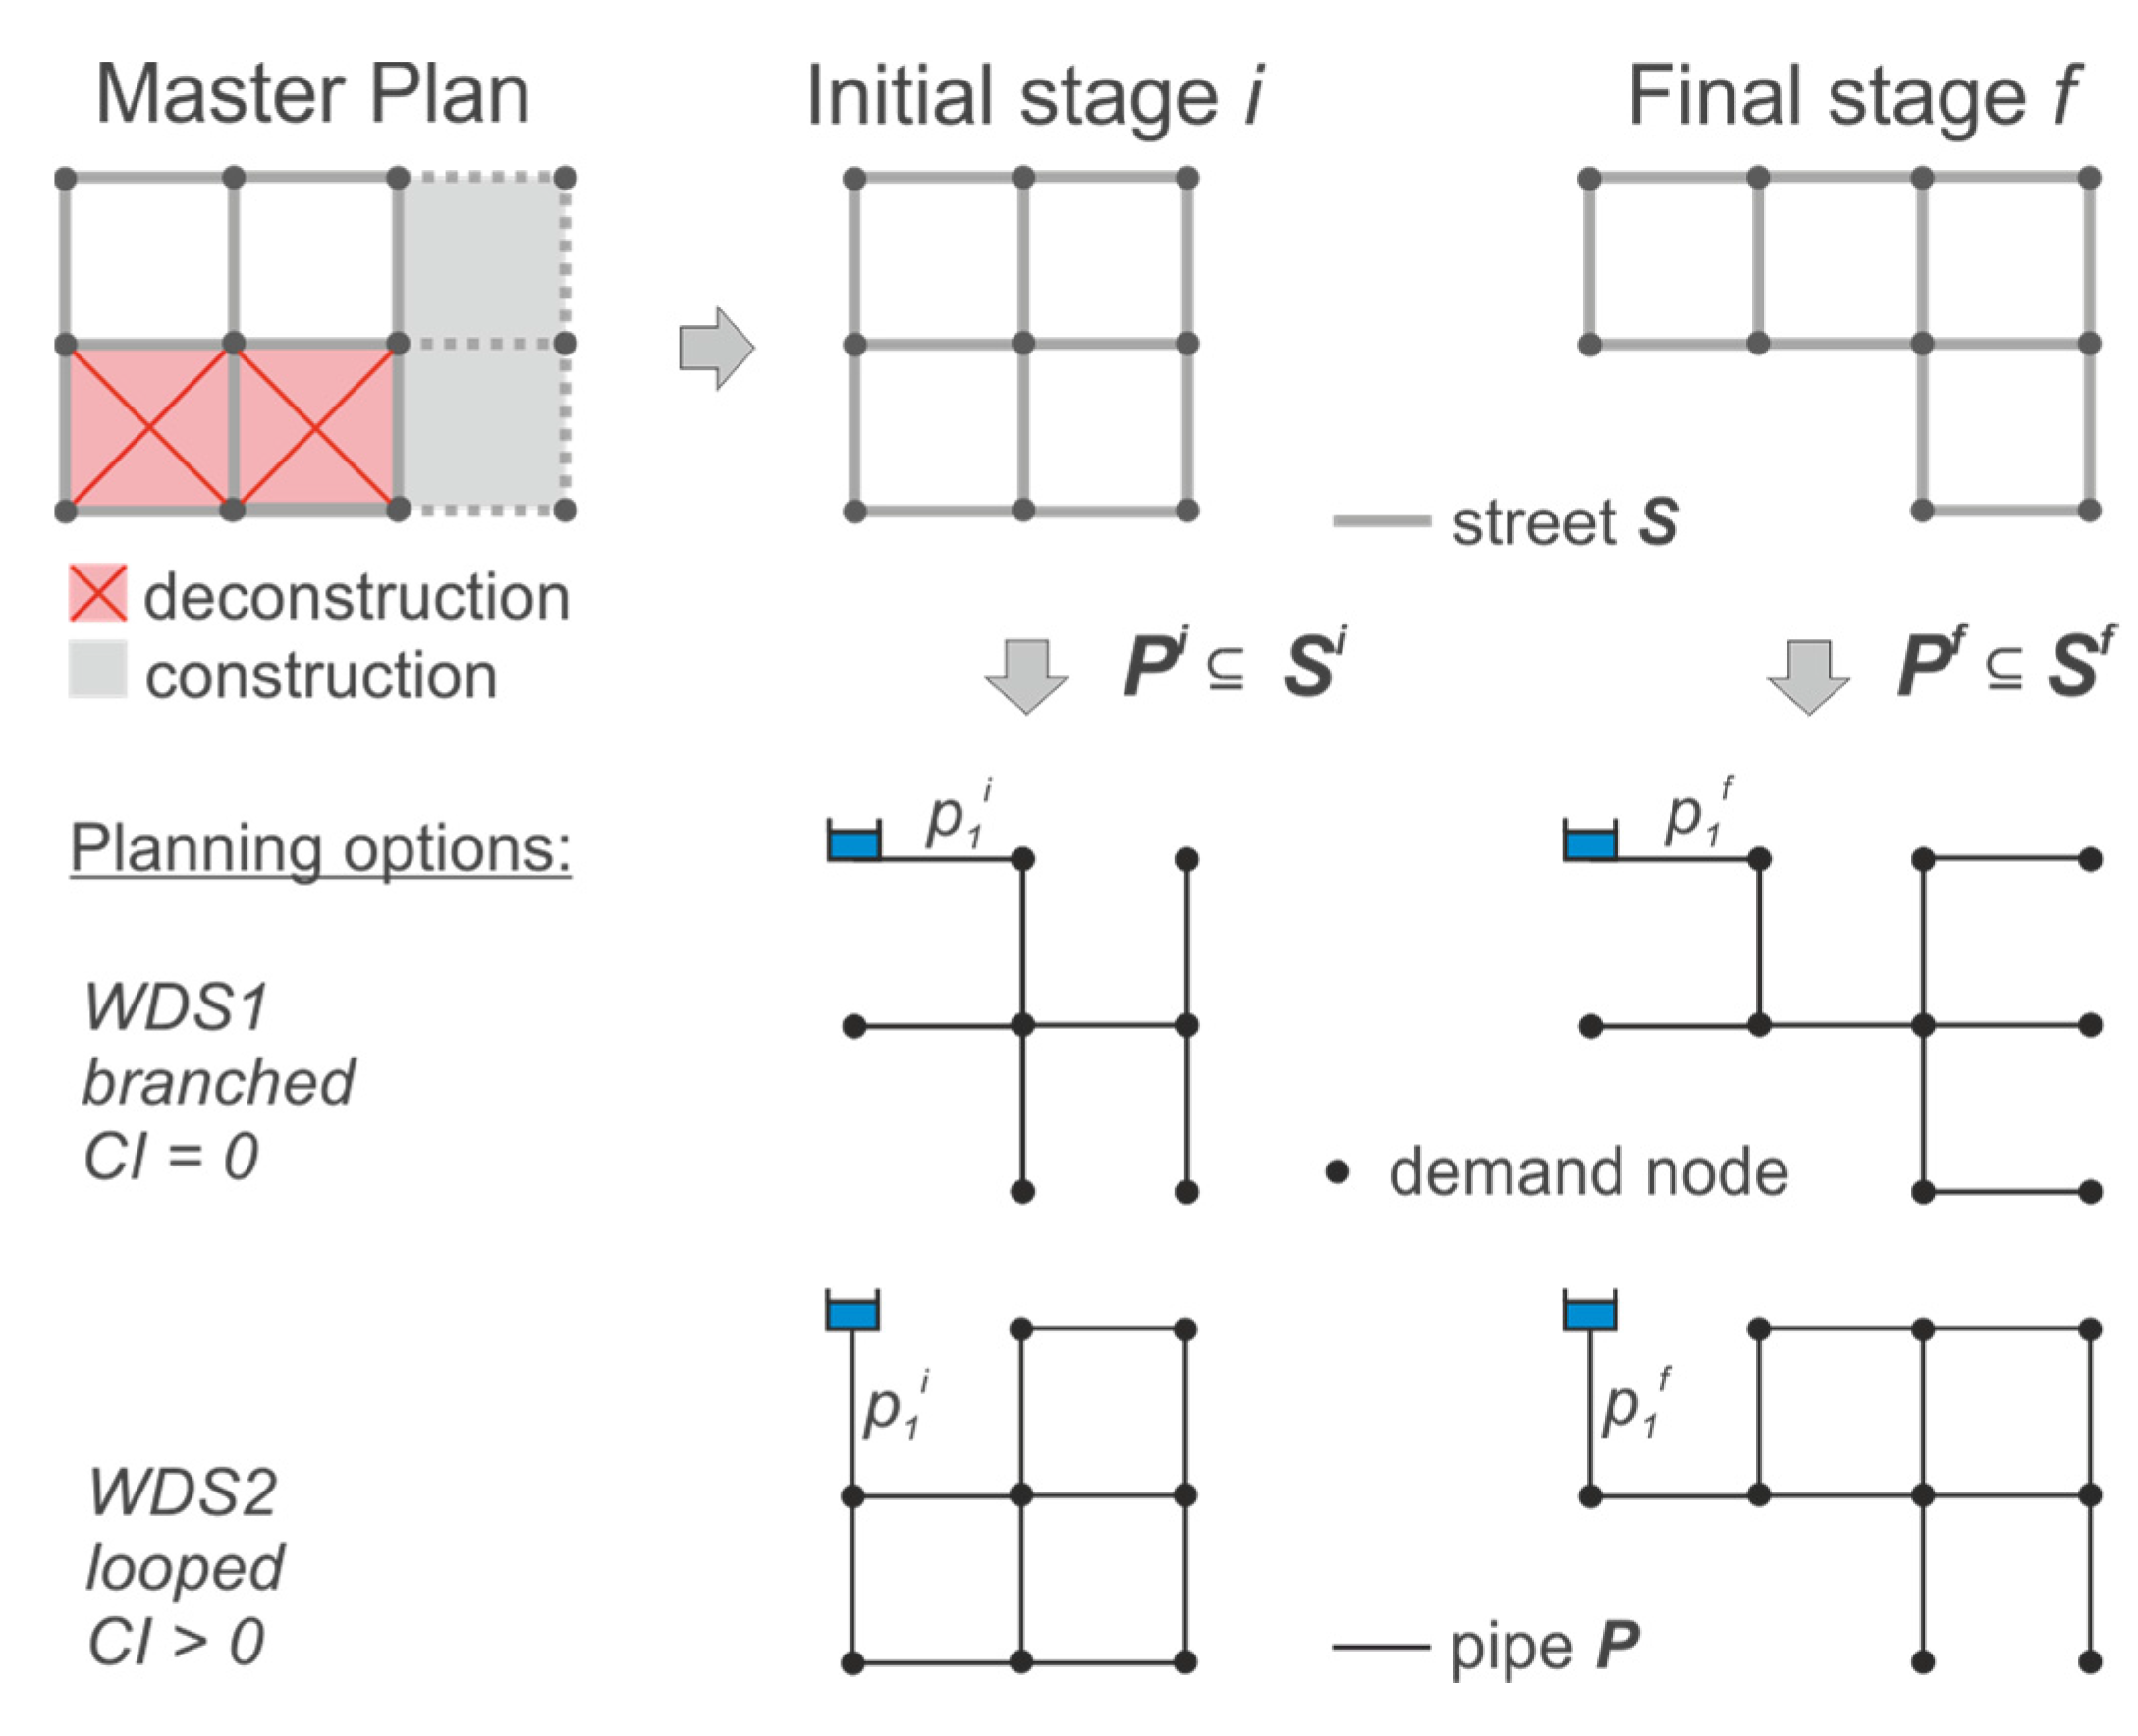
14], which offers the opportunity to use that information for the WDS design. The required input data are the digital elevation map (DEM) of the town, the positions and the supply ratio (%) of the water sources, the street network, the nodal demands and – optional - the known pipe sections (see “set” pipe in
Figure 2). In case the WDS and/or the nodal demands are incomplete or even unknown, the missing information represent variables in the stochastic WDS generation process. This principle applies for all unknown WDS parts, regardless of existing and/or future WDS. For this reason, the WDS is designed for the initial (existing) and the final (planning) stage. For example, in a WDS only the pipes with a diameter greater than 200 mm are known. In that case, the missing pipe connections to demand nodes can be stochastically generated on basis of the overlying street network, by assuming the WDS network |
P| being a subset (|
P| ⊆ |
S|) of the street network |
S|. Resulting WDSs, using different a different level of detail in the input data, are shown in
Figure 2 on the right. With this modelling approach, a robust network structure can be identified for the future, not only for newly planned WDSs, but also for the redesign of existing systems (e.g., closing loops for redundancy).
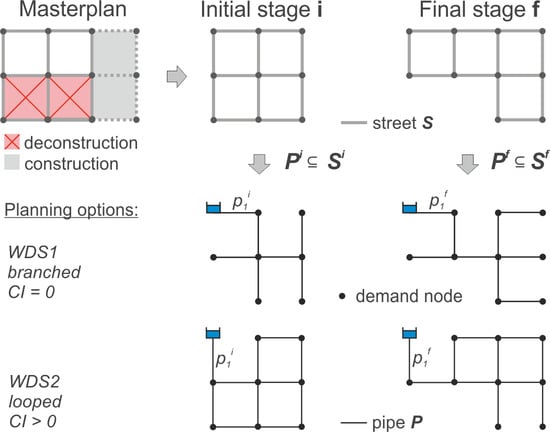
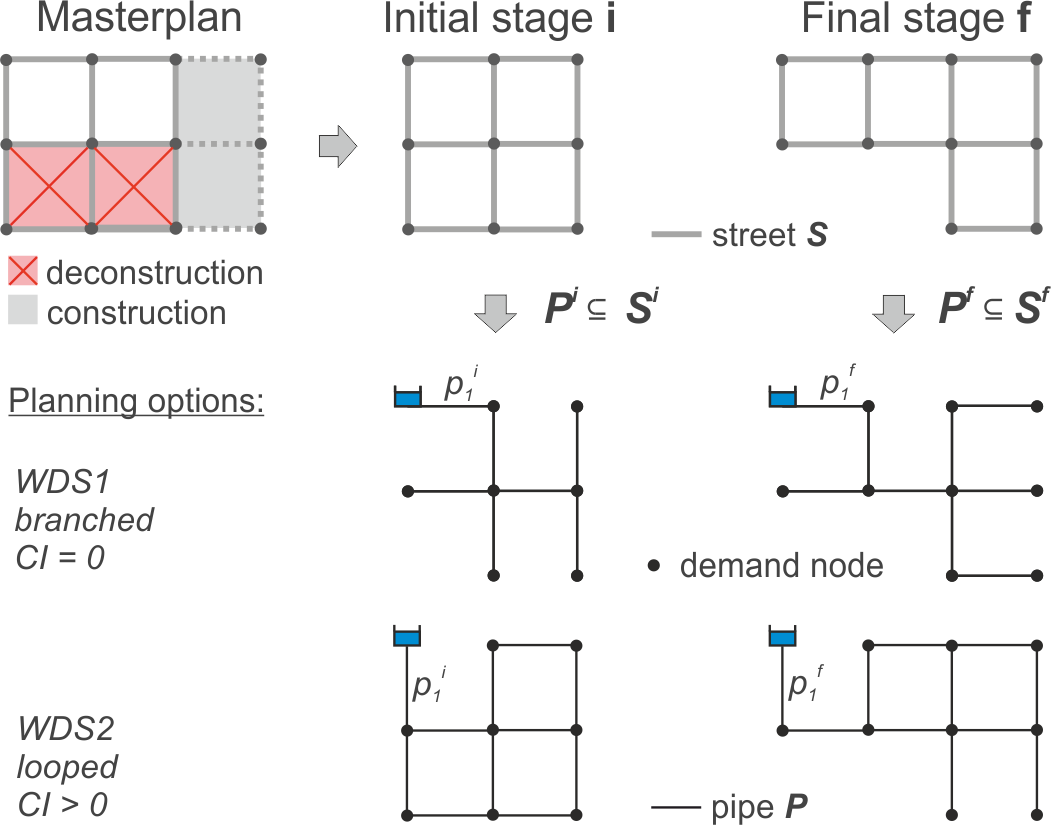
When considering the dynamics of long-term WDS transitioning (e.g., network expansion, demand shifting, network shrinking) with this methodology, a city’s master plan must be integrated. For example, expanding future street network data derived from architect plans are used to generate future WDSs.
Figure 3 illustrates the initial (existing) stage
i and final (planning) stage
f of the WDS during the transition process, which are generated and fulfil the boundaries of the master plan (future street network, deconstruction and construction zones). Unknown pipe diameters are independently designed at both stages, using a pipe-sizing algorithm based on the approach of Saldarriaga et al. [
23]. With this algorithm, the pipe diameters are calculated based on a) the maximum hourly demand
Qh,max as design value and b) an assumed pressure surface inclination of 5 m/km. The pipe diameters are then divided into discrete diameter classes. Let |
Pi| = {
p1,
p2, …,
pni}
i be the set of all pipes at initial stage
i, where
ni is the number of pipes at stage
i. Conversely, |
Pf| = {
p1,
p2,…,
pnf}
f is the set of all pipes at final stage
f, where
nf is the number of pipes at stage
f. Then the intersection of the sets |
Pi| ∩ |
Pf| is built and the designed diameters compared. Pipes with a changing diameter are added to the new pipe set |
Pup| = {}, representing the necessary pipe upgrades. According to Mair et al. [
14] the generated WDS set is classified with the cycle index (CI), describing the degree of loops (alternative flow paths) in the network. With this approach sufficiently working “engineering” solutions, rather than optimal WDS are generated with adequate computational capacity. For the target application to large case studies (with several thousand elements), the reduced computational effort is a compelling argument.
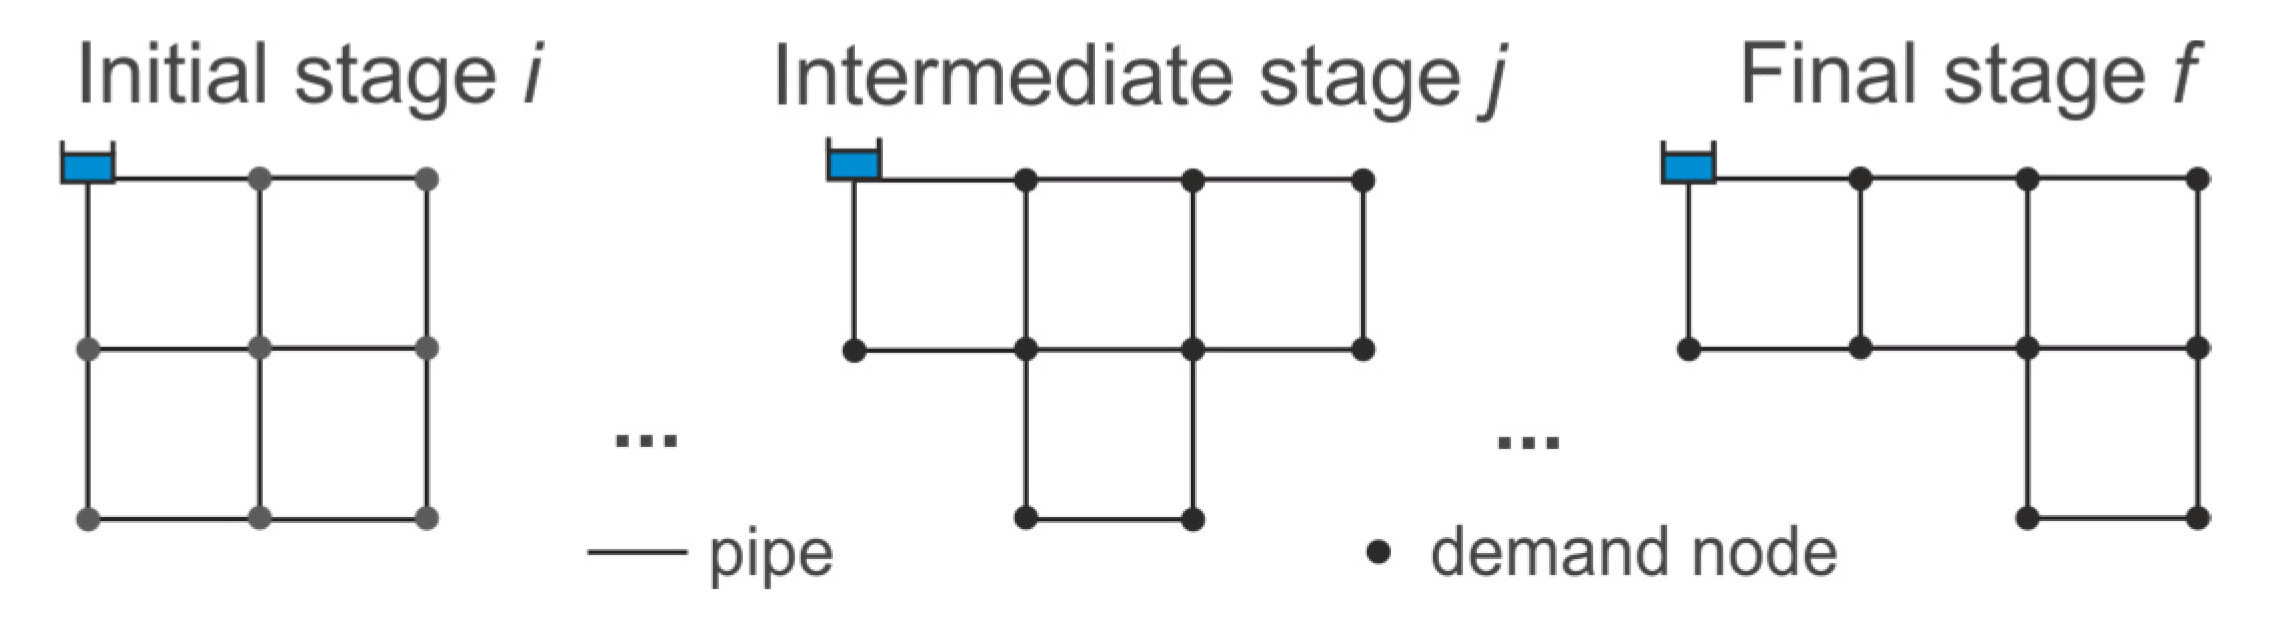
Task 2 presents the creation of transition stage models to describe the detailed step-by-step progress of construction and deconstruction phases on basis of the master plan. In doing so, specific points in time between initial stage
i and final stage
f, i.e., intermediate stages, are investigated.
Figure 4 shows an example of an intermediate stage
j where some parts of the initial WDS are disconnected, while other parts are added at the same time. Not only the pipe structure is changed, also a shifting of the nodal demand from the disconnected to the new connected WDS parts occurs. The transition stage models comprise the initial, intermediate and final stages of the WDS. The number of intermediate stages is a model input parameter and depends on the temporal definition within the master plan (e.g., phased construction and deconstruction zones of new building blocks).
The disconnection of pipes, along with a demand shifting, changes the flow pattern of the WDS but does not necessarily cause performance reductions. Possible examples are: (1) the disconnection of final branches or (2) the shifting of demand nodes towards the water source, which can even increase the WDS performance (e.g., minimum pressure). The zonal disconnection of pipes from the main WDS can cause an interruption (isolation) of certain areas from the water source. Such parts of the network are identified and must be removed or reconnected to the main WDS to ensure a hydraulic supply (Task 3). In the current work, the physical location and attributes of WDS components that are unaffected from the deconstruction and the construction processes are maintained over time, i.e., the intermediate and final-stage WDS are dependent on their previous transition stages and originate from the initial stage (network structure and pipe diameter). The scheduling of the determined pipe upgrades (|Pup|) to achieve high performances at final stage is part of a design strategy. In this work, we test a simple “doing-all-at-the-end” approach, where necessary pipe upgrades are performed at the final stages of the transition process.
In
Task 3, a model interface to a hydraulic solver is implemented where each transition stage model (see
Task 2) is simulated under different scenarios. In WDS modelling, it is state-of-the-art to use extended period simulations to consider the diurnal demand patterns of several representative days [
24]. In this work, the hydraulic solver EPANET 2 [
25] is used, where each transition stage model (
Task 2) is simulated under different scenarios. In a first simulation run, the system is solved for one day with high water consumption to identify supply problems. Then, the simulation is repeated for a period of low water usage (six consecutive days of low water consumption are simulated to determine maximum water age and potential stagnation problems). The water age is calculated from the residence time of the storage tank and the travel time in the network from the source node(s) to the demand nodes at low flow conditions. For this purpose, we used the water quality analysis tool of EPANET 2 [
25].
Task 4 describes the performance evaluation of the WDS. Helpful tools to assess hydraulic and quality requirements of WDSs are global performance indicators (
PIs). By definition, the
PIs take values in the interval from 0 (worst performance) to 1 (best performance), depending on predefined threshold values and a performance criterion. Furthermore, statistical values complement the investigation. First, the nodal performances
PIk are determined for each node
k before they are averaged and weighed to one global representative value
PI. For this study, we analyzed a minimum performance indicator at peak demand and the mean pressure head at average demand under normal operation conditions (e.g., no pipe breaks). The threshold values for
PIs differ among case studies and design guidelines of sufficient performance, and have a strong impact on the overall performance. Therefore, they must be defined by the user [
20]. The minimum pressure performance, including the selected threshold value in accordance with the Austrian Standard ÖNORM B2538 [
26], is defined as:
where
pk,min is the nodal pressure head in meters. Furthermore, the water quality of the WDS model is described by the maximum water age, which is a driving factor related to microorganism growth [
27]. The maximum nodal water age
wk,max in hours is calculated based on flow velocities and pipe lengths and assessed after a low demand period of 144 h and contains the initial water age from the storage tank. In this work, the nodal water age performance is defined as:
Additionally, the respective nodal performance indicators
’s are averaged and weighed with the nodal demand
dk to consider the hydraulic importance of node
k (e.g., number of supplied customers) as follows:
To quantify properties of robustness and fault tolerance in the system, a network capacity index
Ir is assessed [
28,
29]. The index is based on the power balance of the network and gives information about how much pressure surplus is available at each network node, compared to a minimum required head [
30]. The pressure surplus can be seen as a “buffer capacity” that can be used under critical operation conditions (e.g., pipe breaks), when the internal energy dissipation increases. The capacity index is assessed at peak demand and defined as follows:
where
PD =
is the dissipated power, and
PD,max =
describes the maximum dissipated power to meet the minimum head constraints
at node
i. For this case study, the minimum required nodal head
is adopted with the nodal elevation plus an additional pressure head of 15 metres at node
k.
Hs refers to the nodal head of supply source
s and ∆
Hj is the head loss along pipe
j. The inflow from source
s is described with
qs,
dk represents the nodal demand and
qj is the flow in pipe
j.
Nr,
Nn and
Np state the number of supply sources, nodes, and pipes, respectively. A more detailed description can be found in Di Nardo et al. [
31].
3. Case Study Application and Numeric Results
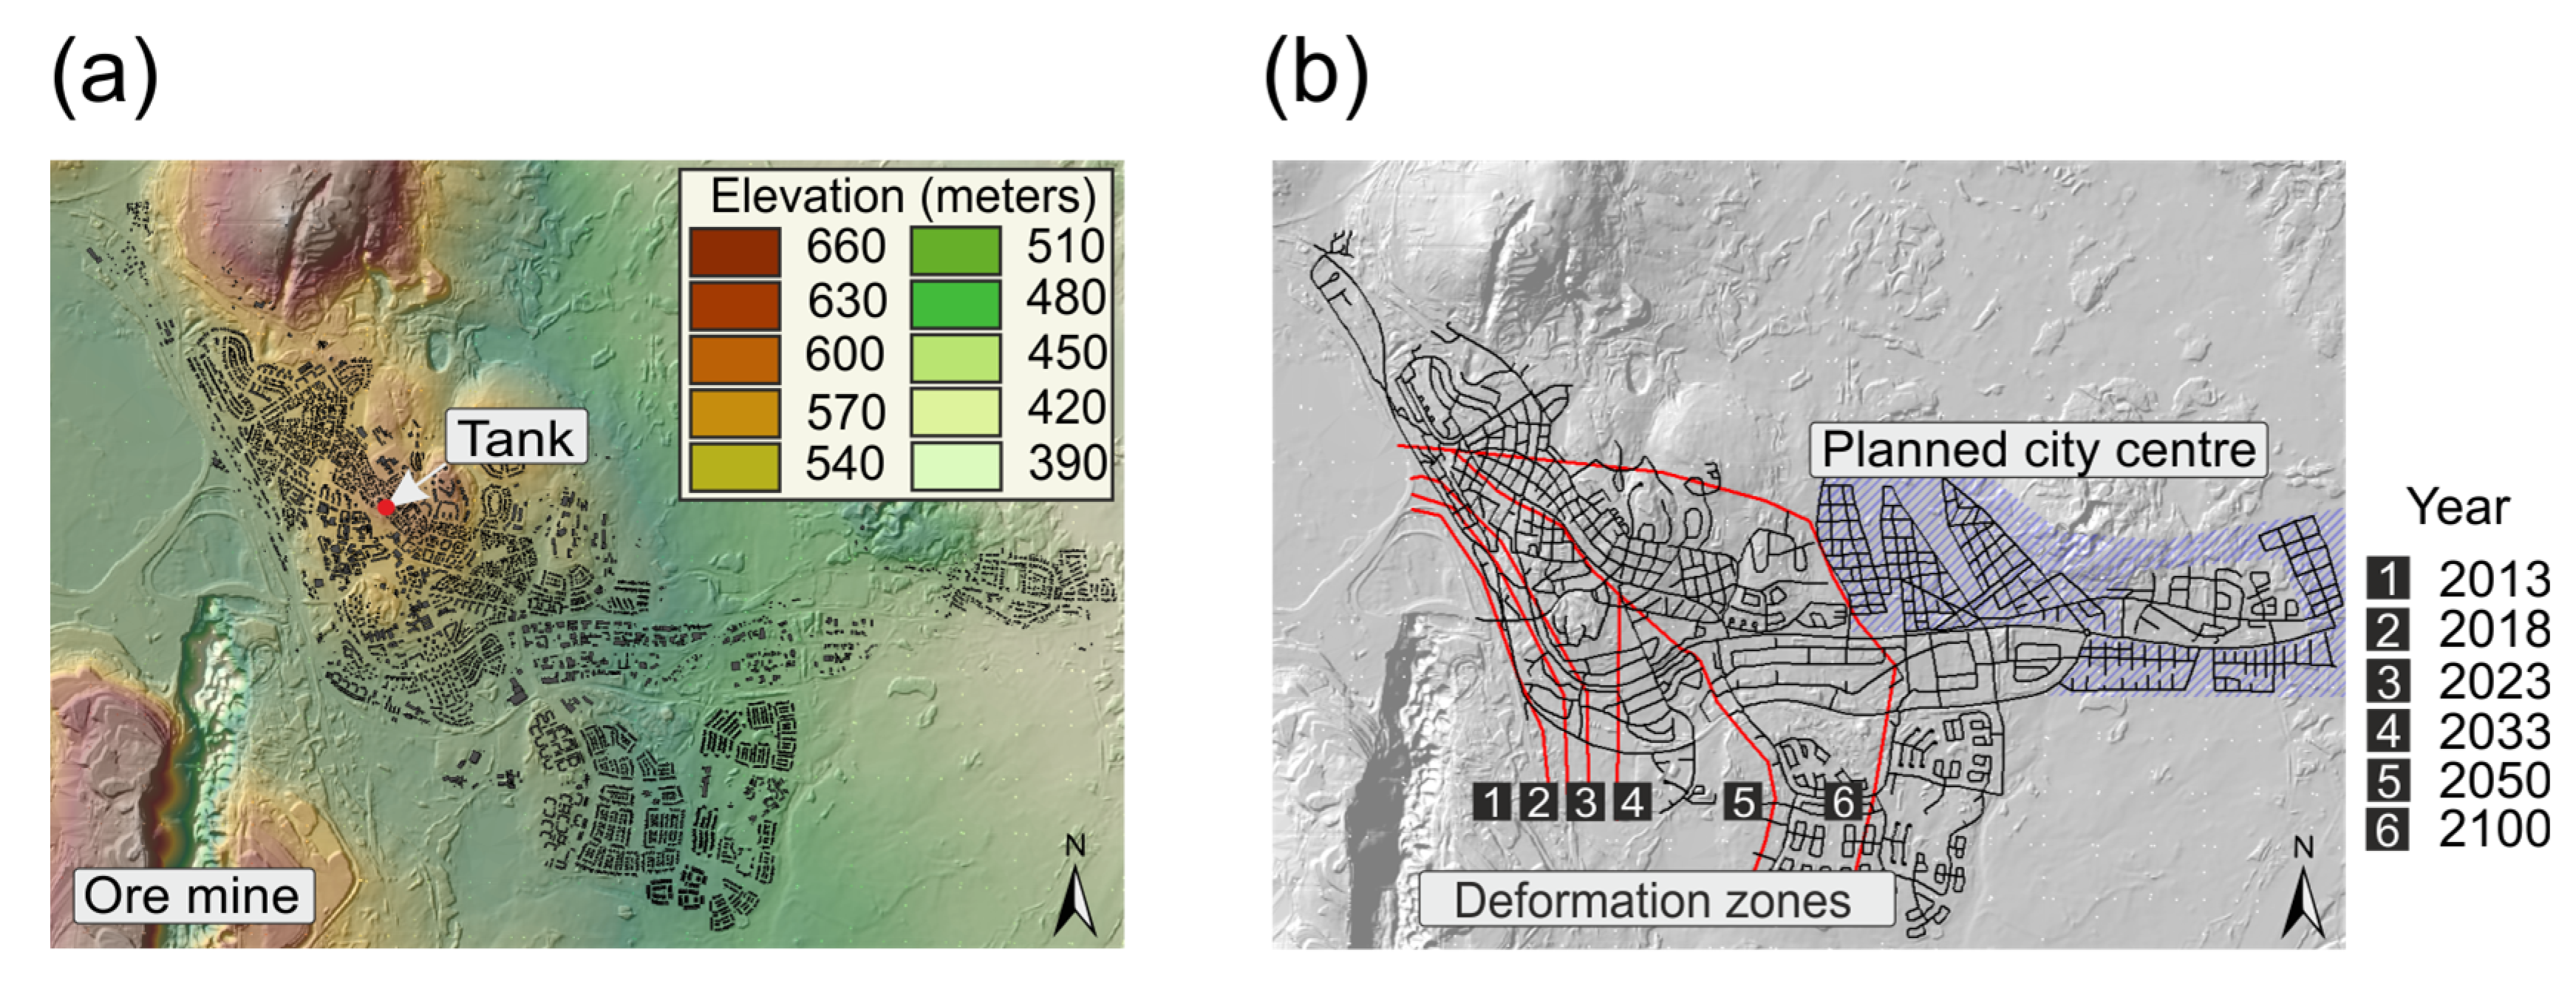
The developed methodology is applied to the city transition of Kiruna, where significant structural network changes are currently (and during the next decades) taking place, since the city has to make way for an underground expanding ore mine. Kiruna, a small city with about 20,000 inhabitants, is the northernmost city in Sweden and became one of the major centres of the mining industry due to iron ore extraction. As can be seen from
Figure 5a, in the southwestern area of the town, the world’s largest underground iron ore mine is located and operated. Due to expanding excavations, however, current parts of town and its water infrastructure are threatened by subsidence and erosion. Nevertheless, mining activities will continue. Therefore, a master plan was developed by decision makers (Kiruna municipality, mining company LKAB and architects White), which provides a step-by-step resettlement of the inhabitants living in defined deformation zones (red lines in
Figure 5b) to a newly built city centre about 4 km eastward (see
Figure 5b). The transition process is expected to be completed by the end of this century [
32].
In the city’s master plan, the structural changes of the city are very certain but no specific planning options for the WDS transition are defined, and therefore this case study is well suited to present the developed methodology. As a result, statements about the WDS efficiency and performance trends during this long-term transition process from the initial stage in 2012 to the final stage in 2100 are possible and many future WDS structures and scenarios are tested and investigated for strengths and weaknesses.
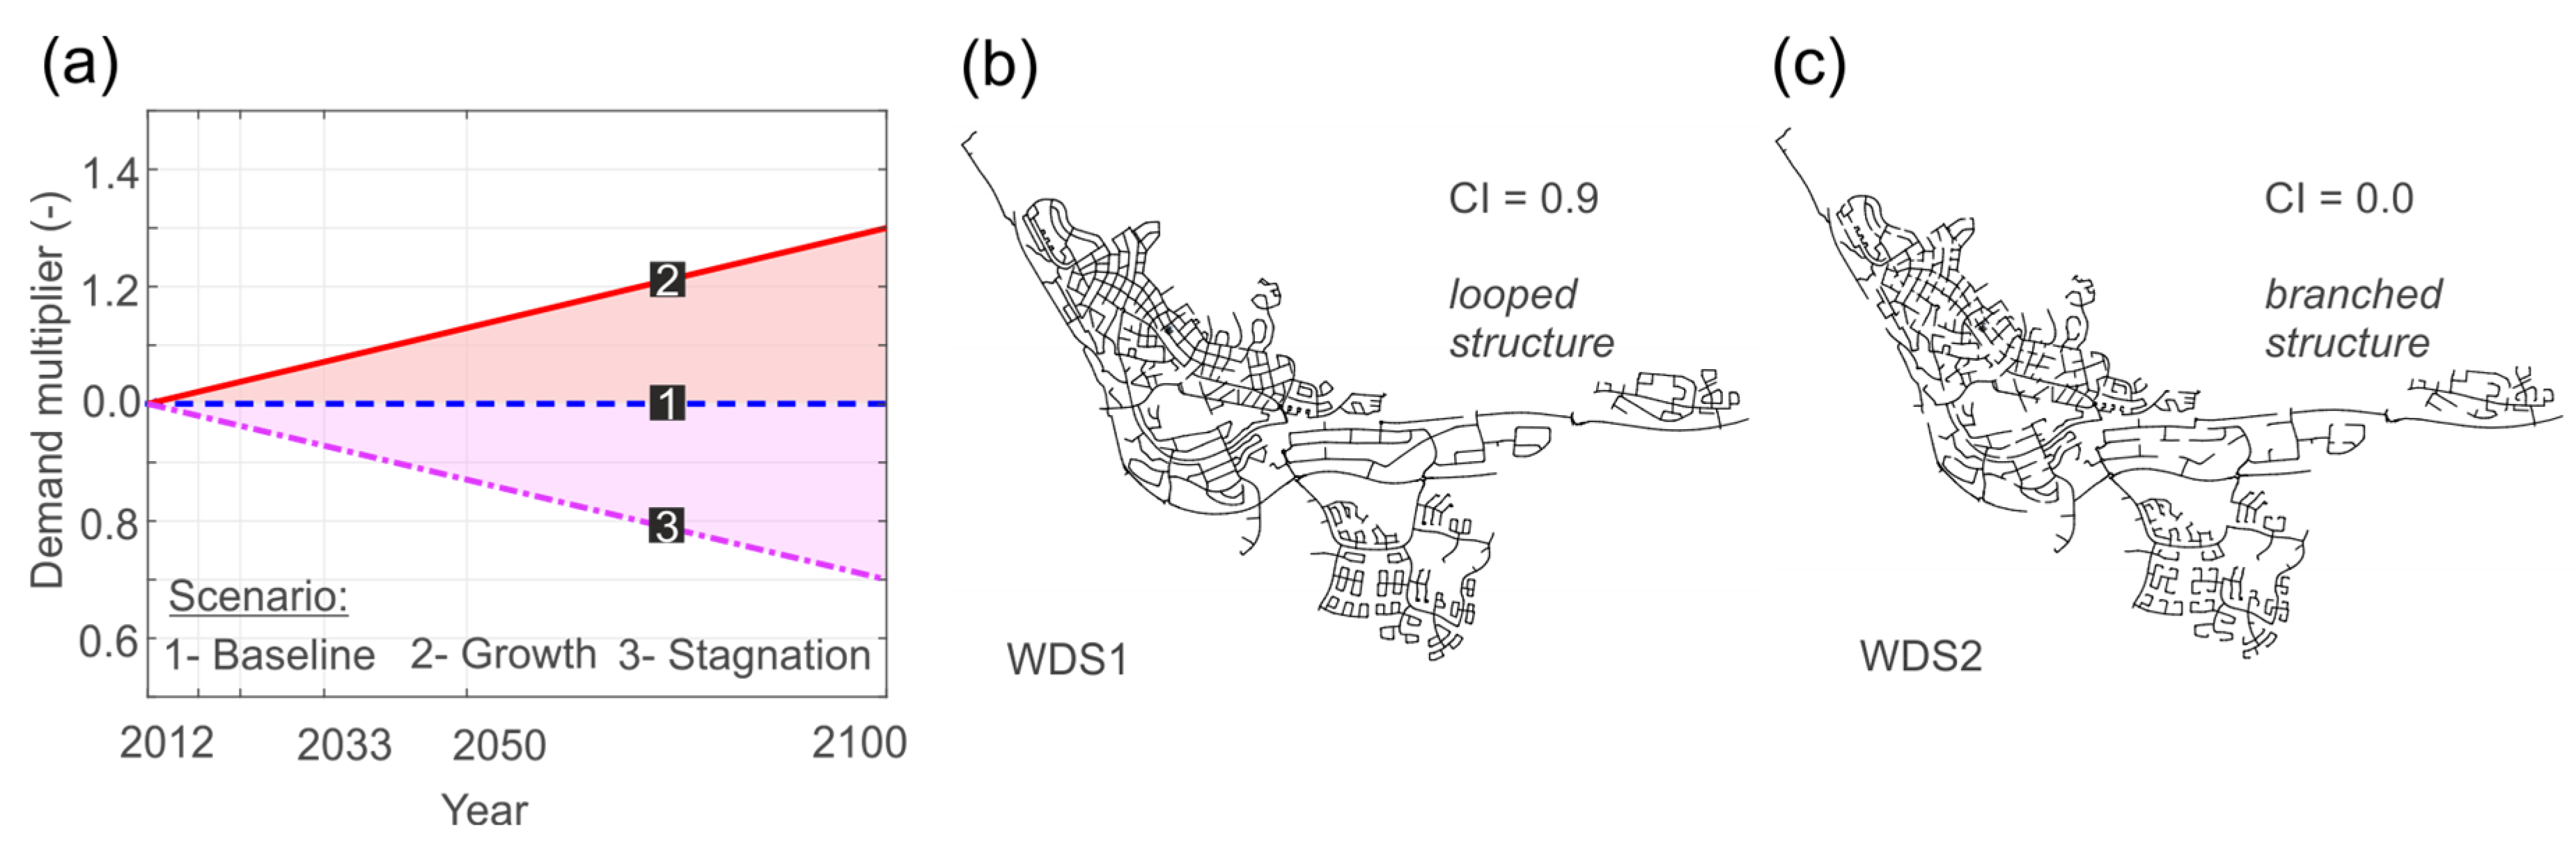
To deal with the demand uncertainties, three simplified scenarios based on different future developments of water consumption are examined as follows (see
Figure 6a):
The basic assumption for the scenario “Baseline” is that the total demand remains constant within the transition period. It represents no change in population but a change of its location (Qh,max,2100 = 128 L/s).
The scenario “Growth” implies a linear increase of water usage of 30 percent until the end of the century [
33]. This represents a population or demand per capita growth (
Qh,max,2100 = 166 L/s).
The scenario “Stagnation” describes an economic decay, where migration of labour occurs due to an assumed reduction of mining activities [
33]. The water demand is taken to gradually decrease by 30 percent until 2100 (
Qh,max,2100 = 90 L/s).
In the context of network structure uncertainty, 30 possible WDSs (planning options) with different properties are automatically created by the variation of the cycle index (CI), which defines the degree of alternative flow paths [
14]. Two possible planning options with looped and branched WDS structure, generated on basis of the street network, are illustrated in
Figure 6b,c.
There are restrictions on the hydraulic modelling data of Kiruna’s actual WDS and, as such, are not allowed to be published. Nevertheless, with the proposed method each stage of the WDS can and has been approximated by a set of stochastic generated WDSs, based on freely available real street network data (see Modelling framework: Task 1). This gives the opportunity to apply and test the approach also to variety of initial WDS structures. However, more detailed and complementary information (e.g., actual WDS) can easily be integrated, if available, and allowed in terms of legal aspects.
Task 1 describes the creation of the WDS model set. For this application the required input data are the digital elevation map (DEM) of the town, the position of the current and future water sources, and the real street networks for the initial (year 2012) and final stages (year 2100). The future street network data is taken from architecture plans. Due to the data restrictions, the population density and nodal demand distribution are assumed to be uniform over the area of interest with 1,000 implemented demand points. Elevation differences in the investigation area allow for the construction of a functioning gravity driven WDS and hence, no pumping is required (see
Figure 5a). The generated WDS includes the positions of the reservoir, tank and pressure reduction valves (PRVs) and flow control valves (FCVs). The locations of the valves within the 30 stochastic WDS structures are unchanged. The FCVs are positioned between reservoir and tank, while the locations of the PRVs are chosen based on minimum and maximum pressure head requirements (30–100 m) within each pressure zone. Regarding the size of the generated networks, they consist of approximately 100 km pipe length (~4000 pipes) at the initial stage and about 75 km (~2000 pipes) at the final stage. This shows that the future network is planned to be denser as compared to the existing one at all demand projections.
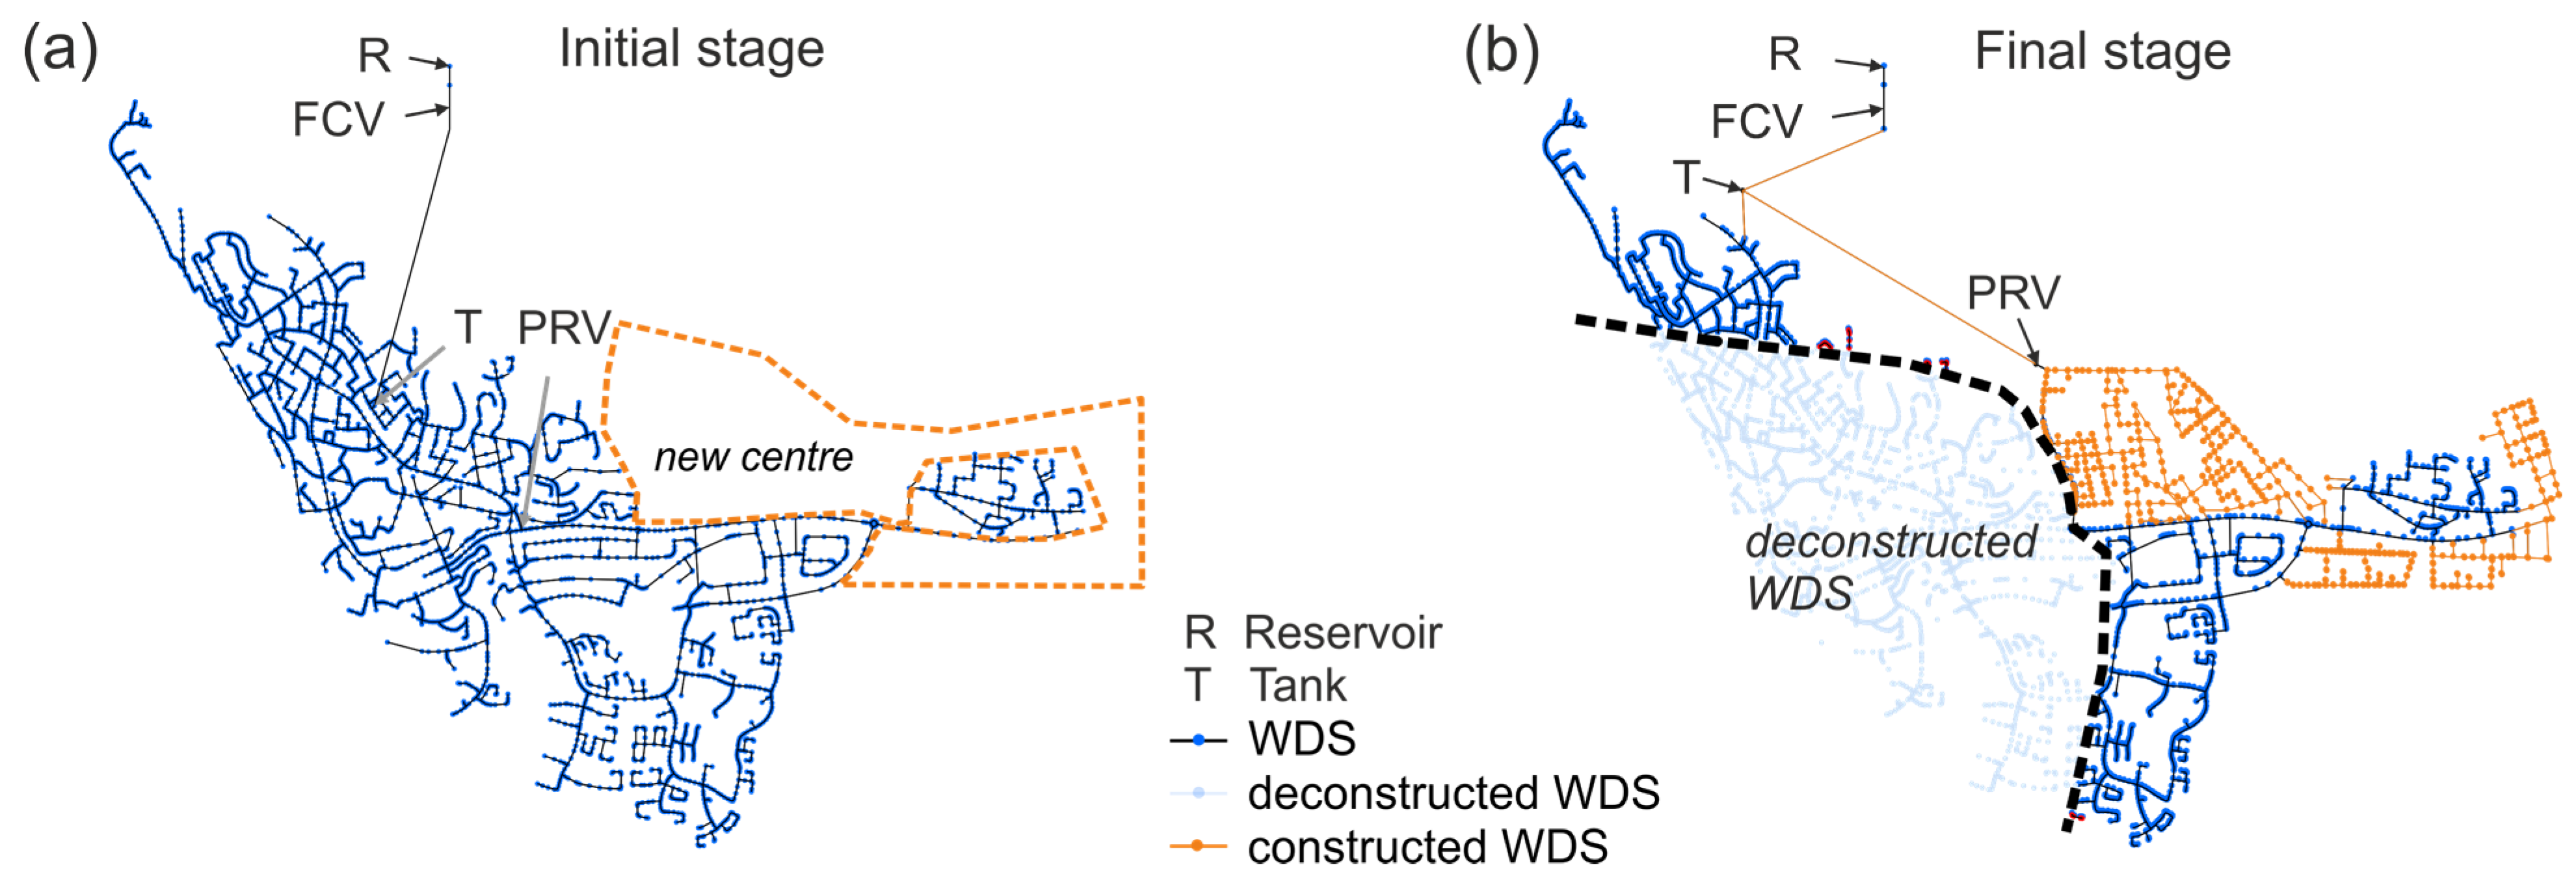
Figure 7 illustrates one of the thirty generated planning option of the WDS (different network structure) at the initial stage (year 2012) and the final stage (year 2100). When comparing the initial and final-stage WDS, not only a huge change in the pipe network can be observed, but also the water tank of the initial stage is situated in the deformation zone 2100 and thus has to be relocated. Additionally, two new main pipes from the new tank to the separated networks and a new position of the PRV are necessary (see
Figure 7b). According to the Austrian Standard ÖNORM B2538 [
26], additional loads for firefighting can be neglected in the design process due to the size of the supply zone (population ≥ 20,000). The intersection of the pipe sets |
Pi| ∩ |
Pf| is about half the size of |
Pi|, which implies that 50% of pipes at the initial stage WDS keep their physical location in the final-stage WDS. Therefrom approximately 10% of the pipe diameters have to be upgraded due to changing flow conditions and to maintain a connected network (e.g., new water source). This builds the pipe set describing necessary upgrades (|
Pup|).
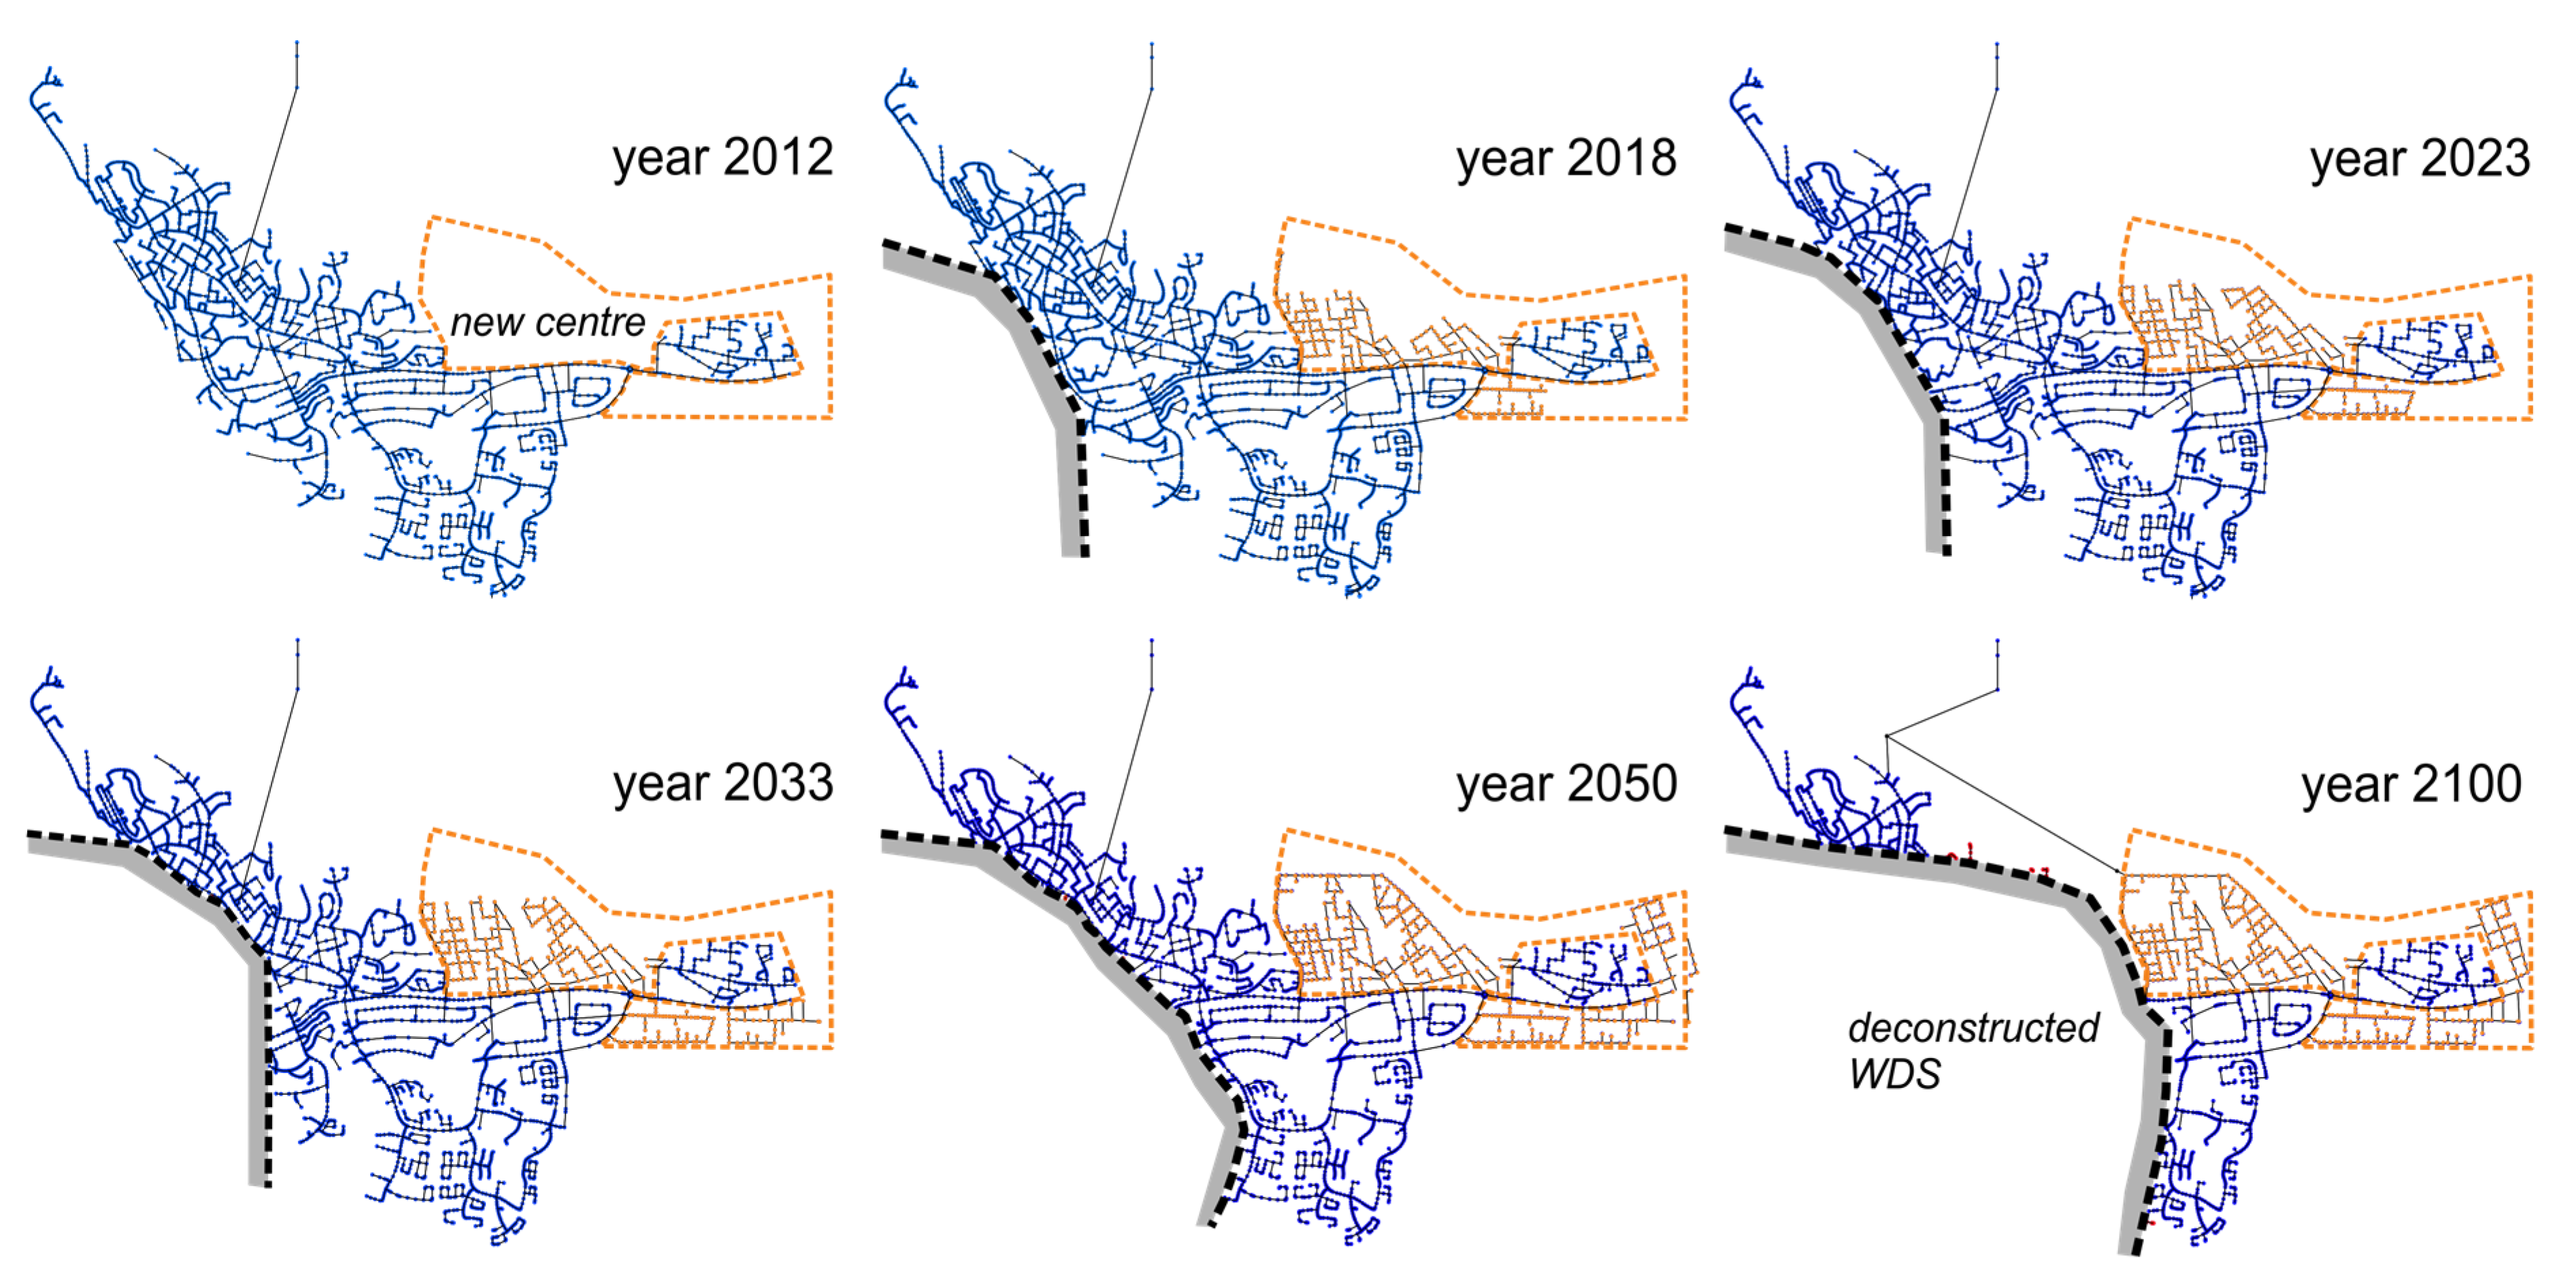
Task 2 describes the generation of the transition stage models. For this purpose, the master plan defining the phased transition process of the town is used. The transition stages represent the years 2012, 2013, 2018, 2023, 2033, 2050 and 2100.
Figure 8 presents an example of the creation of six transition stage models for one planning option. It can be seen that the town is step-by-step moved by a simultaneous deconstruction of the initial WDS and construction of a new piping system. The resettlement progress of people living in the deformation zones is modelled by transferring the demand nodes to the new city centre, assuming the same uniform spatial distribution as for the final design stage. The total demand is dependent on the investigated scenario.
Based on the determined set of necessary pipe upgrades (|Pup|) from initial and final network design (see Task 1), a simple “doing-all-at-the-end” approach is investigated: Pipe upgrades for achieving the efficient final-stage WDS are performed at the stages in 2050 (pipe replacement rate on average 2%) and the final stage 2100 (pipe replacement rate on average 8%). This means that until stage 2050, the pipe diameters of the WDS remain unchanged, while all of the newly constructed pipes are designed for the final stage. With this approach it can be determined, (a) whether the WDS can tolerate the occurring changes or not, and (b) at which transition stage additional redesign (e.g., pipe replacements) might be necessary for the 3 scenarios and the 30 planning options.
The transition stage models are automatically generated for each of the 30 network structures (planning options). Altogether, for the case study analysis 1260 WDSs are created and simulated, containing 30 variations of network structure, each evaluated for 7 stages, under 2 hydraulic loads (high and low daily demand) and 3 future demand scenarios (constant demand and demand increase/decrease).
Tasks 3 and
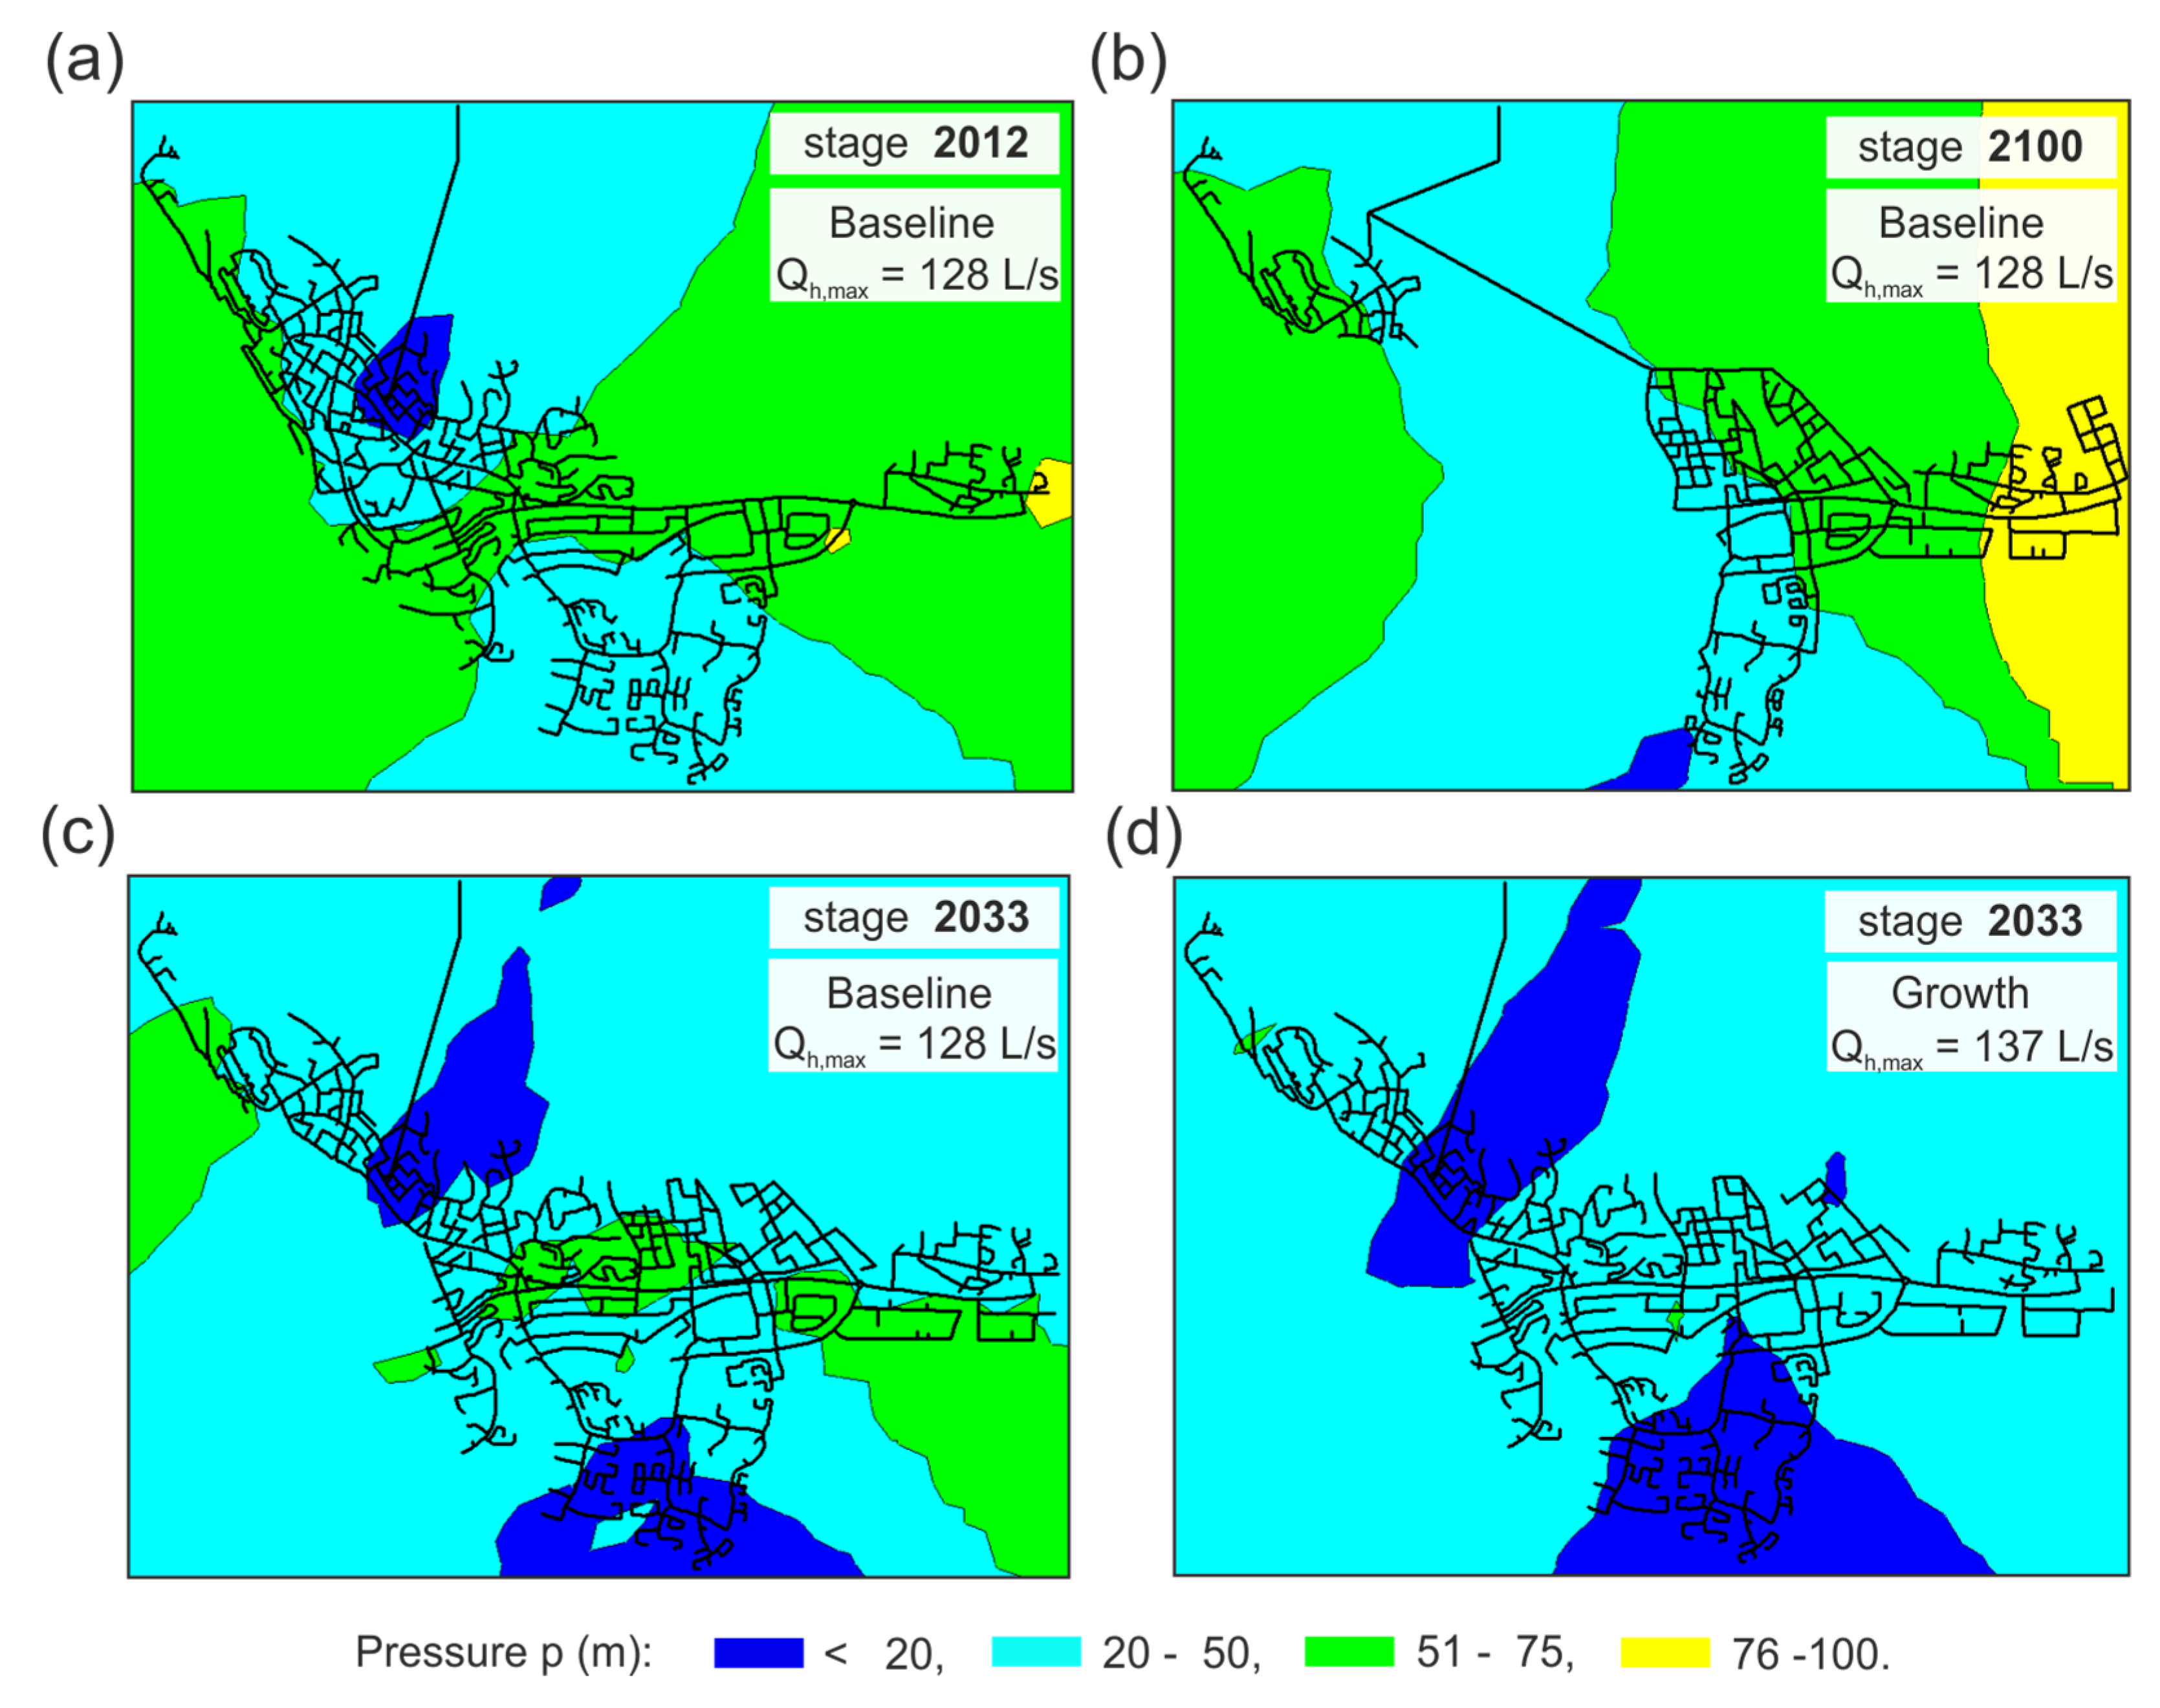
4 present the hydraulic simulations and the performance evaluations of the WDSs. The application of the developed approach is shown with the outcome of the performance analysis during the WDS transition of Kiruna as a model. In
Figure 9, we firstly show example contour plots of the pressure distributions at peak demand for three different stages (2012, 2033 & 2100) and two scenarios (Baseline & Growth).
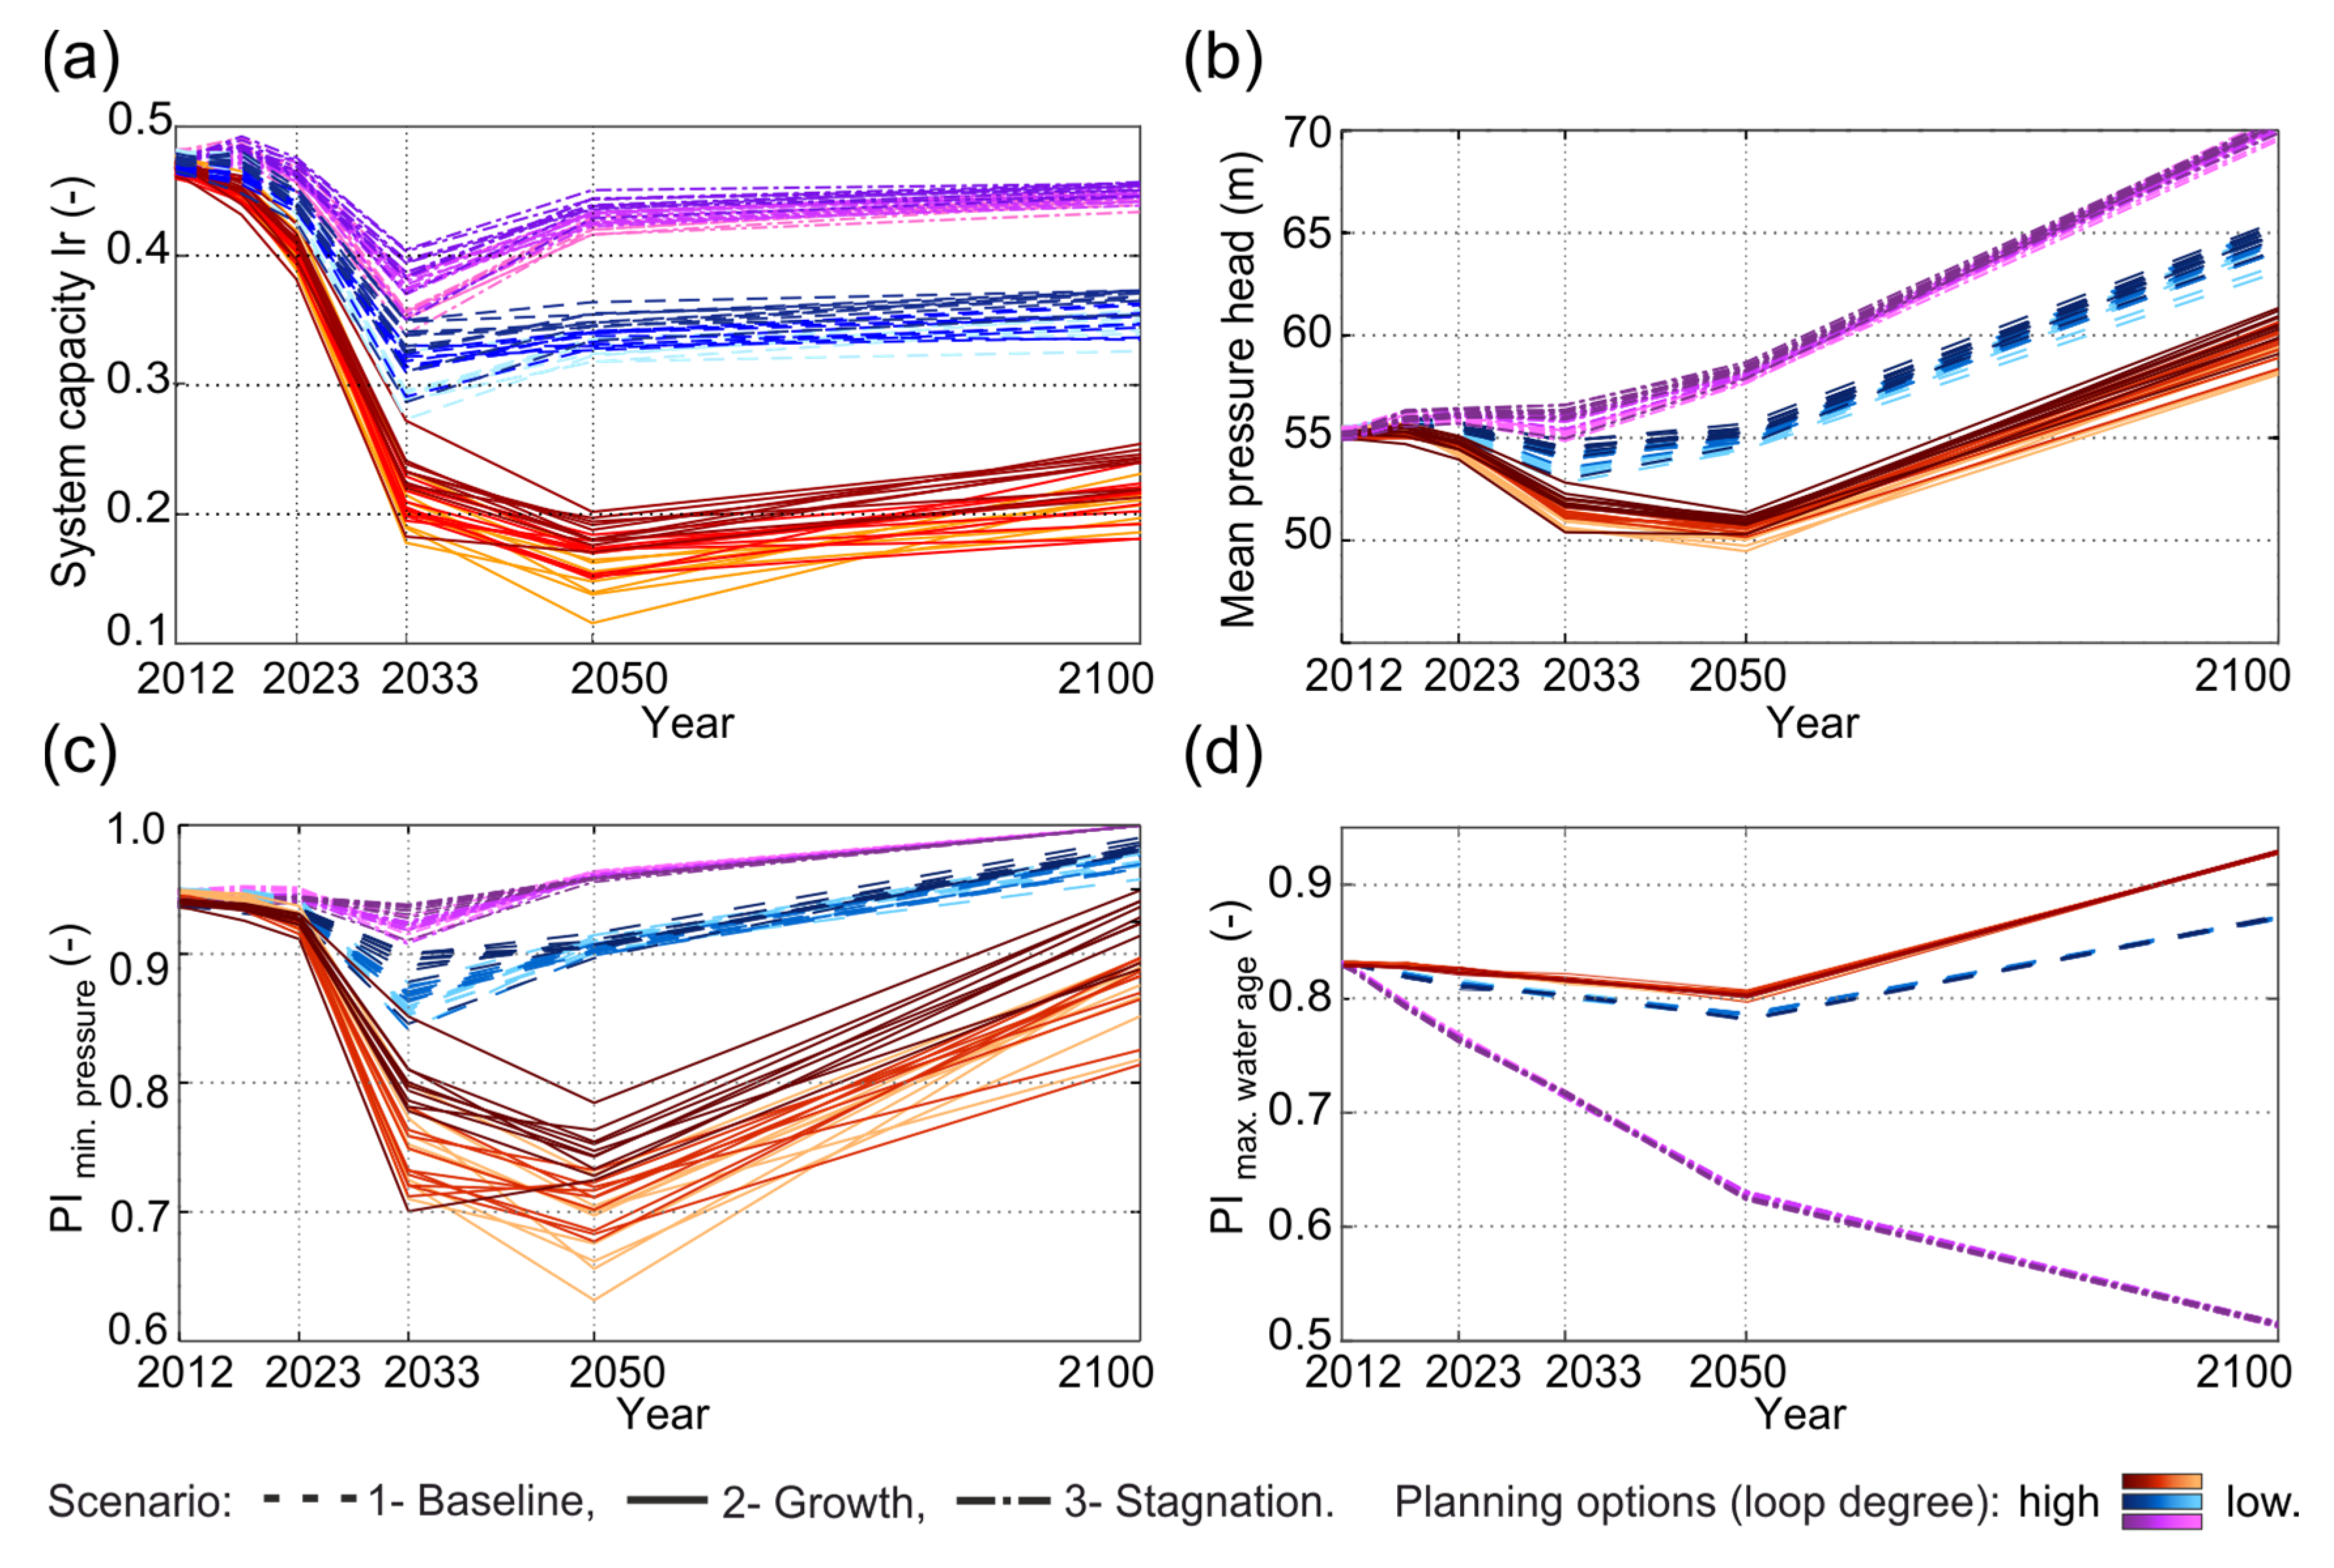
In
Figure 10 the findings of three performance indicators (PIs of system capacity, minimum pressure and water age) and one statistical value (mean pressure) are presented for all WDS stages. Therein a bandwidth of performance developments for the 30 planning options (possible WDS structures) is shown for the three scenarios. While the scenario “Baseline” is plotted in dashed lines, the scenario “Growth” is represented by continuous lines. The scenario “Stagnation” is illustrated by dot-dashed lines.
The three main findings of the WDS transition for the case-study application are discussed in the following: First, the performance drops are highly correlated with the future water consumption. The scenario of a linear increase in water consumption reveals lower network performances than the assumption of decreasing water consumption, with the exception of water age where the opposite behaviour is observed. Sufficient minimum pressure performances can only be guaranteed for scenario “Stagnation” (demand reduction) and utilizing the pressure surplus (“buffer capacity”) of the WDS (see drop of capacity index). However, problems with water age occur for this scenario. For scenario “Baseline” and scenario “Growth”, the capacity of the (remaining) WDS parts is not high enough to cope with the structural (“loss of capacity”) and demographic (“increase demand”) changes after stage 2023, while guaranteeing sufficient minimum pressure heads. The performance improvement at the final stage is due to the pipe upgrades (10% percent pipe replacement, see Task 1).
Second, influences of the 30 planning options with different network structure (degree of loops) on the system performances are proven (light shading in
Figure 10 indicates a low loop degree and dark shading a high loop degree). Especially the performances of minimum pressure and system capacity are favoured by a higher loop degree. The drops in system capacity, indicating a stronger usage of additional pressure surplus, are lower for highly looped networks due to more alternative flow paths. The WDS with the best performances is identified to be one of the highly looped planning options. However, not every highly looped planning option revealed higher performances (e.g., see crossing lines with different shading in
Figure 10), but in terms of robustness and redundancy, a higher degree of loops is advisable when facing structural and demand uncertainties.
Third, critical points are identified during the WDS transition. The first four stages of the transition processes, reveal only slight changes in the WDS performances. Up to year 2023, the changing flow patterns are compensated by the WDS. However, after year 2023, partially inefficient WDSs occur. The performance drops at the stages 2033 and 2050 are related to a severe “loss of capacity” within the remaining WDS. This outcome demonstrates that the sole “single-stage-design” of the final-stage WDS (including the “doing-all-at-the-end” pipe upgrades) is insufficient. Owing to the network deconstruction, pipes that are already disconnected at final stage f (|Pi|\|Pf|), must be redesigned at the intermediate stages 2033 and 2050 to maintain acceptable service pressures.
4. Discussion
The aim of this work is to provide a performance assessment tool assisting decision makers during long term network transitions processes of WDSs over time and to determine the sensitivity of different future uncertainties, like demographic changes, network structure uncertainties and shifting network layout (e.g., WDS expansion). The proposed approach aims to tackle the entire complexity of the stated problem with the implication, that for some specific details, assumptions and simplifications are necessary. Once successfully setup, in future studies, analyzes focusing on detailed questions (e.g., redesign and rehabilitation of the existing WDS) will be addressed.
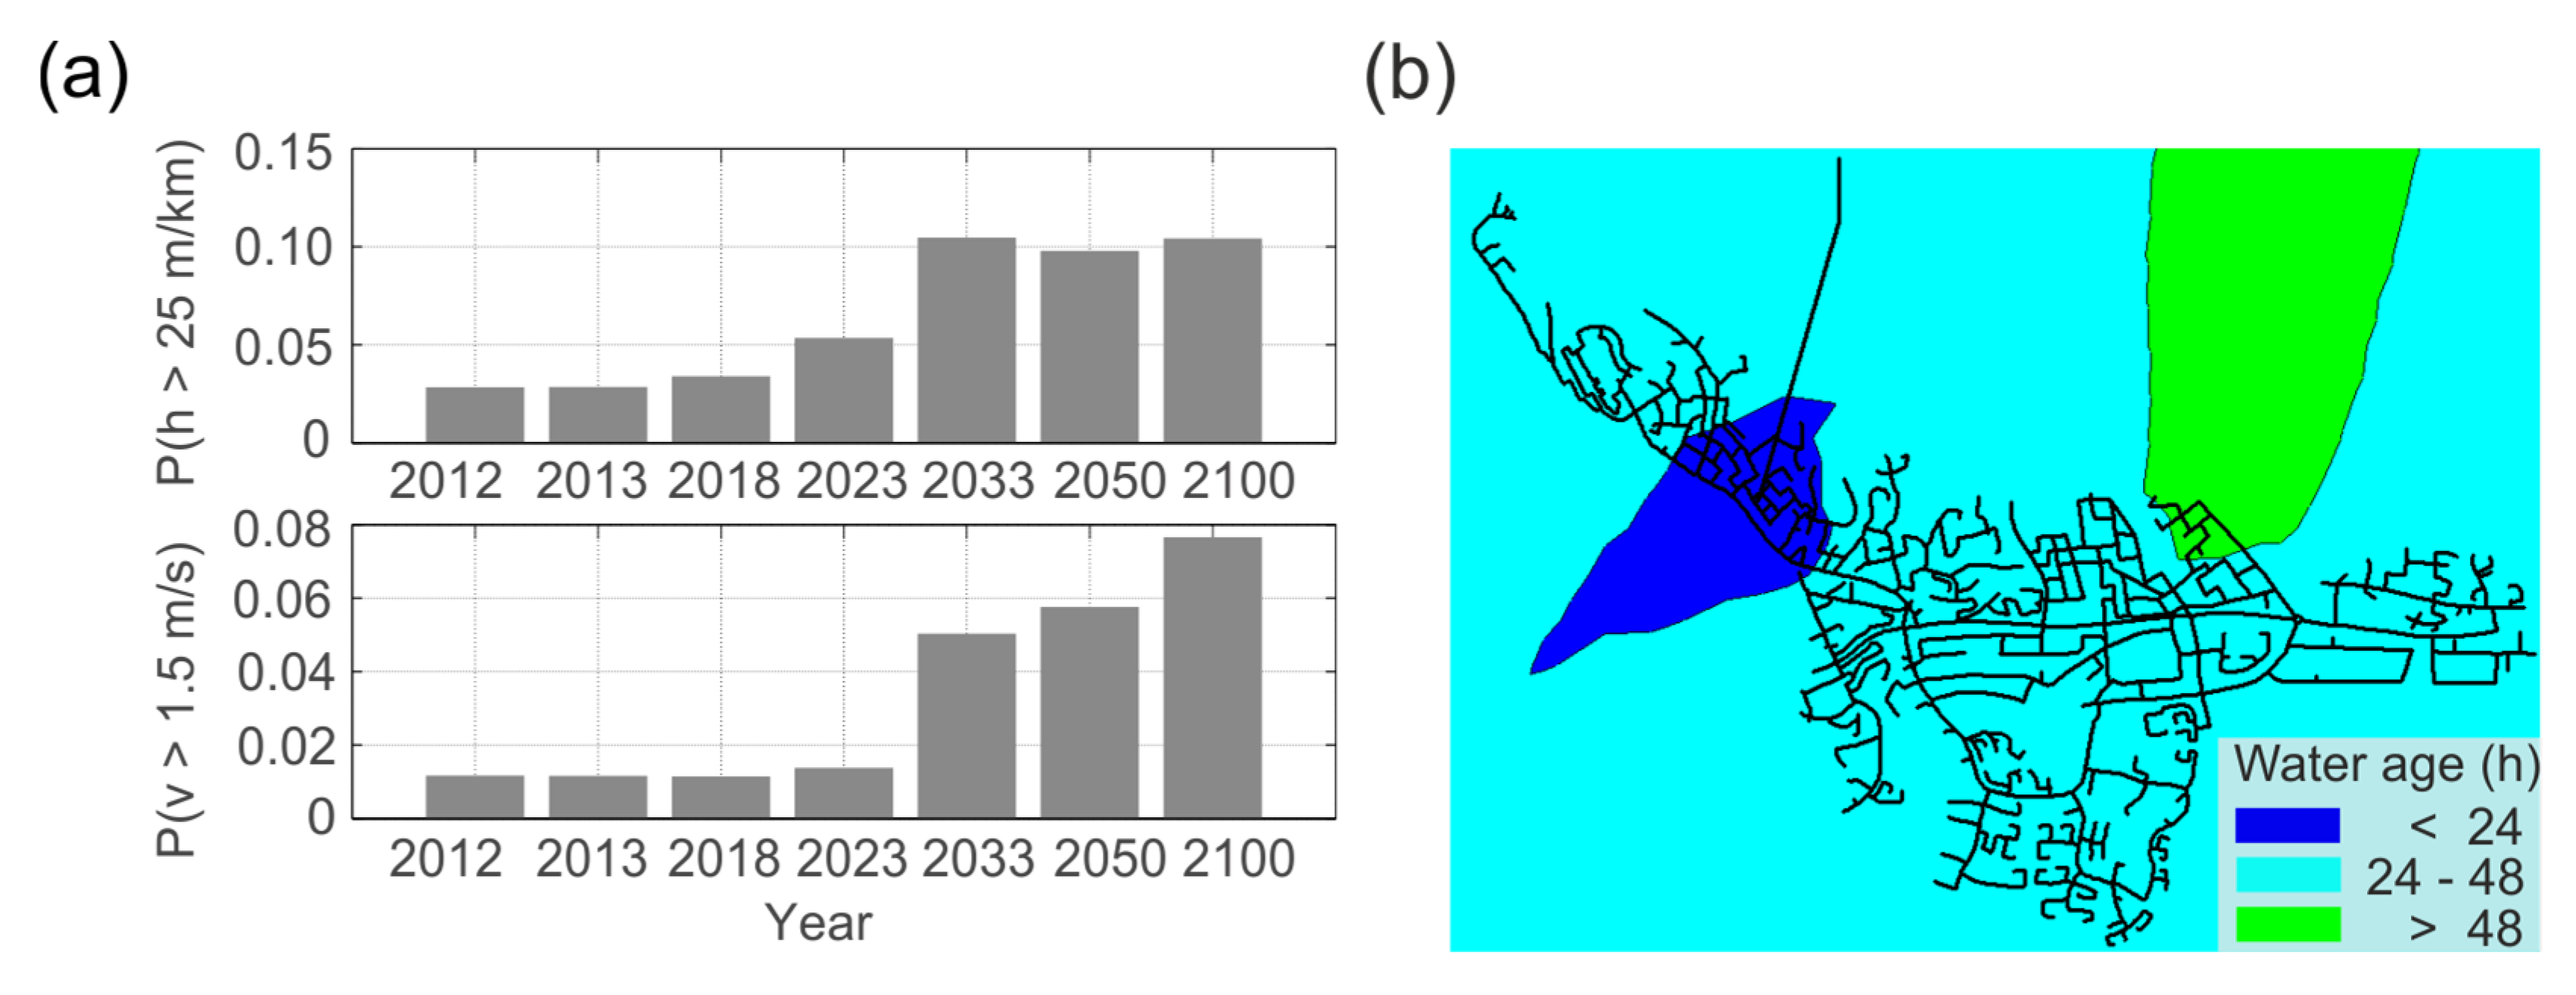
Based on that approach different design strategies can be tested. This work provides a helpful approach to identify critical stages (time points) and locations (weak points) during the WDS transitioning. Weak points are pipes whose diameters become inappropriate due to the changing flow patterns that originate from pipe disconnections, shifting demand nodes and total future water consumptions. Indicators for inefficient pipe diameters are high flow velocities
v and high unit head losses
h.
Figure 11a presents the pipe velocities and unit head losses (both length-weighted) for the case study application at stage 2033 and for scenario “Growth”. The network deconstruction at that stage causes a “loss of capacity” and therefore increased velocities and unit head losses in specific pipes. Exemplarily, a velocity threshold of 1.5 m/s is exceeded in about 5% of the pipes at stage 2033. These identified weak points have to be addressed when redesigning the WDS. Problems related to water age are marginal for the first two scenarios and occur mainly in parts of the new city centre, where the design capacity of some pipes is not reached at all stages. However, by neglecting the initial water age from the tank (e.g., due to operational measures), the mean water network travel time is below 24 h for scenario “Baseline” and scenario “Growth” at all of the stages of the WDS transition. In
Figure 11b the maximum water age distribution at stage 2033 and scenario “Baseline” after an extended period simulation is presented. It can be seen that the water age is below 48 h for most junctions (including the initial tank water age of 19 h) and only minor parts of the new city centre show values above 48 h. In the literature, average WDS retention times are between 12 and 24 h for cities of a similar size [
34]. However, a future demand reduction all over the city (see scenario “Stagnation”) reduces the water age performance. In this case additional operational measures, like regular pipe flushing, would be necessary.
The case study application showed that up to stage 2033 sufficient hydraulic and quality requirements are guaranteed under all structural and demand uncertainties. Due to the “final-stage-design” also the performances at the final stage are sufficient (with the exception of water age under total demand decrease scenario). To improve the minimum pressure performance at the intermediate stages 2033 and 2050 (for constant demand and demand increase), other design strategies will be pursued in further investigations: (1) anticipated pipe replacements, rather than “doing-all-at-the-end” upgrades of the identified pipe upgrades |Pup|, and/or (2) network redesign of overloaded WDS components that are already deconstructed at the final-stage WDS (|Pi|\|Pf|). Future work will also address the integration of the real WDS in the network generation procedure.
5. Conclusions
In this work, a novel modelling approach was presented to assess the performance of structural and functional long-term WDS transitions, e.g., network displacement and population growth. All these changing boundary conditions were applied to a set of automatically created planning options with different network structure. The main advantages of the method are the automated creation of hydraulic models at different points in time during the WDS transition (stages), the low computational costs and the applicability of the method to a variety of WDSs, representing different planning options. With the method different scenarios can be tested (e.g., network displacement and population growth) and critical time points determined, where predefined performance criteria cannot be guaranteed anymore.
The benefit of the methodology is the fast generation of WDS stages based on surrogate information such as the street network and the city’s master plan. The methodology can handle a different degree of information content; known information of the WDS (e.g., physical location and attributes of pipes, demand distribution) can easily be considered as “fixed” parameters in the WDS generation, while all unknown information is supplemented by stochastic approximations (e.g., expanding WDS structure on basis of future street network and/or random demand distributions). As a result, different planning options are put under stress and evaluated with performance indicators.
As a case study, the city of Kiruna is used where a city expansion and a step-by-step destruction (causing the relocation of people) take place at the same time. The proposed approach was applied to identify critical points in space and time, and to assist decision makers in such a city (and infrastructure) transition. For the model application to the case study of Kiruna, several stresses were applied to the WDS at different points in time on basis of the city’s master plan, including the simultaneous network disconnection and new connection, shifting demand nodes and different future demand developments. The performance drops after transition stage 2023, showed that the approach of the “doing-all-at-the-end” pipe upgrades on the basis of the sufficiently working initial and final-stage WDS (|Pi| ∩ |Pf|) was insufficient. The performance drops revealed that the pressure surplus (quantified by the capacity index) of the remaining WDS after a major disconnection was not high enough to cope with the occurring changes (“loss of capacity”). At the stages of year 2033 and 2050, an improved design strategy with additional pipe redesign in the pipe set (|Pi|\|Pf|) must be performed for the future scenarios of constant demand and demand increase (e.g., population growth).


