Ranking of Storm Water Harvesting Sites Using Heuristic and Non-Heuristic Weighing Approaches


Abstract
:1. Introduction
2. Methodology
2.1. Identification and Evaluation of Screening Parameters
- (i)
- Identification of hot spots,
- (ii)
- Estimation of runoff,
- (iii)
- Estimation of demand,
- (iv)
- Weighted demand distance.
2.2. Normalization to a Common Scale
2.3. Determination of Weights
2.3.1. Saaty Heuristic Approach
2.3.2. Non-Heuristic Approaches
Principal Component Analysis (PCA) Method
Entropy Weight Method
3. Case Study Application and Results
3.1. Application of Methodology to Melbourne City
3.1.1. Saaty Heuristic Approach
3.1.2. Non-Heuristic Method
Sites Ranked According to the PCA Method
Sites Ranked According to Entropy Weight Method
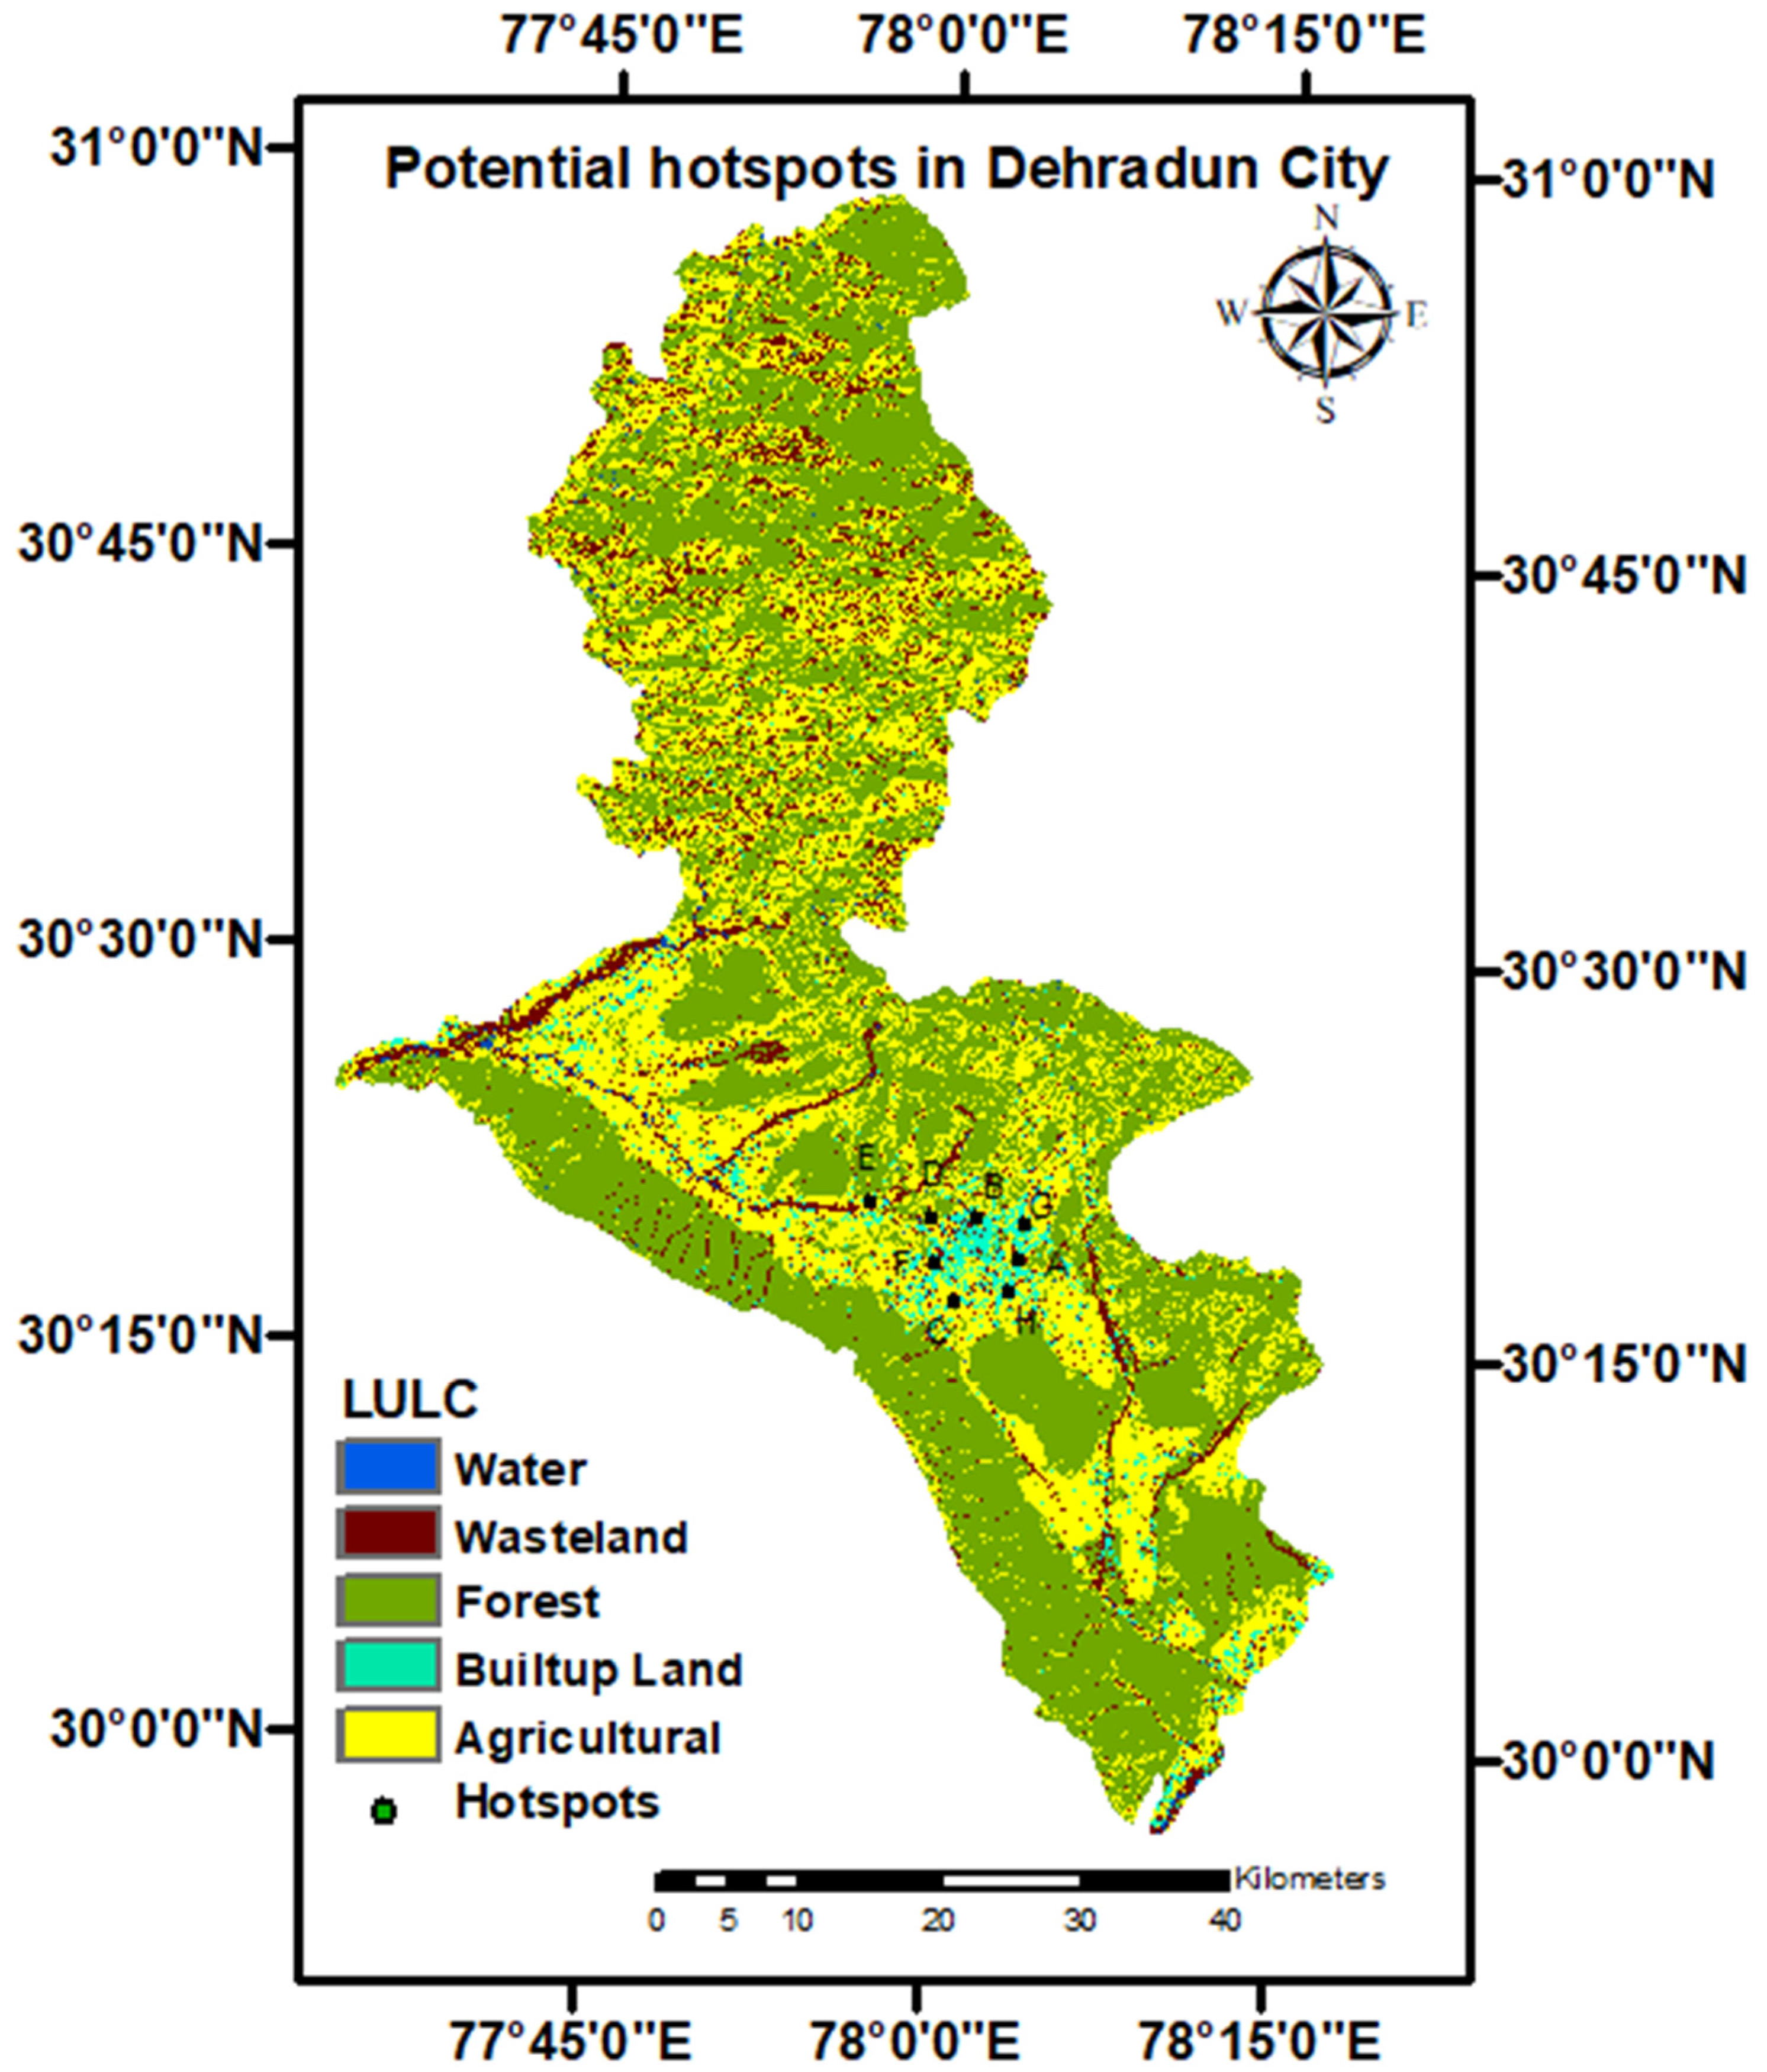
3.2. Application of Methodology to Dehradun city
3.2.1. Saaty Heuristic Approach
3.2.2. Non-Heuristic Method
Sites Ranked According to the PCA Method
Sites Ranked According to Entropy Weight Method
4. Discussion
5. Conclusions
Acknowledgments
Author Contributions
Conflicts of Interest
References
- Brown, R. Impediments to integrated urban stormwater management: The need for institutional reform. Environ. Manag. 2005, 36, 455–468. [Google Scholar] [CrossRef] [PubMed]
- Sörensen, J.; Persson, A.; Sternudd, C.; Aspegren, H.; Nilsson, J.; Nordström, J.; Larsson, R. Re-Thinking Urban Flood Management—Time for a Regime Shift. Water 2016, 8, 332. [Google Scholar] [CrossRef]
- Hamdan, S.M. A literature based study of stormwater harvesting as a new water resource. Water Sci. Technol. 2009, 60, 1327–1339. [Google Scholar] [CrossRef] [PubMed]
- Hatt, B.E.; Deletic, A.; Fletcher, T.D. Integrated treatment and recycling of stormwater: A review of Australian practice. J. Environ. Manag. 2006, 79, 102–113. [Google Scholar] [CrossRef] [PubMed]
- Akram, F.; Rasul, M.G.; Khan, M.M.K.; Amir, M.S.I. A Review on Stormwater Harvesting and Reuse. World Academy of Science, Engineering and Technology. Int. J. Environ. Chem. Ecol. Geol. Geophys. Eng. 2014, 8, 188–197. [Google Scholar]
- Goonrey, C.M.; Perera, B.J.C.; Lechte, P.; Maheepala, S.; Mitchell, V.G. A technical decision-making framework: Stormwater as an alternative supply source. Urban Water J. 2009, 6, 417–429. [Google Scholar] [CrossRef]
- Plappally, A.K.; Lienhard, V.J.J. Energy requirement for water production, treatment, end use, reclamation, and disposal. Renew. Sustain. Energy Rev. 2012, 16, 4818–4848. [Google Scholar] [CrossRef]
- Jato-Espino, D.; Sillanpää, N.; Charlesworth, S.M.; Andrés-Doménech, I. Coupling GIS with Stormwater Modelling for the Location Prioritization and Hydrological Simulation of Permeable Pavements in Urban Catchments. Water 2016, 8, 451. [Google Scholar] [CrossRef]
- Kumar, M.; Agarwal, A.; Bali, R. Delineation of potential sites for water harvesting structures using remote sensing and GIS. J. Indian Soc. Remote Sens. 2008, 36, 323–334. [Google Scholar] [CrossRef]
- Singh, J.; Singh, D.; Litoria, P. Selection of suitable sites for water harvesting structures in Soankhad watershed, Punjab using remote sensing and geographical information system (RS and GIS) approach- A case study. J. Indian Soc. Remote Sens. 2009, 37, 21–35. [Google Scholar] [CrossRef]
- Inamdar, P.M.; Cook, S.; Sharma, A.K.; Corby, N.; O’Connor, J.; Perera, B.J.C. A GIS based screening tool for locating and ranking of suitable stormwater harvesting sites in urban areas. J. Environ. Manag. 2013, 128, 363–370. [Google Scholar] [CrossRef] [PubMed]
- Saaty, T.L. How to make a decision: the analytic hierarchy process. Eur. J. Oper. Res. 1990, 48, 9–26. [Google Scholar] [CrossRef]
- Kim, J.O.; Mueller, C.W. Introduction to Factor Analysis: What It Is and How to Do It; Sage Publications: New York, NY, USA, 1978. [Google Scholar]
- Kim, J.O.; Mueller, C.W. Factor Analysis: Statistical Methods and Practical Issues; Sage Publications: New York, NY, USA, 1978. [Google Scholar]
- Rummel, R.J. Applied Factor Analysis; Northwestern University Press: Evanston, IL, USA, 1970; pp. 1–616. ISBN 978-0-8101-0824-0. [Google Scholar]
- Stevens, J.P. Applied Multivariate Statistics for the Social Sciences; Lawrence Erlbaum Associates: Hillsdale, NJ, USA, 1986; pp. 1–650. ISBN 0-898-59568-1. [Google Scholar]
- Abdi, H.; Williams, L.J.; Valentin, D. Multiple factor analysis: Principal component analysis for multitable and multiblock data sets. Wiley Interdiscip. Rev. Comput. Stat. 2013, 5, 149–179. [Google Scholar] [CrossRef]
- Luan, W.; Lu, L.; Li, X.; Ma, C. Weight Determination of Sustainable Development Indicators Using a Global Sensitivity Analysis Method. Sustainability 2017, 9, 303. [Google Scholar] [CrossRef]
- Tscheikner-Gratl, F.; Egger, P.; Rauch, W.; Kleidorfer, M. Comparison of Multi-Criteria Decision Support Methods for Integrated Rehabilitation Prioritization. Water 2017, 9, 68. [Google Scholar] [CrossRef]
- Dyer, J.S. A Clarification of “Remarks on the Analytic Hierarchy Process”. Manag. Sci. 1990, 36, 274–275. [Google Scholar] [CrossRef]
- Harkar, P.T.; Vargas, L.G. Reply to “Remarks on the Analytic Hierarchy Process” by J.S. Dyer. Manag. Sci. 1990, 36, 269–273. [Google Scholar] [CrossRef]
- Ouma, Y.O.; Tateishi, R. Urban flood vulnerability and risk mapping using integrated multi-parametric AHP and GIS: methodological overview and case study assessment. Water 2014, 6, 1515–1545. [Google Scholar] [CrossRef]
- Adelmann, L.; Sticha, P.J.; Donnell, M.L. An Experimental Investigation of the Relative Effectiveness of Multiattribute Weighting Techniques. Organ. Behav. Hum. Perform. 1986, 33, 243–262. [Google Scholar] [CrossRef]
- Stillwell, W.G.; Winterfeld, D.; John, R.S. Comparing Hierarchical and Nonhierarchical Weighting Methods for Eliciting Multiattribute Value Models. Manag. Sci. 1987, 33, 442–450. [Google Scholar] [CrossRef]
- Adham, A.; Riksen, M.; Ouessar, M.; Ritsema, C.J. A methodology to assess and evaluate rainwater harvesting techniques in (semi-) arid regions. Water 2016, 8, 198. [Google Scholar] [CrossRef]
- Arrington, C.E.; Jensen, R.E.; Tokutani, M. Scaling of corporate multivariate performance criteria subjective composition versus the analytic hierarchy process. J. Account. Public Policy 1982, 1, 95–123. [Google Scholar] [CrossRef]
- Lockett, G.; Hetherington, B.; Yallup, P.; Stratford, M.; Cox, B. Modelling a research portfolio using AHP: A group decision process. R & D Manag. 1986, 16, 151–160. [Google Scholar] [CrossRef]
- Zou, Z.H.; Yi, Y.; Sun, J.N. Entropy method for determination of weight of evaluating indicators in fuzzy synthetic evaluation for water quality assessment. J. Environ. Sci. 2006, 18, 1020–1023. [Google Scholar] [CrossRef]
- Singh, V.P. Entropy Theory and Its Application in Environmental and Water Engineering; John Wiley and Sons: Hoboken, NJ, USA, 2013; pp. 1–661. ISBN 978-1-119-97656-1. [Google Scholar]
- Ojha, C.S.P.; Bhunya, P.; Berndtsson, R. Engineering Hydrology, 1st ed.; Oxford University Press: Oxford, UK, 2008; pp. 1–511. ISBN 9780195694611. [Google Scholar]
- Mishra, S.K.; Jain, M.K.; Pandey, R.P.; Singh, V.P. Catchment area based evaluation of the AMC-dependent SCS-CN-inspired rainfall-runoff models. Hydrol. Process 2005, 19, 546–565. [Google Scholar] [CrossRef]
- Pathak, S.; Ojha, C.S.P.; Zevenbergen, C.; Garg, R.D. Assessing Stormwater Harvesting Potential in Dehradun city Using Geospatial Technology. In Development of Water Resources in India; Garg, V., Singh, V.P., Raj, V., Eds.; Springer: Cham, Switzerland, 2017; pp. 47–60. ISBN 978-3-319-55124-1. [Google Scholar]
- Kułakowski, K. Heuristic rating estimation approach to the pairwise comparisons method. Fundam. Inform. 2014, 133, 367–386. [Google Scholar] [CrossRef]
- Ding, X.; Chong, X.; Bao, Z.; Xue, Y.; Zhang, S. Fuzzy Comprehensive Assessment Method Based on the Entropy Weight Method and Its Application in the Water Environmental Safety Evaluation of the Heshangshan Drinking Water Source Area, Three Gorges Reservoir Area, China. Water 2017, 9, 329. [Google Scholar] [CrossRef]
- Sargaonkar, A.; Deshpande, V. Development of an overall index of pollution for 573 surface water based on a general classification scheme in Indian context. Environ. Monit. Assess. 2003, 89, 43–67. [Google Scholar] [CrossRef] [PubMed]
- Ojha, C.S.P.; Goyal, M.K.; Kumar, S. Applying fuzzy logic and point count system to select landfill sites. Environ. Monit. Assess. 2007, 135, 99–106. [Google Scholar] [CrossRef] [PubMed]


| Site ID | Possible Options | Demand (ML) | Ratio of Runoff to Demand | Weighted Distance (m) |
|---|---|---|---|---|
| 76b | 49.07 | 1.3 | 300 | |
| 43c | 6.18 | 29.4 | 283 | |
| 43 | 43b | 5.82 | 31.2 | 277 |
| 46d | 7.47 | 14 | 256 | |
| 47d | 7.47 | 9.6 | 256 | |
| 44c | 6.43 | 62.6 | 255 | |
| 44 | 44b | 6.18 | 65.2 | 250 |
| 28 | 28b | 6.18 | 15.8 | 243 |
| 47c | 6.84 | 10.5 | 218 | |
| 46c | 6.84 | 15.3 | 217 | |
| 12 | 12b | 15.88 | 14.4 | 210 |
| 46 | 46b | 5.82 | 18 | 182 |
| 47 | 47b | 5.82 | 12.4 | 182 |
| 14 | 14b | 125.6 | 1.8 | 182 |
| 69 | 69b | 11.62 | 81.6 | 175 |
| 29d | 31.65 | 4.2 | 136 | |
| 52b | 13.7 | 8.5 | 134 | |
| 17d | 53.79 | 1.3 | 112 | |
| 41d | 30.65 | 2.2 | 103 | |
| 26 | 26b | 19.35 | 2.6 | 87 |
| 39 | 39b | 19.35 | 1.6 | 87 |
| 29c | 28.92 | 4.6 | 80 | |
| 78b | 13.07 | 1.5 | 70 | |
| 41c | 28.92 | 2.3 | 67 | |
| 52 | 52a | 5.33 | 21.9 | 0 |
| 76 | 76a | 5.3 | 11.8 | 0 |
| 29 | 29a | 23.14 | 5.8 | 0 |
| 78 | 78a | 5.3 | 3.7 | 0 |
| 77 | 77a | 5.3 | 3.2 | 0 |
| 17 | 17a | 23.14 | 3 | 0 |
| 41 | 41a | 23.14 | 2.9 | 0 |
| 20 | 20a | 23.14 | 2.8 | 0 |
| 9 | 9b | 28.67 | 1.3 | 0 |
| Rank | Possible Options | Scaled Demand | Scaled Inverse WD | Scaled RTD | Centroid (m) |
|---|---|---|---|---|---|
| 10 Intercept | 5 Intercept | 0 Intercept | |||
| 1 | 69b | 5.25 | 20.81 | 100.00 | 42.0 |
| 2 | 41c | 19.63 | 100.22 | 1.25 | 40.4 |
| 3 | 14b | 100.00 | 18.92 | 0.62 | 39.8 |
| 4 | 29c | 19.63 | 79.31 | 4.11 | 34.4 |
| 5 | 78b | 6.46 | 94.70 | 0.25 | 33.8 |
| 6 | 17d | 40.31 | 48.52 | 0.00 | 29.6 |
| 7 | 44b | 0.73 | 6.03 | 79.57 | 28.8 |
| 8 | 26b | 11.68 | 70.64 | 1.62 | 28.0 |
| 9 | 39b | 11.68 | 70.64 | 0.37 | 27.6 |
| 10 | 44c | 0.94 | 5.36 | 76.34 | 27.5 |
| 11 | 41d | 21.07 | 55.25 | 1.12 | 25.8 |
| 12 | 29d | 21.90 | 34.94 | 3.61 | 20.2 |
| 13 | 52b | 6.98 | 35.89 | 8.97 | 17.3 |
| 14 | 43b | 0.43 | 2.67 | 37.23 | 13.4 |
| 15 | 46b | 0.43 | 18.92 | 20.80 | 13.4 |
| Rank | Possible Options | Scaled Demand | Scaled RTD | Center Point (m) |
|---|---|---|---|---|
| 10 Intercept | 0 Intercept | |||
| 1 | 52a | 0.02 | 25.65 | 12.84 |
| 2 | 29a | 14.83 | 5.6 | 10.22 |
| 3 | 9b | 19.43 | 0 | 9.71 |
| 4 | 17a | 14.83 | 2.12 | 8.47 |
| 5 | 41a | 14.83 | 1.99 | 8.41 |
| Rank | Saaty AHP Method | Entropy Weight Method | PCA Method |
|---|---|---|---|
| 1 | 69b | 14b | 69b |
| 2 | 41c | 69b | 44b |
| 3 | 14b | 41c | 44c |
| 4 | 29c | 44b | 41c |
| 5 | 78b | 44c | 29c |
| 6 | 17d | 17d | 78b |
| 7 | 44b | 29c | 43b |
| 8 | 26b | 78b | 43c |
| 9 | 39b | 41d | 26b |
| 10 | 44c | 26b | 14b |
| 11 | 41d | 39b | 39b |
| 12 | 29d | 29d | 17d |
| 13 | 52b | 76b | 41d |
| 14 | 43b | 52b | 46b |
| 15 | 46b | 43b | 52b |
| 16 | 43c | 43c | 29d |
| 17 | 12b | 12b | 12b |
| 18 | 76b | 46b | 46c |
| 19 | 47b | 47b | 47b |
| 20 | 46c | 46c | 28b |
| ID | Radius of Influence (RI) (m) | Total Area (m2) | Urban Area (m2) | Urban Runoff Volume (ML) (Monthly) | Water Demand (ML) (Monthly) | Ratio of Runoff to Demand | Weighted Distance |
|---|---|---|---|---|---|---|---|
| A | 200 | 125,663.7 | 93,765 | 39.3 | 4.5 | 8.8 | 4.2 |
| A | 400 | 502,654.8 | 313,553 | 157.4 | 15 | 10.5 | 9.6 |
| A | 600 | 1,130,973 | 534,297.6 | 354.1 | 25.5 | 13.9 | 15.9 |
| A | 800 | 2,010,619 | 956,866.5 | 629.5 | 45.7 | 13.8 | 19.7 |
| A | 1000 | 3,141,593 | 1,443,163 | 983.6 | 68.9 | 14.3 | 25 |
| B | 200 | 125,663.7 | 4915 | 39.3 | 0.2 | 167.6 | 8.1 |
| B | 400 | 502,654.8 | 108,944.4 | 157.4 | 5.2 | 30.2 | 13.4 |
| B | 600 | 1,130,973 | 465,995 | 354.1 | 22.3 | 15.9 | 20.4 |
| B | 800 | 2,010,619 | 982,995 | 629.5 | 46.9 | 13.4 | 26.1 |
| B | 1000 | 3,141,593 | 1,770,438 | 983.6 | 84.6 | 11.6 | 28.1 |
| C | 200 | 125,663.7 | 62,829.9 | 39.3 | 3 | 13.1 | 6.3 |
| C | 400 | 502,654.8 | 170,539.4 | 157.4 | 8.1 | 19.3 | 11.6 |
| C | 600 | 1,130,973 | 309,677 | 354.1 | 14.8 | 23.9 | 16 |
| C | 800 | 2,010,619 | 495,541.5 | 629.5 | 23.7 | 26.6 | 25.5 |
| C | 1000 | 3,141,593 | 831,424 | 983.6 | 39.7 | 24.8 | 28.7 |
| D | 200 | 125,663.7 | 11,413 | 39.3 | 0.5 | 72.2 | 141.2 |
| D | 400 | 502,654.8 | 29,059.4 | 157.4 | 1.4 | 113.4 | 13 |
| D | 600 | 1,130,973 | 87,418.9 | 354.1 | 4.2 | 84.8 | 19.4 |
| D | 800 | 2,010,619 | 251,187.5 | 629.5 | 12 | 52.5 | 28.9 |
| D | 1000 | 3,141,593 | 738,246 | 983.6 | 35.3 | 27.9 | 36.8 |
| E | 200 | 125,663.7 | 36,676 | 39.3 | 1.8 | 22.5 | 6.5 |
| E | 400 | 502,654.8 | 205,243 | 157.4 | 9.8 | 16.1 | 9.9 |
| E | 600 | 1,130,973 | 309,245 | 354.1 | 14.8 | 24 | 11.7 |
| E | 800 | 2,010,619 | 420,560 | 629.5 | 20.1 | 31.3 | 18 |
| E | 1000 | 3,141,593 | 557,655 | 983.6 | 26.6 | 36.9 | 22.6 |
| F | 200 | 125,663.7 | 9102 | 39.3 | 0.4 | 90.5 | 139.5 |
| F | 400 | 502,654.8 | 180,030 | 157.4 | 8.6 | 18.3 | 13 |
| F | 600 | 1,130,973 | 537,586 | 354.1 | 25.7 | 13.8 | 15 |
| F | 800 | 2,010,619 | 1,005,158 | 629.5 | 48 | 13.1 | 20.7 |
| F | 1000 | 3,141,593 | 1,741,692 | 983.6 | 83.2 | 11.8 | 29.7 |
| G | 200 | 125,663.7 | 58,561.5 | 39.3 | 2.8 | 14.1 | 2.2 |
| G | 400 | 502,654.8 | 218,306.4 | 157.4 | 10.4 | 15.1 | 8.9 |
| G | 600 | 1,130,973 | 619,860 | 354.1 | 29.6 | 12 | 9.5 |
| G | 800 | 2,010,619 | 1,192,337 | 629.5 | 56.9 | 11.1 | 12.9 |
| G | 1000 | 3,141,593 | 1,932,770 | 983.6 | 92.3 | 10.7 | 17 |
| H | 200 | 125,663.7 | 31,584.1 | 39.3 | 1.5 | 26.1 | 5.8 |
| H | 400 | 502,654.8 | 245,109.6 | 157.4 | 11.7 | 13.4 | 8.5 |
| H | 600 | 1,130,973 | 587,960.8 | 354.1 | 28.1 | 12.6 | 10.9 |
| H | 800 | 2,010,619 | 1,026,758 | 629.5 | 49 | 12.8 | 18.1 |
| H | 1000 | 3,141,593 | 1,572,652 | 983.6 | 75.1 | 13.1 | 22.7 |
| Rank | Saaty AHP Method | Entropy Weight Method | PCA Method | |||
|---|---|---|---|---|---|---|
| ID | RI (m) | ID | RI (m) | ID | RI (m) | |
| 1 | B | 200 | B | 200 | B | 200 |
| 2 | G | 1000 | D | 400 | D | 400 |
| 3 | G | 200 | G | 200 | D | 600 |
| 4 | B | 1000 | G | 1000 | G | 200 |
| 5 | F | 1000 | D | 600 | D | 800 |
| 6 | H | 1000 | B | 1000 | E | 1000 |
| 7 | A | 1000 | F | 1000 | H | 200 |
| 8 | D | 400 | H | 1000 | G | 1000 |
| 9 | G | 800 | A | 1000 | E | 800 |
| 10 | H | 800 | G | 800 | E | 200 |
| 11 | F | 800 | D | 800 | A | 200 |
| 12 | A | 800 | E | 1000 | B | 1000 |
| 13 | D | 600 | H | 800 | H | 1000 |
| 14 | B | 800 | C | 1000 | F | 1000 |
| 15 | C | 1000 | A | 200 | D | 1000 |
| 16 | A | 200 | H | 200 | B | 400 |
| 17 | G | 600 | F | 800 | C | 1000 |
| 18 | E | 1000 | A | 800 | A | 1000 |
| 19 | D | 1000 | D | 1000 | E | 600 |
| 20 | H | 600 | B | 800 | G | 800 |
© 2017 by the authors. Licensee MDPI, Basel, Switzerland. This article is an open access article distributed under the terms and conditions of the Creative Commons Attribution (CC BY) license (http://creativecommons.org/licenses/by/4.0/).
Share and Cite
Pathak, S.; Ojha, C.S.P.; Zevenbergen, C.; Garg, R.D. Ranking of Storm Water Harvesting Sites Using Heuristic and Non-Heuristic Weighing Approaches. Water 2017, 9, 710. https://doi.org/10.3390/w9090710
Pathak S, Ojha CSP, Zevenbergen C, Garg RD. Ranking of Storm Water Harvesting Sites Using Heuristic and Non-Heuristic Weighing Approaches. Water. 2017; 9(9):710. https://doi.org/10.3390/w9090710
Chicago/Turabian StylePathak, Shray, Chandra Shekhar Prasad Ojha, Chris Zevenbergen, and Rahul Dev Garg. 2017. "Ranking of Storm Water Harvesting Sites Using Heuristic and Non-Heuristic Weighing Approaches" Water 9, no. 9: 710. https://doi.org/10.3390/w9090710
APA StylePathak, S., Ojha, C. S. P., Zevenbergen, C., & Garg, R. D. (2017). Ranking of Storm Water Harvesting Sites Using Heuristic and Non-Heuristic Weighing Approaches. Water, 9(9), 710. https://doi.org/10.3390/w9090710