1. Introduction
Drought is a slow and imperceptible phenomenon from continuous water shortage. According to the Fifth Assessment Report (AR5) of the Intergovernmental Panel on Climate Change (IPCC), climate change increases the frequency of extreme rainfall events and intensifies the spatial and temporal contrast of wetness and dryness [
1,
2,
3]. Little precipitation and snow for years caused severe droughts in California in 2009 and 2013–2016 [
4]. In addition to agricultural and domestic use, industries such as manufacturing, golf, ski parks, and construction were strongly affected by the water rationing. Most places in Taiwan are vulnerable to droughts because of reservoir siltation, high water leakage rate, and low water price. Little precipitation in 2014 caused the most severe drought in 2015 over the past 67 years. It caused approximately 43 thousand acres of paddy fields to stop irrigation, 10% supply reduction on large industries, and phase-three water rationing for domestic use, i.e., two-day cut-off after five-day supply. These events indicate that the effects of droughts may show in meteorological, hydrological, agricultural, and social-economic aspects [
5].
Industries are one of the sectors that experience more water stress because of increasing drought [
6]. Droughts impose impacts on food and industrial production such as Coca Cola [
7]. In Taiwan, the severe drought event in 2015 led to the rarely seen phase-two water rationing in Hsinchu Science Park. Under phase-three water rationing, the water supply will be reduced by 30% and that may need to shut down some production lines. To prevent the possible phase-three water rationing, various industries have actively invested in developing adaptation measures. For example, the United Microelectronics Corporation in Taiwan developed an early-warning system (United Microelectronics Corporation Drought Early Warning System, UMCDEWS) against droughts [
8]. The tool has been proven able to predict the timing of water rationing, which helps the company order tank cars to deliver water in advance. Other adaptation measures include industrial water conservation and water recycling, which have been applied in Japan, Europe, and Latin America [
6,
9].
General procedures are proposed to assist climate-change-related adaptation decision-making. The concepts of the procedures are similar, which include analyses of the problems, assessment of the current and future risks, identification of the adaptation measures, implementation of the adaptation plan, and monitor and modification [
10]. The main differences are in the classification of the steps and the consideration of monitor and modification. The adaptation procedures may be used by different potential users such as the professional team, government, industries, or general public. In fact, multi-level collaboration is essential to effective adaptation. Many studies have recognized the importance of clarifying the responsibilities of the regional, local, and individual actors [
11,
12,
13]. However, most studies only elaborate the role of multi-level collaboration in adaptation instead of demonstrating the details of collaboration with a study case. This study focuses on adaptation planning from the perspective of an industrial company to identify the effective adaptation options to reduce the risk of droughts in future climate and social-economic scenarios. The significance of the study is in applying the adaptation planning framework to help recognize the adaptation measures that a company can implement to reduce the water shortage of the region and benefit the company itself. The existing adaptation planning of the government is treated as the boundary condition of the company’s adaptation. If the regional adaptation planning is unavailable, the company must have more aggressive adaptation plan.
The study uses the Sixth Naphtha Cracker Complex Park of Formosa Plastics Corporation (FPC) and the Chuoshui River watershed in Taiwan as a study case. The goal of adaptation for the entire watershed includes enhancing the water resource management, increasing the function of water retention, maintaining the quantity and quality of the groundwater, and facilitating the responding mechanism of irrigation during droughts. Moreover, the goal of the company includes reducing the amount of water shortage, increasing the resilience, and maintaining the availability of the water supply for industrial water use. Risk is a function of hazard, exposure, and vulnerability, as defined in AR5 [
1]. The definition of hazard is the climate-related events leading to impact to the system the adaptation aiming at protecting. Moving the concerned system to place with less hazard is considered eliminating the exposure. Moreover, the vulnerability can be divided into the sensitivity and adaptive capacity. The former is the inherent characteristics to determine how susceptible the protecting systems are to water shortages, whereas the latter represents the ability of the systems to adapt to water shortages. Increasing the adaptive capacity or decreasing the sensitivity reduce the vulnerability, which can be evaluated concerning the wealth, technology, information, skills, infrastructure, institutions, and equity aspects. The paper is organized as follows: the methods to evaluate climate risk and identify the adaptation options are elaborated in
Section 2; the study case is introduced in
Section 3; the results are shown in
Section 4; the discussions and conclusion are shown in
Section 5.
2. Materials and Methods
This study applies the methodology of evaluating climate risk and identifying the adaptation options to the general adaptation planning framework, to assist an industrial company in the decision-making of climate change adaptation. The climate change risk assessment and adaptation option identification are conducted based on the viewpoint of an industrial company, which is different from the studies that focus on the regional or governmental viewpoint. Because the water resources of the company are also affected by other water users, the company needs the information of the risk assessments and adaptation measures of the entire watershed. The company has its own objective of the adaptation to minimize the risk of water shortage, and the adaptive capacity for the entire watershed is treated as the boundary condition. Government has already a procedure in adaptation planning. However, the results of regional risk assessment and adaptation option identification and evaluation for a company may not be provided by the governmental agency, as the case of FPC is. Therefore, the company must conduct risk assessment and evaluate whether it should invest in existing adaptation options or implement additional measures. The following sections are categorized as model verification and indicator definition, risk assessment, and identifying and assessing the adaptation options.
2.1. Model Verification and Indicator Definition
2.1.1. Verification of Assessment Models
Verifying the assessment models helps provide reasonable results. The observed weather data and streamflow are used to verify the hydrological component of the Generalized Watershed Loading Function (GWLF) [
14] and water supply system dynamics model, respectively. This study uses the GWLF to simulate streamflows and inputs the flows into a water supply system dynamics model to allocate regional water resources. The results are used to estimate the risk of water shortage.
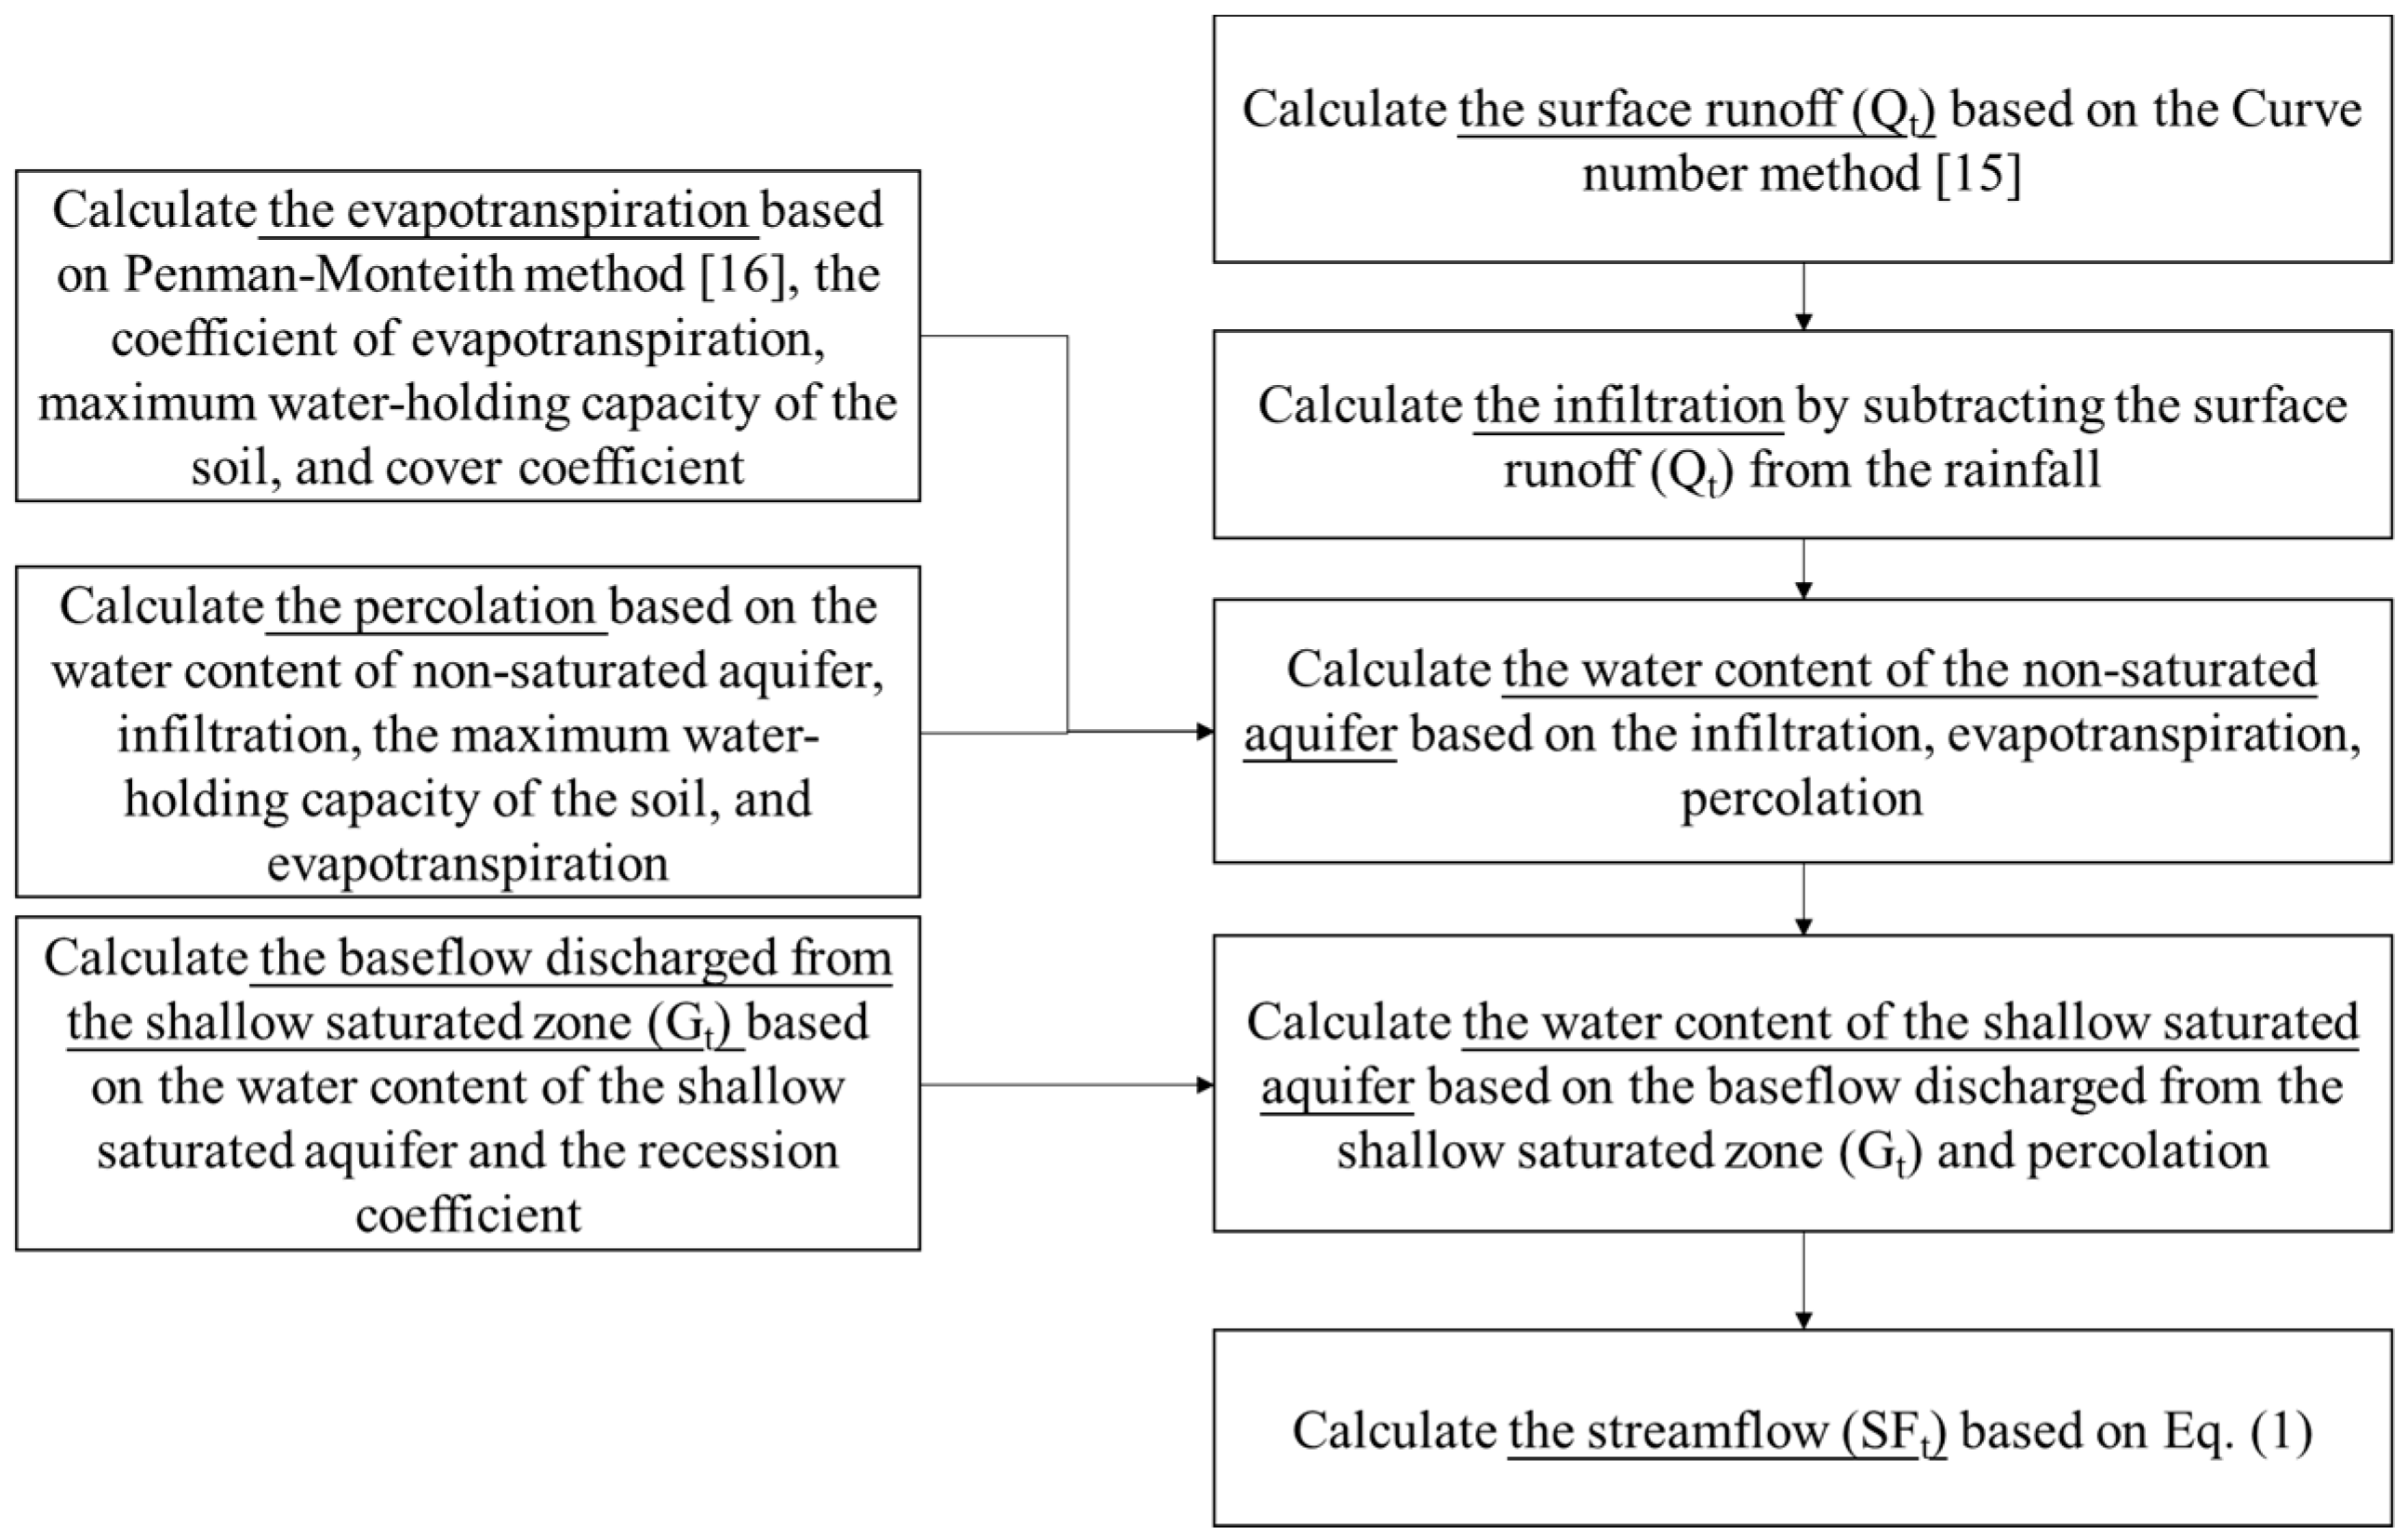
The GWLF is selected because it provides reasonable estimates of the monthly streamflow in the Chuoshui River watershed. It is a conceptual lump model which calculates the water balance at the surface layer and the non-saturated aquifer, which reflects the effects of the weather, types of land use, and drainage characteristics of soils on the streamflows. This study simulates the stream-flows based on the concept of GWLF but calculates the daily and ten-day flows. The streamflow (
SFt) is estimated by summing the surface runoff (
Qt) and the baseflow discharged from the shallow saturated zone (
Gt), as shown in Equation (1). The surface runoff is calculated using the Curve Number Method [
15], whereas the ground water discharge is modeled as a linear reservoir. The input parameters are the Curve Number (CN), daylight hours, maximum water-holding capacity of the soil, coefficient of evapotranspiration, cover coefficient, and recession coefficient of the shallow non-saturated aquifer. The flowchart is shown in
Figure 1, and more descriptions of the GWLF can be found in [
14].
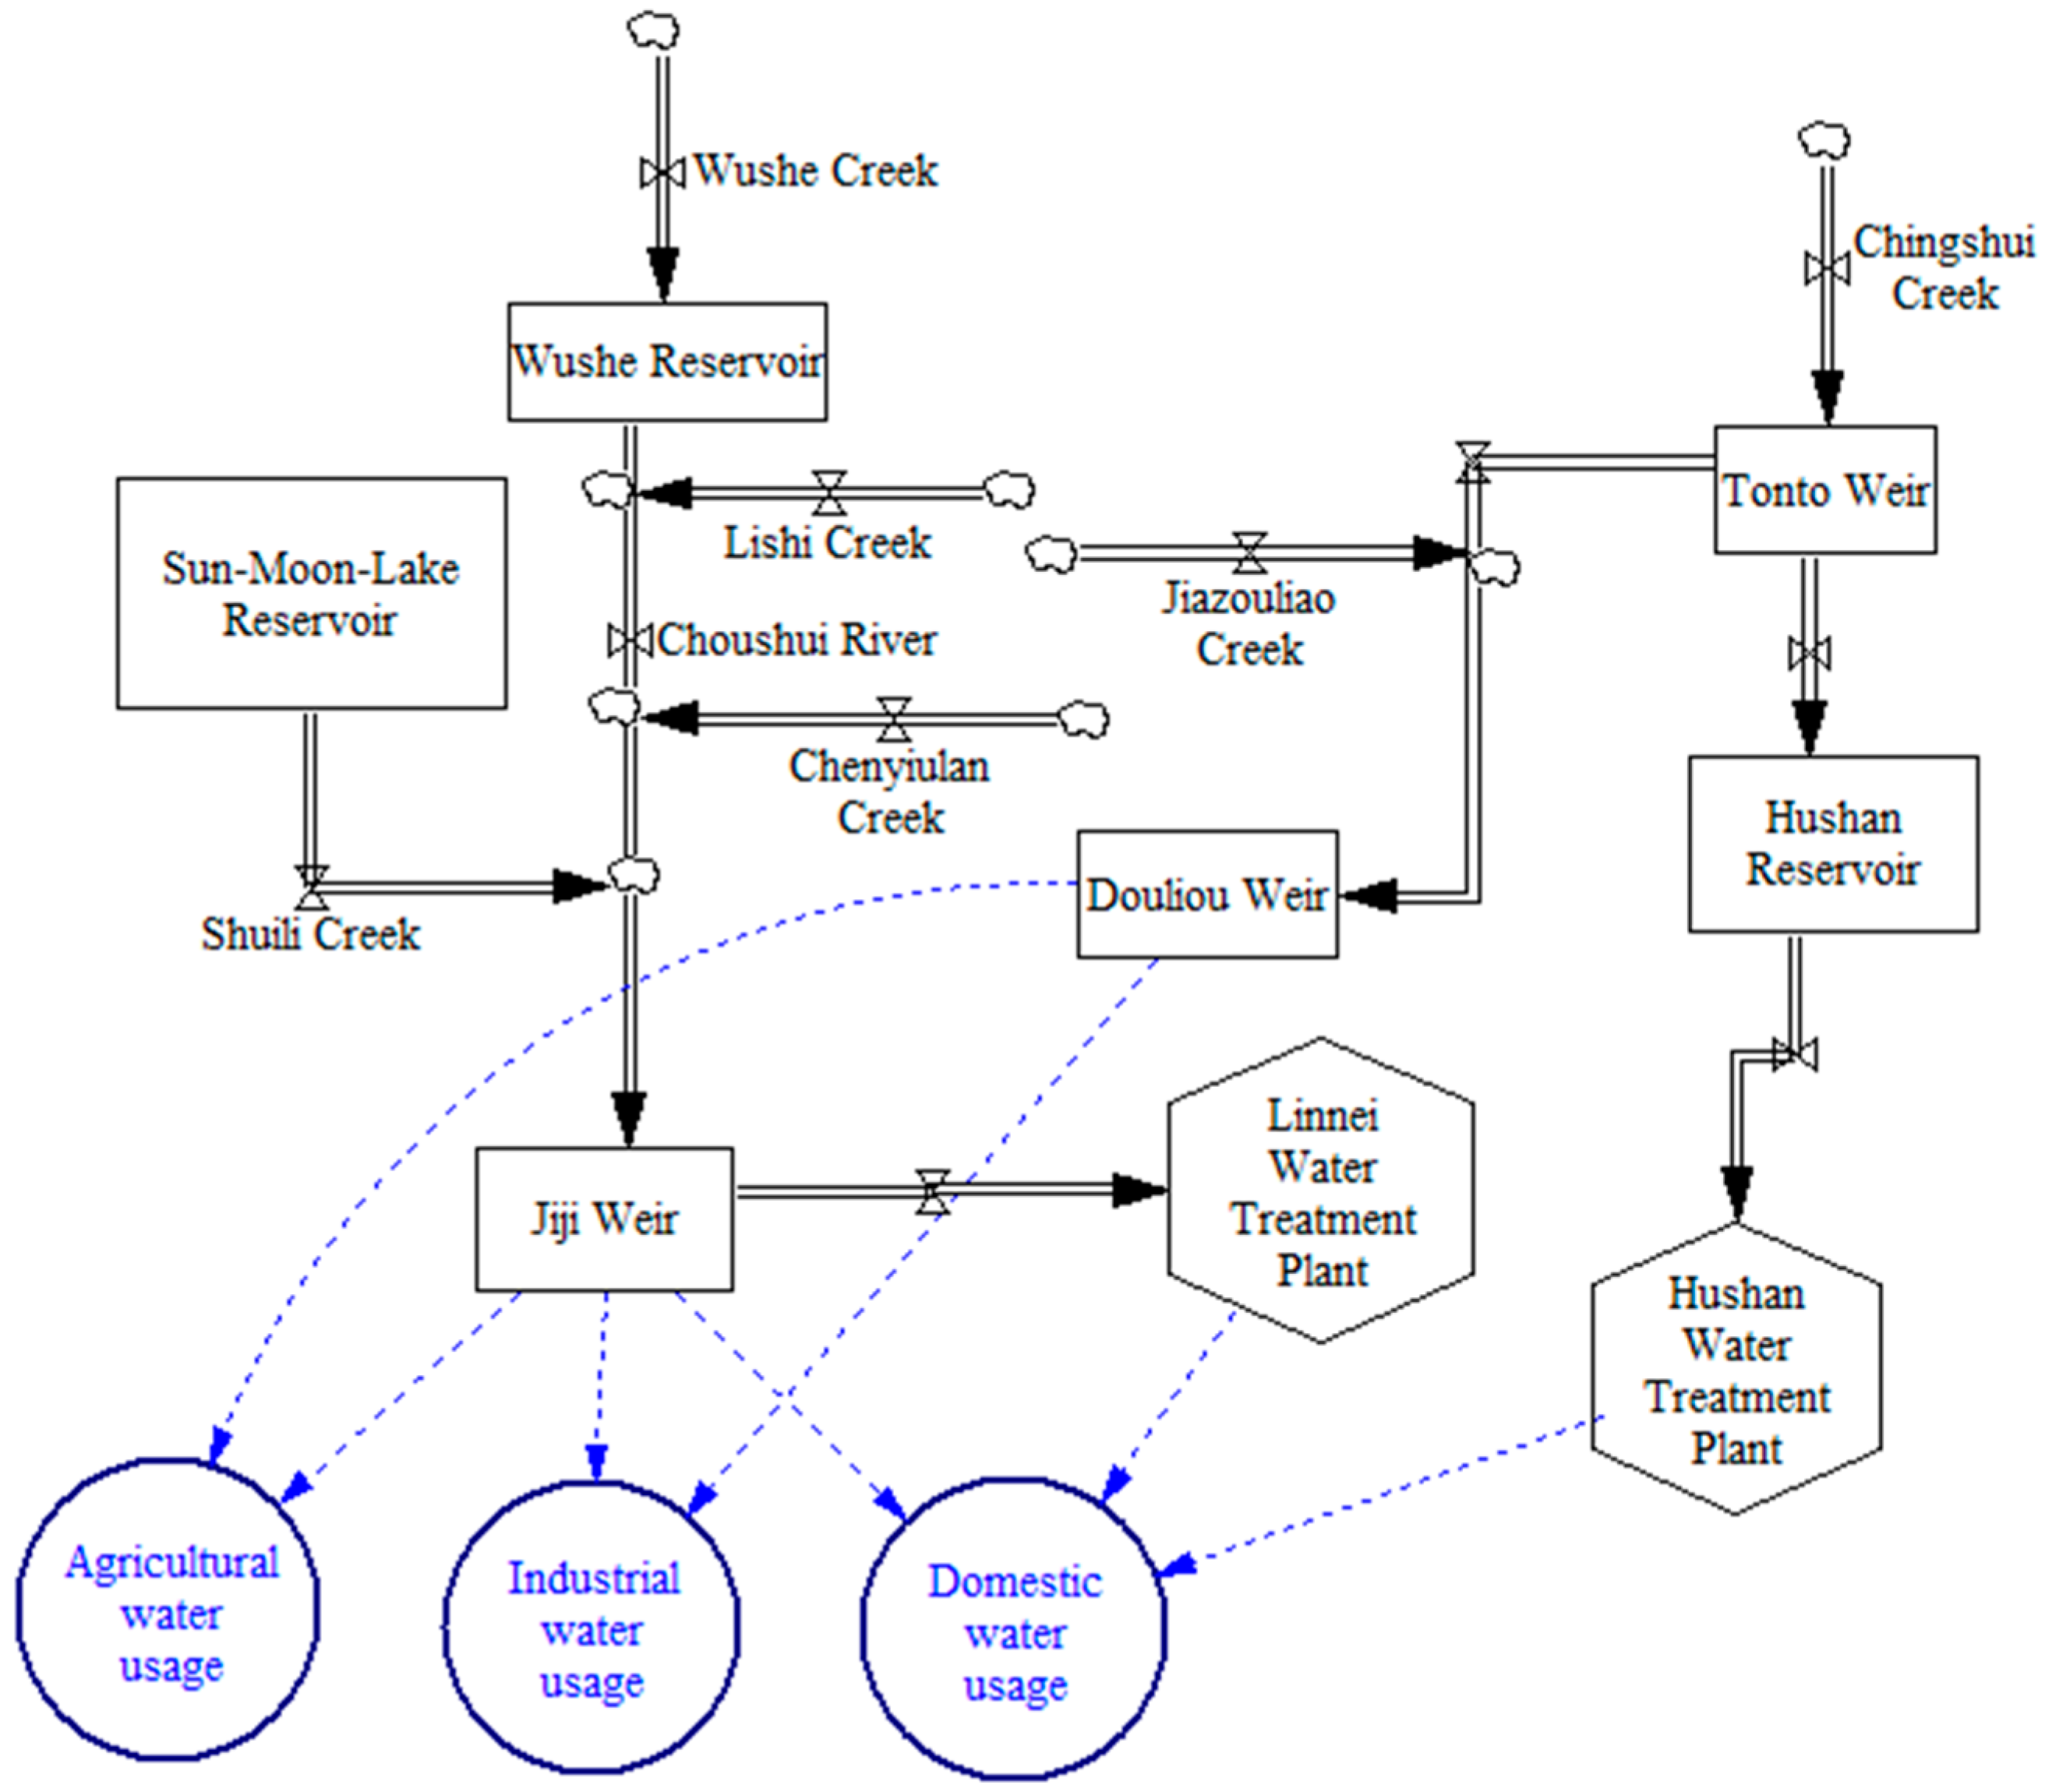
The stream flows are used as the inputs of the water supply system dynamics model. The system dynamics model is developed to simulate the allocation of regional water resources. The relationship between the water use of a company and that of the regional system can be clearly identified using the system dynamics model. It is of great use for a company to recognize whether the source of water resources is affected by the concerned hazard and which users have large water demands. This study uses the modeling tool of Vensim [
17] to build the water supply system dynamics model based on the layout of the hydraulic facilities and operation rules of the reservoirs and weirs, which define the amount of power generation and water rights of different users. The water supply system dynamics model of the water allocation in the Chuoshui River watershed is shown in
Figure 2.
In this study, the maximum water supply within the tolerable risk of water shortage is defined as the carrying capacity of the water supply system. The tolerable risk of water shortage is set as the Shortage Index (SI) [
18] of 1. SI is commonly used to estimate the capacity of a water supply system and is calculated using Equation (2).
where
N is the total number of years of simulation;
Di and
Si are the amount of water shortage and planned amount of water supply, respectively.
The study estimates the carrying capacity of the water supply system in different climate and social-economic scenarios using the system dynamics model. The iterative estimating process used to determine the maximum water supply without exceeding the threshold of SI is described as follows. The total water demand of different users is first estimated to be the initial design of the water demand; then, the water supply and demand are compared to calculate the value of SI. If SI is less than the threshold, the designed water demand is increased; otherwise, it is reduced. The process is stopped when the value of SI approaches the threshold. Then, the designed water demand is the carrying capacity of the water supply system.
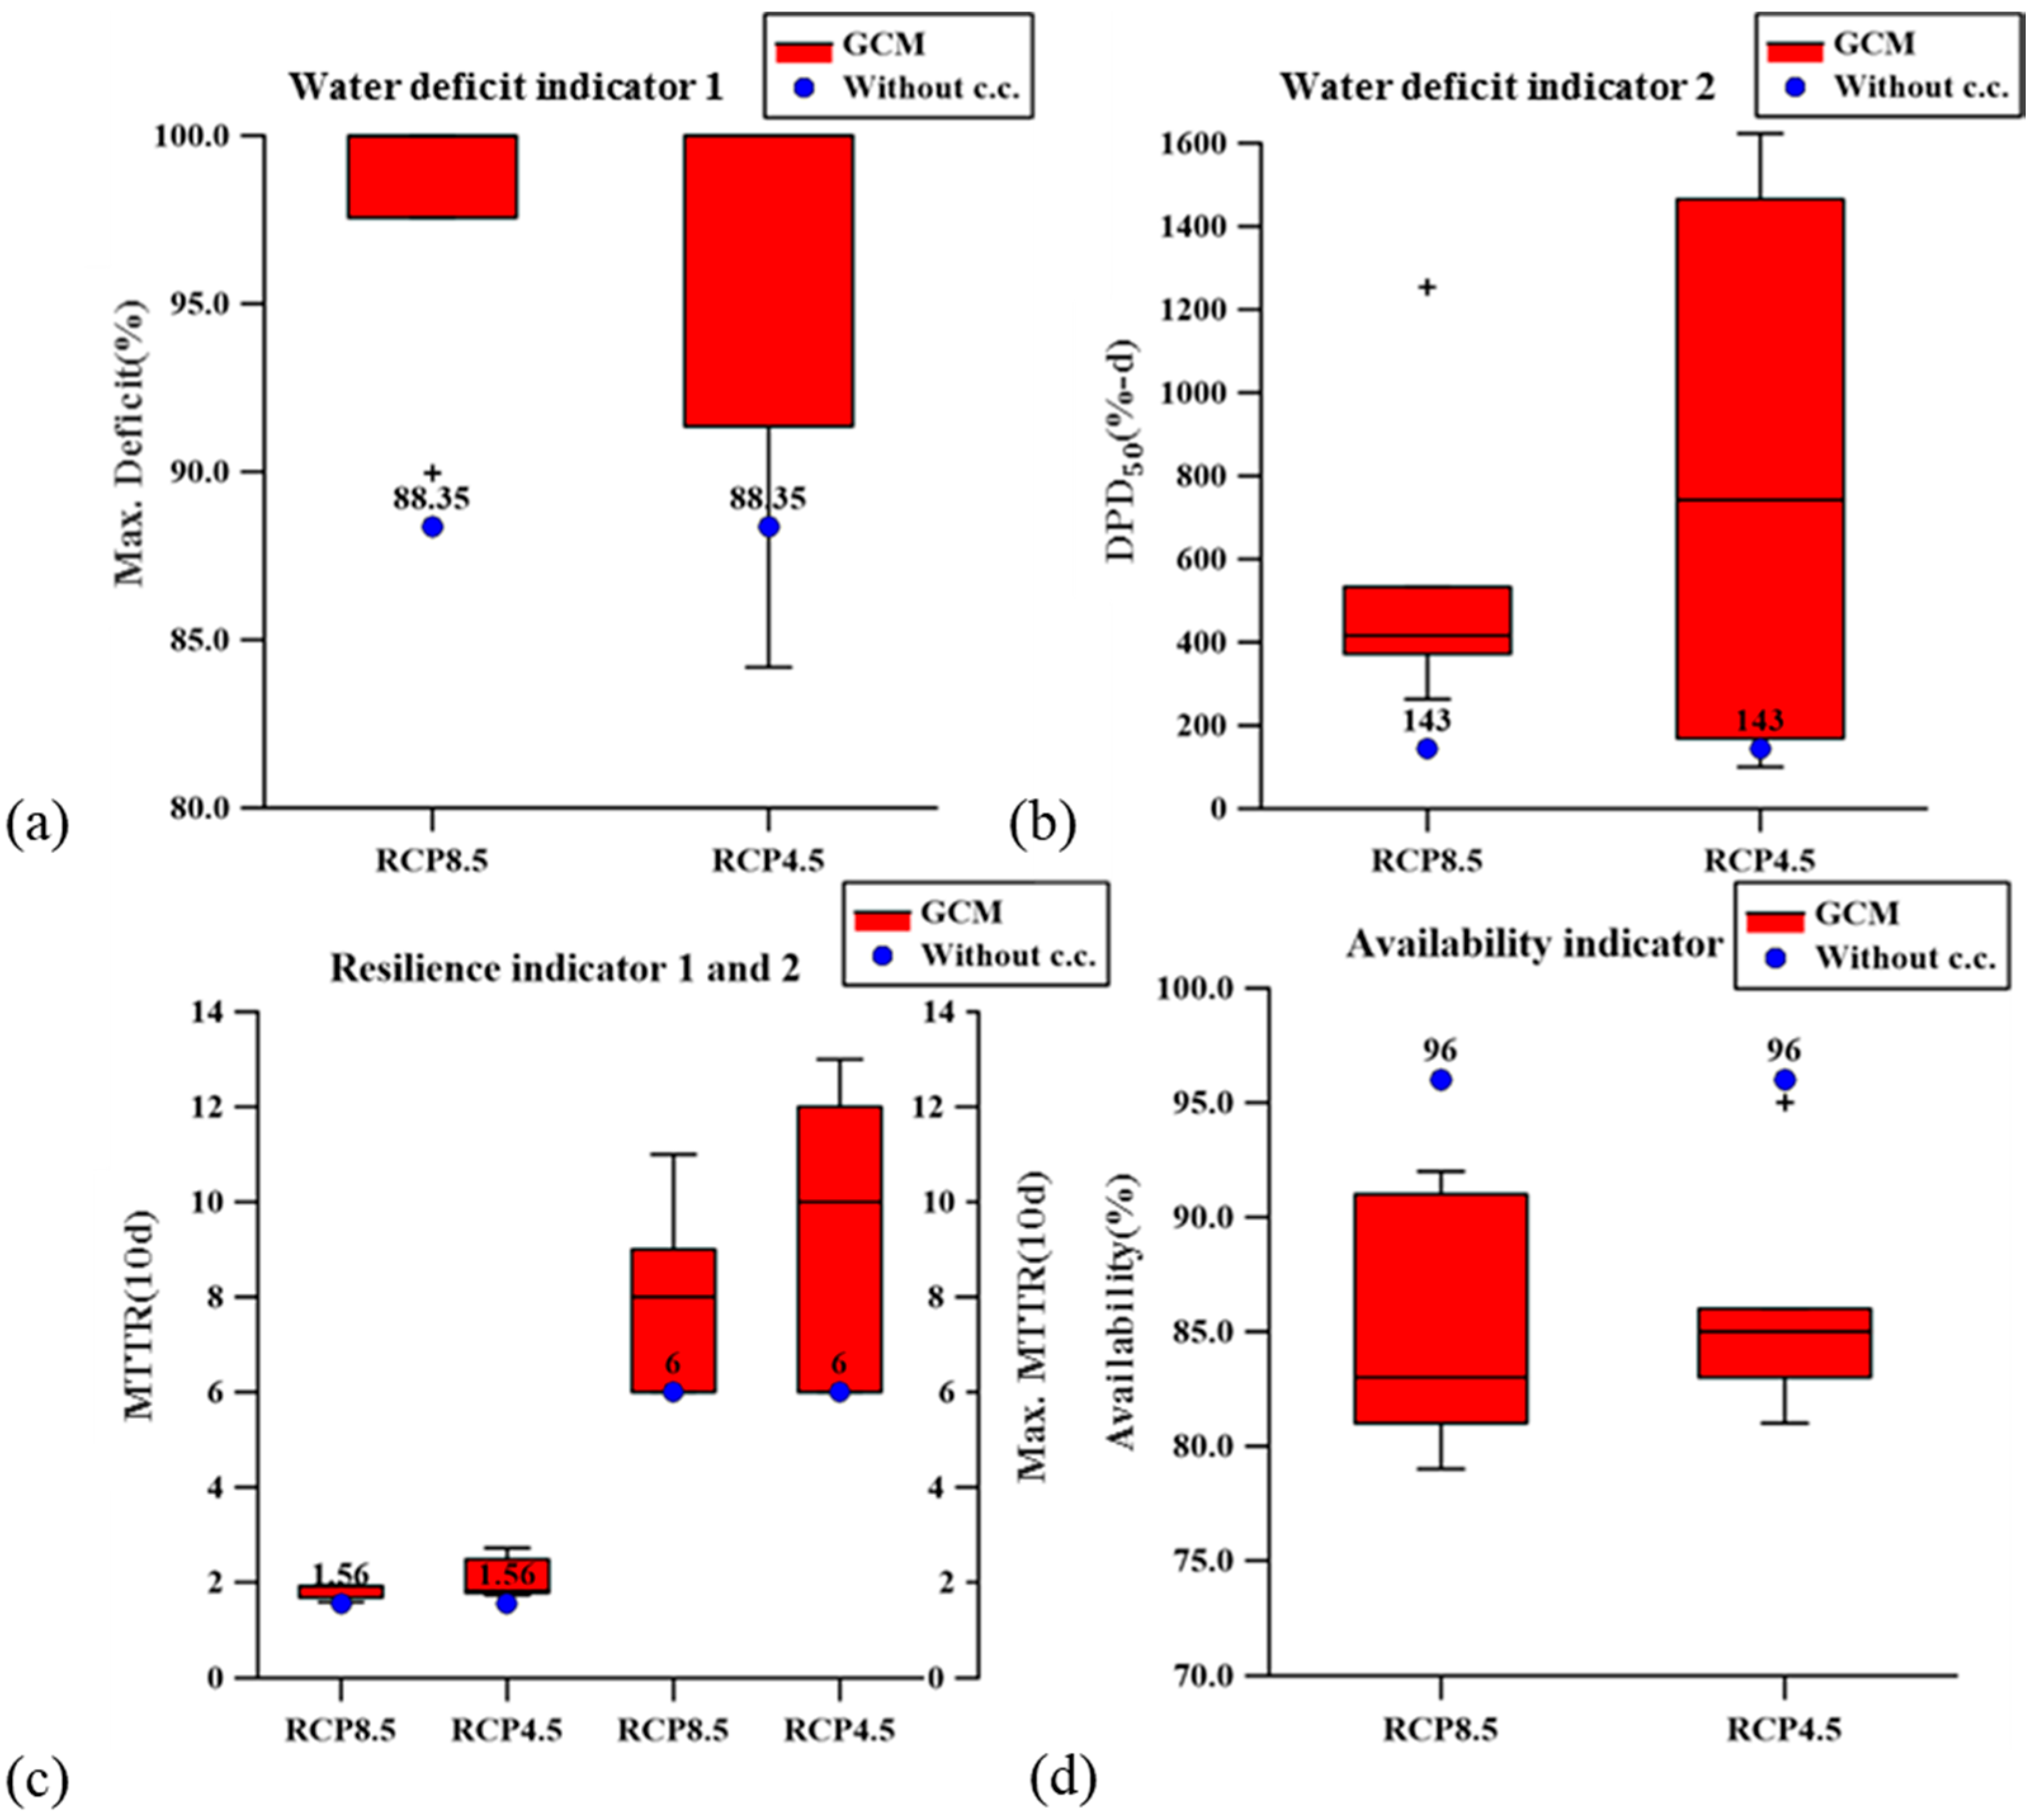
2.1.2. Indicators for Risk Assessments
The most concerned aspect of drought risks is the amount of water shortage. However, a company is more concerned about the details that affect its economic loss and may hope that the duration of allowable water deficit is less than a given number of days to ensure the production work. These details may include the recovering time and average functioning performance of the system. The water shortage ratio is commonly used to describe the amount of water shortage. Proposed in 1977 by Water Resources Development Public Corp., the Deficit Percent Day (DPD) Index is a commonly used indicator to evaluate the accumulation of water shortage [
19]. The indicators that evaluate the recovery time for a malfunctioning system are considered the resilience indicators, and this study uses the Mean Time to Repair (MTTR) and Maximum Time to Repair (Max. TTR) as the resilience indicators. The average functioning performance of the system is estimated by calculating the ratio of Mean Time to Failure (MTTF) of the analyzed period, which is defined as the availability indicator in this study.
The study defines five indicators to evaluate the risk of water shortage (
Table 1). The ten-day average water shortage ratio (hereafter water shortage ratio) is used to fit the practical operation of the facilities. The water shortage ratio (R) and DPD are calculated in Equations (3) and (4), respectively. Moreover, the study considers water shortage as a regular threat and uses the maximum annual DPD in a 2-year return period as an indicator (DPD
50). The details of other indicators are referred to [
20]. The maximum values of R (Max. R) and DPD
50 are selected as the water deficit indicators. With the defined indicators, the risk is quantified and described accordingly.
where
M is the ten-day amount of water shortage;
D is the ten-day water demand;
n is the number of water shortage events;
i is the counter;
N is the number of continuous deficit days;
Di is the water demand of the
ith day;
Si is the water supply of the
ith day.
2.2. Risk Assessment
The risk information may be sliced from the regional risk assessment by the governmental agency, which includes the risk of the company as a component of the regional allocation system. If it is not available, which is the case in this study, the private company must conduct its own risk assessment. Then, the risks of the regional system and the company’s on-site system are further distinguished as the basis to identify the adaptation options for the company.
2.2.1. Current Climate Risk Assessment
The current risk is assessed using an integrated risk assessment tool of water resources called TaiWAP [
21] and the verified water supply system dynamics model. The result is further quantified with the defined indicators. The current risk is evaluated using the observed weather data. Then, the causes of the risk for status quo are discussed. The risk of the current climate may be different from that of historical events because of the changes of the climate, land use/land cover in the watershed, or water supply system. Therefore, the analysis of the causes that compose the current risk enables us to compare the current and historical risks. Moreover, the results also help track changes of the risks between the current and the baseline scenarios to examine the difference in using the observed data and the generated data.
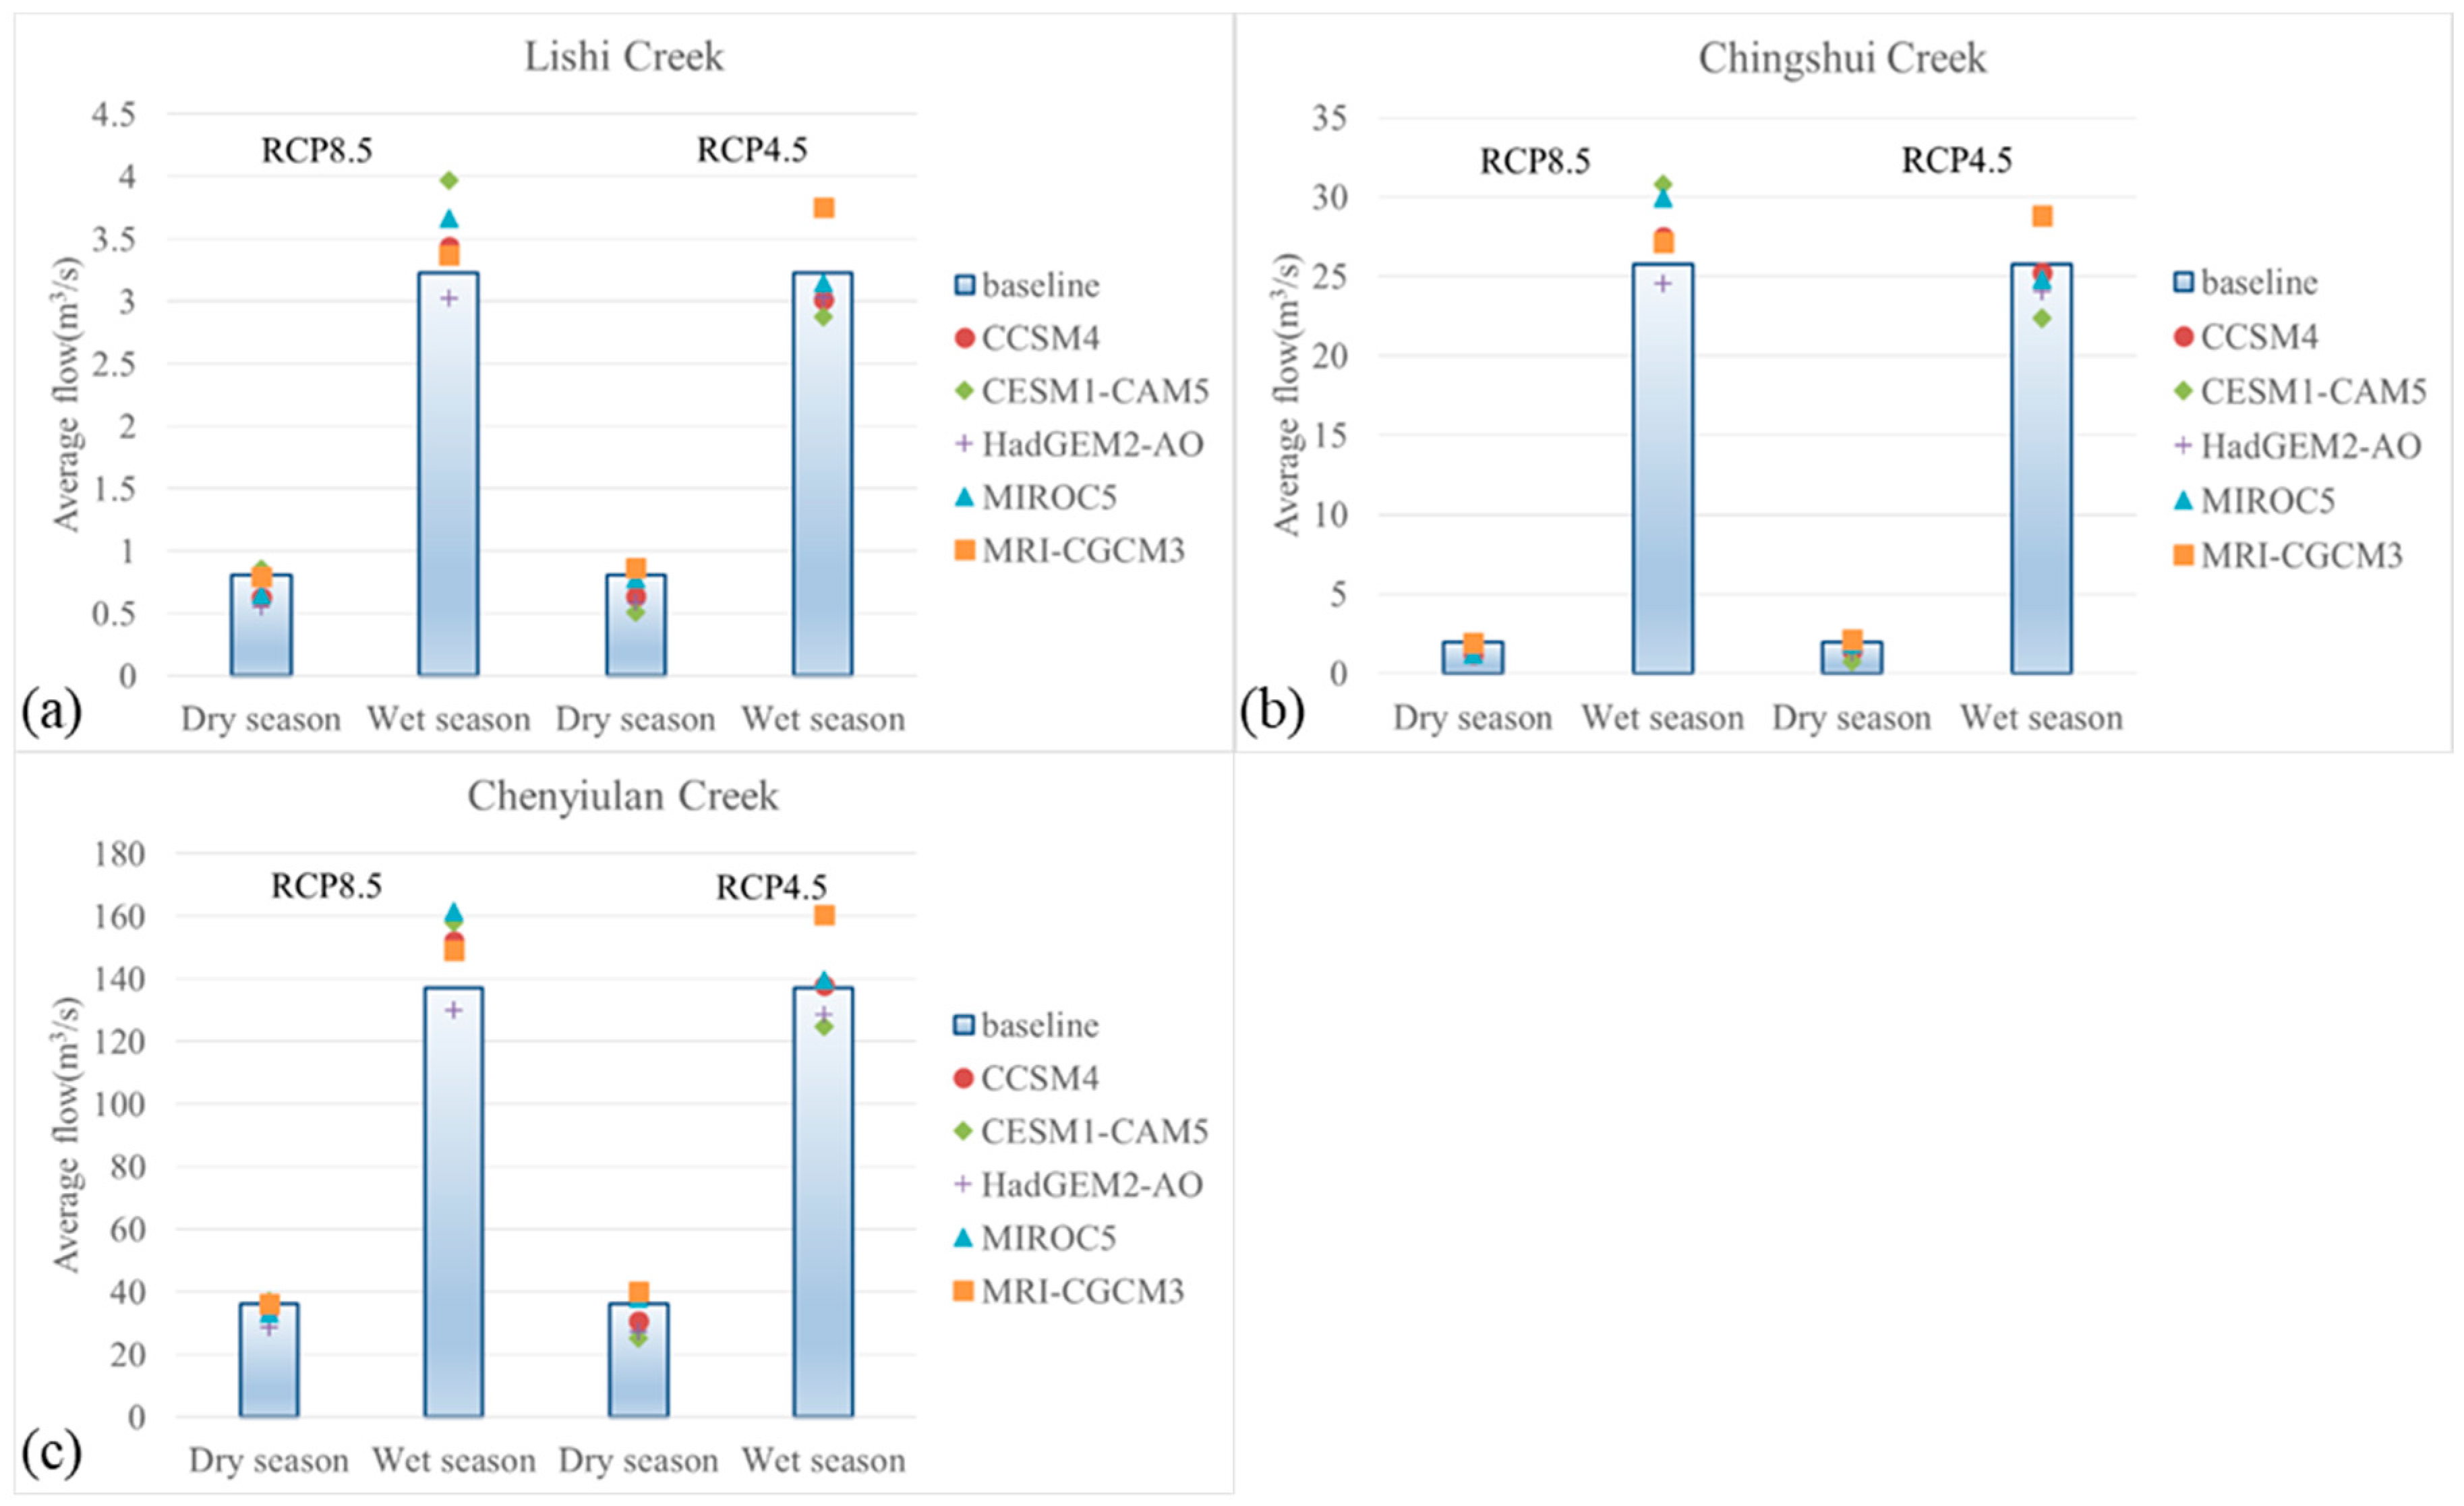
2.2.2. Scenario Setting
The climate change and social-economic scenarios are setup before assessing the future risk. The data of the existing General Circulation Models (GCMs) in different Representative Concentration Pathways (RCPs) is available on the website of the IPCC Data Distribution Center. The GCMs with high validity, whose climate projections in the baseline period are similar to the observed data of the targeted weather station, have high priority to be selected. Three criteria are included in evaluating the validity: the correlation coefficient of annual precipitation, the normalized root mean square error (NRMSE) of the wet seasons, and the NRMSE of the dry seasons (Equation (5)). A high correlation coefficient or a low NRMSE indicate high validity. The GCMs are ranked for each criterion and the ranks are averaged, which is called the Weighted Average Ranking (WAR) method [
22] (Equation (6)). Based on the WAR, the required number of GCMs is selected to derive climate scenarios.
where
Xsim,i is the simulated
ith data;
Xobs,i is the observed
ith data;
N is the number of data;
Rankavg is the average rank of the GCM;
rj is the rank of the GCM for criterion
j;
M is the number of criteria.
The categories of social-economic scenarios usually include the population and human development, economic conditions, and land cover/land use [
6]. This study considers only the effects of the social-economic scenarios on the water demands of the agricultural, domestic, and industrial uses. The irrigation water demand is affected by the crop species, planting practices and schedules, soil types, crop areas, growing period, and potential evapotranspiration, whereas the domestic water demand (
Ddomestic) is affected by the population and individual water demand (Liters per Capita per Day, LPCD), rate of population served, and leakage rate (Equation (7)). The industrial water demand is commonly related to industrial development, which can be estimated by the area of factories, floor area, number of employees, and Gross Domestic Product (GDP) per capita. These scenarios of water demands can be set according to either simulation or official reports of future development.
where
N is the population;
Rpopulation served and
Rleakage are the rate of population served and leakage rate of the water supply, respectively.
2.2.3. Baseline Climate Risk Assessment
The baseline risk assessment includes generating baseline weather data and analyzing the risks in baseline climate scenarios. The purpose of baseline risk assessment is to ensure the reliability of using the generated weather data and estimated water demands in the risk assessment by comparing the current and baseline risks. The GCMs with high validity were selected. Moreover, the weather data is generated based on a Richardson-type weather generator [
23] using TaiWAP [
21], in which the data was downscaled by bias correction [
24] and the climate scenarios are setup using the delta method [
25]. Then, the risk assessment of the baseline is similarly conducted as the current risk assessment. The main difference is that the climate and social-economic scenarios in the baseline are used instead of the observed weather data and water demands. More specifically, the weather data of the baseline is generated using a weather generator instead of the observed data, whereas the water demands of different uses in the climate and social-economic scenarios are estimated. With the aforementioned data, the risk is quantified using the defined indicators.
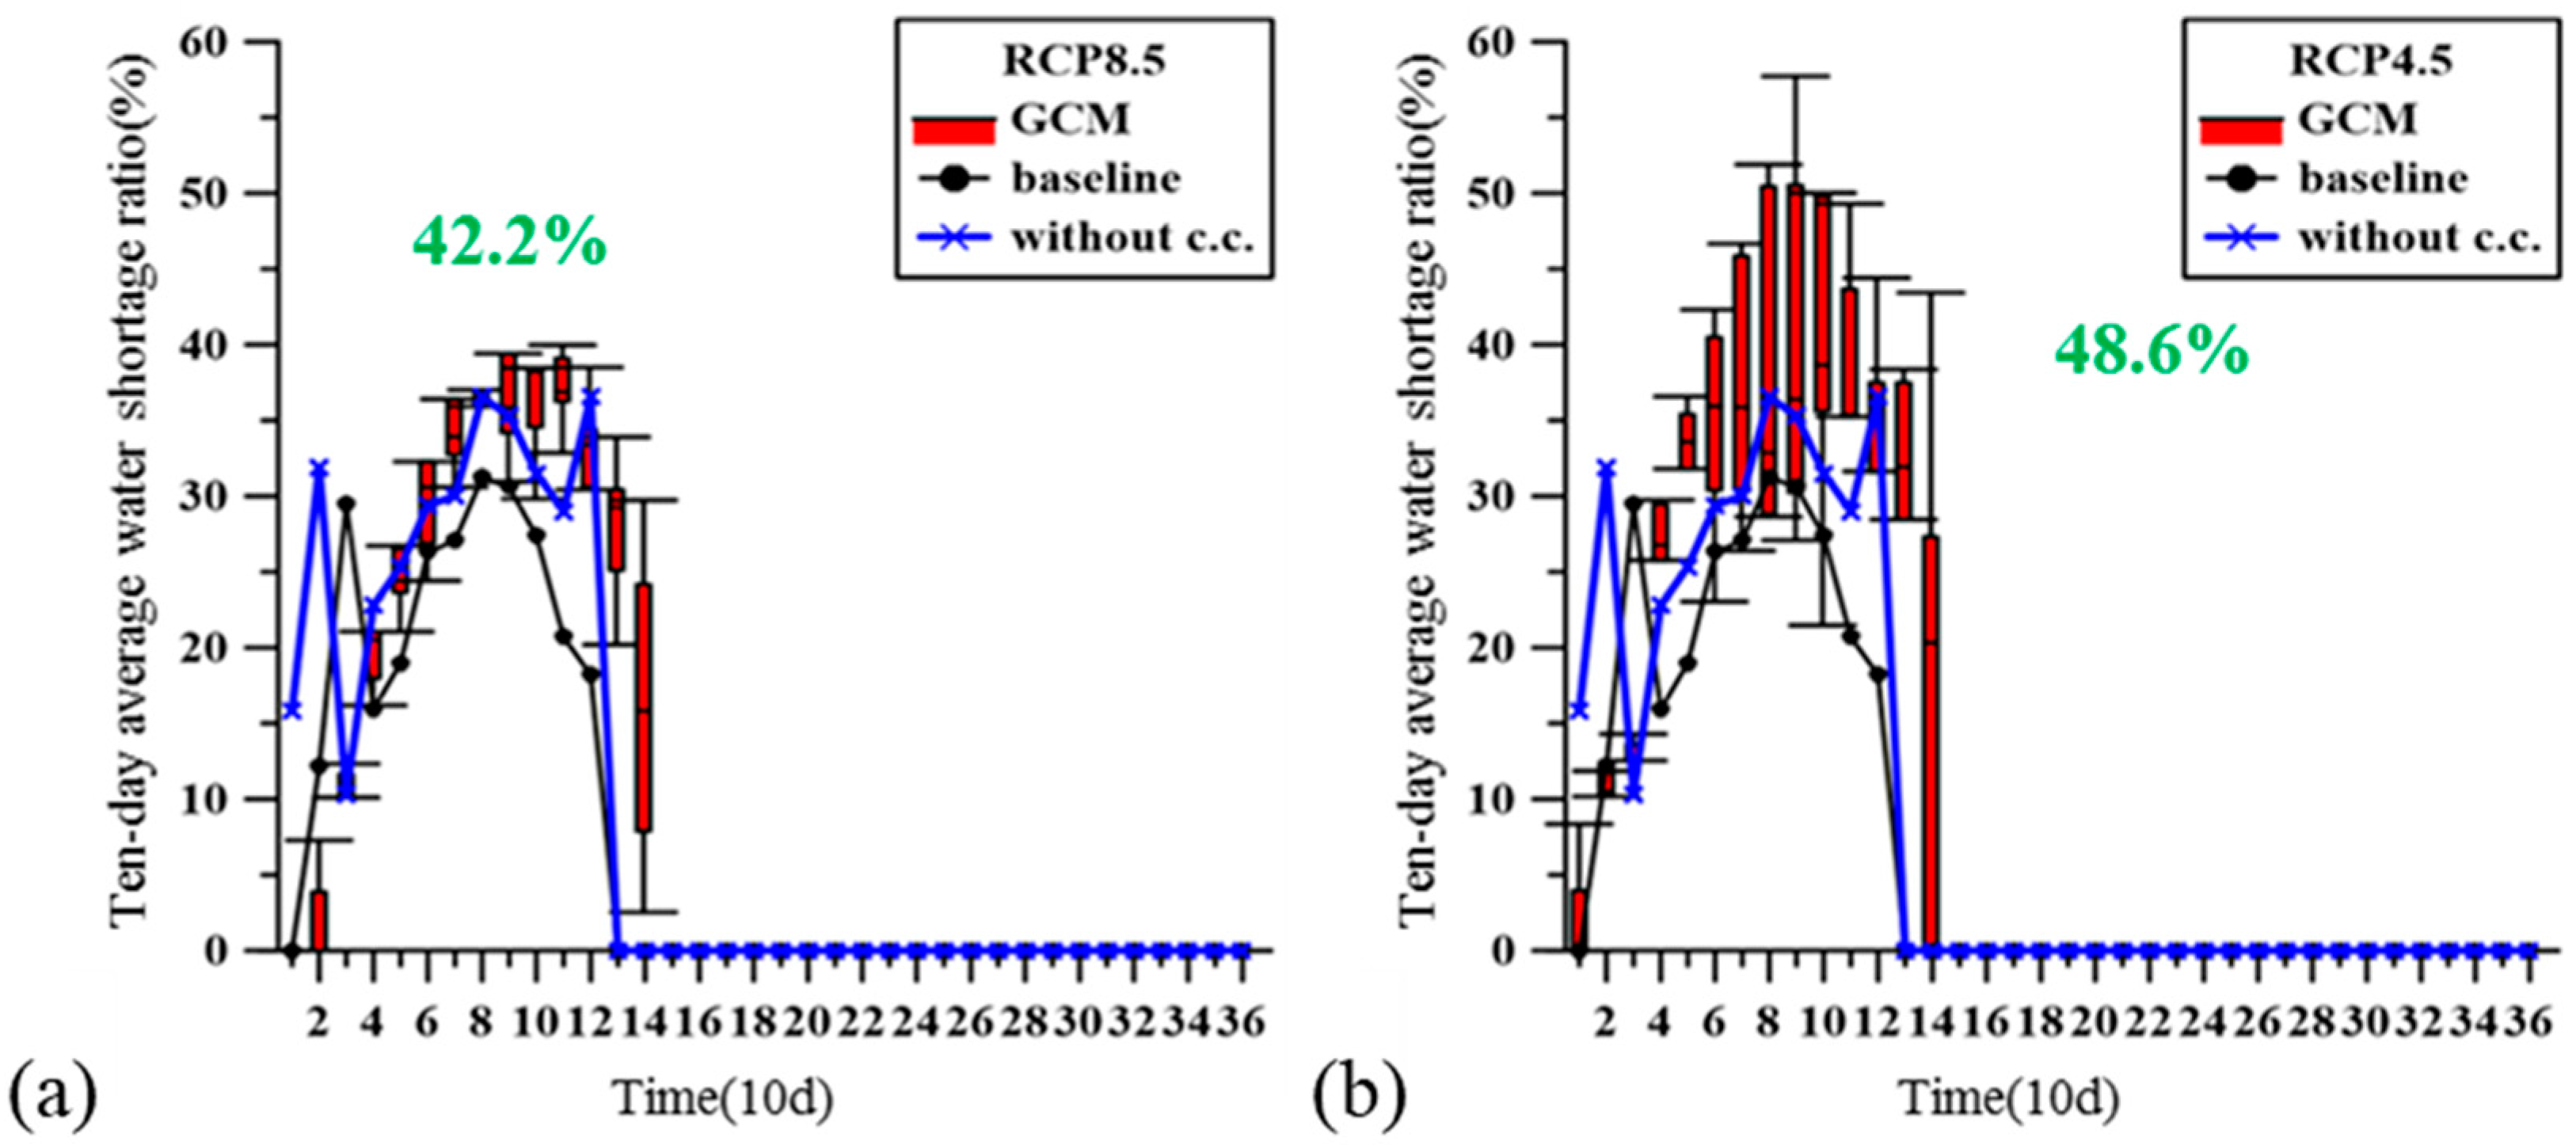
2.2.4. Future Climate Risk Assessment
First, the future risk assessment generates future weather data based on future climate scenarios. Then, the future climate risks are simulated using the generated weather data and estimated water demands of different water uses, which were modified according to the future climate and social-economic scenarios. The weather data in the baseline and future scenarios, which were generated on the same modeling basis, can be compared to examine the changes because of climate change. Moreover, by comparing the derived climate risks of the company in the baseline and future scenarios, the changes because of the climate and social-economic scenarios can be clarified. The causes of the risks are identified and related to the climate and social-economic scenarios. Hazard is mainly affected by climate scenarios, such as the stream flows in both wet and dry seasons. Exposure, such as the water supplies and demands of other water uses, and vulnerability mainly vary with the social-economic scenarios. The analysis of the causes of the risk helps to identify the origin of the risk and propose suitable adaptation measures.
2.3. Identifying and Assessing the Adaptation Options
The risk assessment method is generalized to ensure its applicability to other places, so as the adaptation option identification and evaluation. With the risk information, the feasible adaptation options are first identified, and the effectiveness of the options is quantified. Then, a company can determine to implement the regional adaptation options or propose its own on-site measures.
2.3.1. Identifying the Adaptation Options
Understanding the causes of risks, i.e., the hazard, exposure, and vulnerability, helps one determine the effective adaptation options. The existing regional adaptation measures and options and the division of responsibilities can first be collected from the literatures. The adaptation measures and options implemented by the regional authorities or those requiring on-site investments of companies are identified. In addition, the companies can invest in regional adaptation measures that cannot be realized in time, or additional on-site measures considering the location, technology, financial resources, and operating objectives of the company. Finally, the feasible adaptation options are determined based on the integral assessment.
2.3.2. Evaluating the Adaptation Options
First, the criteria to rate the adaptation options are established. The most commonly used criterion is their effectiveness in reducing the water shortage risk. Then, the identified adaptation options are evaluated based on the selected criteria. There are other criteria such as the feasibility, uncertainty, and side effects of the options. Notice that the study focuses only on the field of water resources, and the analysis of the competition between adaptation options of different fields is recommended for cross-sectoral problems. Moreover, various approaches to sort or rank a set of options have been applied to evaluate the suitability of each adaptation option, such as the multi-criteria analysis and analytic hierarchy process. The main concept of these approaches is to determine the priorities of the alternatives based on the scores of the alternatives in the selected criteria and the corresponding weights of the criteria. The results support the decision-making of the company on either investing in the existing options or implementing additional on-site measures. The former helps to reduce the regional risk of water shortage and is beneficial to the company.
3. Study Case
This study focuses on developing climate adaptation plan for a company considering the climate risks and adaptation measures of both regional system and the company’s on-site system. The Sixth Naphtha Cracker Complex Park of Formosa Plastics Corporation (FPC) was selected as the study case. FPC is a self-motivated company that invests in reducing risk and increasing the resilience of the water supply in future climate and social-economic scenarios. The water used by FPC comes from the special pipelines connected to Jiji Weir. Therefore, the scope of the study includes the Chuoshui River watershed. Because this study focuses on the water supply of FPC, other industrial water uses and the domestic use are called public water use. The FPC requires 280 thousand cubic meters of water every day. The FPC has the water right during the wet seasons (May through October), but it must buy water from farmers during the dry seasons (November through April of the following year).
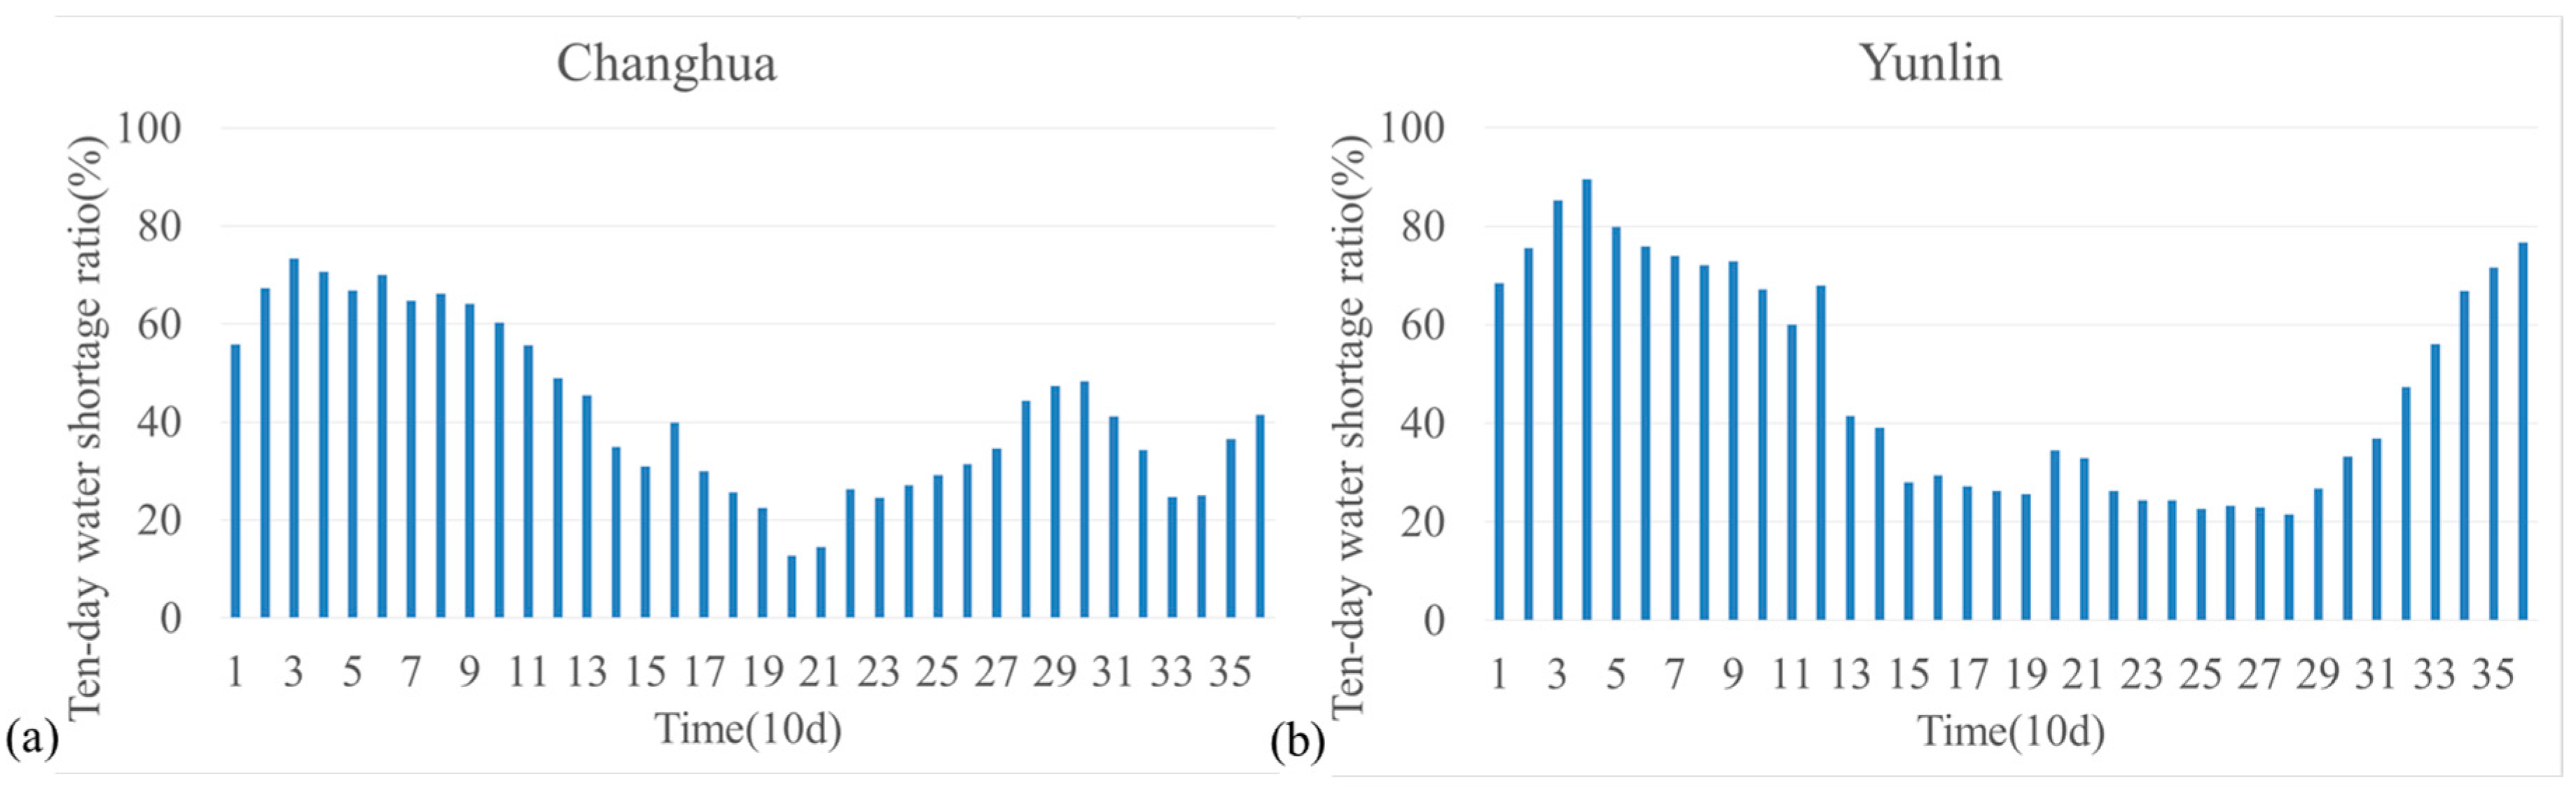
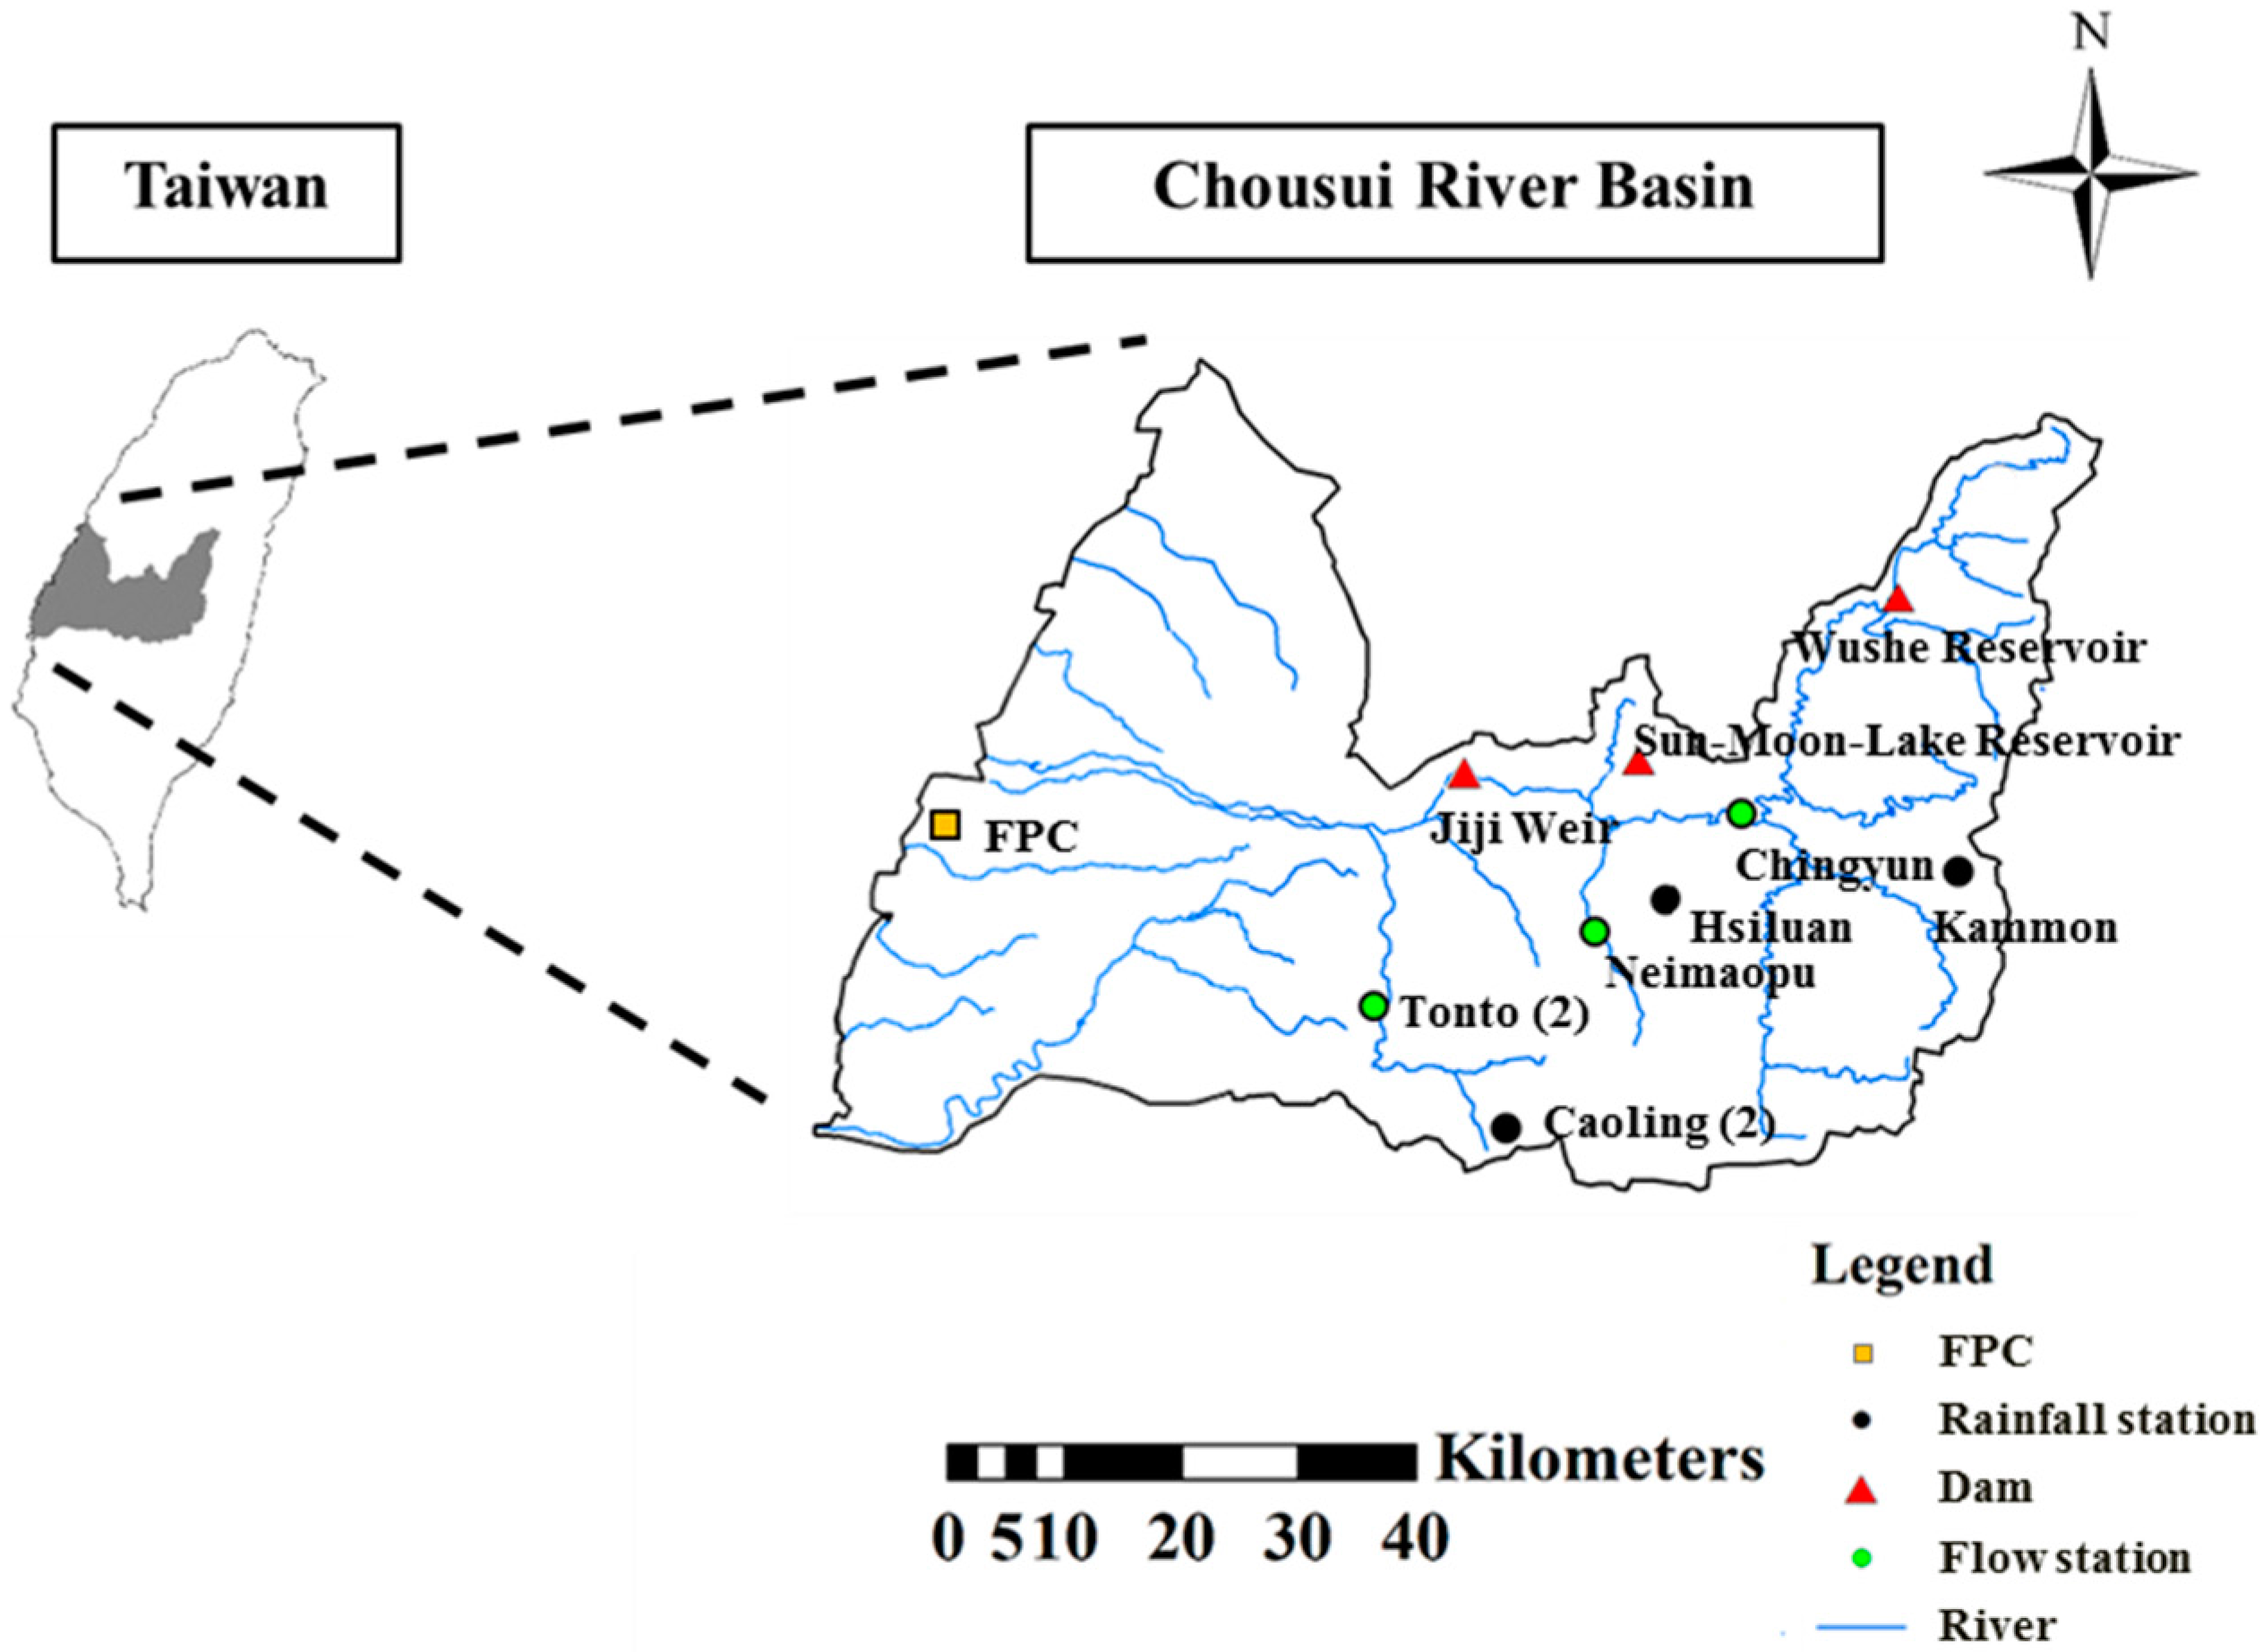
Chuoshui River is the longest river in Taiwan with a 186.6-km-long main stream. The major water demand in the watershed is from agriculture, with 1.8 and 1.5 billion cubic meters per year in average for Changhua and Yunlin, respectively. The temporal and spatial distribution of the precipitation are uneven in the watershed. Therefore, three weather stations and three gauge stations are selected based on the official report [
26], as shown in
Figure 3. The maximal difference in annual precipitation for the weather stations is 1055 mm, and the precipitation during wet seasons accounts for 76.7~85.4% of the precipitation in the entire year. The differences of monthly-average temperature within a year for all weather stations are approximately eight Celsius, and the maximum monthly temperatures are 16–22 Celsius [
27].
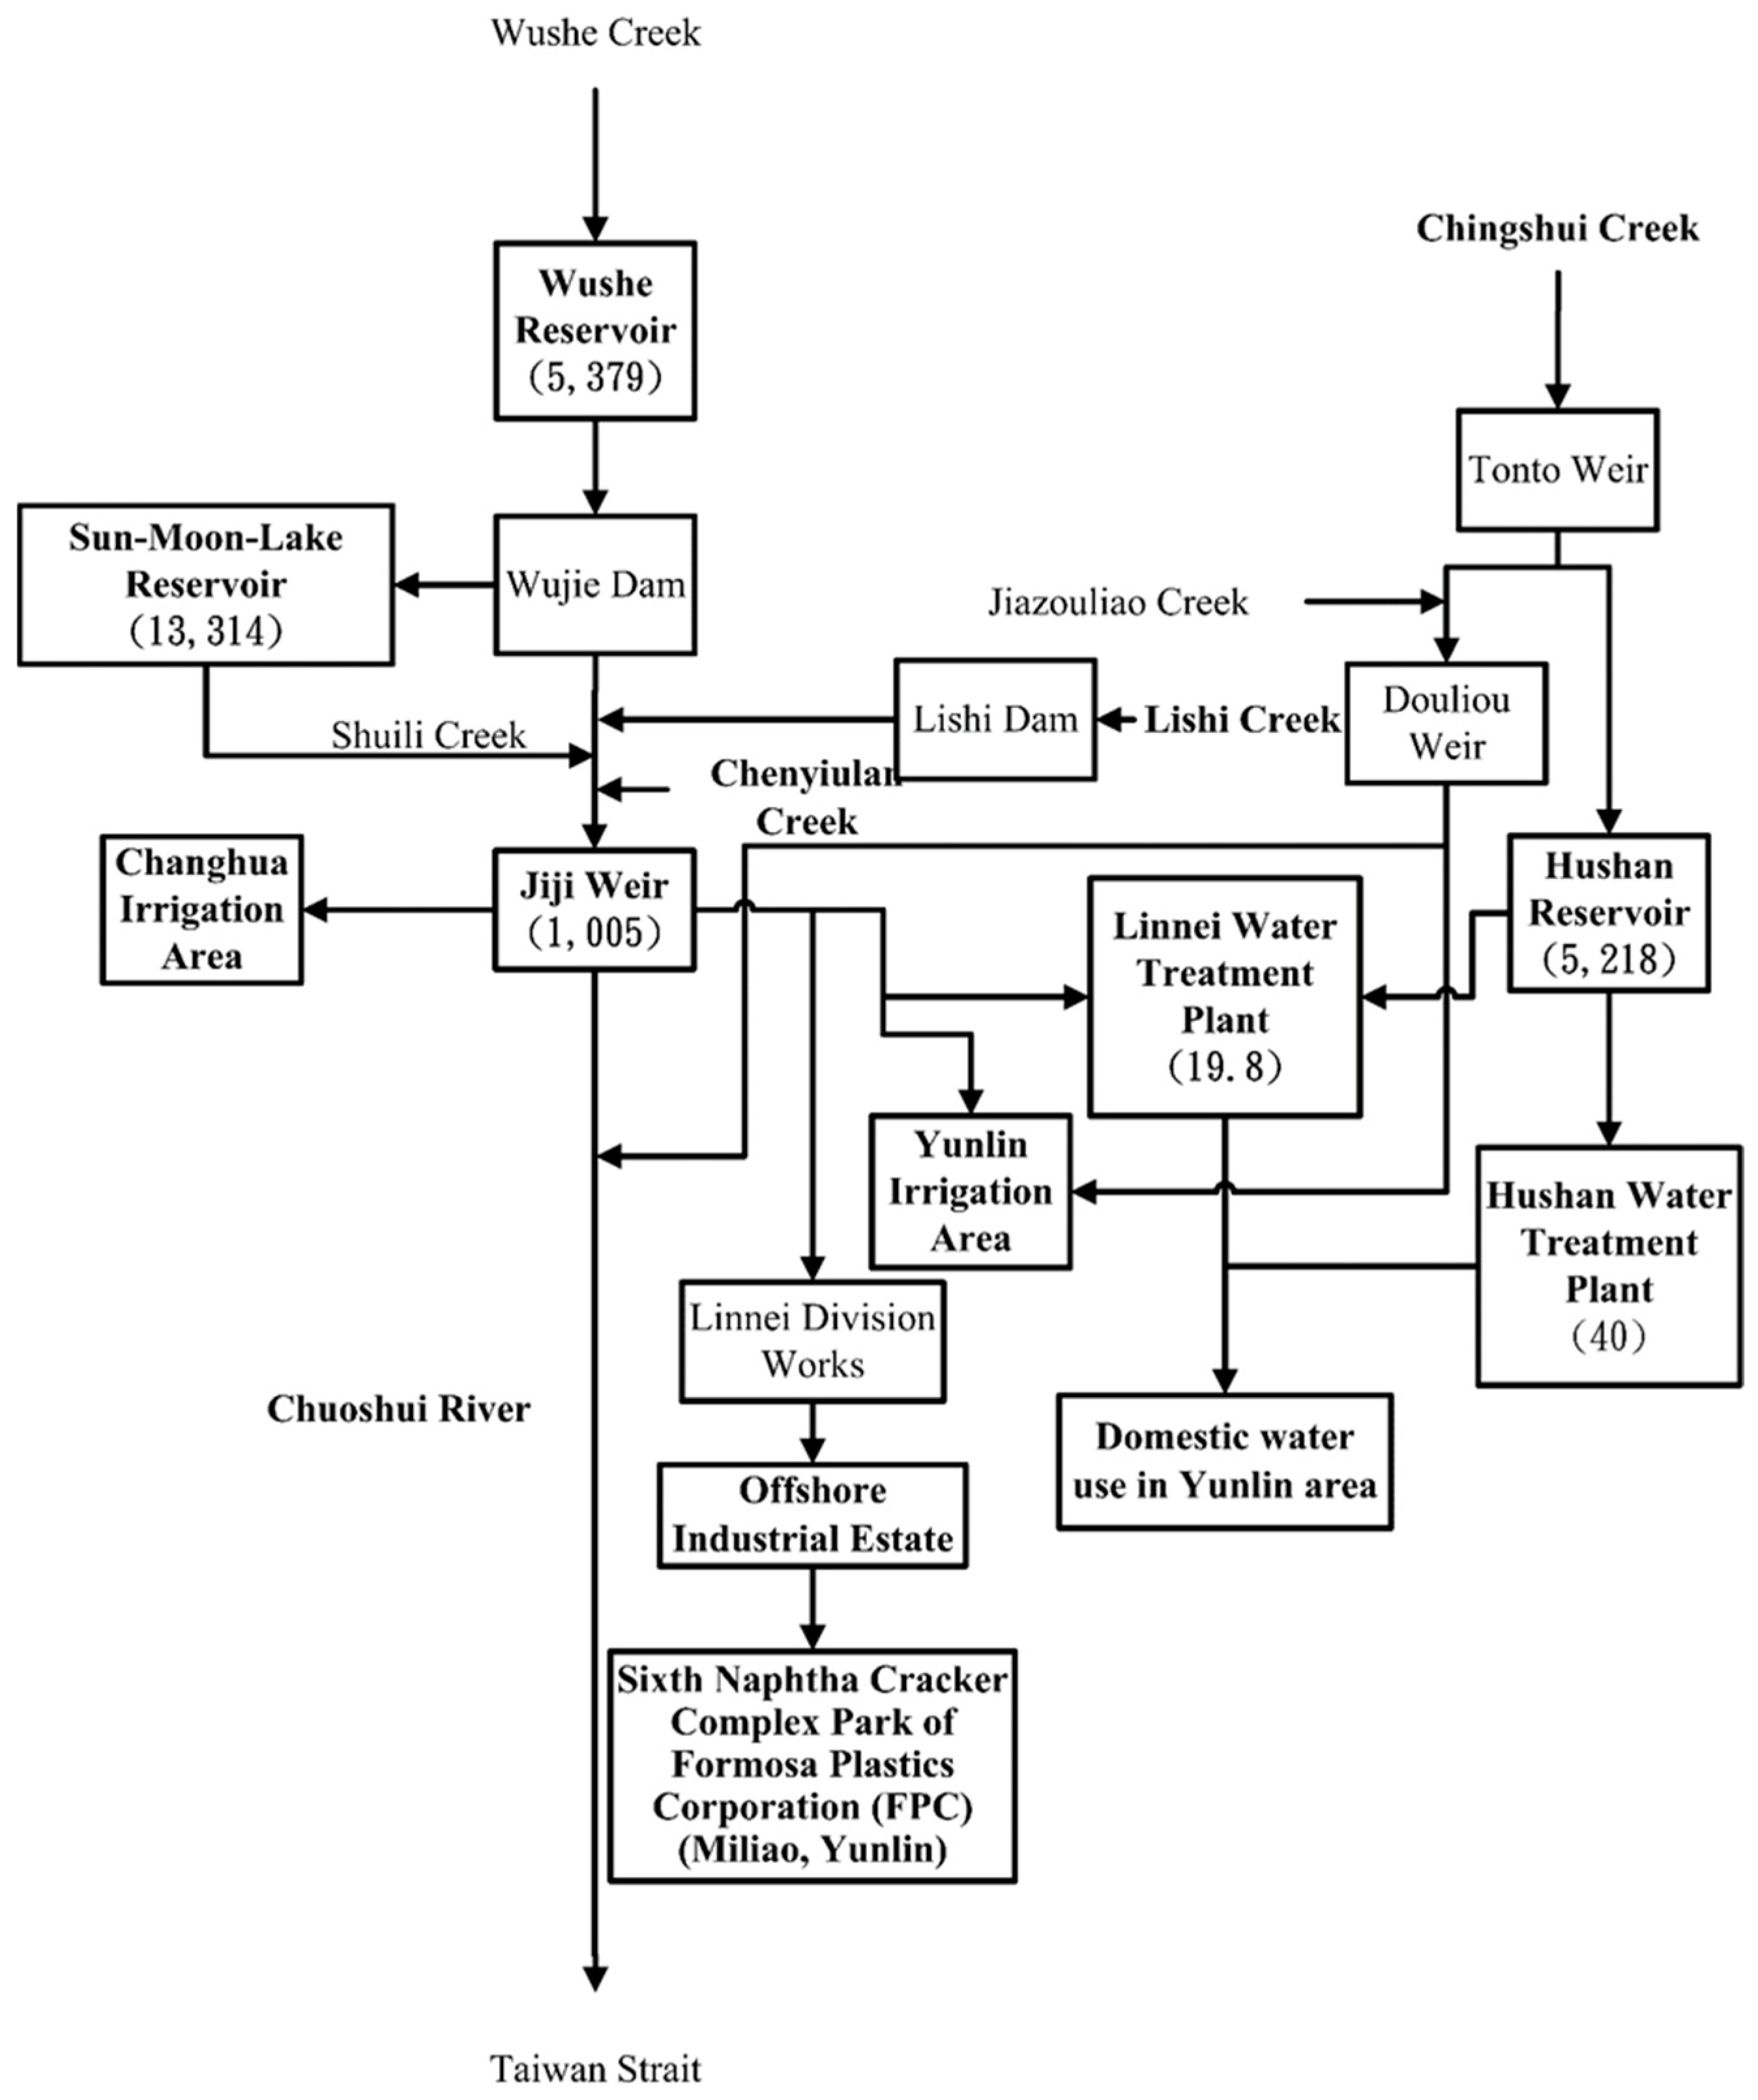
The main water supply facilities in the watershed are Wushe Reservoir, Sun-Moon-Lake Reservoir, Jiji Weir, and Linnei Water Treatment Plant (
Figure 4). The two reservoirs are also used for power generation because of the large difference in upstream elevation, and the amounts of water used for power generation are based on the operation rules of the reservoirs. Details of the facilities are described as follows.
There are two reservoirs in the Chuoshui River watershed. Wushe Reservoir is located in Wushe Creek, which is the upstream of Chuoshui River, with a drainage area of 216 km2. Sun-Moon-Lake Reservoir is an off-site reservoir with a drainage area of 520 km2. Wushe Reservoir is mainly used for power generation, whereas Sun-Moon-Lake Reservoir provides domestic and agricultural uses in addition to power generation. The discharging principles of the two reservoirs are based on the water level and operation rules of the reservoirs. Moreover, Linnei Water Treatment Plant provides most of the public use in Yunlin with the capacity of 198 thousand cubic meters per day. Based on the operation manual of Jiji Weir, the public and agricultural water uses are first supplied according to the ratio of water-right registrations, and the remainder is allocated to industrial use.
Since the water shortage of the company is highly related to the regional agricultural, domestic, and industrial water uses, the concerned issues in the regional water supply system are defined at the very beginning of the adaptation planning. A study reviewed the historical extreme weather events is used to clarify the concerned key issues of the watershed where FPC is located [
28]. Drought events directly affect the water supply system because they may cause low water level in the rivers and reservoirs and consequently different extents of water rationing in Yunlin and Changhua. It is mainly because the water supply facilities could not save water in the wet seasons for the use in the dry seasons. In addition, the typhoon events, landslides, and other types of disasters are likely to pose risks to the water supply system, such as causing reservoir siltation or other damages to the water supply infrastructures.
The causes of risks are clarified for the regional system and FPC’s on-site system to assist the risk assessment and adaptation option evaluation. The separation of the two systems helps identify the interaction of water resources between the company and the regional system. For the regional system, hazards mainly originate from the climate-watershed system, which includes the unevenly distributed precipitation and great discharge disparity between wet and dry seasons. Moreover, the exacerbation of the difference between wet and dry seasons may be more extreme in the future climate scenarios [
20]. The expansion of the science-based industrial park in mid-Taiwan, increase in domestic water demand because of population growth, and pressure of the large irrigation water demand make the regional system expose to drought events. High sensitivity is caused by the water use characteristics of the system, whereas the low adaptive capacity is mainly from insufficient water supply facilities or poor management. Agriculture is particularly sensitive to drought because of the inherent characteristics of paddy fields. Furthermore, an insufficient water supply includes lack of facilities, large water leakage, and poor management of governmental or private sectors. Combined with the difficulties in expanding the water supply capacity such as building facilities like reservoirs, dams, or weirs or using groundwater, the insufficient water supply increases the vulnerability of the regional system. Notice that the system of adaptation planning for the regional system includes the agricultural, domestic, and industrial uses.
The system that the adaptation planning in this study aims to protect is FPC. For the company’s on-site system, because almost all water used by FPC is from Jiji Weir, the hazards of the regional system pose a great risk to the FPC’s on-site system. Moreover, the growing water use for increasing production may further exposes FPC to drought risk. The exposure and adaptive capacity of FPC are partly inherited from the regional system. Although the hazard and exposure of the company are further affected by its location, the sensitivity of the company is affected by the water-use characteristics of the production. FPC has a relatively low sensitivity because it require less cooling water than other industries such as the chemical industry, food manufacturing, and textile industry. Moreover, the high vulnerability of FPC is caused by the lack of facilities and insufficient water supply because of poor management, e.g., the failure of ordering tank cars to deliver water in time.
The existing water resource management measures are analyzed based on the official report [
29]. The measures aim to reduce the water demand, increase the water supply, and enhance the water management, as described below. By providing financial incentives to fallow groundwater-supported rain-fed farming, afforestation, and water-saving facilities, the irrigation water demand can be reduced. Moreover, the water supply facilities under construction are expected to provide additional water resources. For example, the capacity of Hushan Reservoir is 312 thousand cubic meters which is expected to support the public water use. It is beneficial to FPC because the demands from Jiji Weir, where FPC uptakes water, is reduced. The actions to enhance the overall water management are: improving the cooperation of the Farm Irrigation Association Unions in Changhua and Yunlin, systematically allocating water, increasing the water usage efficiency, increasing the available water by setting up ponds, and using the return flows. Among these actions, most actions that increase the water usage efficiency of different uses are beneficial to FPC because the water right of industries is posterior to public and agricultural uses.
Then, the cause-oriented adaptation options are analyzed. The study collects the related adaptation measures and options from the Water Resources Agency (WRA) [
24,
30]. The adaptation measures and options of the Chuoshui River watershed in response to the causes of the risk are identified. Because hazard is usually controlled by reducing the emission of greenhouse gases, which is a global-scale issue, the study focuses on the adaptation options that affect the exposure and vulnerability. Options such as building reservoirs, building a regional desalination plant, or reducing the domestic water demands are beyond the reach of FPC. Notice that the water conservation of industrial use implies that the government helps the industries to save water. Moreover, some adaptation options have been proposed and evaluated by FPC, such as rainwater harvesting, which should be performed by FPC.
5. Discussion
Because the water rights of public and agricultural uses are prioritized over FPC, the water shortage of agriculture and FPC in the Chuoshui River watershed are identified in the current climate risk assessment. The results confirm the importance of the research goals, which is to minimize the risk of water shortage for FPC. Moreover, the results of the baseline climate risk assessment approach that of the current climate risk assessment, which indicates that the generated weather data and estimated water demands can provide reliable results of the climate risk assessment for different water uses. The future climate risk assessment shows that the public water use may still be fulfilled if the Shortage Index (SI) is equal to 1. The main reason is that the Hushan Reservoir supplements the deficit of the water supply of Jiji Weir. The more severe water shortage of agriculture and FPC in the dry seasons ensures the necessity of implementing after identifying and evaluating the adaptation options. The causes of increasing risks help identify proper adaptation options. Increasing hazard is caused by the exacerbated variation of precipitation in the wet and dry seasons. The larger exposure originates from the increasing water demand for industrial and agricultural use because of the development of industrial park and potential increasing evapotranspiration in the future, and it further affects the FPC water use. Moreover, insufficient water supply facilities and capacities cause high vulnerability when there are increasing demands, particularly in the dry seasons.
This study shows the identified adaptation options are able to reduce the risk of water shortage in the dry seasons. The study collects the related adaptation measures from official reports and determines the feasible adaptation options for FPC. The study mentions briefly the cost, location, effects on ecosystem of the adaptation options and also quantifies the effectiveness of the adaptation options. Detailed analyses on the principles to select feasible options including the location, technology, financial resources of an industrial company concerning the adaptation options are left for future studies focusing on implementing the adaptation options. The adaptation option, which consists of waste-water reuse and sea-water desalination, is the most effective one among the selected options. It implies the necessity of evaluating the effectiveness of each adaptation option using the system dynamics model of the watershed. Instead of only analyzing the expect effect of individual adaptation option, the water resources directly supply FPC should be evaluated considering the water resources in the entire watershed. Then, the results are generalized for the reference of other studies. The risk assessment and adaptation measure identification of the company require regional information. Moreover, some adaptation measures that the company implements help reduce the water shortage of the region and benefit the company itself.
6. Conclusions
The objective of the adaptation of FPC is to minimize the risk of water shortage. The risk assessments and the adaptation measures of the watershed are considered as boundary conditions because the water use of FPC is influenced by the water supply and demand of other users. FPC has to analyze the risks or adaptation measures by itself because the information is not provided by either the central or the local governmental agencies. The study uses the observed flow data to verify GWLF model and water supply system dynamics model. The simulation of the flow of Jiji Weir is consistent with the observation as a whole, which shows that the models are representative for the simulation of the water resources allocations of the study area. The water shortage of FPC is mainly in the dry seasons because the water rights of public and agricultural uses are prioritized over industrial use. Based on the regional adaptation measures proposed by the government, FPC can either invest in existing measures or implement additional on-site measures on its own. The considered adaptation options including water reuse, a desalination plant, smart agricultural water management, and rainwater harvesting. The results show that the waste-water reuse and sea-water desalination are the most effective adaptation options, which reduces the water shortage risks 33–44% per day in the return period of ten years.
A qualitative goal should be set up at the beginning of adaptation planning, and the tolerance of water shortage for a company should be set to more precisely assess the risks and evaluate the adaptation options. This study estimates the agricultural water demand in future climate and social-economic scenarios, but the planting area and type of plant in the future social-economic scenarios are assumed unchanged. Future studies that analyze the changes of these parameters in the future will more realistically estimate the future agricultural water demand. In addition to the effectiveness of each adaptation option in reducing risks, other criteria such as the feasibility and uncertainty can be considered. The results of the study show that the risk assessment and adaptation options proposed by the governments for a region help a company build the adaptation capacity. To ensure the effects of climate change adaptation, further research on planning and implementing the adaptation pathways and monitoring and modifying the adaptation plan is required. The considerations of both governmental regional adaptation options and private company’s on-site measures to develop adaptation pathways are necessary in future studies, to dynamically respond to future climate and social-economical changes. By developing, monitoring, and modifying the adaptation pathways, a company is more likely to achieve its goal of adaptation and maintain the risk of water shortage within the acceptable level in future climate and social-economic scenarios.


