Abstract
The work presents a methodology to assess the coastal impacts during a storm event which caused significant damage along the promenade at Aberystwyth, Wales on the 3 January 2014. Overtopping was analysed in detail for a section of promenade by downscaling offshore wave conditions to force a surf zone hydrodynamic model, NEWRANS. Overtopping discharges are computed and were in qualitative agreement with published discharges for the level of damage observed along the promenade. Peak storm conditions were observed to arrive just before and during high tide at Aberystwyth, which in addition to a storm surge and wave-setup, contributed to the damage observed. A high frequency of overtopping occurs during peak high tide, with overtopping also occurring in the hour leading up to and following high tide. Finally, comparisons to design methods for the estimation of overtopping discharge were made. Current empirical formulae underestimated the peak overtopping event at high tide. The methodology applied is generic and applicable to any location.
1. Introduction
Coastal flooding is an important topic during extreme weather events. Flooding and the associated damage can result in significant economic impacts for the local area and beyond. A combination of high astronomical tides and extreme weather events can result in devastating effects along the coastline. An example of this is during the winter storms of 2013–2014. Approximately 12 major storm events occurred in the UK during the winter period of 2013 and 2014, from December 2013 to March 2014. Individually, the storms were unremarkable; however, the clustering and persistence of the storms made the whole winter period significant, making it the stormiest period of weather the UK had experienced for 20 years [1]. Total economic damage for England and Wales during the winter period was estimated to be between £1000 million and £1500 million, including the damage associated with fluvial and groundwater flooding, [2]. Detailed meteorological analysis of the storms and their impacts can be found in [1].
The impacts of climate change may increase the occurrence of coastal flooding [3] and the increase in sea level will increase the possibility of coastal flooding through decreasing the distance between crest of coastal structure and mean water level (the freeboard). Therefore, suggesting coastal flooding events, such as the ones that occurred during the winter period of 2013–2014, are likely to become more frequent ([4,5,6,7,8]). Being able to fully understand the extreme coastal flooding events that occurred during the winter period of 2013 and 2014 will help build understanding required for coastal flood forecasting, risk assessment, and hazard mapping.
Wave overtopping occurs when a portion of an incoming wave passes over the crest of the structure. Overtopping leads to coastal flooding and damage along the coastline, and usually occurs during a combination of large waves and high water levels ([9,10]). Storm surges, wind and wave set-up and high tides result in high water levels. High water levels usually occur in the presence of low pressure weather systems, which can create large waves and wind set-up, resulting in the perfect combination for wave overtopping and coastal flooding ([11]).
This work aims to implement a methodology to allow for the detailed analysis of overtopping during an extreme event that occurred during the winter storms of 2013–2014 in the UK. By applying a validated numerical model to simulate the overtopping at the Aberystwyth sea wall, it will be possible to analyse the extreme overtopping event in more detail. Previous applications of an integrated model system for the assessment of coastal flooding events have applied a ‘clouds to coast’ approach to assess ensemble prediction methods at Newlyn, Cornwall, [12], and a shallow-water Boussinesq model (SWAB) to assess the impacts of climate change at Walcott forced by climate models [13].
In this paper, we are not solely interested in the analysis of observed conditions, but also the applicability of the numerical models to assess observations not easily obtainable during storm events (i.e., overtopping discharges). By developing a further understanding of the methods used to model and measure extreme events it will be possible to apply the methods to further non real-time and possible real-time investigations, as well as building on the knowledge of the effects extreme events have in specific locations.
The study begins by introducing the case study and providing further information about the storm. The third section introduces the models used, their setup and application to the case study. The fourth section provides the results of both the wave model and the overtopping results obtained from the NEWRANS model. The fifth section provides a discussion on the results and analysis of overtopping beyond the normal discharge measurement. Comparisons of modelled overtopping discharge to estimated discharge with EurOtop, [10], empirical formulae are also made. This is followed by concluding remarks.
2. Case Study Area
Aberystwyth is located within Ceredigion, West Wales along Cardigan Bay, Figure 1. It is has a seafront promenade of approximately 1.8 km with a predominately sandy foreshore, Figure 2. Due to the nature of its open location, the seafront is vulnerable to significant storms that can generate large wave action, which results in overtopping of the sea defences.
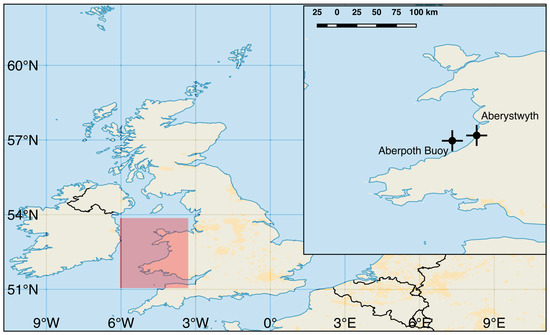
Figure 1.
Locations of Aberystwyth and the Aberporth Buoy.
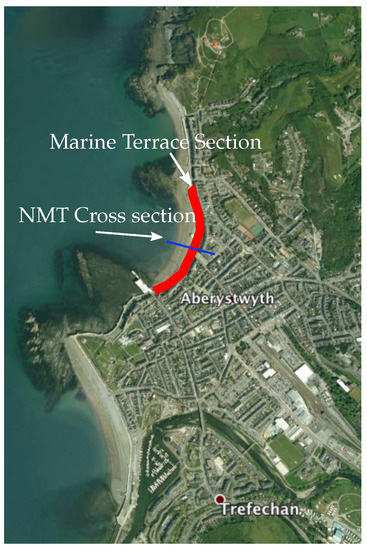
Figure 2.
Map showing the Aberystwyth promenade and North Marine Terrace (NMT) cross section.
During the winter period of 2013–2014, a storm on the 3 and 4 January 2014, here on in referred to as Storm A, caused significant damage to the promenade and localised flooding occurred along the sea front (see Figure 3). Local residents along the seafront were evacuated to rest centres and the total estimated cost of repairing the promenade was up to £1.5 m [14]. Storm A coincided with a perigee new moon spring tide, which in addition to the generated storm surge, contributed to the damage and localised flooding. The low pressure system moved quickly across the Atlantic and deepened to the west of Ireland at 0000 3 January UTC. Further meteorological details, including pressure charts of Storm A, can be found in [15]. The movement and development of the storm enabled the creation of trapped fetch conditions, where long-period swell waves are created and travel at the same speed as the storm. Trapped fetch conditions result in the arrival of both the storm conditions and long-period swell waves [16]. Swell waves are more likely to overtop sea defences than wind-waves due to the longer wave length and resulting longer run up [17]. Some overtopping formulae have a positive correlation with wave period [18]. Overtopping discharge can increase when swell waves coincide with increased water levels and increased wave action, such as during trapped fetch conditions.

Figure 3.
Photos demonstrating the damage along the promenade. The Bandstand lies on cross section North Marine Terrace (NMT).
For this paper, the Aberystwyth seafront is split into three sections according to the name of the promenade section, north section being Marine Terrace, middle section New Promenade and south section, South Marine Terrace (see Figure 2). This paper will concentrate on a cross section along Marine Terrace. Damage to the seawall was observed within this section and it is also perpendicular to the shoreline, validating the use of the 2D cross sectional NEWRANS model. Cross section NMT (North Marine Terrace) is used for the overtopping modelling and is highlighted in Figure 2.
3. Materials and Methods
The purpose of this paper is to develop a methodology for assessing the impacts of extreme coastal conditions on a local scale. The impacts of Storm A at the Aberystwyth promenade will be assessed and the methods used will be tested. In order to do this, meteorological storm conditions need to be downscaled from global conditions to local wave conditions, and finally to the surfzone and resultant overtopping. For this paper, this is applied through three nested WAVEWATCH III models, where the spectral output is then taken to force the surfzone and overtopping model, NEWRANS. Statistically averaged parameters of wave conditions are available from the National Centers for Environmental Prediction (NCEP) archive. It is possible to generate a spectrum from the parameters available to force the surfzone model, and thus a wave model would not be required. However, as trapped-fetch conditions were hypothesised to have occurred, statistically averaged parameters may not fully represent the bimodal conditions observed. Setting up a wave model allowed spectral output and flexibility in output location. A similar approach was developed by [12] to assess an ensemble modelling framework. However, a nearshore wave transformation model, SWAN, was used to take outputs from the global model in the nearshore zone to the surfzone. The first part of this section describes the WAVEWATCH III setup and nested domains and the wind forcing used. Followed by the setup of the NEWRANS model and the bathymetric and water levels used.
3.1. Wave Model
The wave model used to simulate the offshore wave conditions is WAVEWATCH III version 4.18 [19]. The model setup is based on default conditions with spectral resolution of 25 frequencies and 24 directions, with the default frequency range of 0.04177–0.411 Hz. The model is setup with a total of three domains: Atlantic Ocean; continental shelf and UK waters, southwest UK and Welsh regional waters (see Figure 4). The domain sizes and resolution including the model settings are defined in Table 1. The bathymetry was taken from the ETOPO1 global bathymetry data set. Boundary conditions for the nested domains were provided along the defined boundary area of each nested domain. The Atlantic and UK domains were forced by Global Forecast System (GFS) winds provided by NCEP at a resolution of 0.5 degrees. The model started with calm initial conditions and a ‘warm-up’ period of 7 days was simulated to build up the conditions for Storm A on the 3 and 4 January and help improve accuracy. The model runtime was from the 25 December 2013 until 8 January 2014. By running the wave model in parallel, across 4 nodes and 8 processors, the simulation took approximately 3 h. The impacts of the extreme conditions at the local overtopping scale were of interest so a tide model was not considered to be necessary for the wave model, as it is only the wave conditions that will be required as output. It has been found that WAVEWATCH III does not improve in overall Root Mean Square Error (RMSE) with the addition of tides and currents [20]. Tidal variations are included in the surfzone model.
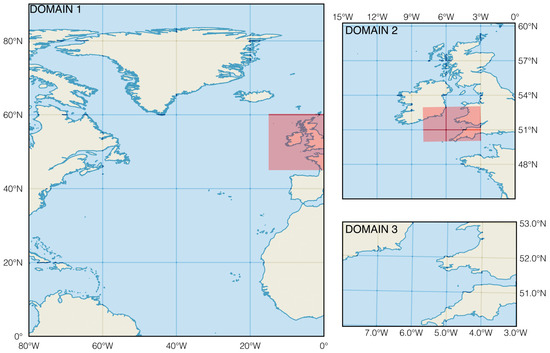
Figure 4.
The three nested domains of the WAVEWATCH III model. Shaded areas highlight location of the nested domain.

Table 1.
WAVEWATCH III nested domain setups.
To validate the WAVEWATCH III model from the Wales nested domain, model output was compared to the observed conditions from the Aberporth wave buoy during the period of Storm A. The wave buoy is located 20 km south of Aberystwyth and 2.6 km offshore at 52.220° N 4.420° W at a depth of approximately 20 m (Figure 1). The buoy is owned and maintained by the UK Met Office and data was obtained through the British Atmospheric Data Centre (BADC). Figure 5 plots the modelled and observed wave heights at the Aberporth wave buoy location (see Figure 4). The output from the wave model shows good agreement with the observed conditions at Aberporth providing confidence in its application for this study. A Root Mean Square Error (RMSE) of 0.59 m is determined between the observed and modelled wave heights. The model is able to replicate the key increases in wave height associates with the storms arrival; however, as a tide model is not included in the wave model, it does not replicate the peaks and troughs in observed wave height associated with water level variations.
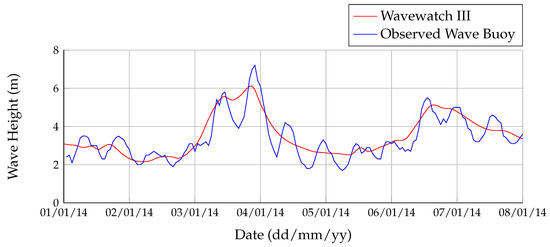
Figure 5.
Observed wave height and modelled wave height for Aberporth buoy location.
3.2. Surfzone and Overtopping Model
To simulate the wave transformation from nearshore to overtopping the promenade, the 2D numerical model, NEWRANS, will be applied. The NEWRANS model, originally developed by [21] solves the 2D Reynolds-averaged Navier–Stokes equations by decomposing the instantaneous velocity and pressures fields into the mean and turbulent components. Reynolds stresses were described by an algebraic non-linear κ − ϵ turbulence model. The volume-of-fluid VOF functions, developed by [22], allows the capture of large deformations in the water surface caused by overtopping and wave breaking. The numerical model has been validated and used extensively for overtopping application previously (see [12,23,24,25]). Further descriptions of the model can be found in [21,26].
The NEWRANS model is a 2D vertical slice and is therefore restricted in only modelling waves that approach perpendicular to structures. Wave analysis results provided by the Ceredigion Council (Ceredigion, Wales) in a project appraisal report (PAR) for modelling the Aberystwyth promenade suggested the the potential worst case offshore wave directions were Westerly and West-North-Westerly. Modelled wave conditions, which, in addition to observations from YouTube videos, provide satisfactory reasoning that the waves approach perpendicularly to the Aberystwyth promenade, therefore justifying the use of a 2D numerical model for this location.
The bathymetric data in the NEWRANS model is taken from the General Bathymetric Chart of the Oceans (GEBCO) provided by the United Kingdon Hydrodynamic Office (UKHO) for the cross-shore distance 0–900 m, where 0 m is point of wave generation in the NEWRANS model. An initial depth is taken from the GEBCO data and an average depth increase is taken up to the 900 m cross-shore distance. At this point to the promenade (900 m to 1062 m), the depth is taken from the beach profile provided for transect NMT from the Project Appraisal Report provided by Ceredigion Council, which was obtained through LIDAR data profiles of the Aberystwyth sea front. The beach and seafront is considered as impermeable and smooth to represent a worst case scenario. The model was setup as 1068 m × 28.8 m with a fixed grid of = 0.32 and = 0.6, totalling 1780 cells in the x-direciton and 110 in the z-direciton (see Figure 6 for the domain and setup of the model).
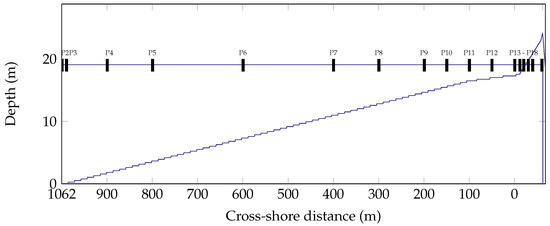
Figure 6.
Domain of NEWRANS model including probe locations.
Spectral output is taken from WAVEWATCH III at a location 1.6 km offshore from Aberystwyth with the coordinates 52.42° N 4.1° W. From the output spectra, a 60 min long wave train is derived. The wave train is then used to force the NEWRANS model. Wave generation and active absorption are important when modelling coastal structures; for cases where long period waves (swell waves) may be present, it is important to ensure that any reflected waves from the shoreline are adequately absorbed at the generating boundary. The waves are generated in the flume using the wave paddle method as described and recommended by [26], where two wave generation methods were tested in generating and absorbing bimodal waves in the NEWRANS model.
Water level is an important consideration when investigating wave overtopping. High water levels can contribute considerably to wave overtopping despite wave heights being small. High tide occurred at in Aberystwyth on 3 January 2014 at 9:20 p.m. Water levels are provided by the PAR from the Ceredigion Council, where interpolation between two key gauge stations was performed using a tide-surge numerical model. Tidal data was used to inform the development of a weighted model tide curve, which incorporates the distortion around high water due to surge. The tidal curve was derived from the dimensionless shape tide (tidal height/tidal range) based on 1 in 75 year events recorded at the nearby Class ‘A’ tide gauge at Barmouth. Table 2 provides the water levels used for each hourly period. Wave sequences are generated for hourly tidal water levels from 6:00 p.m. on 3 January 2014, to 12:00 a.m. on 4 January 2014.

Table 2.
The water level used for each hourly interval modelled in NEWRANS. Water level is provided with reference to Ordnance Datum Newlyn (ODN).
The overtopping discharge is commonly determined through a collection tank behind the structure. This work calculated the overtopping discharge from the flow depth and velocity using the availability at the crest of the structure. For cells that are partially filled, the discharge was calculated using the VOF function. A collection tank was therefore not required, and allowed the overall domain of the NEWRANS model to be reduced in length. As no direct discharge amounts of overtopping were collected during the storm at Aberystwyth, it is difficult to confirm whether the modelled discharge directly match the observed discharges. However, by using the critical damage levels associated with overtopping by [27] and comparing the modelled overtopping results, it is possible to determine whether the modelled overtopping values are representative of the damage observed along the promenade.
4. Results
Outputs from the wave model were obtained leading up to, during, and after Storm A, as shown in Figure 7 for significant wave height () and energy wave period (). As mentioned in the previous section, high tide occurred at 9:20 p.m. in Aberystwyth on 3rd January. The results show that highest wave action coincided with high tide, contributing to the damage and localised flooding observed along the promenade. Large significant wave heights are modelled at 9:00 p.m. for most areas around South West Wales and it is clear the high waves are able to reach the region of West Wales with waves ranging from 2 to 3.5 m observed along the coastlines. A high mean energy wave period is observed across the whole coastline at 9:00 p.m., reaching 14 s at open shores. This would confirm the suggestion that Storm A had the suitable track and speed to generate trapped fetch conditions ( [16]) as long period waves are modelled to arrive with the storm. The mean energy period is a wave period weighted by the amount of energy contribution to the overall spectrum by the frequencies. When low frequency waves contribute most to the overall spectrum (i.e., more energy in lower frequencies), the mean energy period would be weighted to the low frequencies of the spectrum resulting in a longer period value. High values of are observed across the whole domain during the arrival of Storm A, suggesting that trapped fetch conditions have occurred.
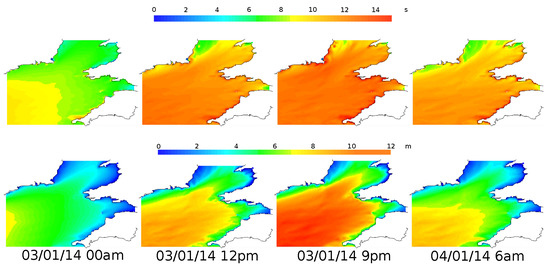
Figure 7.
WAVEWATCH III wave height and spectral period output leading up to and after Storm A. Date provided as dd/mm/yy.
Figure 8 is a wave rose taken from the spectral output of the wave model used for input of the NEWRANS model. The wave rose plots the wave directions and associated spectral energy, , for that direction. The figure confirms that the significant wave direction is Westerly and therefore confirms the suitability of the 2D vertical-slice NEWRANS model for this investigation.
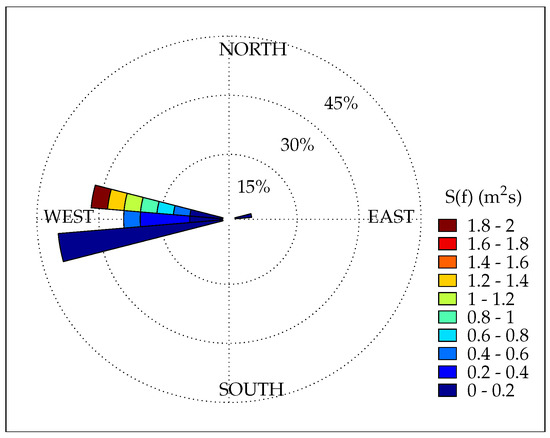
Figure 8.
Wave rose of WAVEWATCH III output at location of input for NEWRANS model.
Spectral output from the wave model was then fed into the NEWRANS model to determine overtopping discharges. Figure 9 displays the spectral inputs for each hourly period. Figure 10 plots the mean overtopping discharges for the hourly periods. During high tide, at 9:00 p.m., mean wave overtopping discharge reached 0.092 m3/s/m. Following this, 10:00 p.m. had the second largest amount of mean overtopping discharge, with 0.026 m3/s/m. At 8:00 p.m., a mean discharge of 0.017 m3/s/m occurred. A very small amount of overtopping occurred at 11:00 p.m. (0.00013 m3/s/m) and no overtopping occurred for all other hourly periods.
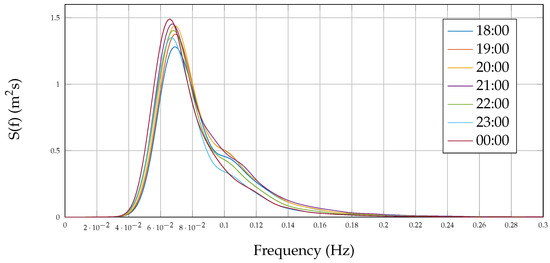
Figure 9.
Spectral output from WAVEWATCH III model used to derive a 60 min wave train to force NEWRANS.
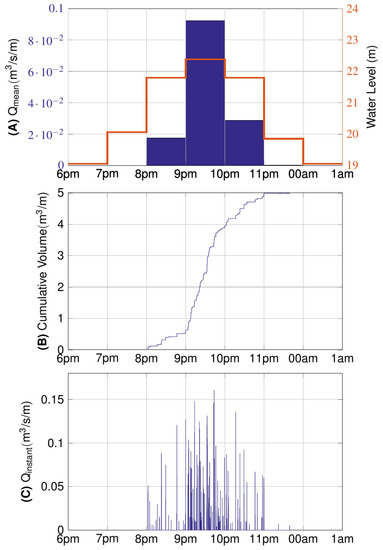
Figure 10.
Modelled overtopping discharges for each hourly period. (A) the mean overtopping rate for each hourly period and water level used in the model; (B) the cumulative overtopping discharge during the storm period; (C) the instantaneous wave-by-wave overtopping rate.
Many forecasting and non-realtime modelling methods use empirical formulae, such as the EurOtop [10] overtopping manual, to determine the overtopping discharges. By using the NEWRANS model, it is possible to observe the individual overtopping events as plotted in Figure 10. In addition to this, the influence each overtopping instance has on the total amount of overtopping can be determined by plotting the cumulative overtopping volume (Figure 10). Figure 10 shows the high frequency of overtopping that occurs between 9:00 p.m. and 10:00 p.m. The individual overtopping volumes are large and the high frequency of overtopping events is considerable. The large frequency of overtopping events significantly adds to the total volume of overtopping during the period modelled, as demonstrated by the steep rate of increase in Figure 10 between 9:00 p.m. and 10:00 p.m.
5. Discussion
The combination of high tides, a storm surge, and Storm A’s track and speed resulted in the extreme event that led to significant impacts along the coastlines. It is important to not only be able to forecast the extreme event, but to also quantify the impacts that the event may have. The purpose of this work was to develop a further understanding of the wave overtopping events that occurred. The wave model results show that wave conditions were at their greatest leading up to and during peak high tide, and then reduced in the hours following high tide.
The importance of being able to analyse such an event on an individual overtopping rate basis is highlighted in Figure 10 where the individual overtopping volumes are 100 times larger than the average discharge for the hourly period (Figure 10). Ref. [27] provides critical values of overtopping discharges. The table suggests that, for mean overtopping discharges 0.08 m3/s/m to 0.14 m3/s/m, promenade damage will occur only if it is not paved, and a mean overtopping discharge value greater than 0.14 m3/s/m will cause damage to a promenade even if paved. The promenade at Aberystwyth is clearly damaged as seen in the photos of Figure 3. The average overtopping discharge during peak high tide reached 0.092 m3/s/m, suggesting it would damage an unpaved promenade. However, Figure 10 suggests that the individual overtopping events that occurred during the hourly period were very large. A total of 160 overtopping events occurred for the hourly period of 9:00 p.m.–10:00 p.m. Comparing the individual events to the limits of overtopping for people and vehicles, as described in Table 3 in [10], suggests that the maximum tolerable volume of overtopping for people at a seawall with a clear view of the sea (low crest) is 0.6 m3/s/m. Individual overtopping volumes larger than 0.6 m3/s/m began an hour before high tide (see Figure 10), although less frequently than during peak high tide. This is clearly an important issue, and being able to visualise the individual overtopping events provides first responders with the knowledge that it is unsafe for the public to be along the promenade even a couple of hours preceding and following high tide.
The following sections discuss the capabilities and applicability of overtopping results that are attainable from modelling an extreme event through the methodology of this paper—firstly, the transformation of the spectra from offshore to nearshore. The spectra describes the sea state at the current location and is a useful tool to assess potential impacts. Secondly, the depth and velocity of individual overtopping is discussed. Understanding the velocity and depth of water after an overtopping event helps shape inundation and hazard maps, which are essential for coastal flood risk analysis during extreme events.
5.1. Overtopping Processes on Landward Slope
The post overtopping characteristics of flow thickness and velocity is an important consideration for flood risk assessment and hazard mapping. By understanding the characteristics post overtopping, it is possible to map inundation of the water flow and the velocities at which it may flow. Figure 11 plots the velocity and flow depth during the largest overtopping event (in terms of discharge) during the hourly period at 9:00 p.m. Maximum flow depth occurs during the middle of the overtopping event, peaking at 1.24 m. Maximum velocity occurs at the end of the overtopping event peaking at 20 m/s. Example data suggests that overtopping velocities of 5–8 m/s are acceptable limits for overtopping (as defined by [10], Section 3) during maximum overtopping discharges of 0.01–0.03 m3/s/m; however, for steady flow, the limits of horizontal velocities for people and vehicles is below 2.5 m/s [28]. The modelled velocities go beyond these values, contributing to the observed damage along the promenade and also validating the evacuation of the promenade and local residents.
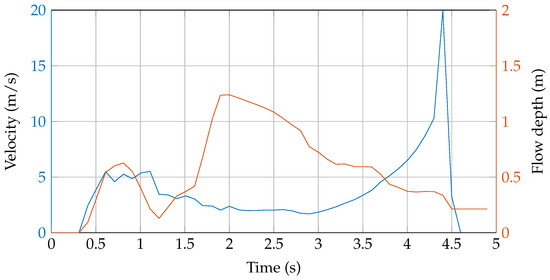
Figure 11.
Modelled flow depth and velocity on landward side of structure for the maximum individual overtopping event during Storm A.
By extending the domain of the NEWRANS model to include specific geometry of the promenade beyond the crest at Aberystwyth, it would be possible to quantify the momentum of the overtopping wave and its resultant movement and velocities further inland. As the geometry data is not available, this has not been performed in this paper. However, the data would be a useful addition to the work presented in this paper.
5.2. Nearshore to Toe-of-Structure Wave Transformation
The application of NEWRANS allows for the analysis of wave conditions of the extreme events as they propagate towards the shoreline. Figure 12 plots the observed spectrum of each probe during the 9:00 p.m. simulation. Probe locations within the numerical flume are defined in Figure 6. The 9:00 p.m. hourly period has been chosen to demonstrate the wave spectra transformation as it is during the peak overtopping discharge period. Observed spectral shape begins to alter from initial conditions beyond Probe 13, where the depth begins to influence the wave conditions through shoaling and breaking. The wave spectra beyond Probe 13 towards Probe 18 (towards the shore) transform into a flatter spectra where the peak becomes less defined. The spectra transformations will be due to wave breaking, and as demonstrated in Figure 12, low-frequency waves are present and have gained energy as observed in the spectra. The presence of long period waves are more likely to overtop the structure and cause significant beach movement [29]. Low-frequency waves are also more likely to reflect from the shoreline if the slope and structure allow [26]. The presence of reflected waves from the shoreline would influence the observed conditions. Figure 12 suggests reflected low-frequency waves may also be occurring and YouTube videos of the event support this observation.
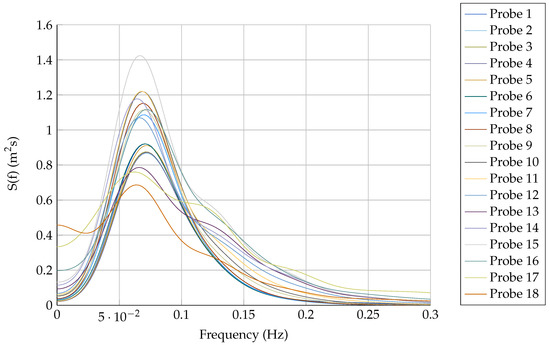
Figure 12.
Observed spectra for the 9:00 p.m. hourly period for each probe along the flume.
The transformation in observed spectra from the point of wave generation to the toe of the structure is an important consideration for coastal flood forecasting. As observed in Figure 12, the wave state can transform significantly from offshore to the toe of the structure. The transformation in wave conditions are difficult to account for in overtopping estimates using empirical formulae, as estimated discharges are based on offshore wave periods and toe of the structure wave height. Determining the wave height at the toe of the structure can be done empirically, using methods such as wave transformation by [30]. The results from the NEWRANS model allow accurately modelled wave conditions at the toe of the structure, which can be used to build a ‘look-up’ table, suitable for real-time forecasting, specifically for section NMT along the promenade. If offshore wave conditions are known, through the data provided in this paper, it is possible to equate that to a nearshore wave condition that can be used to estimate the wave overtopping discharge. However, it won’t take into account any extreme wind conditions. Strong onshore winds may influence wave breaking and also influence resultant overtopping discharge with the addition of significant amounts of spray [10].
5.3. Comparison to Empirical Formulae
As the wave conditions at the toe of the structure are known, the modelled overtopping discharge can be compared to empirical formulae defined in the EurOtop manual, [10]. EurOtop is an overtopping manual with guidance for assessing the overtopping of sea defences for a wide range of parameters and variables. Equations (5.10), (5.11) and (5.15) from the EurOtop manual provide the averages of measured data and are to be used for comparisons with measurements. The equations are provided for reference in Table 3.

Table 3.
Dimensionless discharge, dimensionless freeboard and overtopping models for the equations used in the comparisons, where q is overtopping discharge, is freeboard, significant wave height, is the Iribarren number, g is gravity, a and b are constants.
Equations (5.10) and (5.11) are the general formulae for determining the average overtopping discharge on a slope, and Equation (5.11) defines the maximum value of Equation (5.10). If the overtopping discharge determined using Equation (5.10) is larger than with Equation (5.11), the value of Equation (5.11) would be used if following the EurOtop manual. The equations include a number of influence factors for the consideration of surface roughness, berms and oblique wave attack. For the purpose of this paper, the influence factors are all set as ‘worst-case’ and are representative of the model conditions and not the exact conditions of the Aberystwyth promenade. Equation (5.15) should be used for the cases of severe wave breaking or very steep shallow foreshores.
Figure 13 plots the results of the formulae in comparison to the modelled overtopping. EurOtop Equation (5.10) provides a good estimate of the observed overtopping discharge from the model. The results suggests the waves breaking intermittently in front of the coastal defence. The observation of wave breaking in front of the structure is supported by YouTube videos of the event. Severe wave breaking does not occur hence the significant underestimation of overtopping discharge with Equation (5.15). EurOtop adequately predicts the observed discharge but does not capture the peak discharge during hour at high tide. As the wave conditions during this period were at the most severe, wave-set up would have an impact on the water level at the structure. As mean level is only taken into account through freeboard in the EurOtop equations, wave-set up is not predicted, and therefore an underestimation in overtopping discharge is likely to occur unless this contribution to water level is taken into account. Empirical equations inherently include wave set-up as the physical model test that the equations are derived from implicit reproduce wave set-up [10]. However, the wave set-up is only included in the equation for the foreshore slopes of which the physical models produced. During the high tide hourly period, the wave spectra has significantly transformed during wave propagation from offshore to toe of structure (Figure 12) and long period waves have been introduced represented through the increase in energy content in the lower frequencies. As the EurOtop formulae considers the offshore wave period, this increase in long wave periods is not wholly considered in the estimation of overtopping discharge.
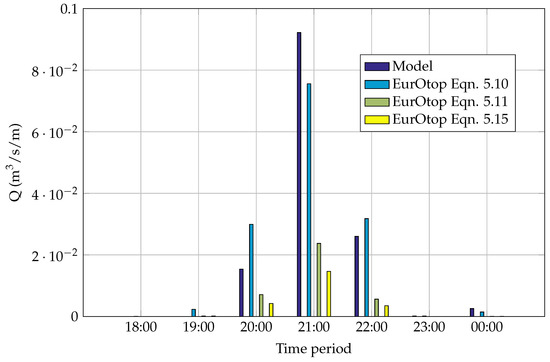
Figure 13.
Modelled and estimated overtopping discharge from Equations (5.10), (5.11) and (5.15) from EurOtop.
6. Conclusions
In this study, a method has been developed for the integration of an offshore wave model and surf zone hydrodynamics model, and has been implemented to investigate and analyse the extreme coastal wave overtopping event that occurred at Aberystwyth on 3 January 2014. The offshore wave model comprised of three nested domains, covering the Atlantic, continental shelf and UK waters, and Wales regional waters. Comparisons against wave buoy data showed the model performed well in modelling the storms track, intensity and arrival time. Spectral output was taken from the regional domain and used to force the NEWRANS model to transform the nearshore waves to the shorelines and resultant overtopping. Spectral outputs were taken hourly, and 3 h either side of high tide at 9:20 p.m. The implementation of both models worked well and replicated overtopping discharges equivalent to those observed along the promenade at Aberystwyth during the storm through comparisons to equivalent damage estimates as suggested in [10,27,28].
The arrival of Storm A coincided with peak high tide and the modelled results suggest the largest waves developed just leading up to and during high tide. Spectral wave period remained high during the storm event, and peaked with the arrival of Storm A at high tide, suggesting trapped fetch conditions were created by the storm. Overtopping occurred during the four hours of high tide, with the peak overtopping between 9:00 p.m. and 10:00 p.m. Comparisons of modelled overtopping discharge to estimate discharge by the EurOtop empirical formulae showed reasonable estimation by the formulae. EurOtop under-estimated the peak mean overtopping discharge observed at high tide (9:00 p.m.). One possible reason for EurOtop underestimating the peak discharge is due to the wave-setup caused by the increased wave action during the peak of the storm. Observed spectra during this hourly period (Figure 12) highlights the increased energy in low frequency waves at probes close to the shoreline. The increase in energy in the low frequency part of the spectra would not be well presented in the empirical formulae as the offshore spectral period, is used for estimating overtopping discharge. The method developed allowed further analysis of overtopping processes beyond discharge during the extreme event. Analysis of individual overtopping events and cumulative overtopping highlighted the increase in overtopping during peak high tide. Overtopping occurred frequently during high tide with no individual overtopping event being truly significant (i.e., much greater than other individual overtopping events during other hourly periods). The flow depth and velocity of the largest overtopping event was analysed and highlighted the dangers of the flow to people and vehicles, validating the evacuation of the promenade and local residents by the local authority during the extreme event. Further understanding of the flow depth and velocity of overtopping waves is also useful for the application of hazard mapping and coastal flood risk assessment.
This work emphasises the importance of reassessing individual coastal extreme events through methods applied in this study, allowing such scenarios to be assessed and used to build upon for engineering design, coastal flood forecasting and coastal flood risk assessment. The impacts of climate change and sea level rise may result in events such as Storm A, and the observed damage at Aberystwyth, to occur more frequently. By understanding the impact of a previous extreme event, it is possible to analyse the potential impacts future changes that water levels, storm intensity, and frequency may have on the overtopping at specific site locations. The methodology developed for this study can be applied to other locations for non-real-time modelling. The results can be used to help improve flood forecasting specifically for Aberystwyth.
Acknowledgments
The authors would like to acknowledge the Natural Environment Research Council (NERC) for the funding as part of a PhD studentship (Grant No. EGF406). The authors would also like to thank Ceredigion Council for providing the project appraisal report.
Author Contributions
Daniel Thompson performed the setup and application of the wave model and surfzone model and the analysis of results. All authors read and approved the final manuscript.
Conflicts of Interest
The authors declare no conflict of interest.
References
- Slingo, J.; Belcher, S.; Scaife, A.; McCarthy, M.; Saulter, A.; McBeath, K.; Jenkins, A.; Huntingford, C.; Marsh, T.; Hannaford, J.; et al. The Recent Storms and Floods in the UK; Centre for Ecology and Hydrology: Bailrigg, UK, February 2014. [Google Scholar]
- Defra. The Costs and Impacts of the Winter 2013 to 2014 Floods; UK Government: London, UK, February 2016.
- Lowe, J.; Howard, T.; Pardaens, A.; Tinker, J.; Jenkins, G.; Ridley, J.; Leake, J.; Holt, J.; Wakelin, S.; Wolf, J.; et al. UK Climate Projections Science Report: Marine and Coastal Projections; Met Office Hadley Centre: Exeter, UK, June 2009.
- Cazenave, A.; Cozannet, G.L. Sea level rise and its coastal impacts. Earth Future 2013, 2, 15–34. [Google Scholar] [CrossRef]
- Nicholls, R.J.; Cazenave, A. Sea Level Rise and Its Impact on Coastal Zones. Science 2010, 328, 1517–1520. [Google Scholar] [CrossRef] [PubMed]
- Hallegatte, S.; Green, C.; Nicholls, R.J.; Corfee-Morlot, J. Future flood losses in major coastal cities. Nat. Clim. Chang. 2013, 3, 802–806. [Google Scholar] [CrossRef]
- Vitousek, S.; Barnard, P.L.; Fletcher, C.H.; Frazer, N.; Erikson, L.; Storlazzi, C.D. Doubling of coastal flooding frequency within decades due to sea-level rise. Sci. Rep. 2017, 7, 1399. [Google Scholar] [CrossRef] [PubMed]
- Buchanan, M.K.; Oppenheimer, M.; Kopp, R.E. Amplification of flood frequencies with local sea level rise and emerging flood regimes. Environ. Res. Lett. 2017, 12. [Google Scholar] [CrossRef]
- Pugh, D.; Woodworth, P. Sea-Level Science: Understanding Tides, Surges, Tsunamis and Mean Sea-Level Changes; Cambridge University Press: Cambridge, UK, 2014. [Google Scholar]
- Van der Meer, J.; Allsop, N.; Bruce, T.; De Rouck, J.; Kortenhaus, A.; Pullen, T.; Schüttrumpf, H.; Troch, P.; Zanuttigh, B. EurOtop 2016: Manual on Wave Overtopping of Sea Defences and Related Structures. An Overtopping Manual Largely Based on European Research, but for Worldwide Application. Available online: www.overtopping-manual.com (accessed on 11 September 2017).
- Reeve, D.; Chadwick, A.; Fleming, C. Coastal Engineering: Processes, Theory and Design Practice. Available online: http://marineman.ir/wp-content/uploads/2015/02/Coastal-Engineering-Processes-theory-and-design-practice.pdf (accessed on 11 September 2017).
- Zou, Q.P.; Chen, Y.; Cluckie, I.; Hewston, R.; Pan, S.; Peng, Z.; Reeve, D. Ensemble prediction of coastal flood risk arising from overtopping by linking meteorological, ocean, coastal and surf zone models. Q. J. R. Meteorol. Soc. 2013, 139, 298–313. [Google Scholar] [CrossRef]
- Stansby, P.; Chini, N.; Apsley, D.; Borthwick, A.; Bricheno, L.; Horrillo-Caraballo, J.; McCabe, M.; Reeve, D.; Rogers, B.; Saulter, A.; et al. An integrated model system for coastal flood prediction with a case history for Walcott, UK, on 9 November 2007. J. Flood Risk Manag. 2012, 6, 1–24. [Google Scholar] [CrossRef]
- Ceredigion Storm Damage Repairs to Cost at least £1.5 m. Available online: http://www.bbc.co.uk/news/uk-wales-mid-wales-25850527 (accessed on 24 January 2014).
- Sibley, A.; Cox, D.; Titley, H. Coastal flooding in england and wales from atlantic and north sea storms during the 2013/2014 winter. Weather 2015, 70, 62–70. [Google Scholar] [CrossRef]
- Sibley, A.; Cox, D. Flooding along English Channel coast due to long-period swell waves. Weather 2014, 69, 59–66. [Google Scholar] [CrossRef]
- Hawkes, P. Mean Overtopping Rate in Swell and Bimodal Seas. Proc. Inst. Civ. Eng. Water Marit. Eng. 1999, 136, 235–238. [Google Scholar] [CrossRef]
- Owen, M.W. Design of Seawalls Allowing for Wave Overtopping; Hydraulics Research Station: Oxfordshire, UK, 1980. [Google Scholar]
- Tolman, H.L. User Manual and System Documentation of WAVEWATCH III Version 4.18; NOAA/NWS/NCEP/MMAB: College Park, MD, USA, 2014.
- Palmer, T. Energetic Swell Waves in the English Channel. Ph.D. Thesis, University of Southampton, Southampton, UK, 2011. [Google Scholar]
- Lin, P.; Liu, P.L.F. A numerical study of breaking waves in the surf zone. J. Fluid Mech. 1998, 359, 239–264. [Google Scholar] [CrossRef]
- Hirt, C.; Nichols, B. Volume of Fluid (VOF) Method for the Dynamics of Free Boundaries. J. Comput. Phys. 1981, 39, 201–225. [Google Scholar] [CrossRef]
- Reeve, D.; Soliman, A.; Lin, P. Numerical study of combined overflow and wave overtopping over a smooth impermeable seawall. Coast. Eng. 2008, 55, 155–166. [Google Scholar] [CrossRef]
- Losada, I.J.; Lara, J.L.; Guanche, R.; Gonzalez-Ondina, J.M. Numerical analysis of wave overtopping of rubble mound breakwaters. Coast. Eng. 2008, 55, 47–62. [Google Scholar] [CrossRef]
- Jones, D.K.; Zou, Q.; Reeve, D.E. Computational modelling of coastal flooding caused by combined surge overflow and wave overtopping on embankments. J. Flood Risk Manag. 2013, 6, 70–84. [Google Scholar] [CrossRef]
- Thompson, D.A.; Karunarathna, H.; Reeve, D. Comparison between wave generation methods for numerical simulation of bimodal seas. Water Sci. Eng. 2016, 9, 3–13. [Google Scholar] [CrossRef]
- Burcharth, H.F.; Hughes, S. Part VI, Design of Coastal Project Elements. In Coastal Engineering Manual; U.S. Army Corps of Engineers: Washington, DC, USA, 2002; Chapter VI; EM 1110-2-1100; pp. A-1–A-94. [Google Scholar]
- Allsop, W.; Bruce, T.; Pullen, T.; van der Meer, J.W. Direct Hazards from Wave Overtopping—The Forgotten Aspect of Coastal Flood Risk Assessment? HR Wallingford: Oxfordshire, UK, July 2008. [Google Scholar]
- Coates, T.; Jones, R.J.; Bona, P.F.D. Wind/Swell Seas and Steep Approach Slopes: Technical Report on Wave Flume Studies; HR Wallingford: Oxfordshire, UK, 1998. [Google Scholar]
- Goda, Y. Random Seas and Design of Maritime Structures. Available online: https://books.google.co.uk/books?hl=en&lr=&id=v_unn4FtFXsC&oi=fnd&pg=PR5&dq=Random+Seas+and+Design+of+Maritime+Structures&ots=GFTitl_Ydl&sig=lco7EV2rRvq9Qy4ZcbNuR9cESUo#v=onepage&q=Random%20Seas%20and%20Design%20of%20Maritime%20Structures&f=false (accessed on 11 September 2017).
- Altomare, C.; Suzuki, T.; Chen, X.; Verwaest, T.; Kortenhaus, A. Wave overtopping of sea dikes with very shallow foreshores. Coast. Eng. 2016, 116, 236–257. [Google Scholar] [CrossRef]
© 2017 by the authors. Licensee MDPI, Basel, Switzerland. This article is an open access article distributed under the terms and conditions of the Creative Commons Attribution (CC BY) license (http://creativecommons.org/licenses/by/4.0/).