Assessment of Nitrogen Inputs into Hunt River by Onsite Wastewater Treatment Systems via SWAT Simulation


Abstract
:1. Introduction
2. Materials and Methods
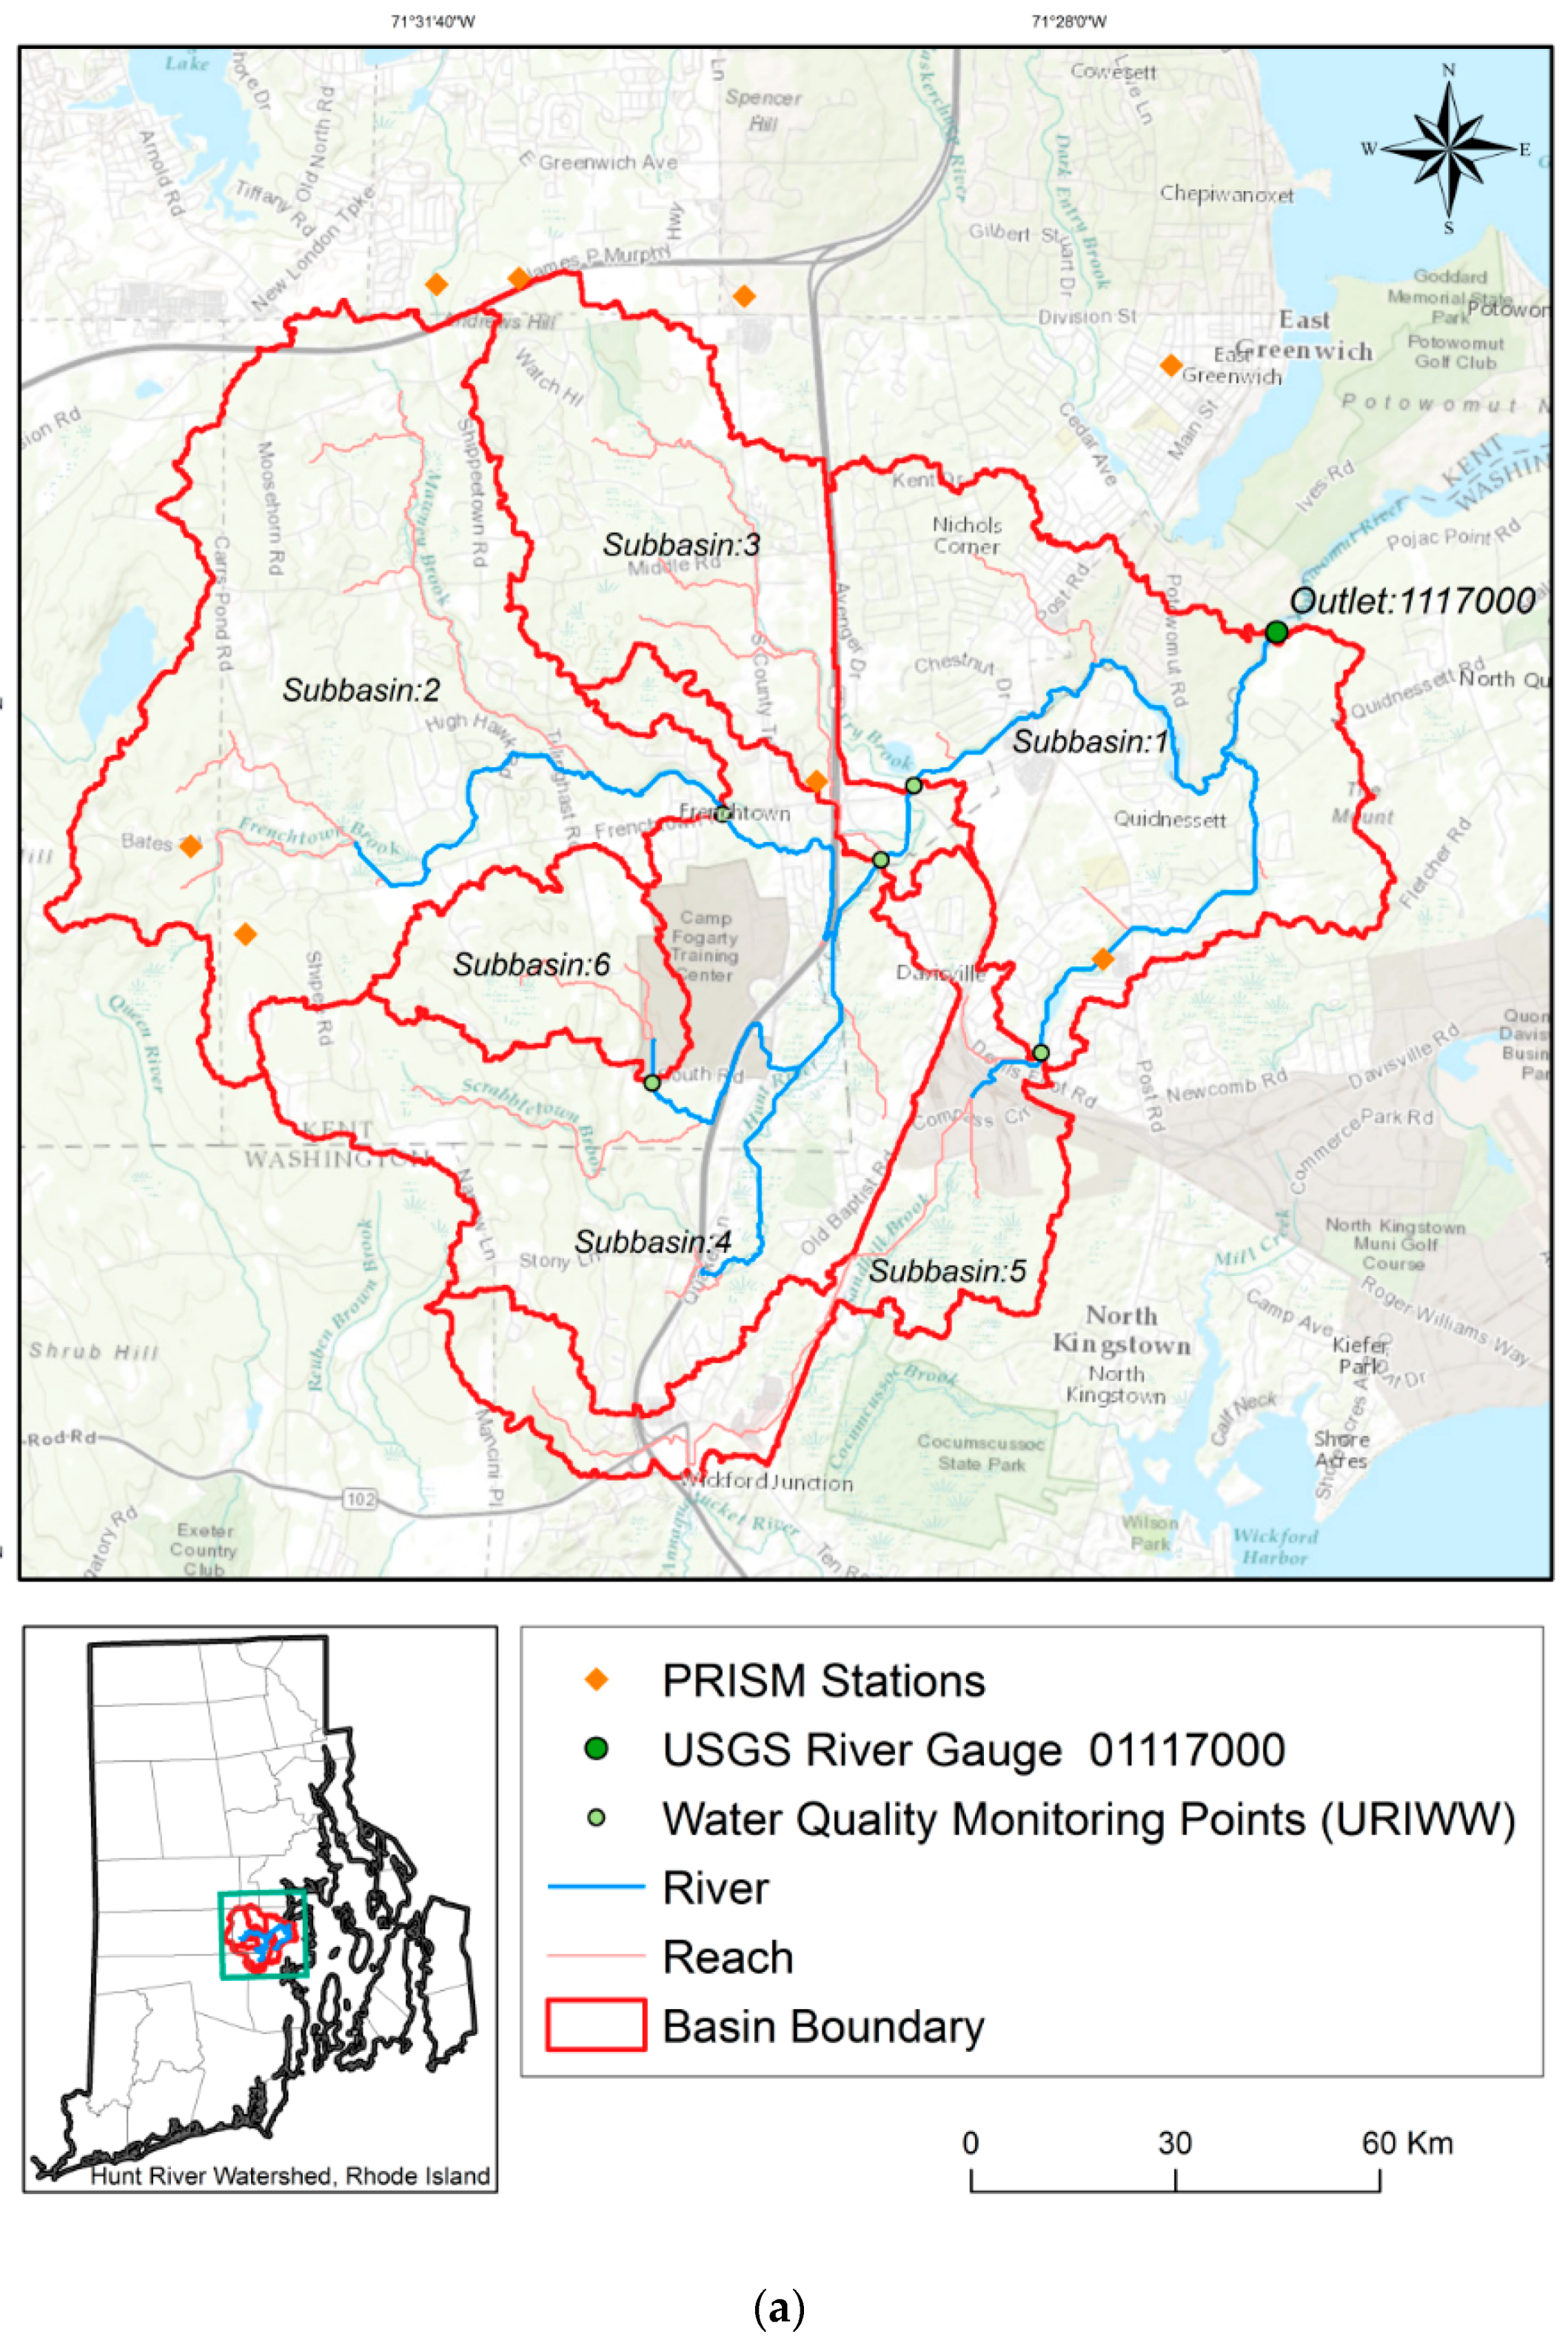
2.1. Study Area and SWAT Model Description
2.2. SWAT-CUP Model Description
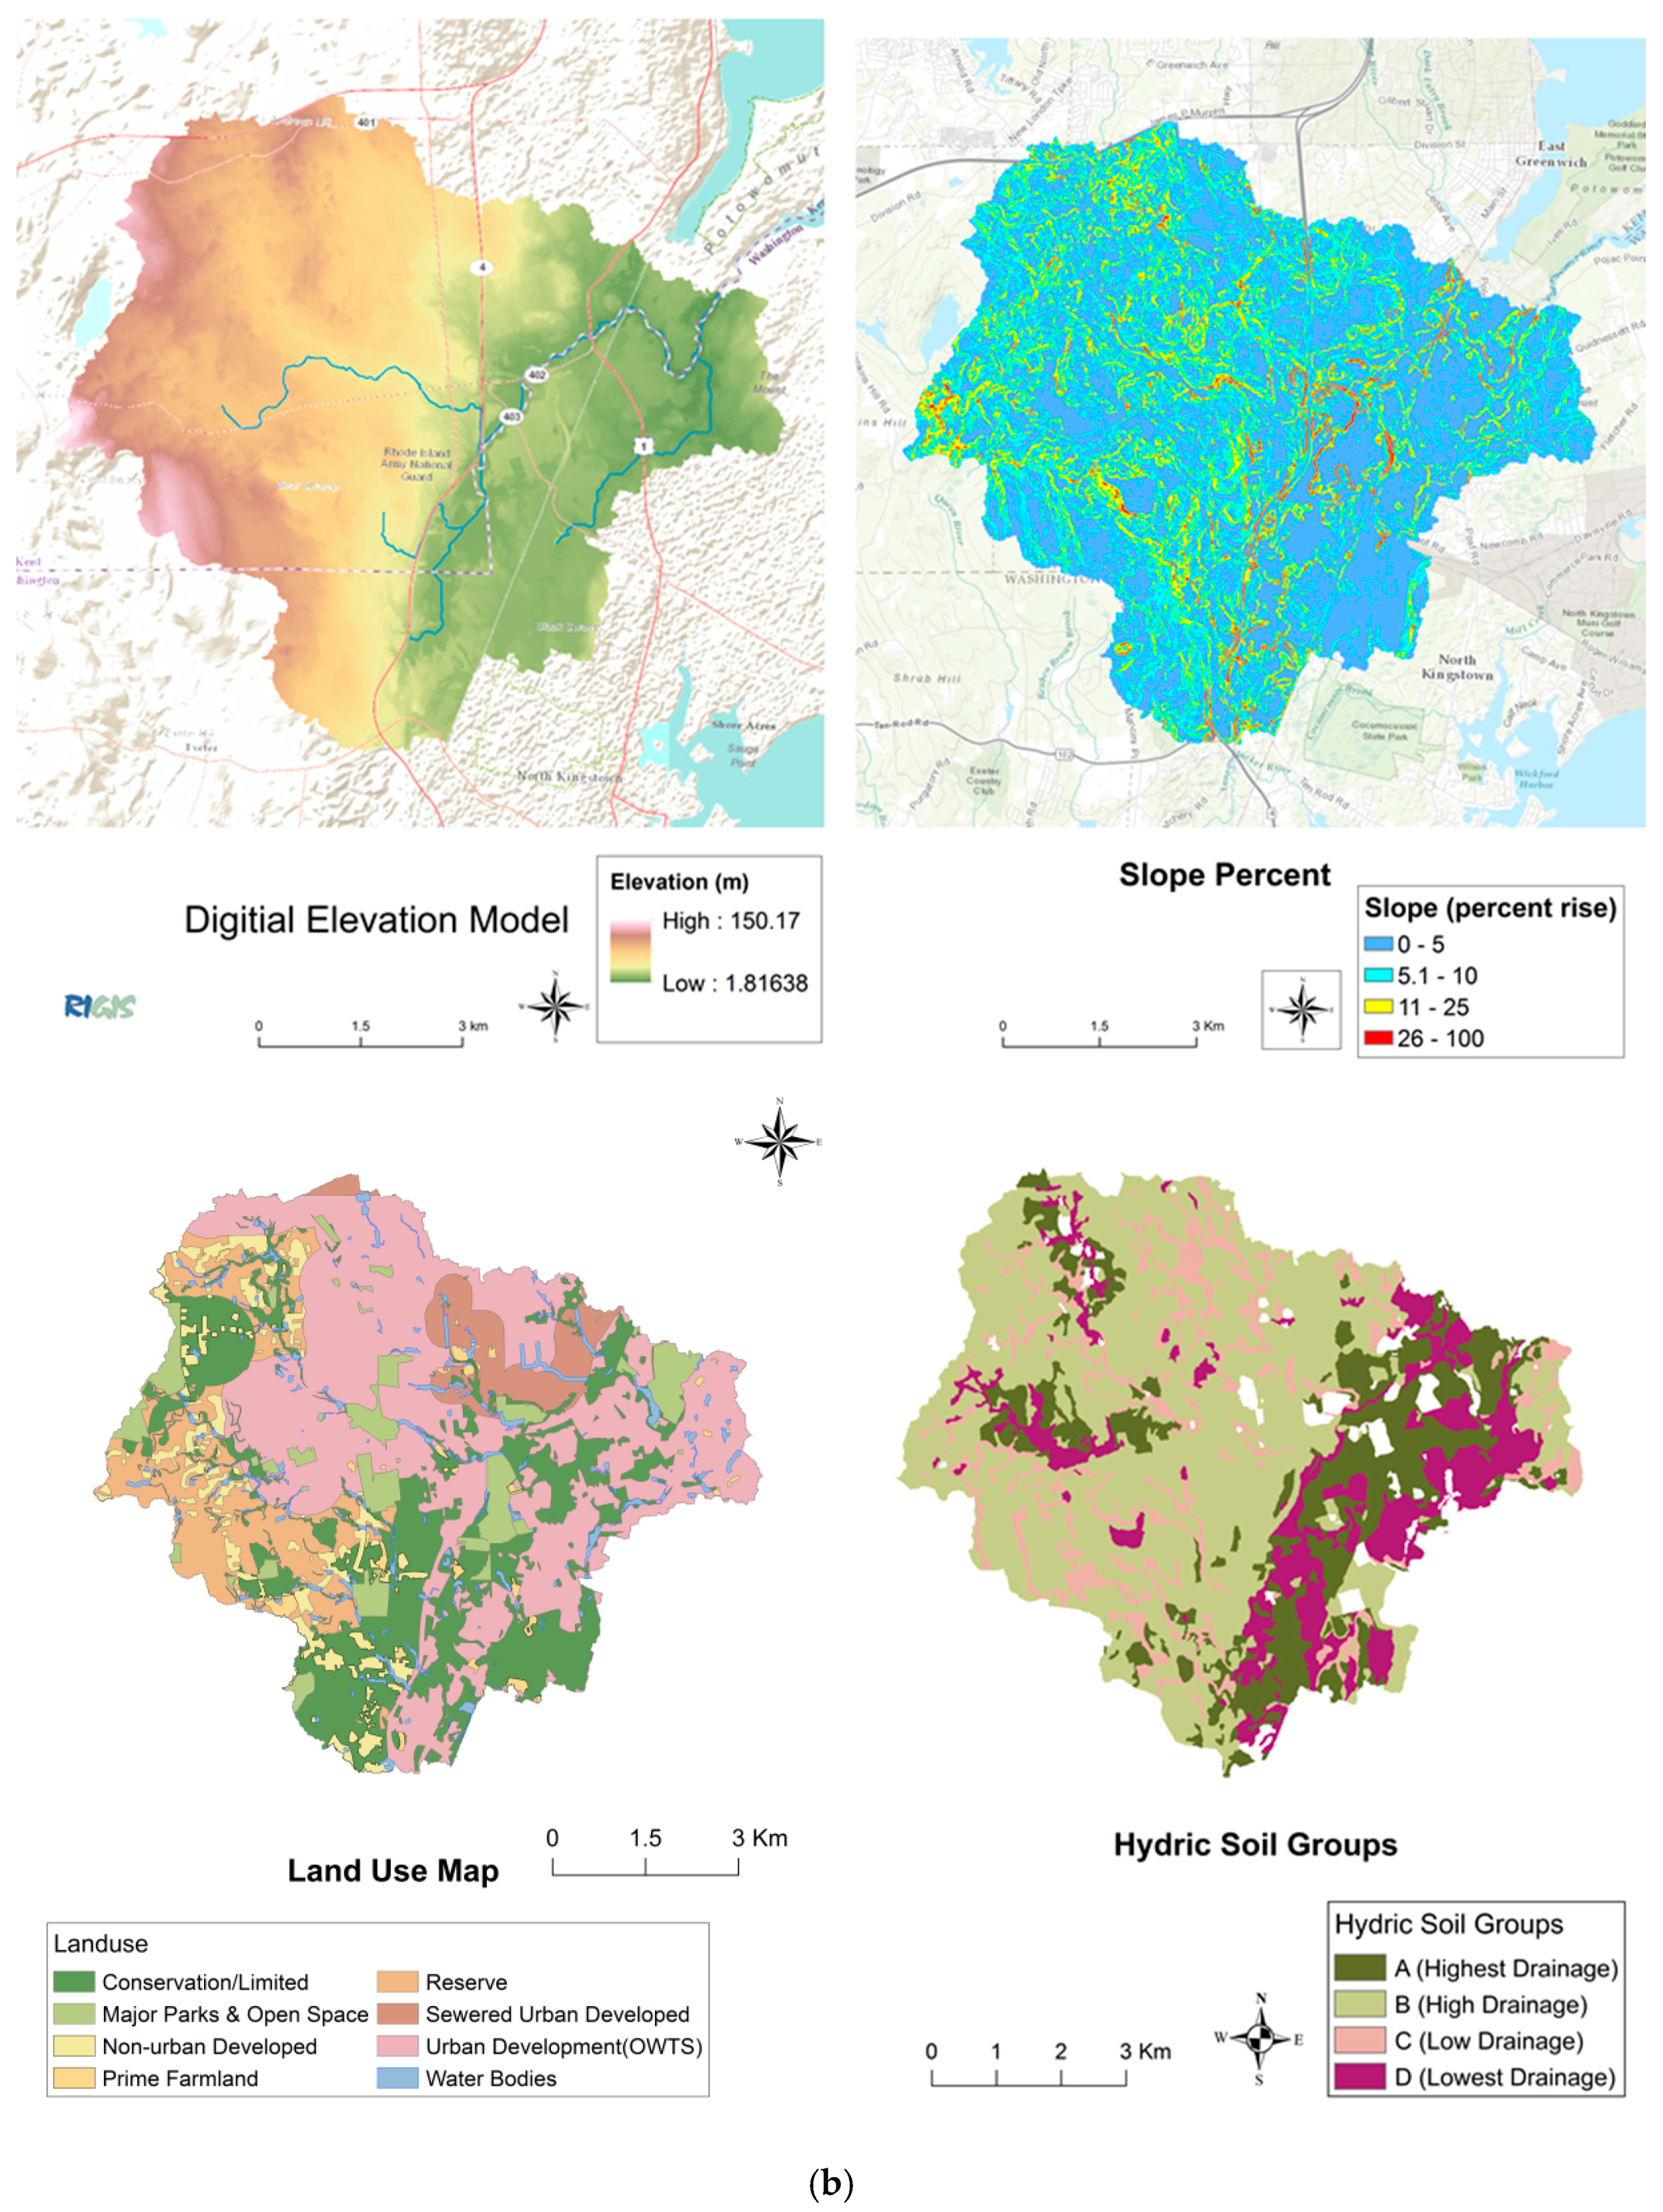
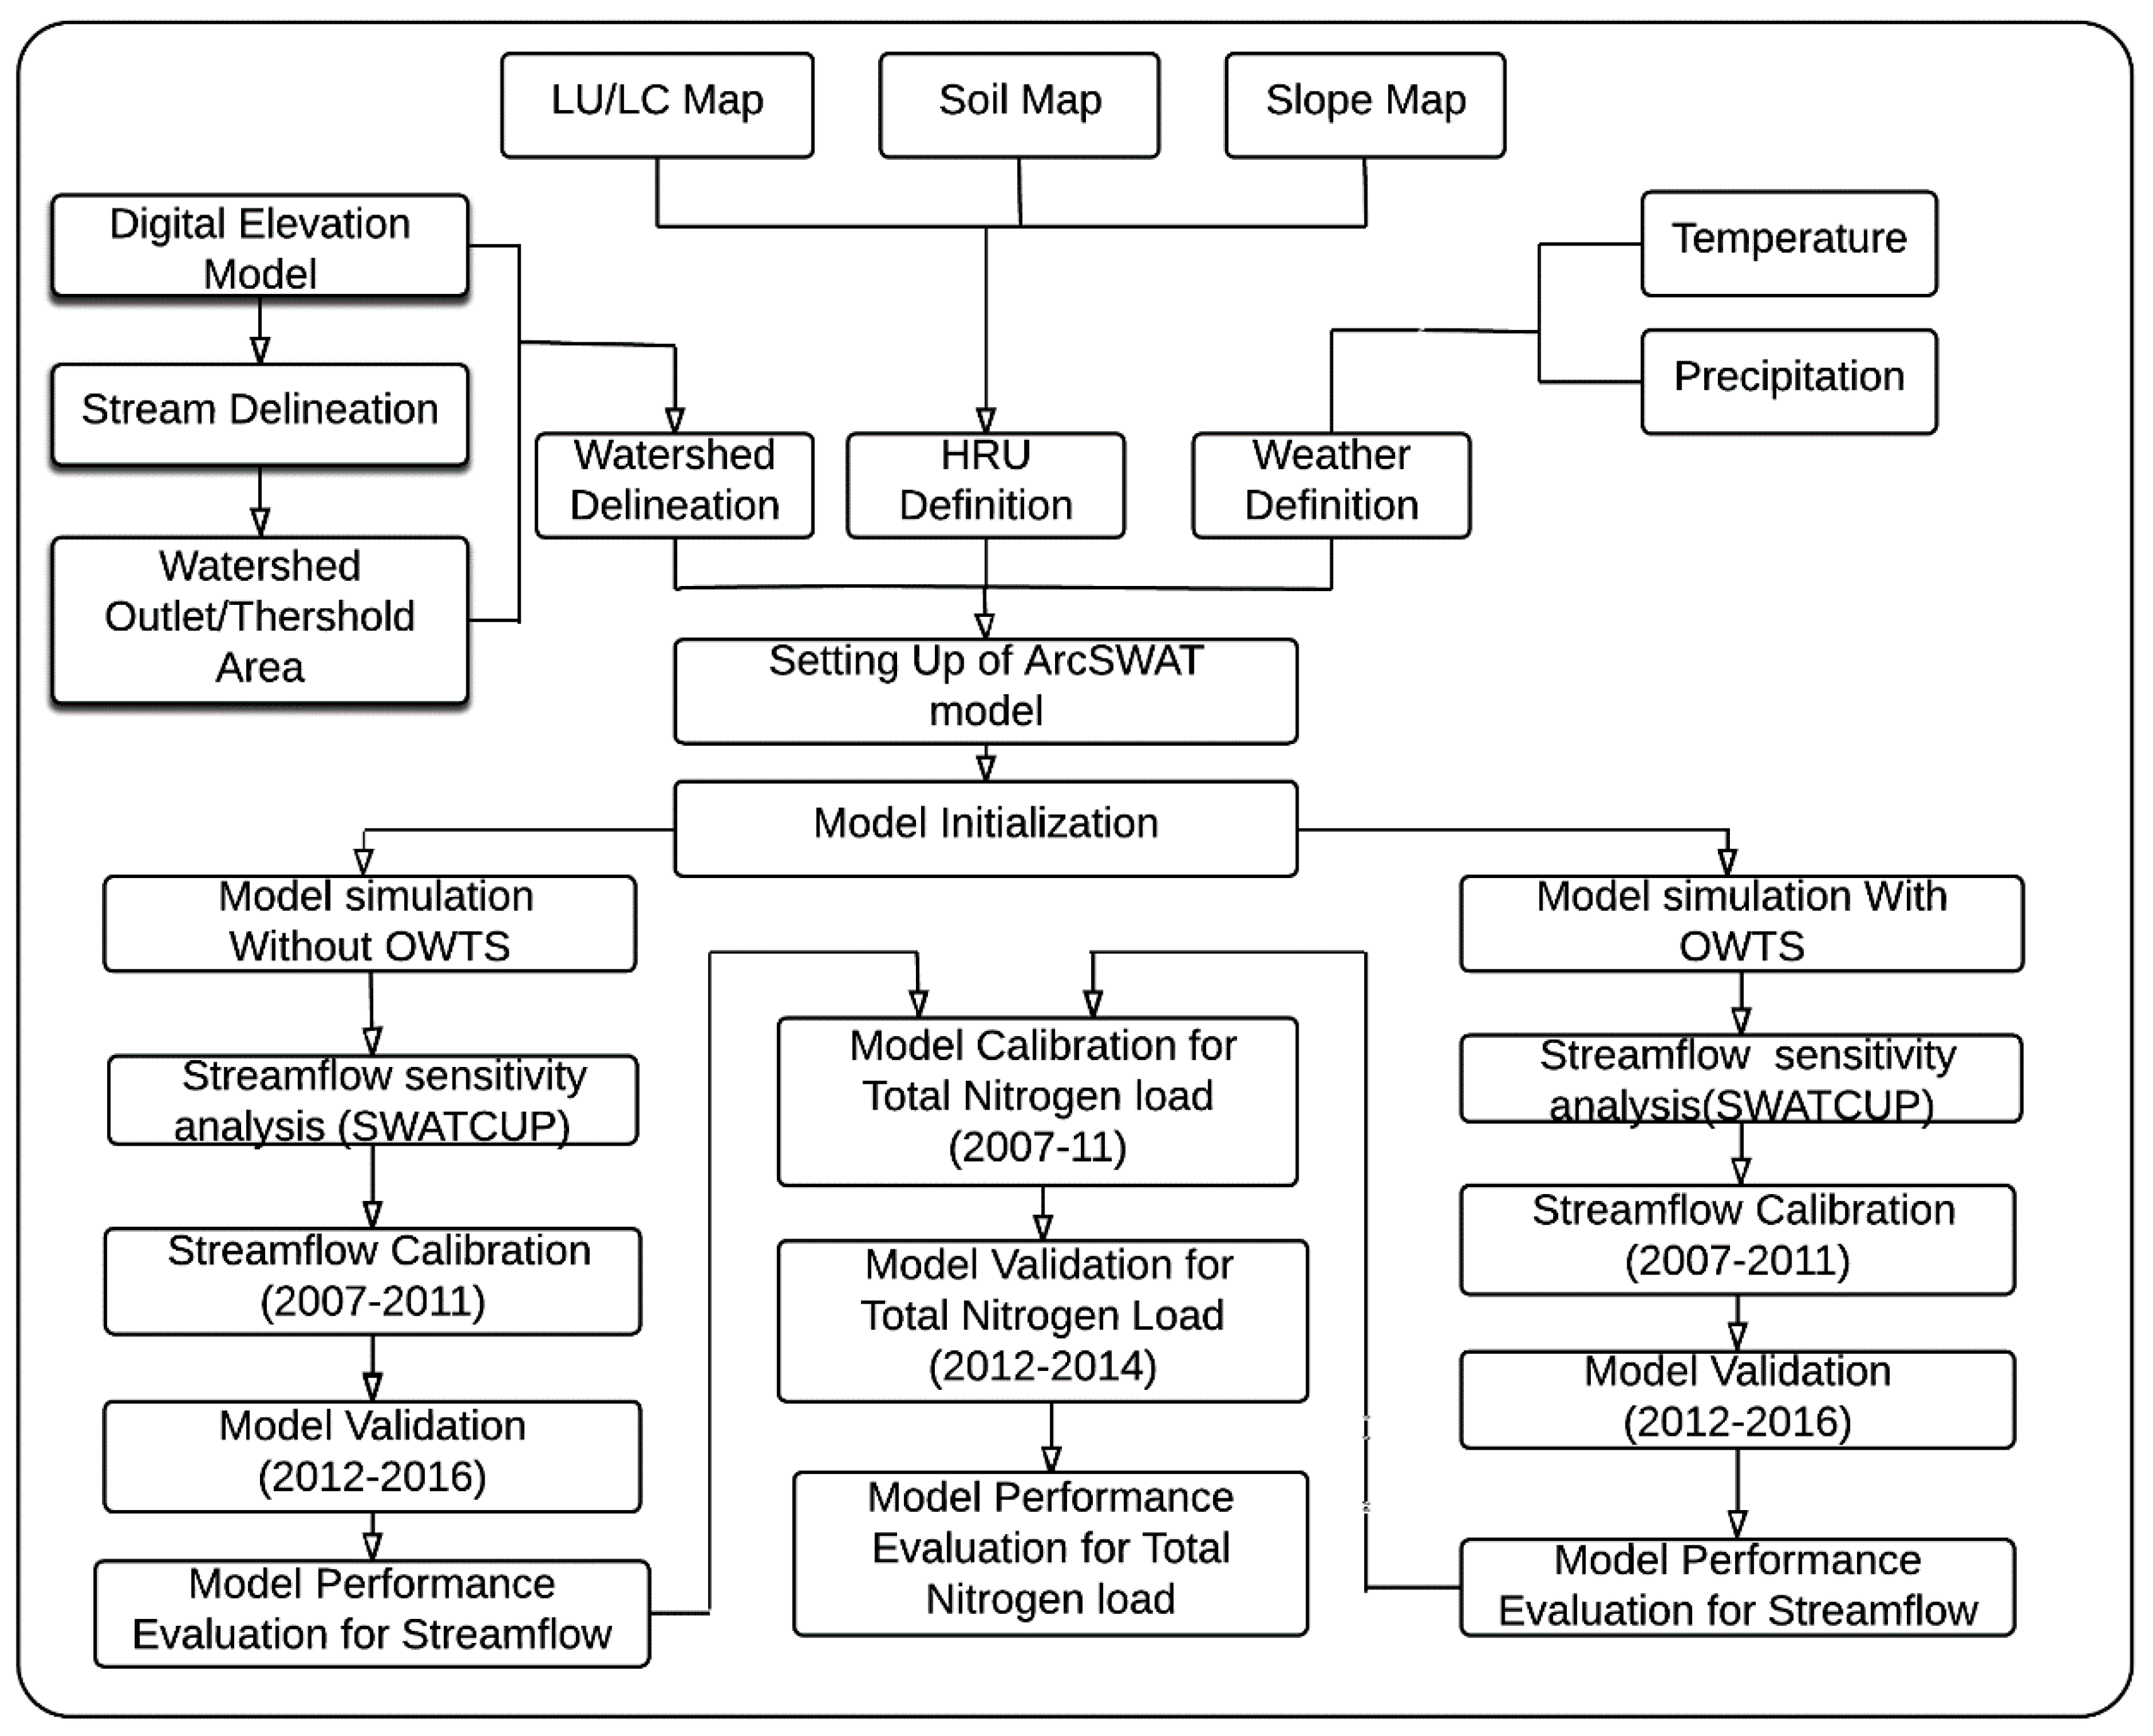
2.3. Input Data and Model Preparation
2.4. Model Setup and HRU Definitions
2.5. Model Evaluation Performance
3. Results
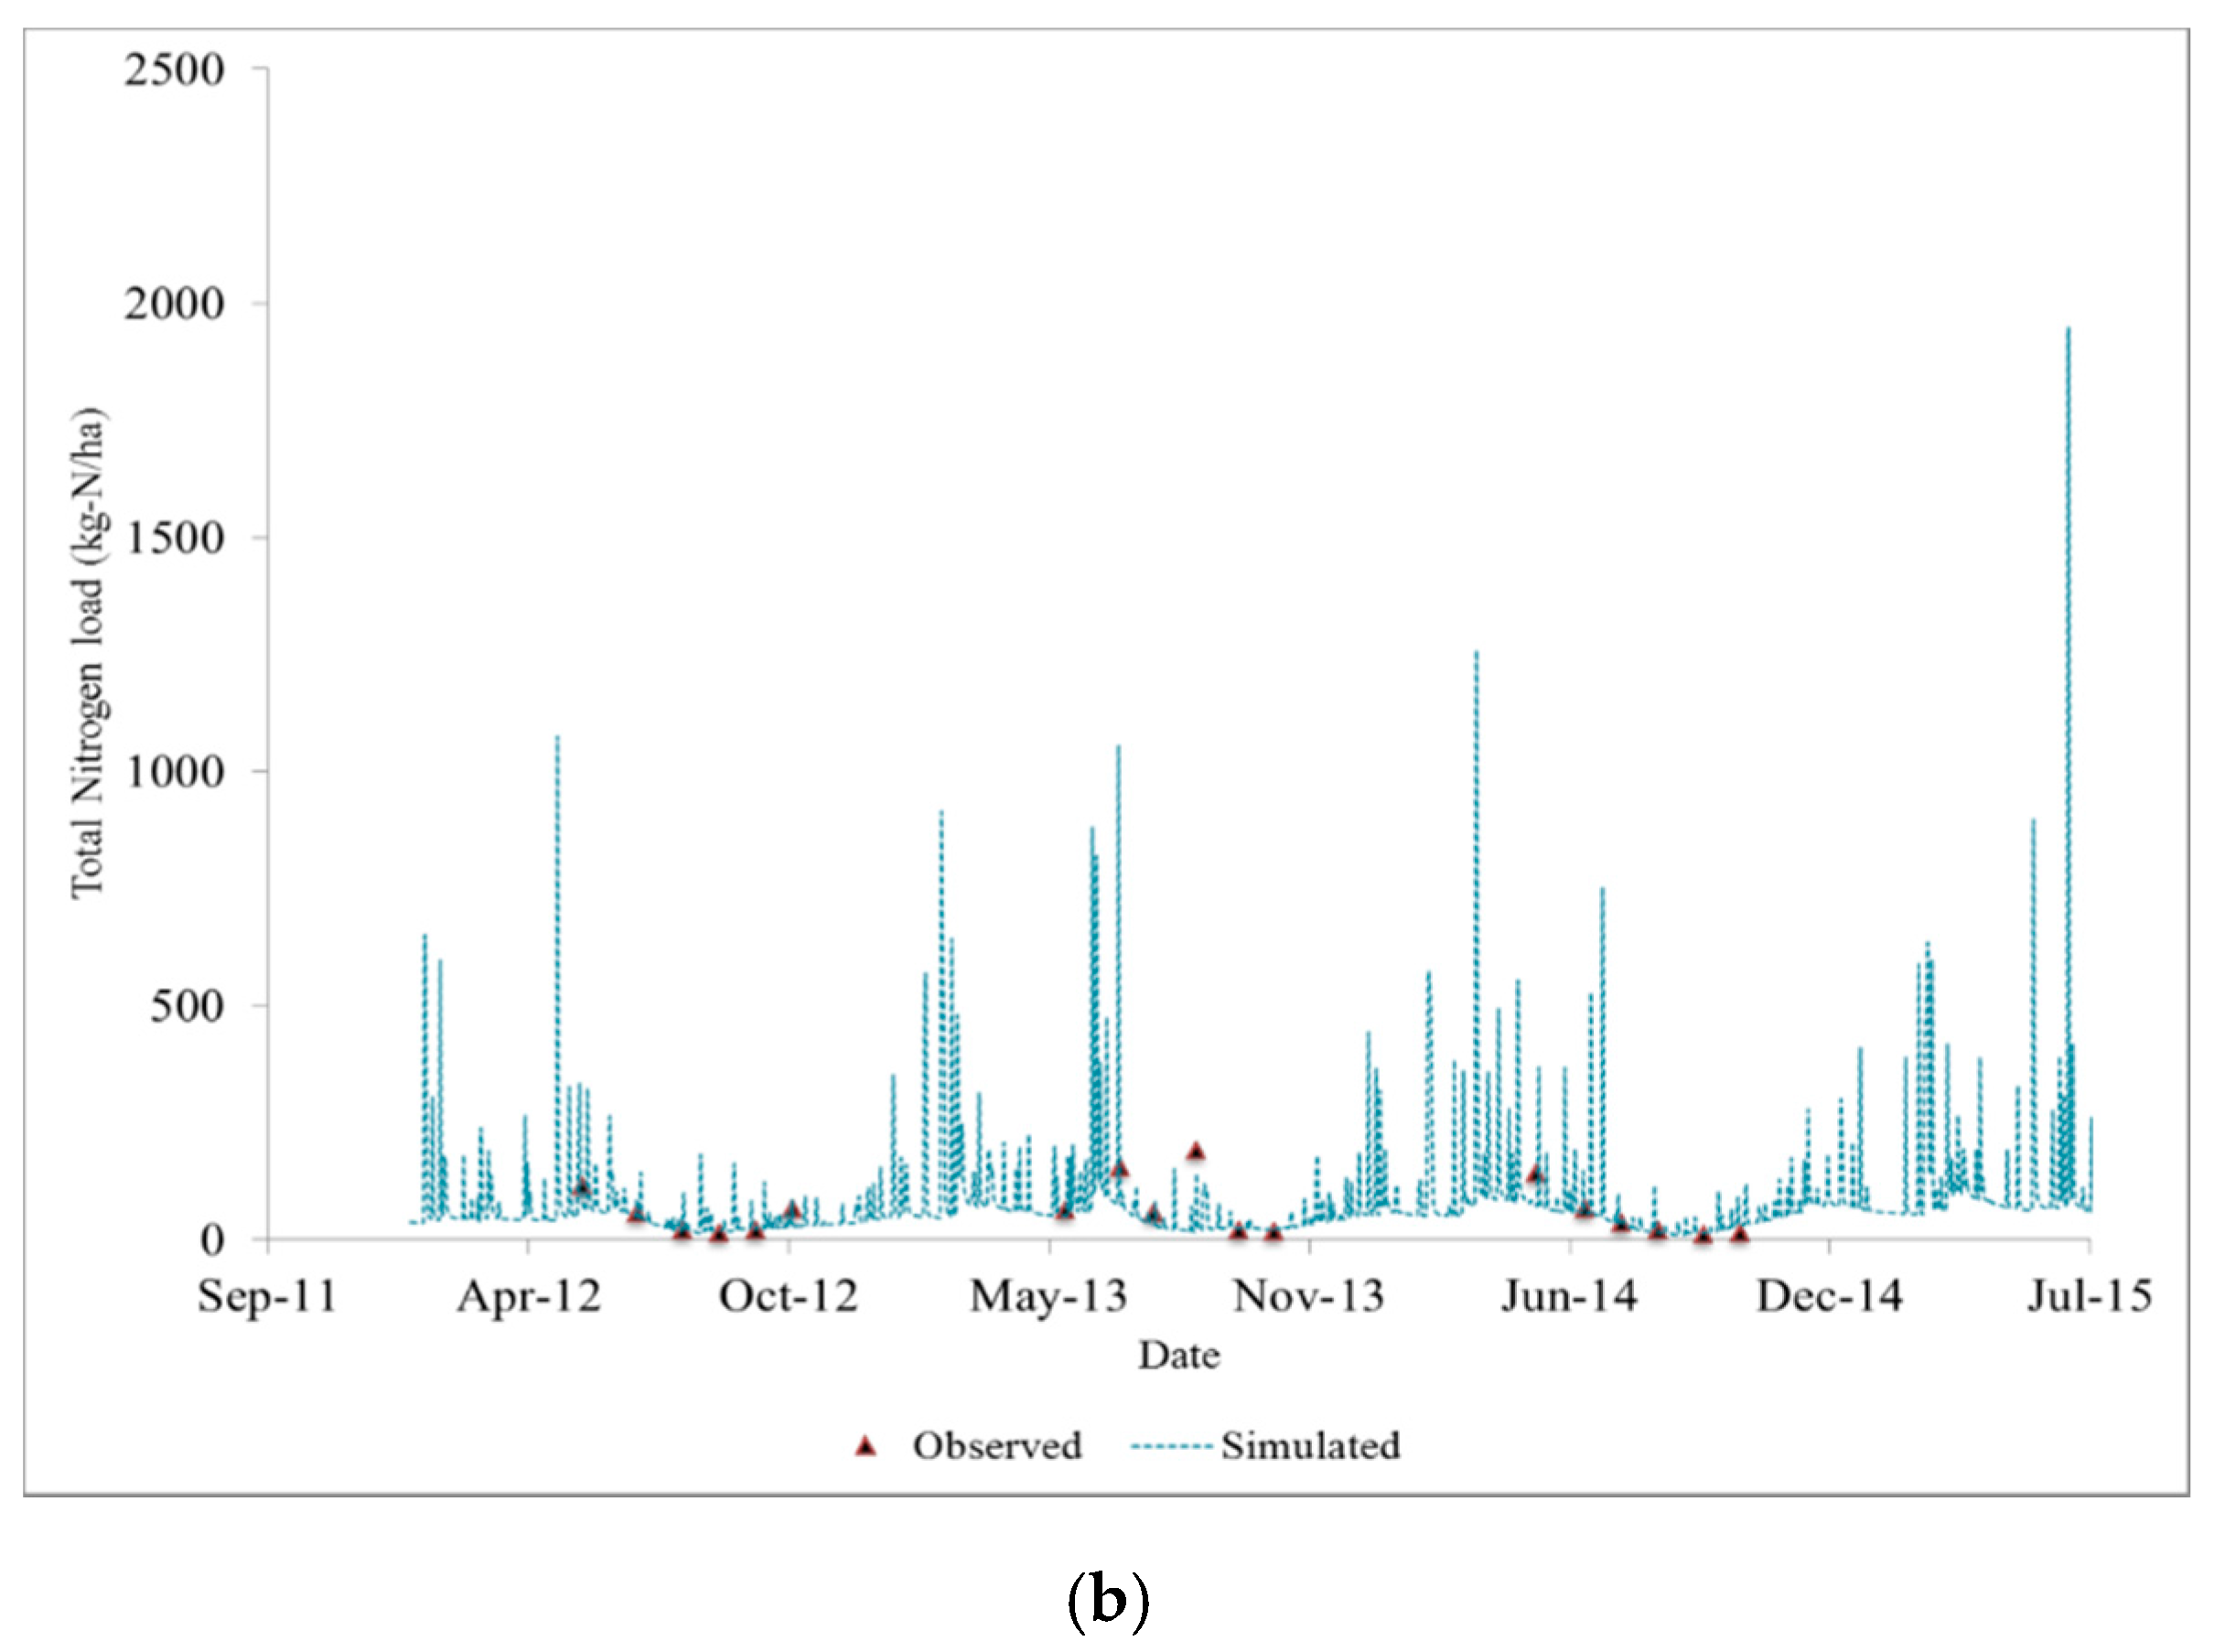
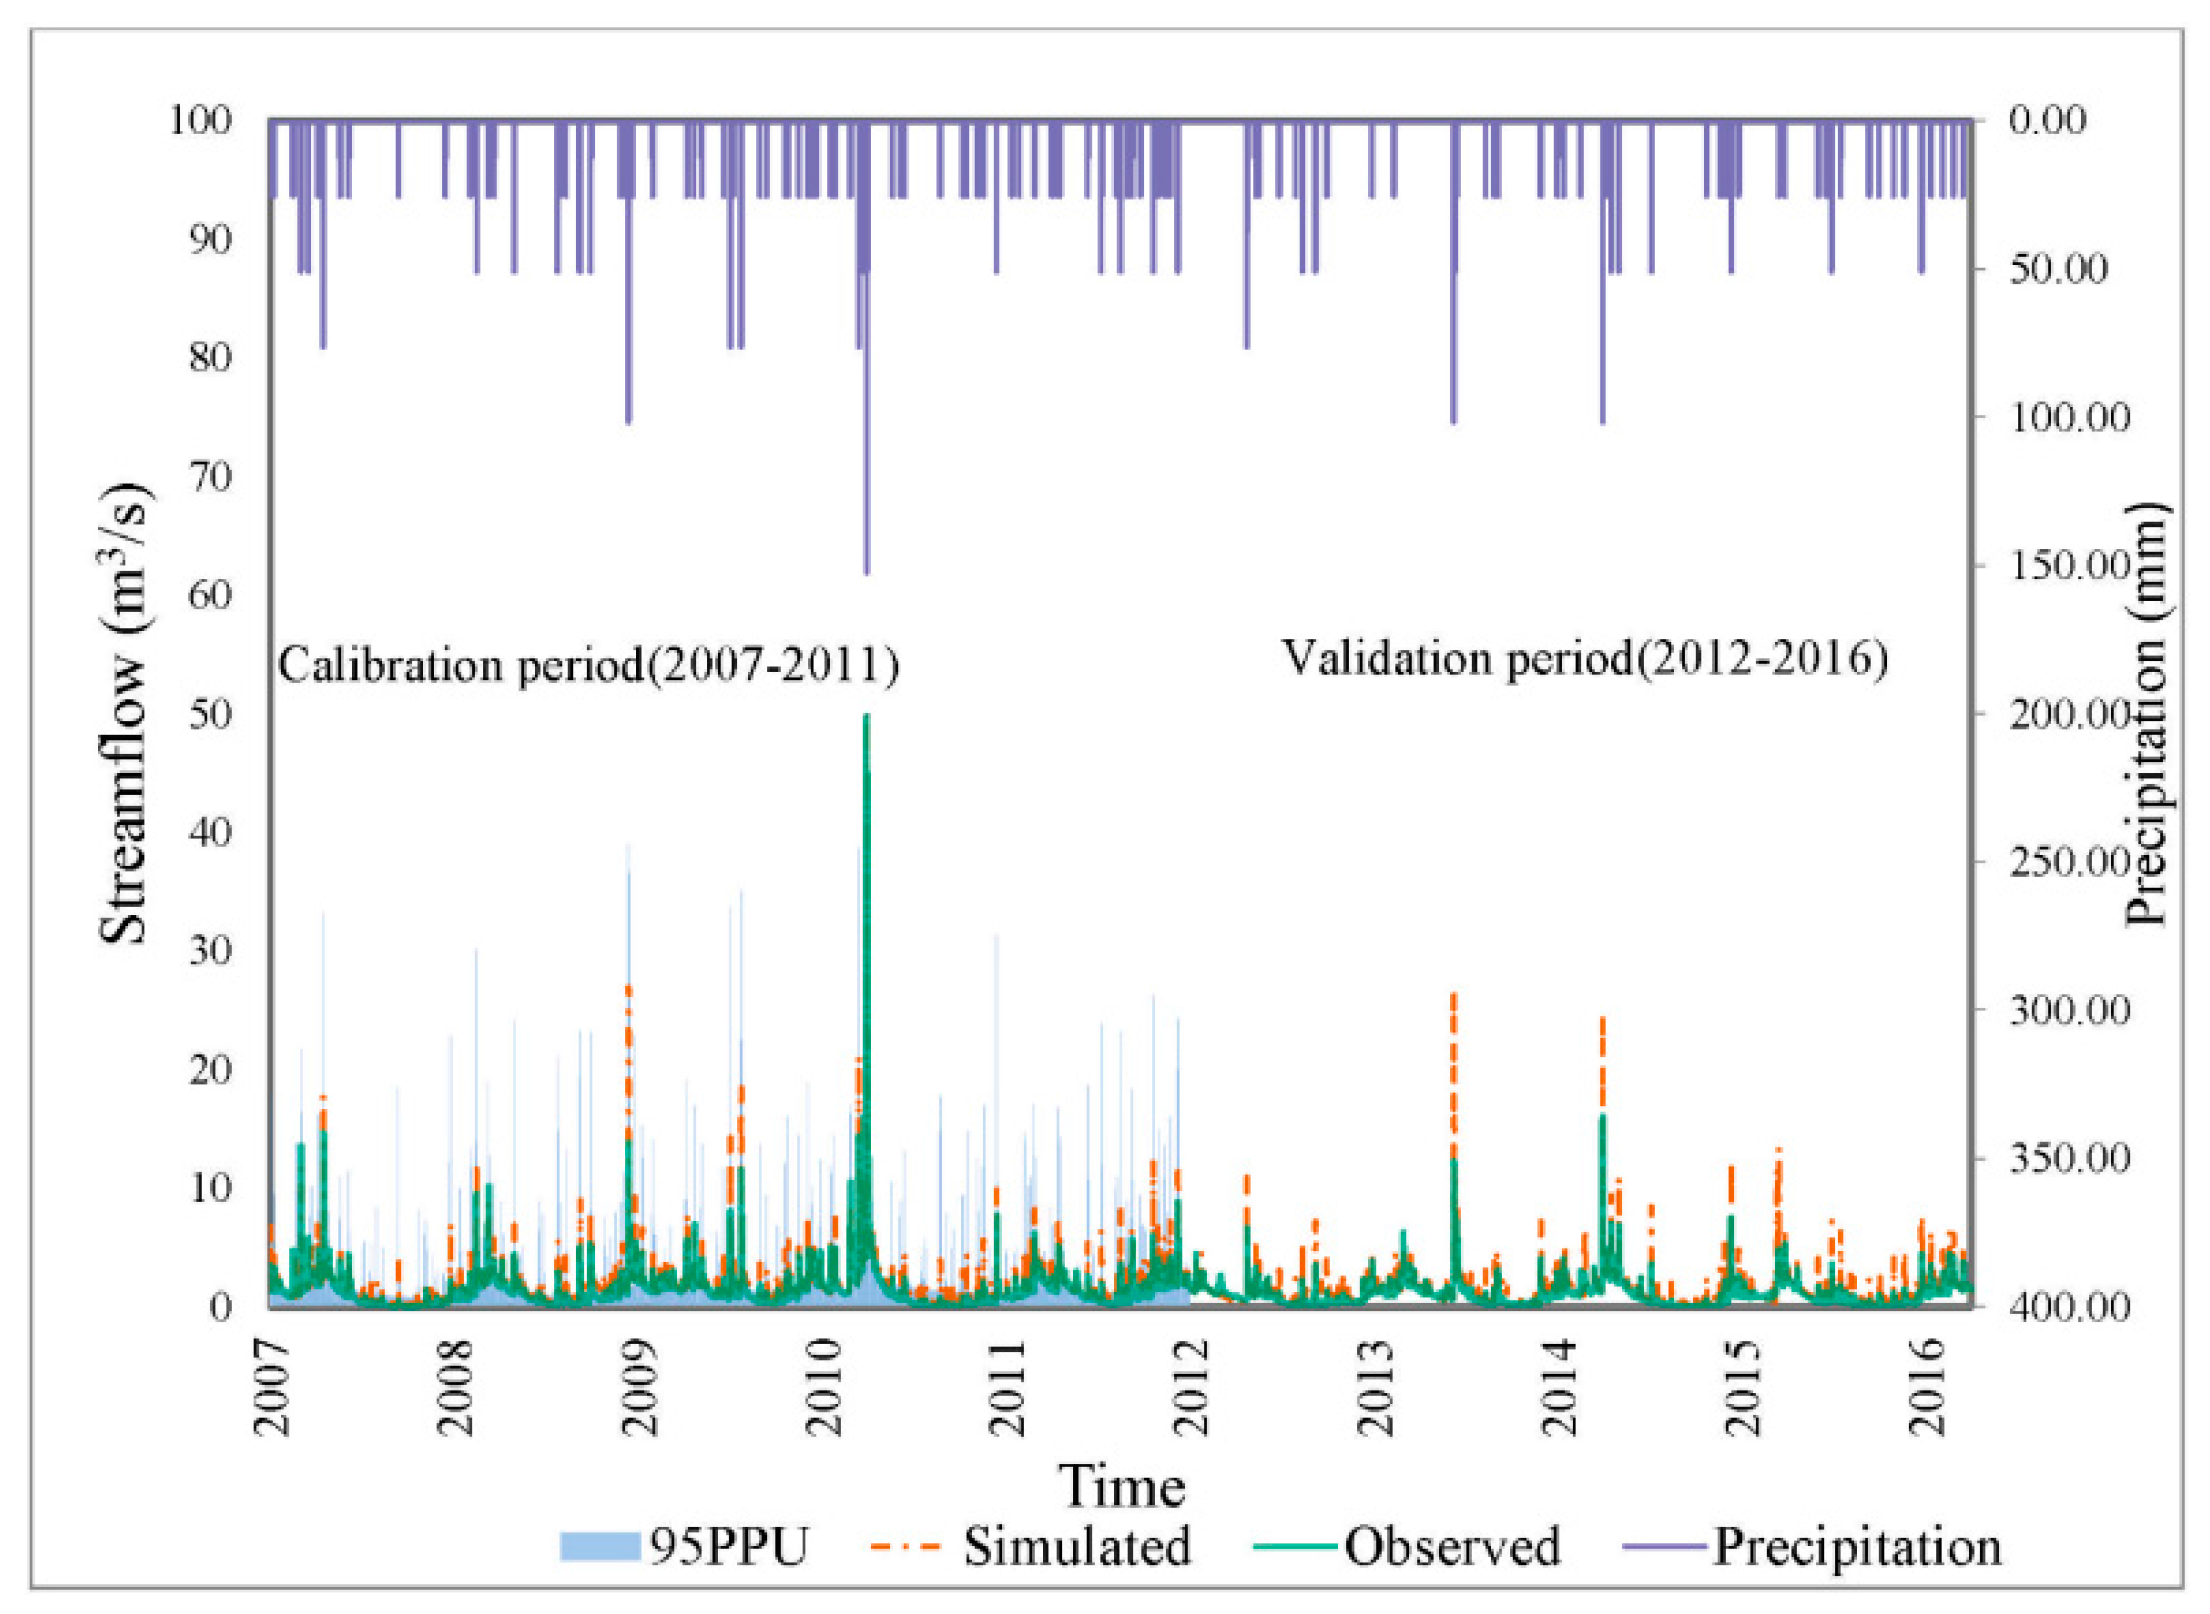
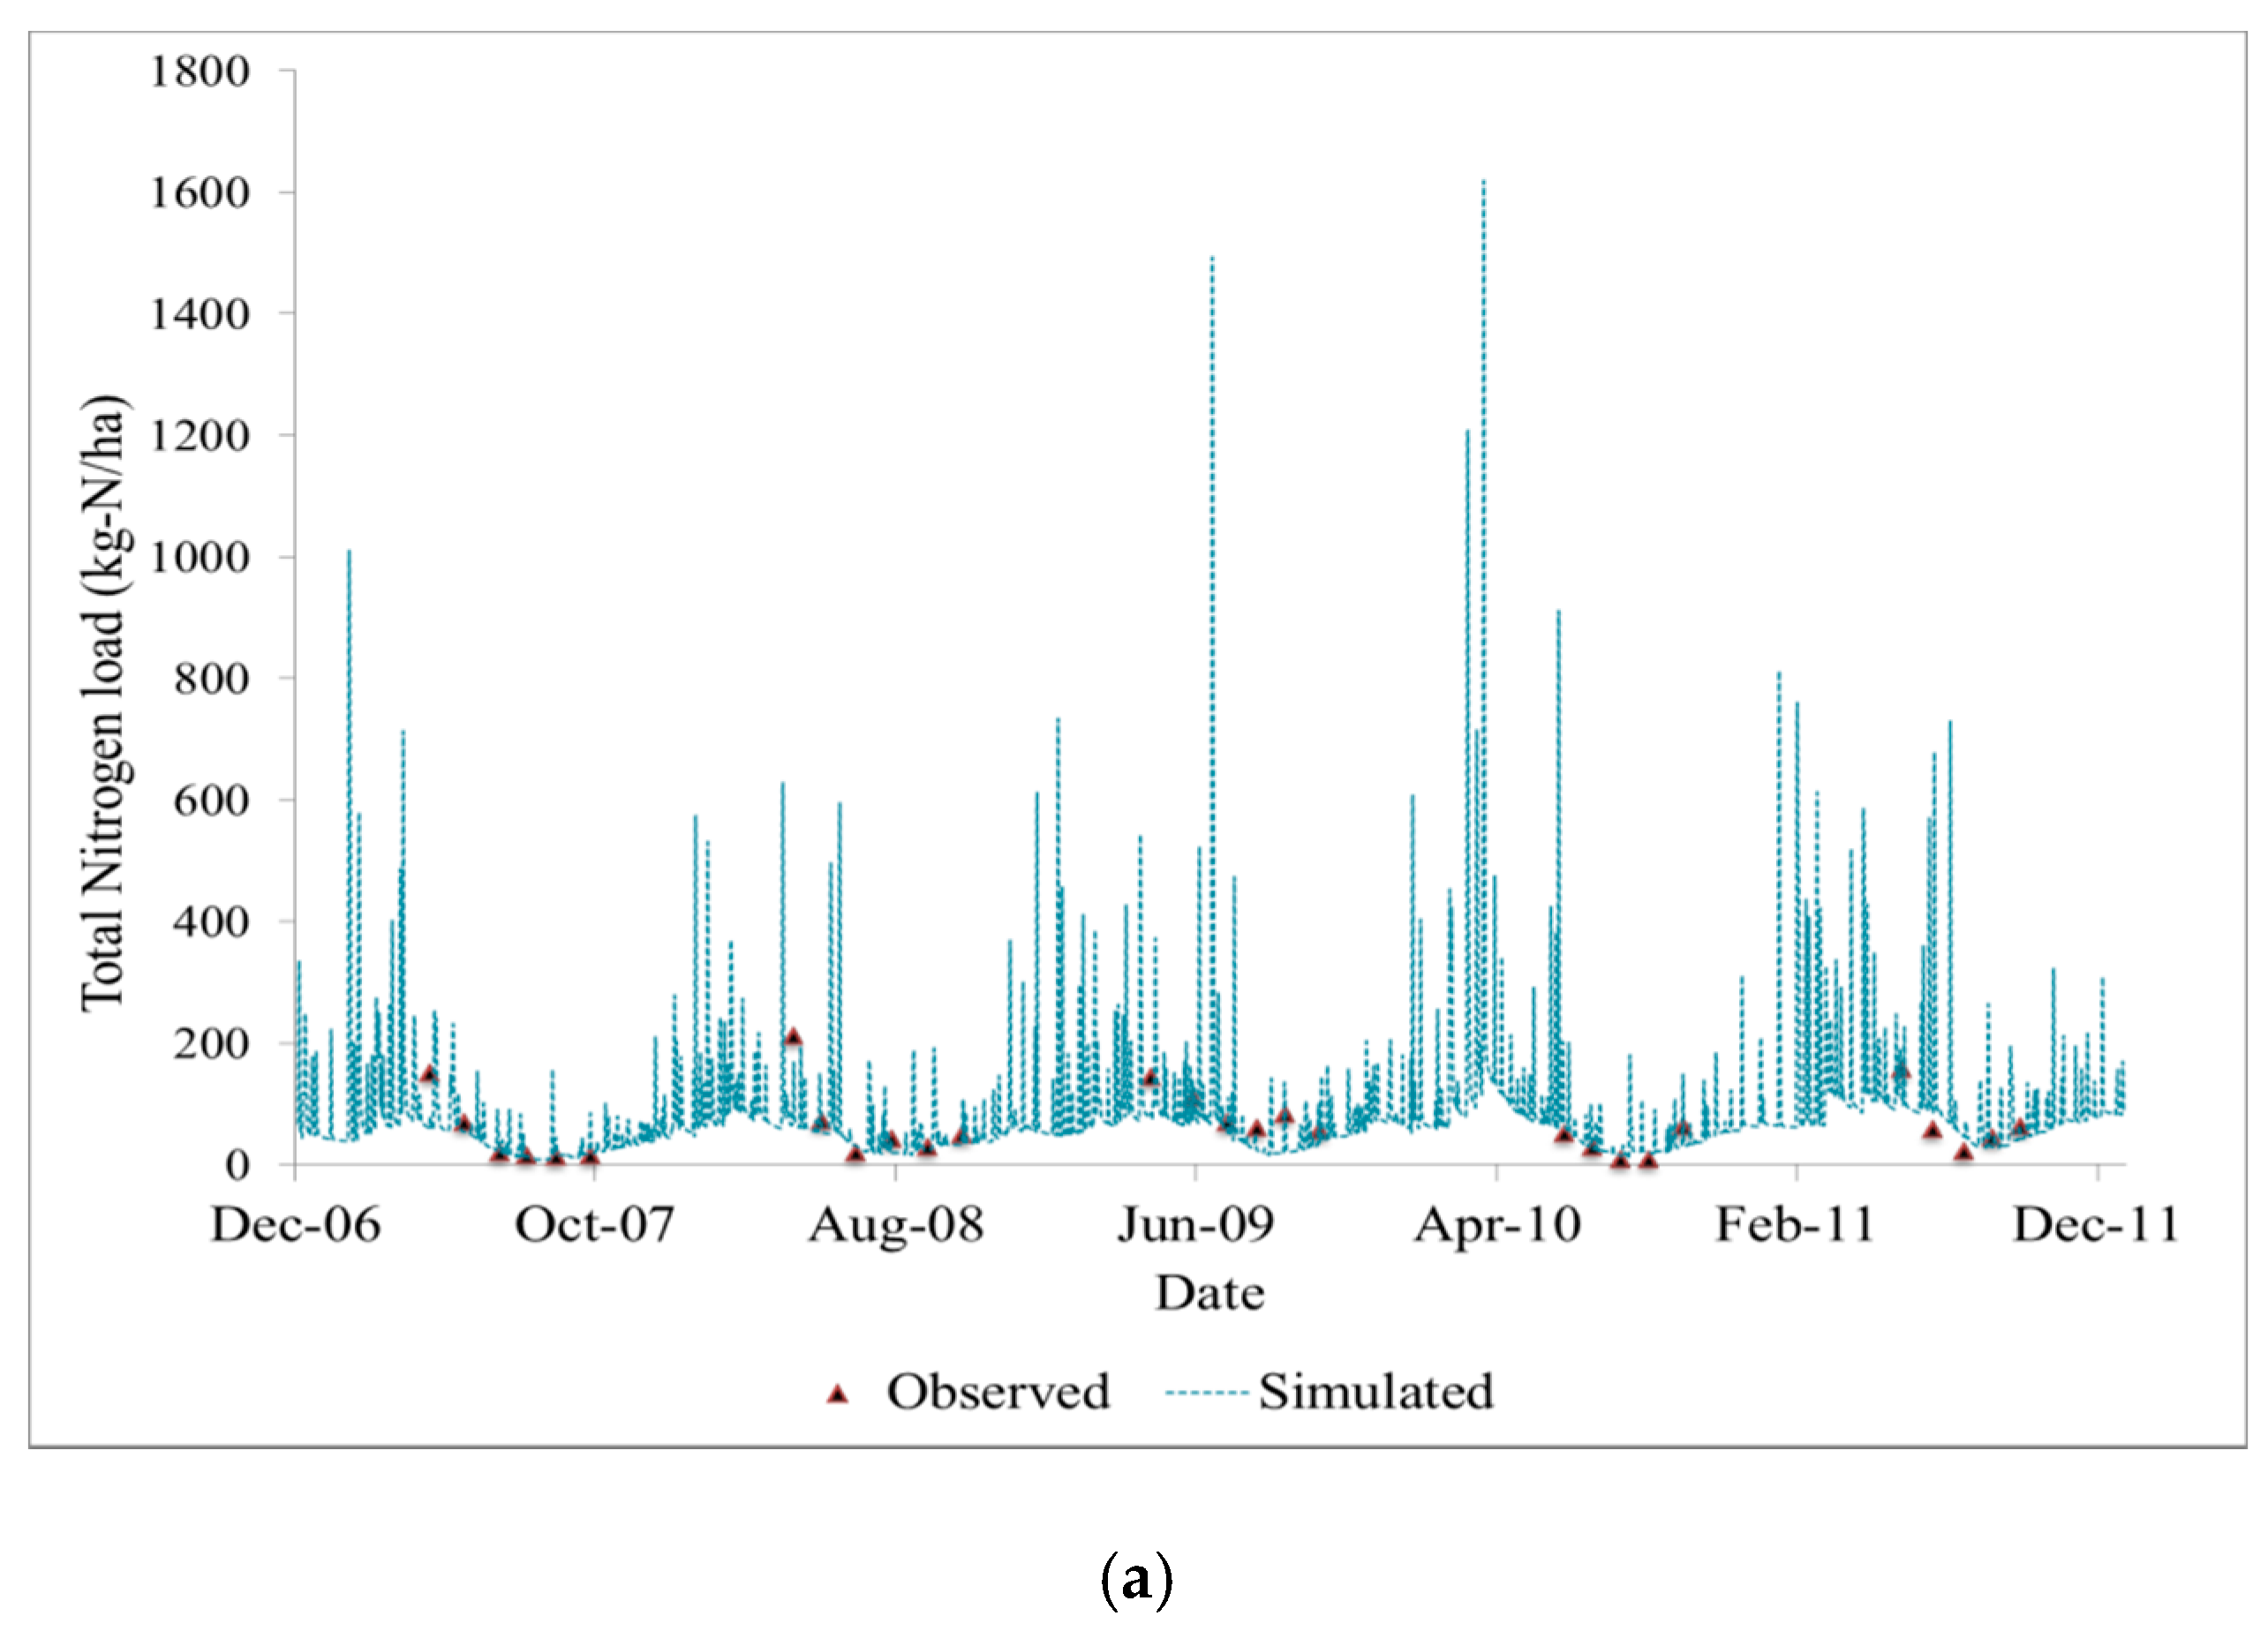
3.1. Model Sensitivity, Calibration and Validation
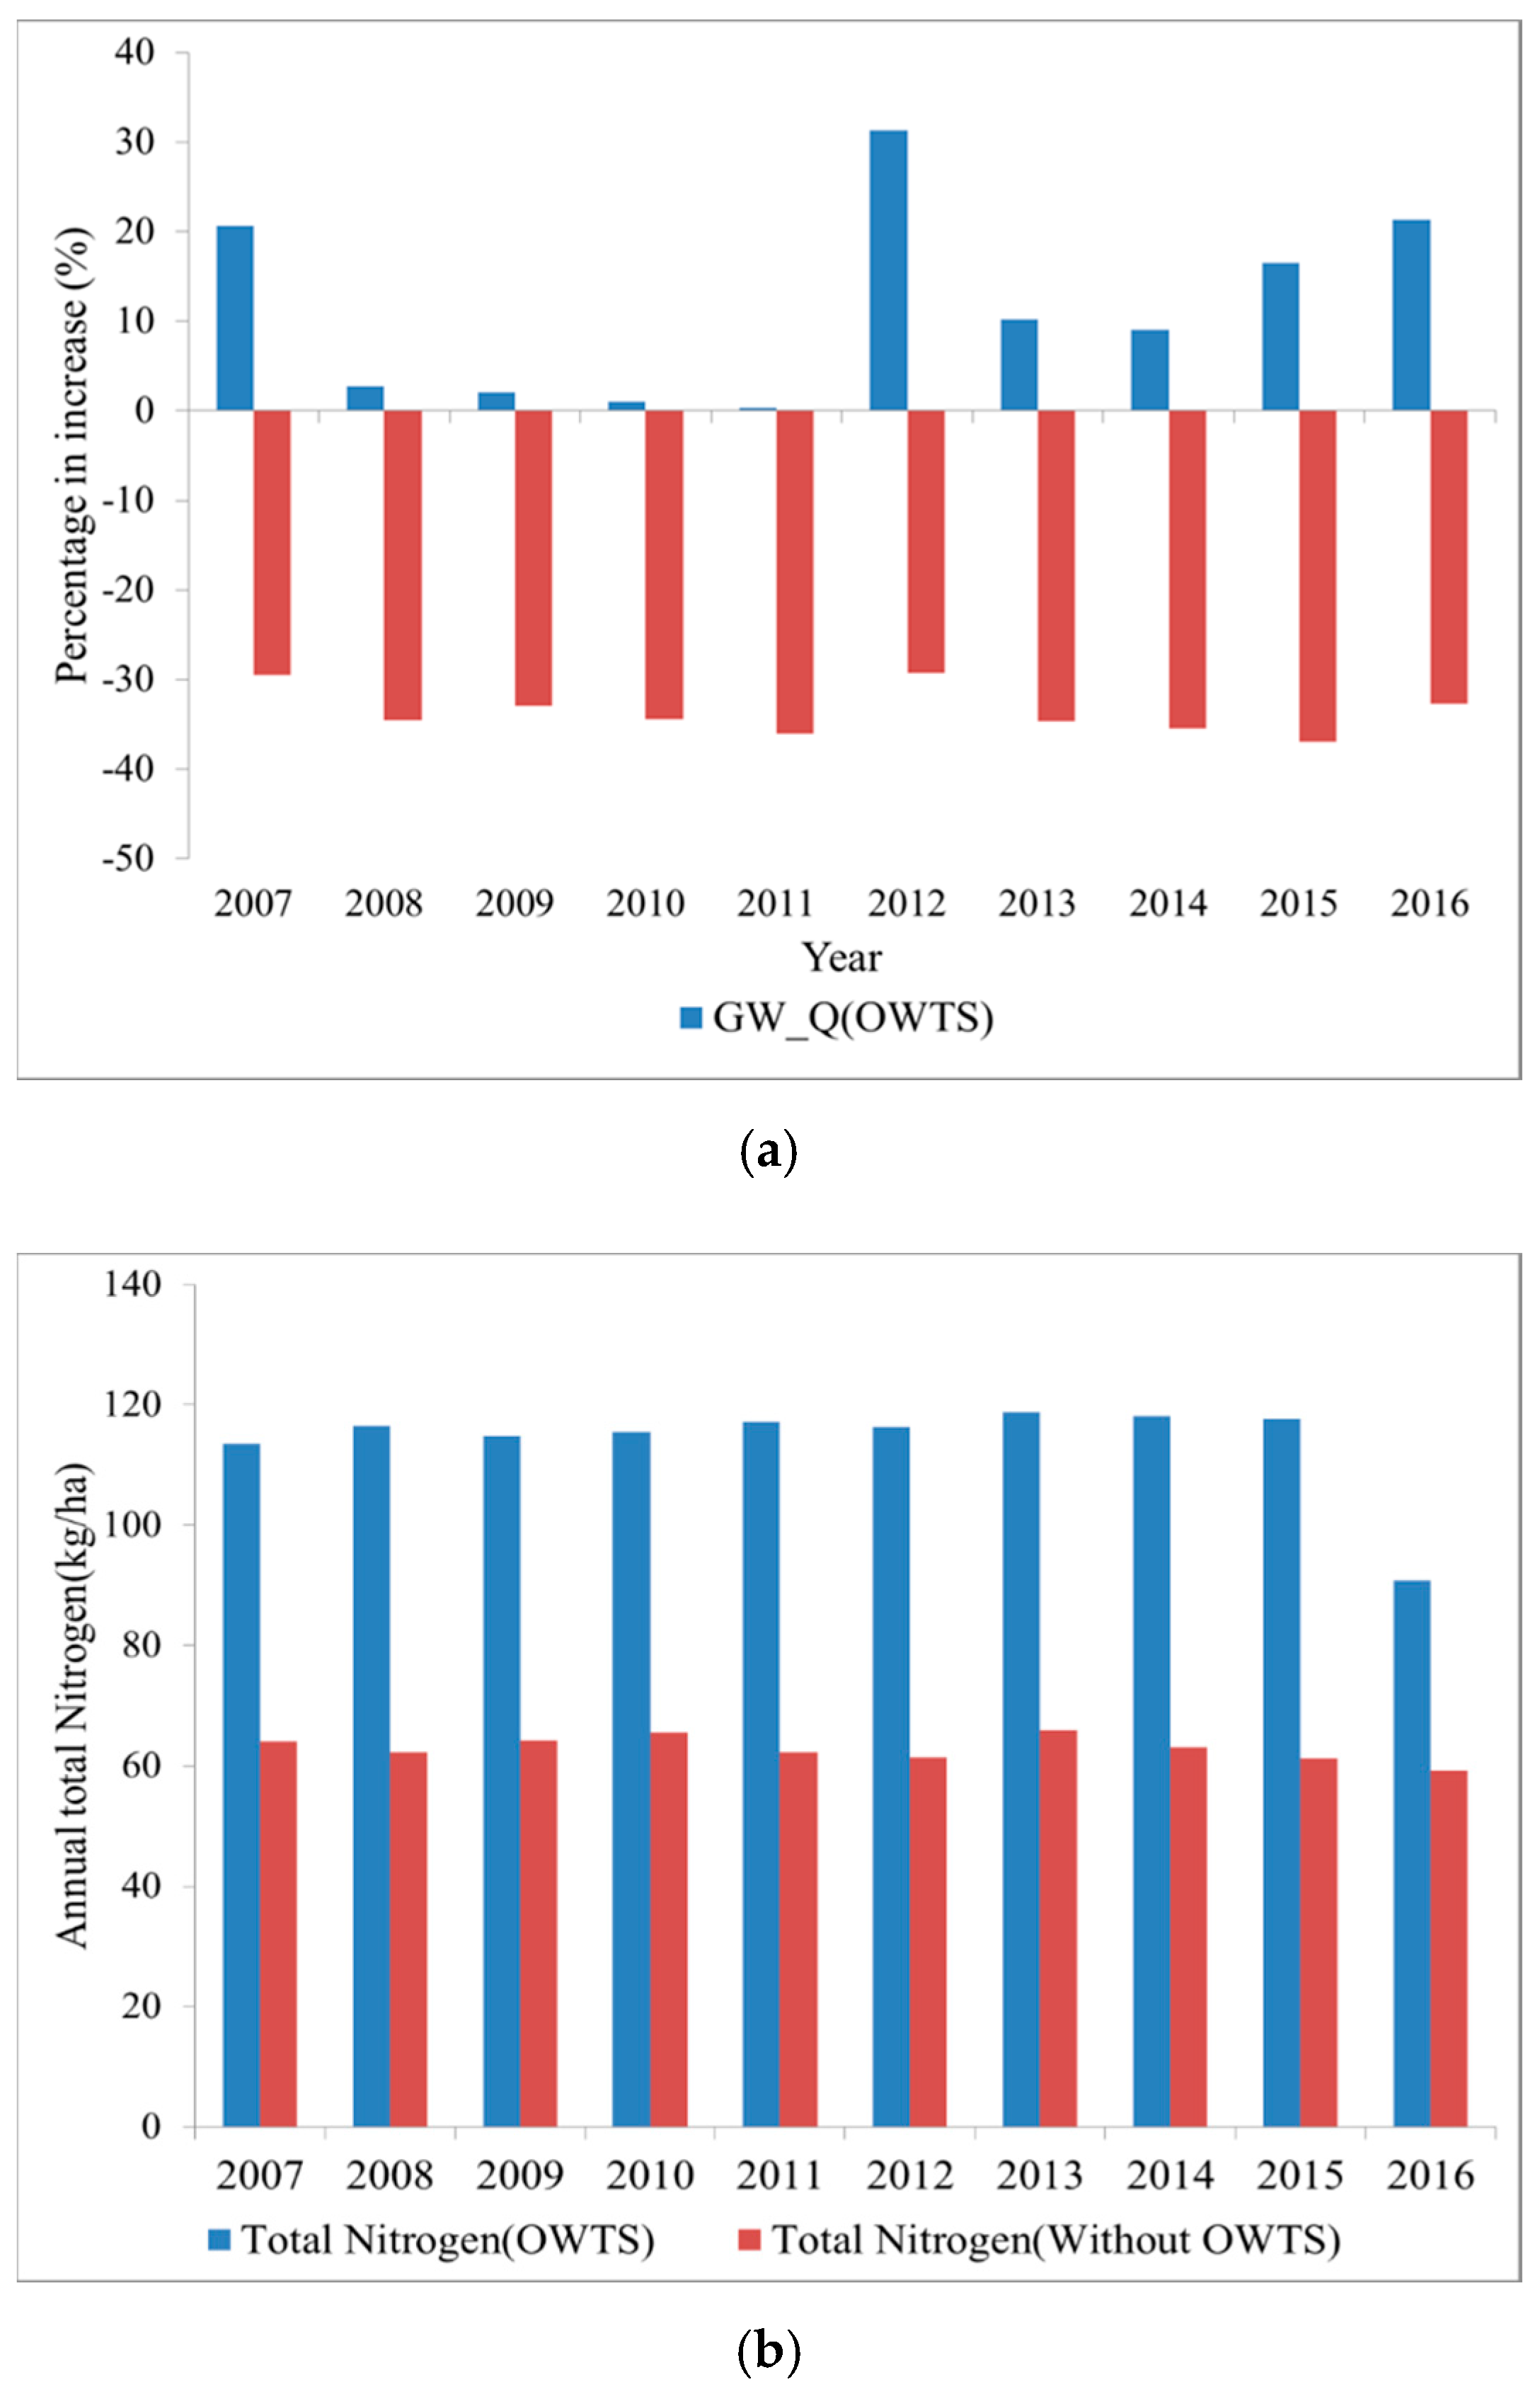
3.2. Influence of OWTS on Hydrologic Cycle
4. Discussion
5. Conclusions
Acknowledgments
Author Contributions
Conflicts of Interest
References
- Diaz, R.J. Overview of hypoxia around the world. J. Environ. Qual. 2001, 30, 275–281. [Google Scholar] [CrossRef] [PubMed]
- Altieri, A.H.; Gedan, K.B. Climate change and dead zones. Glob. Chang. Biol. 2015, 21, 1395–1406. [Google Scholar] [CrossRef] [PubMed]
- Diaz, R.J.; Rosenberg, R. Spreading dead zones and consequences for marine ecosystems. Science 2008, 321, 926–929. [Google Scholar] [CrossRef] [PubMed]
- Blank, R.; Mesenbourg, T. 2010 Census of Population and Housing Unit Counts; U.S. Census Bureau: Washington, DC, USA, 2010. [Google Scholar]
- Nixon, S.W.; Pilson, M.E.Q. Nitrogen in estuarine and coastal marine ecosystems. Nitrogen Mar. Environ. 1983, 565, 648. [Google Scholar]
- Oczkowski, A.; Nixon, S.; Henry, K.; DiMilla, P.; Pilson, M.; Granger, S.; Buckley, B.; Thornber, C.; McKinney, R.; Chaves, J. Distribution and trophic importance of anthropogenic nitrogen in Narragansett Bay: An assessment using stable isotopes. Estuaries Coasts 2008, 31, 53–69. [Google Scholar] [CrossRef]
- DEM, R.I. The Greenwich Bay Fish Kill–August 2003: Causes, Impacts and Responses; Rhode Island Department of Environmental Management: Narragansett, RI, USA, 2003. [Google Scholar]
- Amador, J.A.; Loomis, G.; Lancellotti, B.; Hoyt, K.; Avizinis, E.; Wigginton, S. Reducing Nitrogen Inputs to Narragansett Bay: Optimizing the Performance of Existing Onsite Wastewater Treatment Technologies; Department of Natural Resources Science, New England Onsite Wastewater Training Program, Coastal Institute University of Rhode Island: Providence, RI, USA, 2017. [Google Scholar]
- U.S. Environmental Protection Agency. Onsite Wastewater Treatment Systems Manual; USEPA, Ed.; U.S. Environmental Protection Agency: Washington, DC, USA, 2002; ISBN 9781467376556.
- Freedman, P.L.; Pendergast, J.F.; Canale, R.P. Modeling storm overflow impacts on eutrophic lake. J. Environ. Eng. Div. 1980, 106, 335–349. [Google Scholar]
- Jeong, J.; Santhi, C.; Arnold, J.G.; Srinivasan, R.; Pradhan, S.; Flynn, K. Development of algorithms for modeling onsite wastewater systems within SWAT. Trans. ASABE 2011, 54, 1693–1704. [Google Scholar] [CrossRef]
- Hoghooghi, N.; Radcliffe, D.E.; Habteselassie, M.Y.; Clarke, J.S. Confirmation of the Impact of Onsite Wastewater Treatment Systems on Stream Base-Flow Nitrogen Concentrations in Urban Watersheds of Metropolitan Atlanta, GA. J. Environ. Qual. 2016, 45, 1740–1748. [Google Scholar] [CrossRef] [PubMed]
- Oliver, C.W.; Radcliffe, D.E.; Risse, L.M.; Habteselassie, M.; Mukundan, R.; Jeong, J.; Hoghooghi, N. Quantifying the contribution of on-site wastewater treatment systems to stream discharge using the SWAT model. J. Environ. Qual. 2014, 43, 539–548. [Google Scholar] [CrossRef] [PubMed]
- Hoghooghi, N.; Radcliffe, D.E.; Habteselassie, M.Y.; Jeong, J. Modeling the Effects of Onsite Wastewater Treatment Systems on Nitrate Loads Using SWAT in an Urban Watershed of Metropolitan Atlanta. J. Environ. Qual. 2017, 46, 632–640. [Google Scholar] [CrossRef] [PubMed]
- Moriasi, D.N.; Arnold, J.G.; Van Liew, M.W.; Binger, R.L.; Harmel, R.D.; Veith, T.L. Model evaluation guidelines for systematic quantification of accuracy in watershed simulations. Soil Water Div. ASABE 2007, 50. [Google Scholar]
- Neitsch, S.L.; Arnold, J.G.; Kiniry, J.R.; Srinivasan, R.; Williams, J.R. Soil and Water Assessment Tool User’s Manual; Texas Water Resources Institute, College Station, Texas A&M Universitry: College Station, TX, USA, 2002. [Google Scholar]
- Brown, L.; Barnwell, T. The Enhanced Stream Water Quality Models QUAL2E and QUAL2E-UNCAS; US Environmental Protection Agency, Office of Research and Development, Environmental Research Laboratory: Washington, DC, USA, 1987. [Google Scholar]
- Weintraub, L.H.Z.; Chen, C.W.; Goldstein, R.A.; Siegrist, R.L. WARMF: A watershed modeling tool for onsite wastewater systems. In Proceedings of the 10th National Symposium on Individual and Small Community Sewage Systems, ASAE; American Society of Agricultural Engineers: St. Joseph, MI, USA, 2004; pp. 636–646. [Google Scholar]
- Abbaspour, K.C. User Manual for SWAT-CUP, SWAT Calibration and Uncertainty Analysis Programs; Swiss Federal Institute of Aquatic Science and Technology: Eawag, Duebendorf, Switzerland, 2007; pp. 1596–1602. [Google Scholar]
- Rhode Island Geographic Information System (RIGIS). Available online: http://www.edc.uri.edu/rigis/ (accessed on 10 May 2017).
- Daly, C.; Halbleib, M.; Smith, J.I.; Gibson, W.P.; Doggett, M.K.; Taylor, G.H.; Curtis, J.; Pasteris, P.P. Physiographically sensitive mapping of climatological temperature and precipitation across the conterminous United States. Int. J. Climatol. 2008, 28, 2031–2064. [Google Scholar] [CrossRef]
- Rhode Island Geographic Information System (RIGIS) Data Distribution System SOIL_soils. Available online: http://www.rigis.org/geodata/soil/Soils16.zip (accessed on 28 September 2016).
- Rhode Island Geographic Information System (RIGIS) Data Distribution System Land use and Land Cover. Available online: http://data.rigis.org/PLAN/rilc0304.zip (accessed on 7 October 2007).
- U.S. Geological Survey. National Elevation Dataset (NED) 1/3 Arc-Second. Available online: https://viewer.nationalmap.gov/basic/?basemap=b1&category=ned,nedsrc&title=3DEP View (accessed on 1 January 2014).
- Rhode Island Geographic Information System (RIGIS) Data Distribution System Sewered Areas; sewerAreas12. Available online: http://www.rigis.org (accessed on 16 October 2014).
- Green, L.T.; Herron, E.M. University of Rhode Island Watershed Watch. Available online: www.uri.edu/watershedwatch/ (accessed on 1 January 2017).
- Santhi, C.; Arnold, J.G.; Williams, J.R.; Dugas, W.A.; Srinivasan, R.; Hauck, L.M. Validation of the swat model on a large RWER basin with point and nonpoint sources. JAWRA J. Am. Water Resour. Assoc. 2001, 37, 1169–1188. [Google Scholar] [CrossRef]
- Nash, J.E.; Sutcliffe, J. V River flow forecasting through conceptual models part I—A discussion of principles. J. Hydrol. 1970, 10, 282–290. [Google Scholar] [CrossRef]
- Legates, D.R.; McCabe, G.J. Evaluating the use of “goodness-of-fit” measures in hydrologic and hydroclimatic model validation. Water Resour. Res. 1999, 35, 233–241. [Google Scholar] [CrossRef]
- Gupta, H.V.; Sorooshian, S.; Yapo, P.O. Status of automatic calibration for hydrologic models: Comparison with multilevel expert calibration. J. Hydrol. Eng. 1999, 4, 135–143. [Google Scholar] [CrossRef]
- Arnold, J.G.; Allen, P.M. Automated methods for estimating baseflow and ground water recharge from streamflow records. J. Am. Water Resour. Assoc. 1999, 35, 411–424. [Google Scholar] [CrossRef]
- Radcliffe, D.E.; Mukundan, R. PRISM vs. CFSR Precipitation Data Effects on Calibration and Validation of SWAT Models. J. Am. Water Resour. Assoc. 2017, 53, 89–100. [Google Scholar] [CrossRef]
- DiMilla, P.A.; Nixon, S.W.; Oczkowski, A.J.; Altabet, M.A.; McKinney, R.A. Some challenges of an “upside down” nitrogen budget—Science and management in Greenwich Bay, RI (USA). Mar. Pollut. Bull. 2011, 62, 672–680. [Google Scholar] [CrossRef] [PubMed]
- Gassman, P.W.; Reyes, M.R.; Green, C.H.; Arnold, J.G. The soil and water assessment tool: Historical development, applications, and future research directions. Trans. ASABE 2007, 50, 1211–1250. [Google Scholar] [CrossRef]


| Parameter Name | Parameter Descriptions | Value |
|---|---|---|
| SEP_CAP | Average number of permanent residents in a house | 2.5 |
| BZ_Area | Surface area of drain field (m2) | 100 |
| ISEP_TFAIL | Time until failing system gets fixed (days) | 70 |
| BZ_Z | Depth to the top of biozone layer (mm) | 500 |
| BZ_THK | Thickness of biozone layer(mm) | 50 |
| SEP_STRM_DIST | Distance to the stream from the septic hydrological response unit (HRU) (km) | 0.5 |
| Parameter Name | Descriptions | Fitted Value | Range | p-Value |
|---|---|---|---|---|
| R__CN2 | Initial Soil Conservation Service Runoff Curve | −1.11 | −2–1.5 | 0.00 |
| V__ALPHA_BF | Base flow alpha factor (days) | 0.74 | 0–1 | 0.88 |
| V__GW_DELAY | Groundwater delay (days) | 30.62 | 30–450 | 0.37 |
| V__GWQMN | Thresholds depth of water in the shallow aquifer required for return flow to occur (mm) | 1.88 | 0–2 | 0.02 |
| V__GW_REVAP | Groundwater “revap” coefficient | 0.04 | 0.02–0.2 | 0.52 |
| V__SURLAG | Surface lag factor | 1.66 | 0–2 | 0.41 |
| V__ESCO | Soil evaporation compensation factor | 0.207 | 0–1 | 0.42 |
| V__EPCO | Plant uptake compensation factor | 0.08 | 0–1 | 0.45 |
| V__REVAPMN | Threshold depth shallow aquifer for “revap” to occur (mm) | 43.95 | 0–300 | 0.22 |
| Parameter Name | Influence | Fitted Value | Range | p-Value |
|---|---|---|---|---|
| R__CN2 | Management | −1.38 | −2–1.5 | 0.00 |
| V__ALPHA_BF | Groundwater | 0.745 | 0–1 | 0.23 |
| V__GW_DELAY | Groundwater | 30.42 | 30–450 | 0.01 |
| V__GWQMN | Groundwater | 1.57 | 0–2 | 0.31 |
| V__GW_REVAP | Groundwater | 0.097 | 0.02–0.2 | 0.16 |
| V__SURLAG | Basin | 1.47 | 0–2 | 0.81 |
| V__ESCO | HRUs | 0.56 | 0–1 | 0.96 |
| V__EPCO | HRUs | 0.26 | 0–1 | 0.28 |
| V__REVAPMN | Groundwater | 84.9 | 0–300 | 0.79 |
| Name | Parameters | Fitted Value |
|---|---|---|
| Nitrogen percolation coefficient | V__NPERCO.bsn | 0.2 |
| Denitrification rate coefficient | V__COEFF_DENITR.sep | 0.32 |
| Denitrification exponential rate coefficient | R__CDN.bsn | 1.4 |
| Denitrification threshold water content | R__SDNCO.bsn | 1.1 |
| Nitrification rate coefficient | V__COEFF_NITR.sep | 1.5 |
| Statistical Metric | Flow Calibration | Flow Validation | Total Nitrogen Calibration | Total Nitrogen Validation |
|---|---|---|---|---|
| R2 | 0.79 | 0.7 | 0.14 | 0.15 |
| NSE | 0.78 | 0.5 | −1.3 | −6.95 |
| PBIAS | −8 | −12 | 72 | −36 |
| Statistical Metric | Flow Calibration | Flow Validation | Total Nitrogen Calibration | Total Nitrogen Validation |
|---|---|---|---|---|
| R2 | 0.78 | 0.68 | 0.5 | 0.81 |
| NSE | 0.75 | 0.4 | 0.5 | 0.78 |
| PBIAS | −18.4 | −30 | 3.95 | 6.95 |
© 2017 by the authors. Licensee MDPI, Basel, Switzerland. This article is an open access article distributed under the terms and conditions of the Creative Commons Attribution (CC BY) license (http://creativecommons.org/licenses/by/4.0/).
Share and Cite
Paul, S.; Cashman, M.A.; Szura, K.; Pradhanang, S.M. Assessment of Nitrogen Inputs into Hunt River by Onsite Wastewater Treatment Systems via SWAT Simulation. Water 2017, 9, 610. https://doi.org/10.3390/w9080610
Paul S, Cashman MA, Szura K, Pradhanang SM. Assessment of Nitrogen Inputs into Hunt River by Onsite Wastewater Treatment Systems via SWAT Simulation. Water. 2017; 9(8):610. https://doi.org/10.3390/w9080610
Chicago/Turabian StylePaul, Supria, Michaela A. Cashman, Katelyn Szura, and Soni M. Pradhanang. 2017. "Assessment of Nitrogen Inputs into Hunt River by Onsite Wastewater Treatment Systems via SWAT Simulation" Water 9, no. 8: 610. https://doi.org/10.3390/w9080610
APA StylePaul, S., Cashman, M. A., Szura, K., & Pradhanang, S. M. (2017). Assessment of Nitrogen Inputs into Hunt River by Onsite Wastewater Treatment Systems via SWAT Simulation. Water, 9(8), 610. https://doi.org/10.3390/w9080610