1. Introduction
Research in western North American climatology projects shifts in the timing of stream runoff and peak streamflow linked to increasing winter rain and declining snowpack resulting from anthropogenic climate warming [
1,
2]. There is growing concern about the capacity of existing infrastructure to mitigate flood and drought risks associated with these shifts. With recognition of the negative environmental and socioeconomic consequences of traditional storage structures (such as dams), interest is growing in alternative methods of retaining water that enhance natural systems while simultaneously improving resource availability for human use [
3,
4,
5,
6,
7,
8,
9,
10]. Recognizing the role that natural structures (e.g., wetlands and floodplains) play in slowing runoff and promoting groundwater recharge (i.e., natural water storage), resource managers have called for the development of a project that identifies potential natural storage sites and quantifies their storage potential for the purposes of storing and retaining water for the benefit of people and ecosystems.
The intent of this study is twofold. First, this research addresses the need for a method for identifying potential natural infrastructure sites using publicly available data and a geographic information system (GIS) based approach. Second, this study develops a model for quantifying the storage capacity of natural storage systems (e.g., floodplains and wetlands) using geospatial tools rather than strictly hydrologic programs or models. The goal of this model is to preliminarily identify potential natural infrastructure sites and estimate storage capacity in floodplains so that it may be refined and customized for site-specific application by stakeholders with GIS training.
This paper details the process of selecting a study site, the sources and parameters of the data used as model inputs, the process of quantifying study site storage potential, and the results of this pilot quantification method. It concludes with a discussion of model limitations, result implications, and future research directions. Both metric and imperial units are used, as the latter is utilized by most U.S.-based resource managers.
1.1. Natural Infrastructure and the Quantification of Natural Water Storage Capacity
The World Resources Institute defines natural infrastructure as the strategic use of networks of natural lands, working landscapes, and other open spaces to conserve ecosystem values and functions while providing associated benefits to human populations [
5]. The California Roundtable on Food and Water Supply (CRFWS) calls for a change in the way society conceptualizes water storage. Rather than thinking of storage in terms of traditional structures (e.g., concrete dams, ditches, and headgates), storage should be viewed as the product of complex physical features, landscape dynamics, and management processes with the potential to retain and release water over time, along with the revolving suite of regulations that govern them [
11]. This definition of storage emphasizes retaining water at a landscape scale and elongating the period of time that rainwater and snowmelt is available throughout the drier summer season. Natural water storage structures include existing natural systems such as floodplains, riparian areas, and wetlands that act to absorb excess floodwater, slow runoff, and promote groundwater recharge and the slow re-release of water back into a surface water system [
12,
13,
14].
As both a process and set of tools, natural infrastructure may be used to protect or enhance natural systems to promote ecological vitality and aid in the retention of water to meet human and environmental needs. Restoring wetlands, reconnecting incised streams to their floodplains through the removal of retired roads or railroads, and installing structures that mimic the ecological services provided by beavers are all examples of natural infrastructure-based methods of slowing runoff and promoting water retention in dewatered basins [
15,
16,
17,
18,
19,
20,
21,
22]. Previous research on the feasibility of wetlands and other natural infrastructures to attenuate flood and waste water has yielded promising results [
14,
23,
24,
25,
26,
27]. Beaver mimicry structures, for instance, can improve water quality and slow water flow, generate riparian vegetation, enhance channel stability and wetland hydrologic processes, deliver ancillary benefits to fisheries, and provide cost-effective natural storage opportunities [
15,
16,
17,
18,
19,
21]. Interflow and percolation of water from flood irrigation are critical to the existence of many wetlands in the West [
28,
29,
30,
31]. Likewise, wetlands contribute to late-season return flows and shallow aquifer recharge in regions where greater reliance on more efficient yet hydrologically consumptive sprinkler irrigation systems has reduced late-season water availability [
32,
33,
34,
35,
36].
Managed Aquifer Recharge (MAR) refers to the storage of water for future recovery through the intentional reintroduction of water into an aquifer. Common MAR methods include the direct injection of groundwater into an aquifer with well, shaft, or borehole recharge, water spreading methods such as flooding, induced infiltration of water into a streambank, storm or rainwater harvesting, and in-channel modifications that direct water to unsaturated aquifer infiltration zones or river sediments. An assessment of 226 case studies which apply water flow and transport models to evaluate different MAR methods found that spreading methods are the most commonly used MAR techniques worldwide [
37]. According to the same assessment, modeling is typically performed during the planning phase of MAR execution to evaluate the feasibility of MAR at a suggested site. The examples of natural infrastructure described in this paper might be categorized as in-channel modification methods of MAR, however none of the models analyzed in the 226 case studies specifically consider natural storage structures (e.g., beaver mimicry structures) as methods of storing early spring runoff for late-season use. Other models that consider the storage of surface water or rainwater direct attention to lock and weir structures, percolation tanks, or irrigation diversion dams as mechanisms for enhancing aquifer water storage [
38,
39,
40,
41].
Several studies have attempted to predict floodplain and wetland water storage, but the development of a timely and cost-effective method for preliminarily estimating natural water storage capacity that may be used in the first phases of natural infrastructure planning remains a challenge that warrants further research. Specifically, the development of a method for estimating the physical storage capacity of potential natural water storage sites in a way that can be efficiently employed by varying stakeholders has yet to be accomplished. For example, recent attempts to model natural water storage have done so by either isolating the dominant processes influencing wetland hydrology, calculating the water storage capacities of surficial depressions in isolated wetlands, calculating the volume of space between the ground surface and the elevation where water begins to spill out of a wetland, or treating storage potential as the volume of floodwater associated with different flood events that would inundate different floodplain extents [
42,
43,
44,
45]. However, these attempts fall short in offering both a method for identifying potential natural infrastructure sites and a method that treats natural storage as the physical volume of space that is available to store water between the ground surface and the groundwater table. Additionally, the hydraulic models referenced above require a combination of licensing fees, data collected in situ and/or additional data collection equipment, or an advanced understanding of hydrologic flow dynamics and modeling. This can be prohibitive for managers seeking more agile or user-friendly models intended to preliminarily assess natural storage feasibility. In contrast, although the development of the model and methods outlined in this paper was completed in ArcGIS (which requires the purchase of a user license), all of the data inputs and model elements are open-access and can be converted to formats that are compatible with open-source programming languages.
1.2. Case Study: The Musselshell River Basin
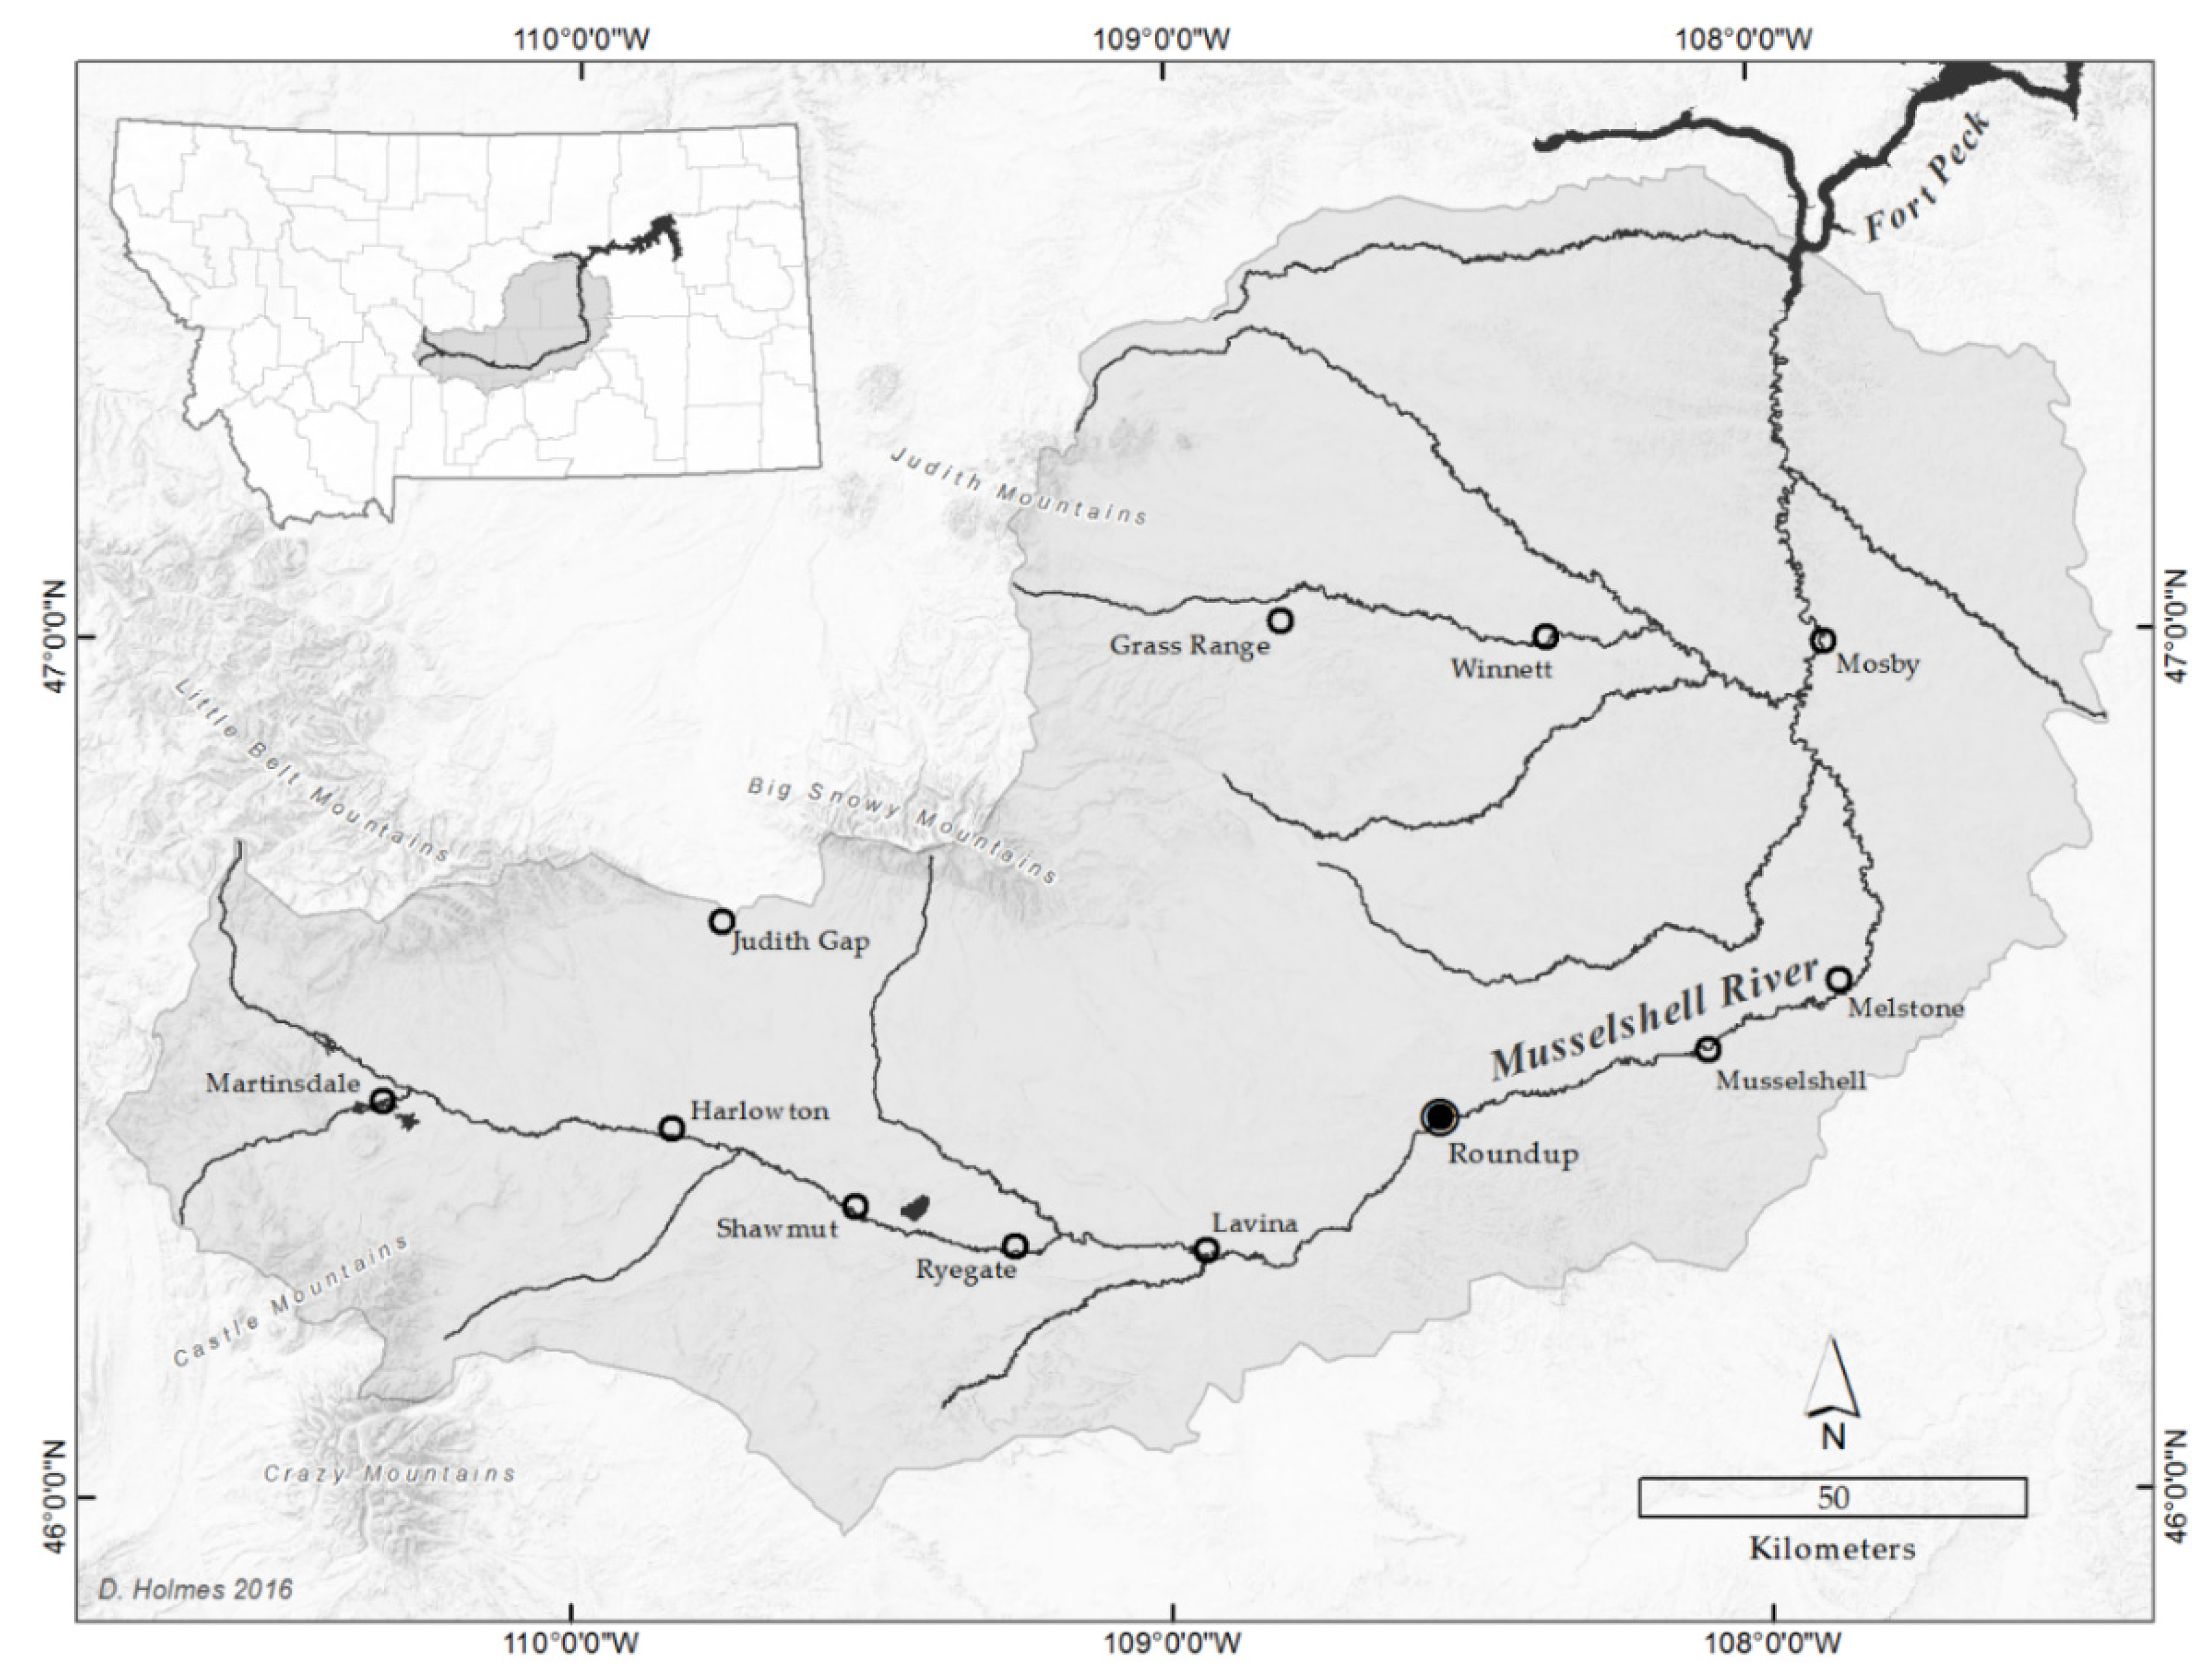
The Musselshell River (MSR) in central Montana, U.S., is a chronically dewatered river that experienced unprecedented flooding in 2011 and 2014, and is a high-priority area for assessing floodplain water storage potential [
46,
47,
48] (
Figure 1). After the 2011 flood, a community-led group known as the Musselshell Watershed Coalition (MWC) formed to evaluate and implement strategies for improving basin water management in the face of extreme floods and droughts.
The MSR is a 550 kilometer (km) long tributary of the Missouri River, and is fed by snowmelt from the Crazy, Little Belt, Big Snowy, and Judith Mountains. The MSRB covers nearly 25,900 km
2, and elevations in the basin range from over 2800 meters (m) in the Crazy Mountains to roughly 610 m at the mouth of the MSR. The MSR drainage can be divided into a cold water zone in the Upper Basin, a transitional zone in the middle portion of the basin, and a warm water zone downstream of the town of Roundup, the most populous town in the basin. Between 1928 and 2009, over 42.5 million fish—including 27 million rainbow trout—were stocked in the MSR watershed by the Montana Department of Fish, Wildlife, and Parks (DFWP) [
46]. Despite severe issues related to chronic dewatering, high temperatures, and poor water quality, the DFWP reports that the MSR’s warm water zone contains a nearly intact native fish ecosystem and at least 31 species of fish. However, the fishery is impaired in the warm water zone due to erratic discharge and an abundance of diversion structures. The DFWP recommends a minimum year-round streamflow of two cubic meters per second (m
3/s) in the warm water zone of the MSR to maintain the fishery [
46]. (Note: 1 m
3 ≈ 35 ft
3.)
With a population of approximately 10,000 residents, the basin encompasses some of the most rural land in the United States. Approximately 31,500 hectares (ha) (77,840 acres (ac)) of land are irrigated annually in the MSRB since most basin residents rely primarily on agricultural activities for their income. Many irrigators diverting from the MSR rely on contract water deliveries from the three largest reservoirs in the basin, which have a combined capacity of 132,001,030 m
3 (107,015 acre-feet (AF)). Seven U.S. Geological Survey (USGS) stream gauges in Martinsdale, Harlowton, Shawmut, Lavina, Roundup, Musselshell, and Mosby collect stage and discharge data along the MSR, though many of its tributaries remain ungauged. The development of roads and railroads, along with numerous flood events, have caused the MSR to become disconnected from its floodplain in many reaches, leading to faster streamflows, streambed incisement, rapid abandonment of stream reaches, and a general decrease in floodplain storage capacity [
47,
49].
Beginning in the late 19th century, a series of infrastructure projects transformed the MSR’s course. The construction of the Montana (later the Milwaukee) Railroad in 1895 affected 333 km of the MSR, which was shortened and straightened to minimize the length of track and the need for bridges [
47,
50]. Over 140 river meanders were shortened or cut off, and a total of 56 km of meander length above Melstone have been isolated by the abandoned railroad [
47,
51]. The Montana railroad also reduced channel access to the historic MSR floodplain, leading to further river straightening and streambed incision, higher flow velocities, and lower residence time of water in the basin [
47].
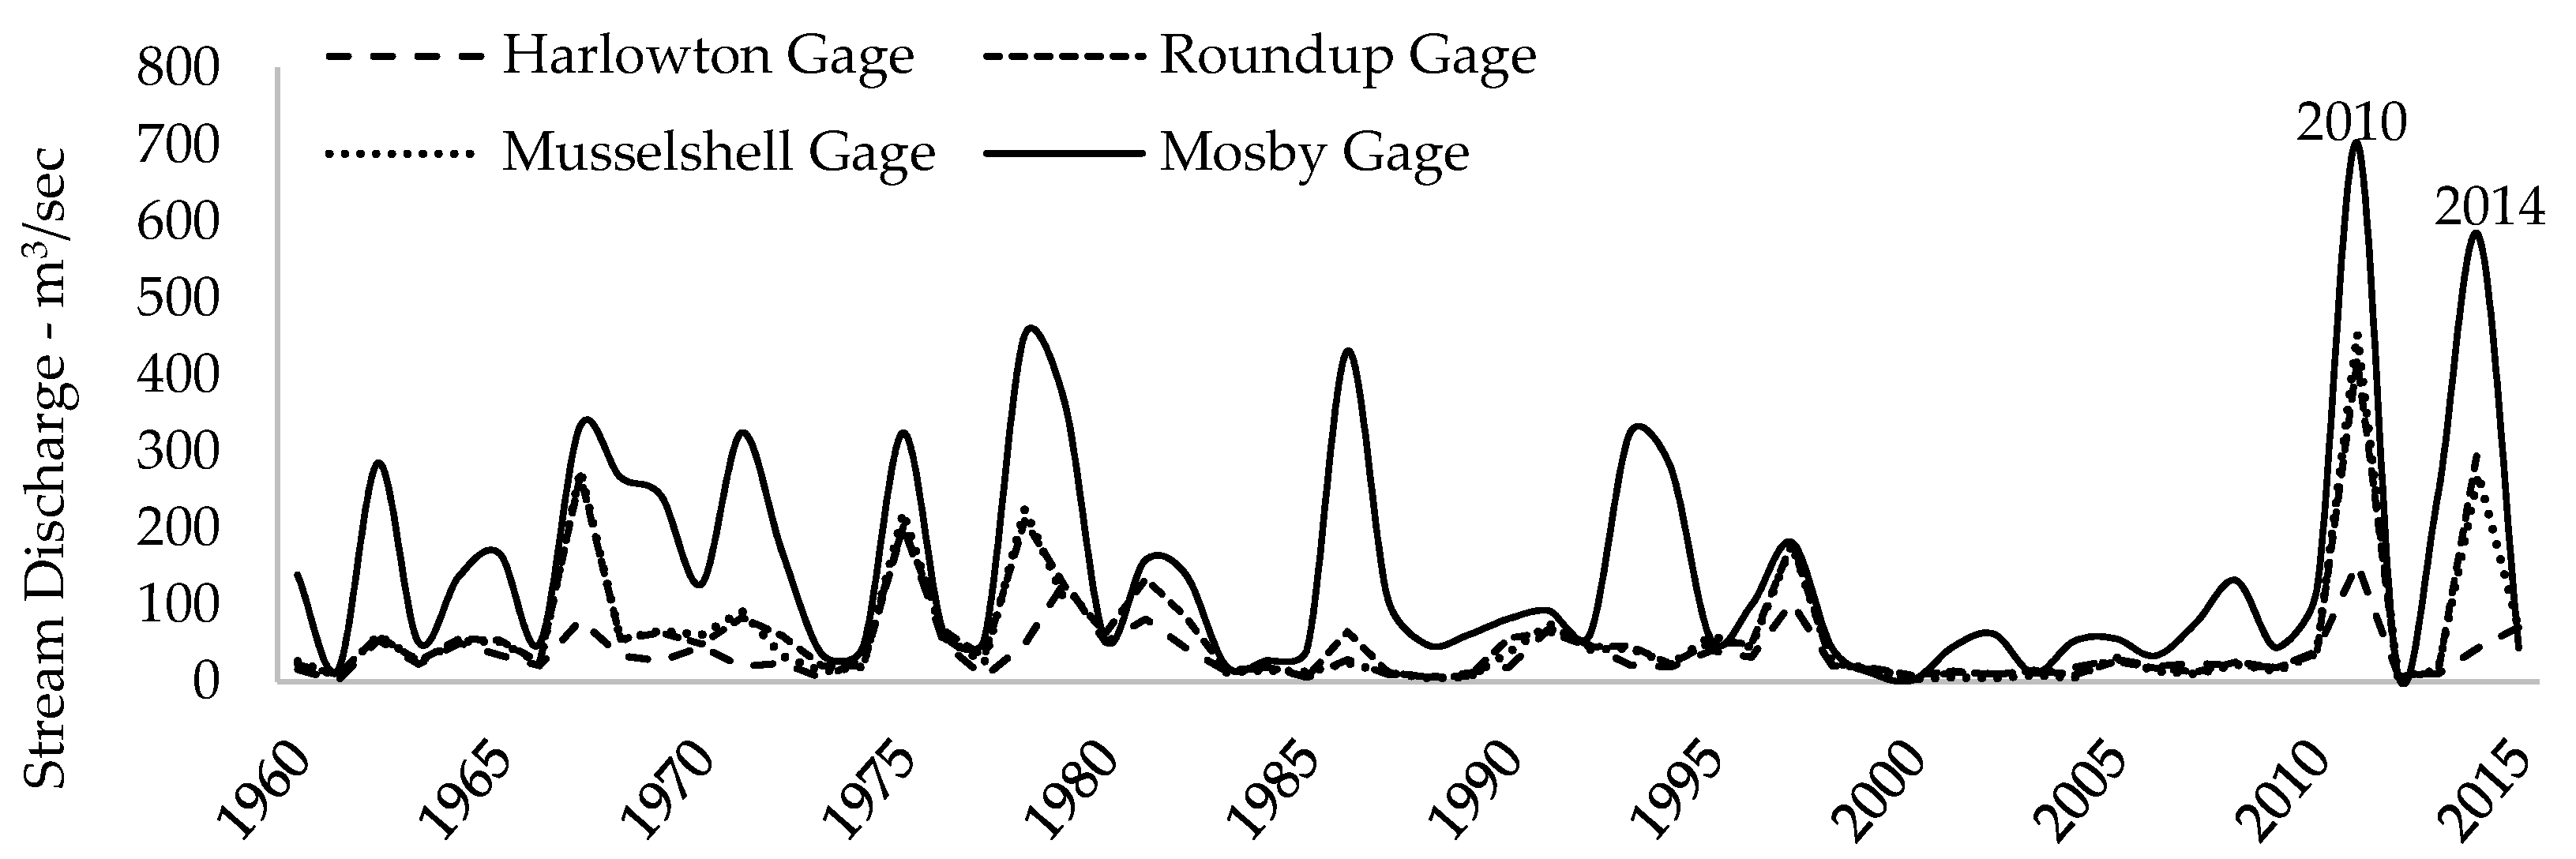
The MSRB normally floods in the spring when streamflows peak around 11.5 m
3/s (406 cubic feet per second (cfs)) at the Musselshell stream gauge. However, in 2011, above average snowpack coupled with extreme spring precipitation resulted in record-breaking flooding in the basin. That spring, the Mosby stream gauge read 703 m
3/s (24,800 cfs), the fastest streamflow measured in the MSR (
Figure 2). Following the 2011 flood, a report published by the River Assessment Triage Team (RATT) detailed flood damage, including 59 avulsions, the net loss of 28 km of river channel, severe bank erosion, channel incision, 31 complete breaches of the railroad grade, extensive irreparable irrigation and diversion structure damage, road damage, floodplain erosion, and widespread cottonwood seedling deposition [
47]. Another flood event of a similar magnitude struck the MSRB in 2014. Despite the considerable damage, the widening of the channel is expected to strongly influence fish habitat, with avulsions potentially playing an important role in improving the prairie stream and riparian ecosystem.
1.2.1. Selected Study Site
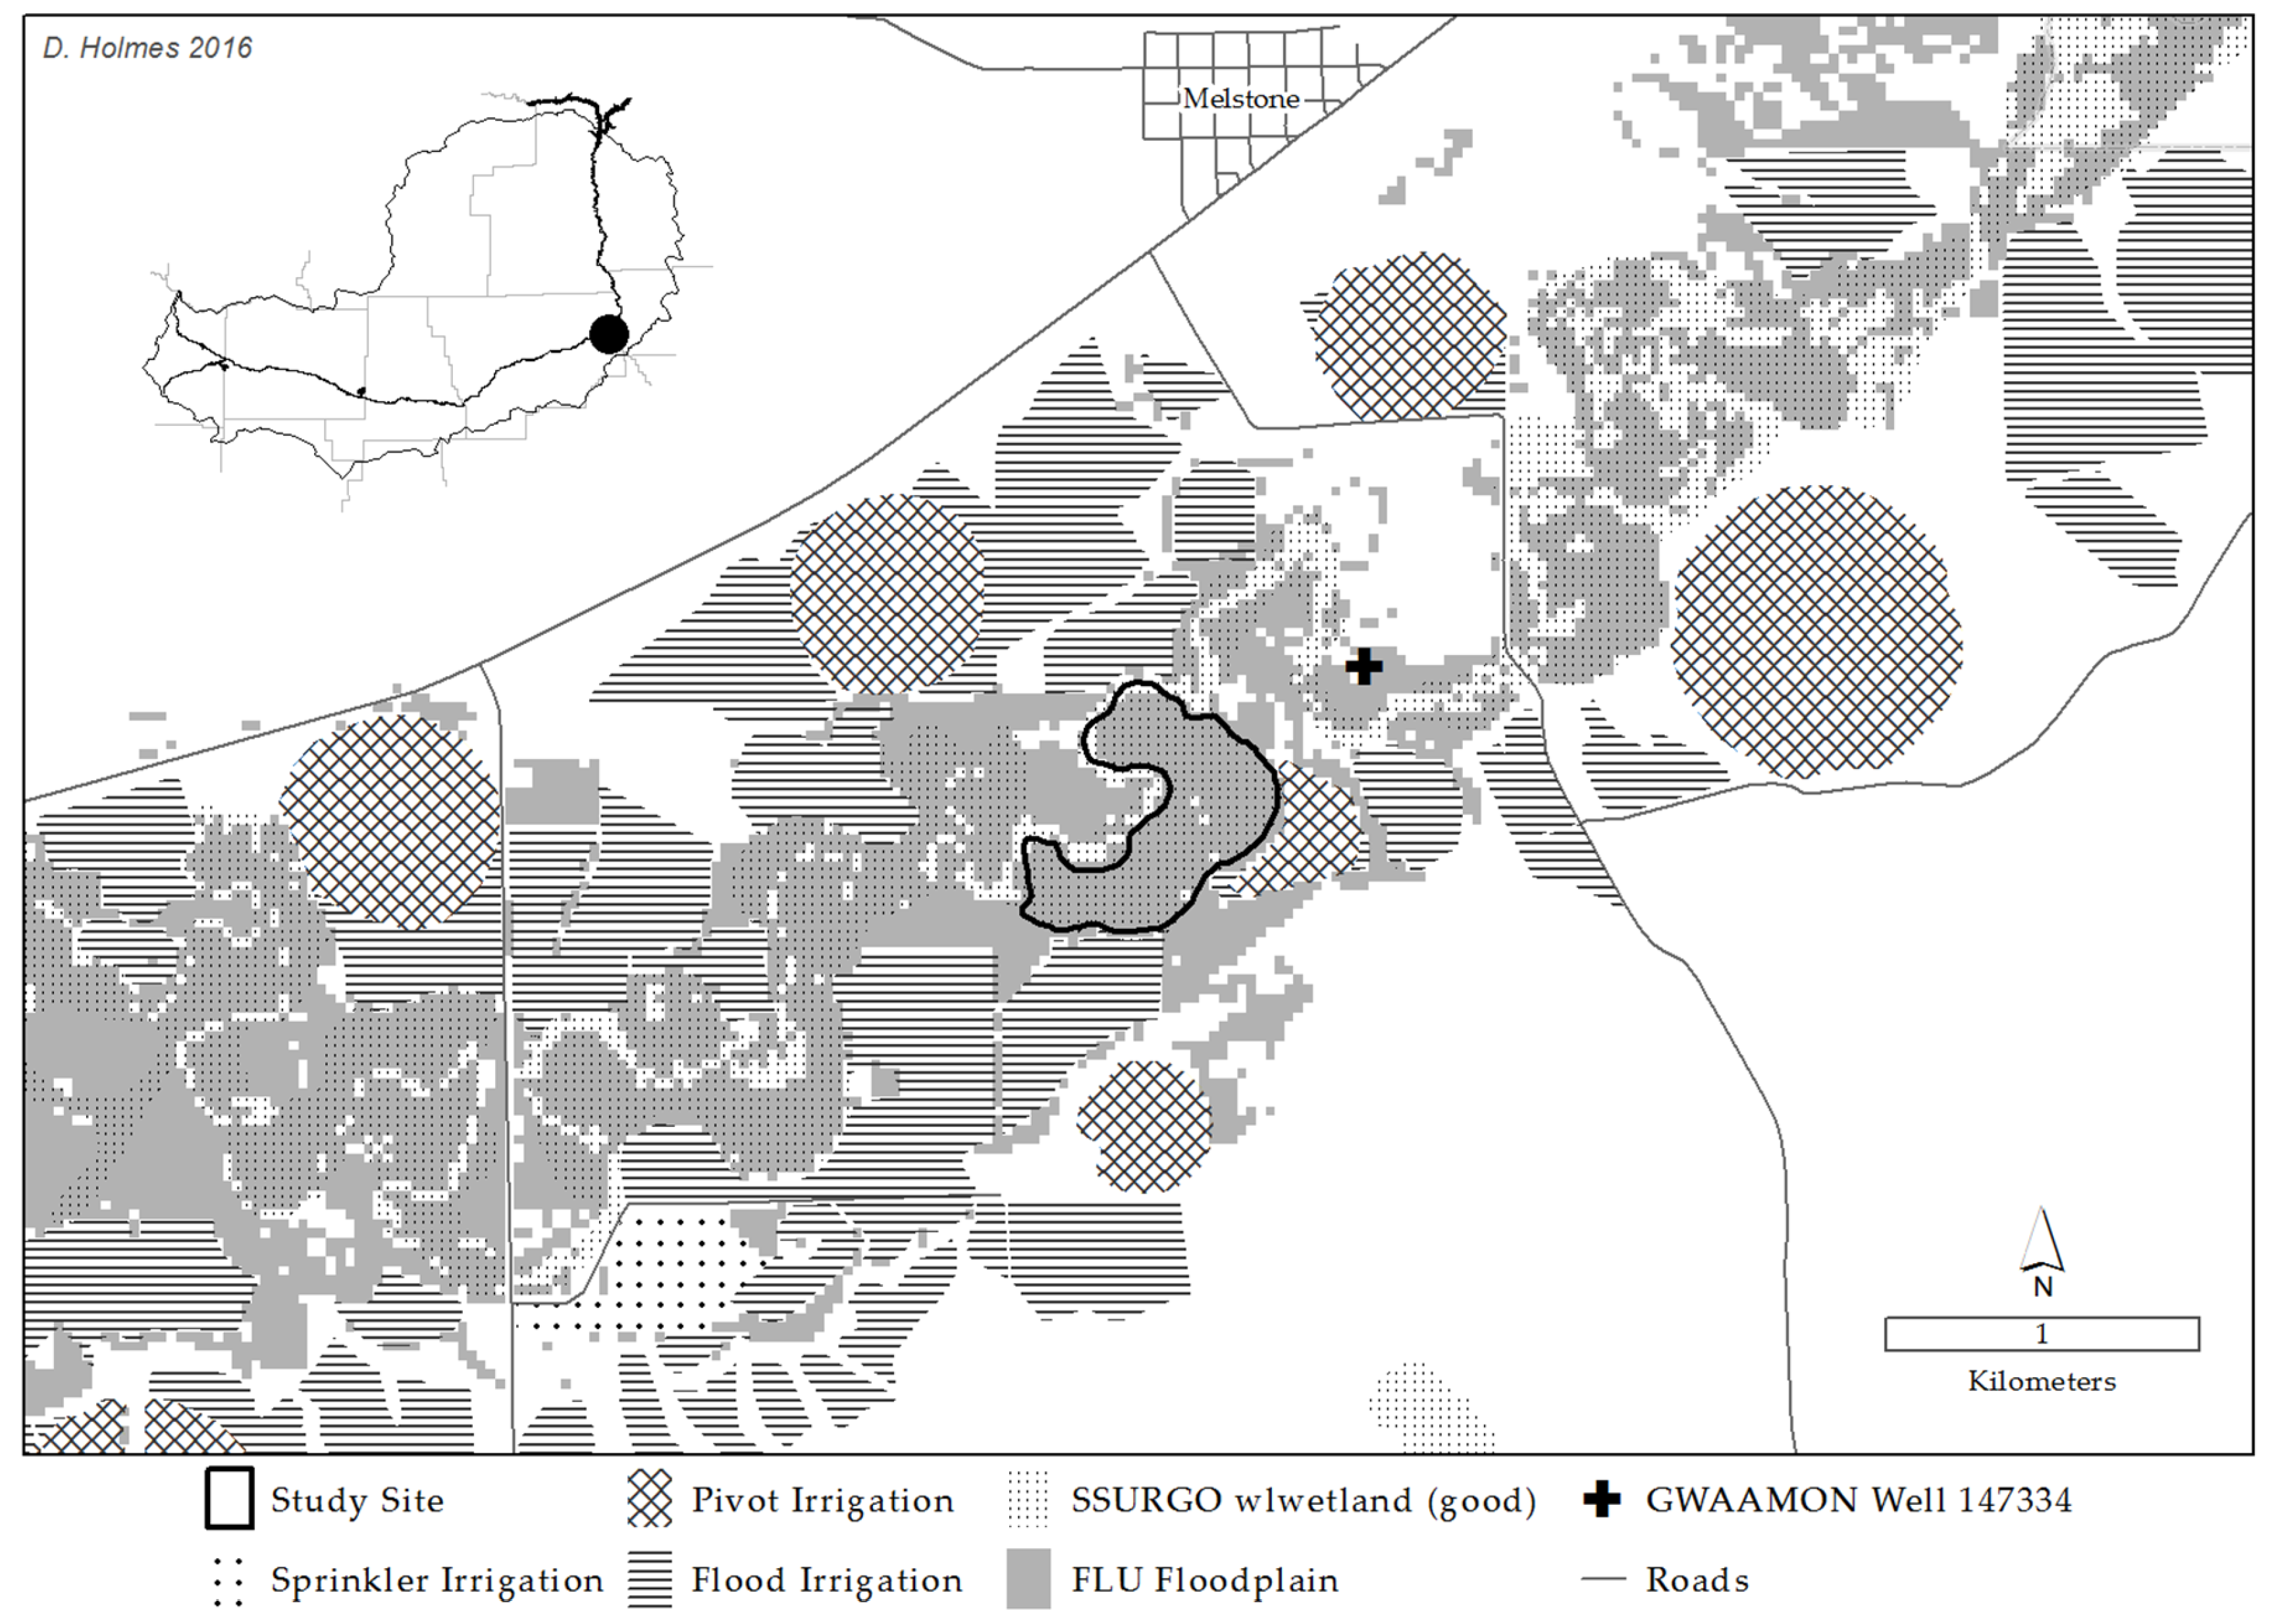
In consultation with MWC members, site selection was focused near Melstone, Montana, which experienced significant damage following the 2011 flood and is prone to frequent water shortages. A specific 0.33 km
2 (33 ha) study site was selected based on a set of site selection criteria (described below) including site classification as floodplain, high suitability of site soils to support wetland habitat, the absence of on-site transportation infrastructures, and close site proximity (422 m) to a long-term groundwater monitoring well (
Figure 3). A portion of the study site (~6%) is classified by the U.S. Fish and Wildlife Service’s National Wetlands Inventory as freshwater emergent palustrine wetland. The study site is located 1.8 km south of Melstone on non-agricultural land. Although the selected site is surrounded by agricultural irrigation, the impact of surrounding irrigation activities on the selected site’s water storage potential was not assessed in this study. All modeling processes described in this paper were applied exclusively within the study site boundary outlined in
Figure 3.
2. Materials and Methods
The purpose of the model described in this section is to provide a preliminary method for: (1) identifying natural storage sites that may be able to support natural infrastructures; and (2) estimating the volumetric storage capacity of these potential natural storage sites. In this study, storage potential was assumed to be the physical volume of space available for the storage of water in the ground between the land surface of the study site and the groundwater table. Storage potential as it is defined in this study does not consider water that might temporarily pool above the surface during a flood event as it was assumed that water stored beneath the ground surface is more likely than water stored (temporarily) in above-surface depressions to contribute to return flows.
Research objectives were addressed using GIS techniques and open-source data collected by various federal and state agencies. Geographic analysis was completed using ArcGIS 10.2. To quantify natural storage potential, it was necessary to first identify an appropriate site using specific site selection criteria, obtain and prepare the necessary data, and analyze each of the model elements described below. In addition to developing a set of site selection criteria, finding a study area relied on personal correspondence with local water experts, policy makers, water resource managers, and residents of the MSRB who have worked on or contributed to its evolving water management structure. The collective insight of local stakeholders into the water storage and management needs in the study region was intended to guide the selection of places that were modeled to be adequate potential natural infrastructure sites, and that more closely aligned with areas that were perceived by stakeholders to have a greater need for water.
2.1. Site Selection Parameters and Storage Quantification—Model Inputs
Though a small portion of land was analyzed at this stage, the open-source data used in the site selection process are available for the rest of Montana, and can be used to perform the same analysis in other floodplains. After considering the guidance and input of local stakeholders, storage analysis was confined to the 450 km2 surrounding Melstone due to the notable impacts of the 2011 flood in the area, along with the pressing water needs of Melstone-area water users. The specific study location was further refined according to a set of four selection criteria developed using public data and designed to facilitate the quantification of storage at a site with the greatest likelihood of successful natural infrastructure implementation. The four selection criteria that were required to identify potential natural infrastructure sites were: (1) site classification as “floodplain”; (2) proximity to a long term monitoring well; (3) high suitability of soils to support wetland habitat; and (4) the absence of built infrastructures such as roads and railroads on the site. The development of a GIS-based model to select potential sites and quantify floodplain storage relied on the availability of data informing four key elements: surface elevation, physical soil characteristics, land cover and land use patterns, and groundwater levels. Site fulfillment of each criterion was established by studying a set of public geospatial data whose parameters and general relevance in this process are described below. While the following variables (elevation, soil characteristics, land cover, groundwater levels) were integral to developing a method for identifying plausible natural infrastructure sites, only the elevation, soil, and well data were used in later natural storage quantification.
2.1.1. Elevation Data
LiDAR data for the stretch of the MSR from Harlowton, Montana, to the Crooked Creek Recreation Area near Fort Peck were provided by DTM Consulting, Inc., and Applied Geomorphology, Inc., both based in Bozeman, MT, USA. National Agricultural Imagery Program (NAIP) aerial photographs taken in 2013 were used for reference validation of features in and around the study site.
Until recently, the spatial resolutions of publicly available digital topographic data for the United States were insufficient to map geomorphic features (including wetlands and floodplains), but LiDAR-derived DEMs are able to provide superior vertical accuracy and horizontal resolution [
56]. For basin scale natural water storage research, lower resolution elevation data may suffice, but for smaller (e.g., local) scale efforts, high resolution elevation data are crucial. Aircraft-mounted LiDAR sensors measure groundcover characteristics by determining the travel time of laser pulses (hundreds of thousands per second) to objects on the ground and back to the airborne sensor. The current generation of high resolution DEMs and digital surface models make LiDAR valuable for forestry and vegetation analyses, while the ability to filter and remove the influence of vegetation canopies make LiDAR especially useful in wetland research applications [
56,
57,
58]. Use of LiDAR data in wetland studies eliminates the need for in situ laser transects and the high costs associated with regular field visits [
43,
58,
59,
60,
61]. In Montana, LiDAR elevation data have been particularly effective when employed in flood inundation research, human stream impact studies, and channel migration zone mapping [
62,
63,
64,
65,
66]. Acquiring the imagery in a time-effective manner is a costly process and requires an aircraft and sizable data storage, however the Natural Resources Conservation Service (NRCS) provides statewide 1 m resolution bare-earth LiDAR elevation data for each state in the U.S. West, excluding Nevada [
67].
2.1.2. Soil Data
Familiarity with site-specific soil characteristics is essential in the assessment of surface and groundwater interactions and processes, including those that determine the water storability of small floodplains [
68]. Since wetlands and floodplains often act as natural reservoirs of water and contribute to downstream return flows, this study only considered areas containing soils that have a high likelihood of supporting wetland vegetation. The United States Department of Agriculture’s NRCS has developed the State Soil Geographic (STATSGO) and Soil Survey Geographic (SSURGO) databases that are frequently referenced in studies requiring information on soil characteristics at large (STATSGO) and small (SSURGO) geographic scales, and in GIS compatible formats. SSURGO provides general land cover classifications (e.g., floodplain, agricultural land, urban), and information on physical soil characteristics available for the first 150 cm of soil in a given study area, including hydraulic conductivity, available water storage, bulk density, and sand/silt/clay/organic matter content. The use of SSURGO as an input in several hydrologic models and finer-scale studies has yielded favorable results compared with STATSGO data inputs [
69,
70,
71]. With the exception of a few counties, SSURGO data are published and available in every state in the U.S., including Hawaii and Alaska [
72].
SSURGO data for the broader study region include two parameters (“wlwetplant” and “wlshallowwet”) that delineate soils with high suitability to support wetland plants and the shallow water habitats needed to sustain riparian wildlife. The SSURGO database for Melstone-area soils also includes percentage values for porosity (α) that were used in actual natural storage estimation. The average α parameter for this study’s site soils as provided by SSURGO was listed as 0.16 (i.e., 16% of study site soil volume is available to store water).
The SSURGO data used in the development of the MSR natural storage model all assumed study site soils were at field capacity. Field capacity is the value of water content remaining in a unit volume of soil after downward gravity drainage has ceased, and under these conditions, water may be removed from soil either through direct evaporation or by plant uptake [
73]. As soil dries, water movement becomes more difficult and may reach the point where the water is so strongly bound to soil particles that it can no longer be removed via plant uptake or evaporation. This condition is known as the wilting point because a plant is likely to lose turgor and wilt if the soil is not replenished with water [
74]. SSURGO data for soils that have reached wilting point were excluded from natural storage simulation in this study as it was assumed the input of surface water to site soils at wilting point would quickly be removed by plants until the soil reached field capacity. Additionally, the drier conditions characteristic of soils at wilting point are conducive to water being bound in soil rather than slowly released over time.
2.1.3. Land Cover and Land Use Data
Impermeable built infrastructures such as roads and railroads have the potential to disrupt lateral connectivity in streams [
75]. For this reason, such sites were excluded from consideration in this study and impervious surfaces such as those characteristic of roads or large buildings are not modeled. In this study, transportation structures were identified using the Montana Spatial Data Infrastructure’s Transportation Framework, and the analysis of areas interrupted by such structures was avoided as such sites were considered poor natural infrastructure sites. The Transportation Framework provides GIS shapefiles for rural roads, interstates, ramps, bridges, trails, and railroads. The database is continually updated and provides the best coverage of transportation structures in Montana.
The state of Montana is comprised mostly of farms and ranches which, at 243,000 km
2, ranks the state second in the nation for most agricultural land [
76,
77]. Maintaining or enhancing existing natural storage structures or converting private agricultural land to wetland requires extensive collaboration with property owners and compliance with state water policy. Likewise, the search for adequate natural storage sites in a predominantly agricultural state requires the ability to identify productive farm land/pasture at a fine scale so as to avoid analyzing the storage capacity of agricultural land. In this case, the presence of active irrigation operations would significantly impact the flow of water through a hydrologic system and compromise the collection of hydrologic data. Additionally, assessing natural storage potential on irrigated land that overlaps the place of use of an active water right is outside of the scope of this model.
In 2005, the Montana Department of Revenue (DOR) began developing a state-specific land cover dataset intended to provide consistent mapping of active agricultural lands in the state. The Final Land Unit (FLU) land cover classification system was used as the primary land cover database in this study, and consists of data that are regularly updated and categorized into seven land uses: fallow, hay, grazing, irrigated (flood, pivot, or sprinkler), continuously cropped, forest (commercial or non-commercial), and commercial (e.g., gravel pits, ski areas, and mines). Ground features in the dataset are primarily delineated using 1 m resolution NAIP aerial photography, with most classifications undergoing reference validation by DOR GIS technicians [
78]. FLU data have been used extensively in complex land use and vegetation mapping of several river basins and corridors in Montana, including the Yellowstone River and the Beaverhead-Deer Lodge National Forest [
79,
80]. FLU data also played a significant role in the development of the Montana Land Cover Framework by improving the pasture, hay, and cultivated cropland classes [
81].
The two most important methodological considerations addressed by incorporating land cover information were the identification of land classified as undeveloped floodplain, and the identification of irrigated land. Study site selection of land classified as “floodplain” was important due to the regularity with which land close to main channels tends to flood. As previously mentioned, recognizing study site proximity to irrigated land is important since sprinkler irrigation methods are known to increase water consumption and decrease recharge of alluvial aquifers, thereby compromising the reliability of groundwater level measurements [
82]. Some western states have invested resources into developing state-specific land cover databases similar to Montana’s FLU dataset, and the USGS’s National Land Cover Database provides national 30-m resolution land cover information [
83].
2.1.4. Long Term Well Data
Riparian wetlands often function as recharging and discharging reservoirs of water in that they can both receive inflow from and provide recharge to groundwater reservoirs [
84]. The storage of water is crucial to wetland ecosystem vitality. In many wetlands, the depth to groundwater largely controls the capacity for water storage [
84,
85]. Groundwater table measurements from observation wells over time are the principal source of information about the hydrologic stresses acting on aquifers and how such stresses affect groundwater recharge, storage, and discharge [
85]. It is long term, systematic measurements of groundwater levels that provide essential data needed to evaluate temporal groundwater changes, develop groundwater models and trend forecasts, and monitor the effectiveness of groundwater management and protection efforts [
85].
The MBMG’s Ground Water Assessment Program (GWAP) manages Montana’s statewide groundwater-level and groundwater-quality which consists of approximately 1000 measurement sites [
86]. More than one-third of GWAP sites are a part of a system of long term ground water assessment and monitoring (GWAAMON) wells that are visited on a quarterly (sometimes monthly) basis for static water levels (SWL) [
87]. Electronic data loggers and paper recorders also record water levels at some wells, and groundwater is sampled on a periodic basis for water quality analysis and review. All data collection methods are reviewed and downloadable by the public at no cost [
87]. Potential drawbacks to periodic monitoring are that hydraulic responses to short term stresses may be missed if they occur between measurements, extreme water level fluctuations cannot be certainly determined, and water level trends may be biased by the choice of measurement frequency [
85]. The USGS National Water Information System also provides nationwide information on groundwater levels collected from over 858,000 field measurements [
88].
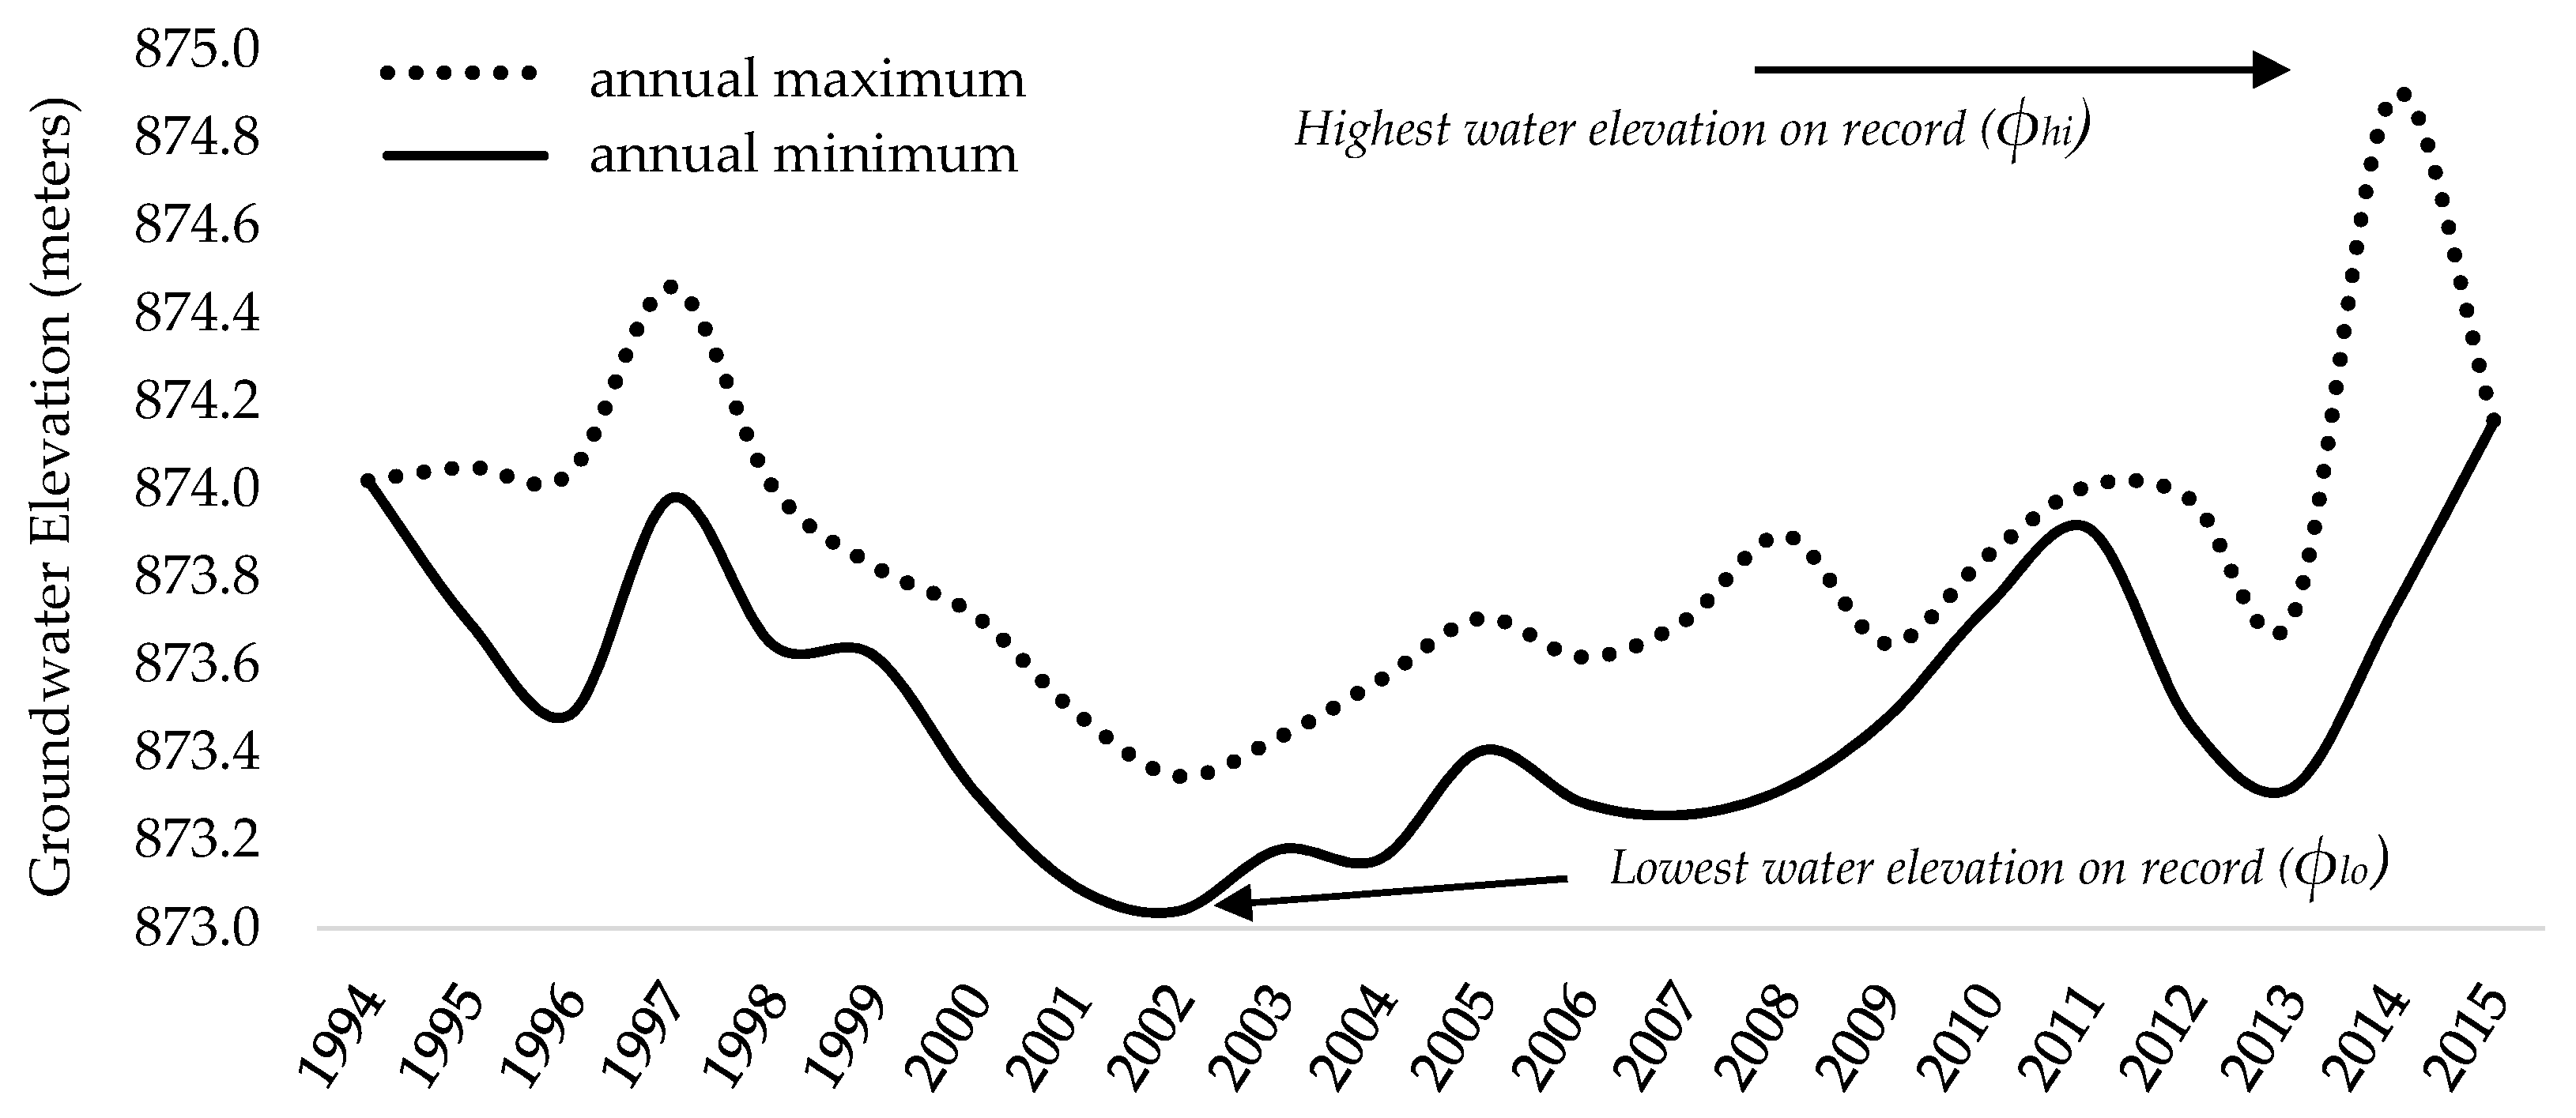
There is one long term MBMG-controlled GWAAMON well (#147334) located near Melstone. While there are multiple GWAP wells directly surrounding the study site, collaboration with MBMG hydrologists confirmed that information from a single GWAAMON well is more reliable and accurate because GWAAMON wells are monitored on a more regular basis. The Melstone GWAAMON well is located near the study area and was drilled on land classified as floodplain. It has been monitored for static water levels (SWL) on a quarterly basis since 5 April 1994. Methods of measurement for each field visit are provided in GWAAMON well logs. Groundwater table elevation (
φ) was approximated by subtracting the depth to water measurements recorded in the GWAAMON well log from the elevation of the reported well location as shown in the LiDAR imagery.
Figure 4 shows the highest and lowest groundwater elevations measured for each year between 1994 and 2015 which were used in this investigation.
The total difference between the highest and lowest measured groundwater table elevation (φhi = 874.8 m; φlo = 873 m) recorded during that 21-year time frame was 1.8 m. In this study, a middle groundwater table elevation (or φm) is considered at the mid-value between φlo and φhi. Absent more long-term well data, this model does not consider the interflow of groundwater and assumes a planar SWL (i.e., groundwater NRCS) elevation gradient.
2.2. Quantifying Storage
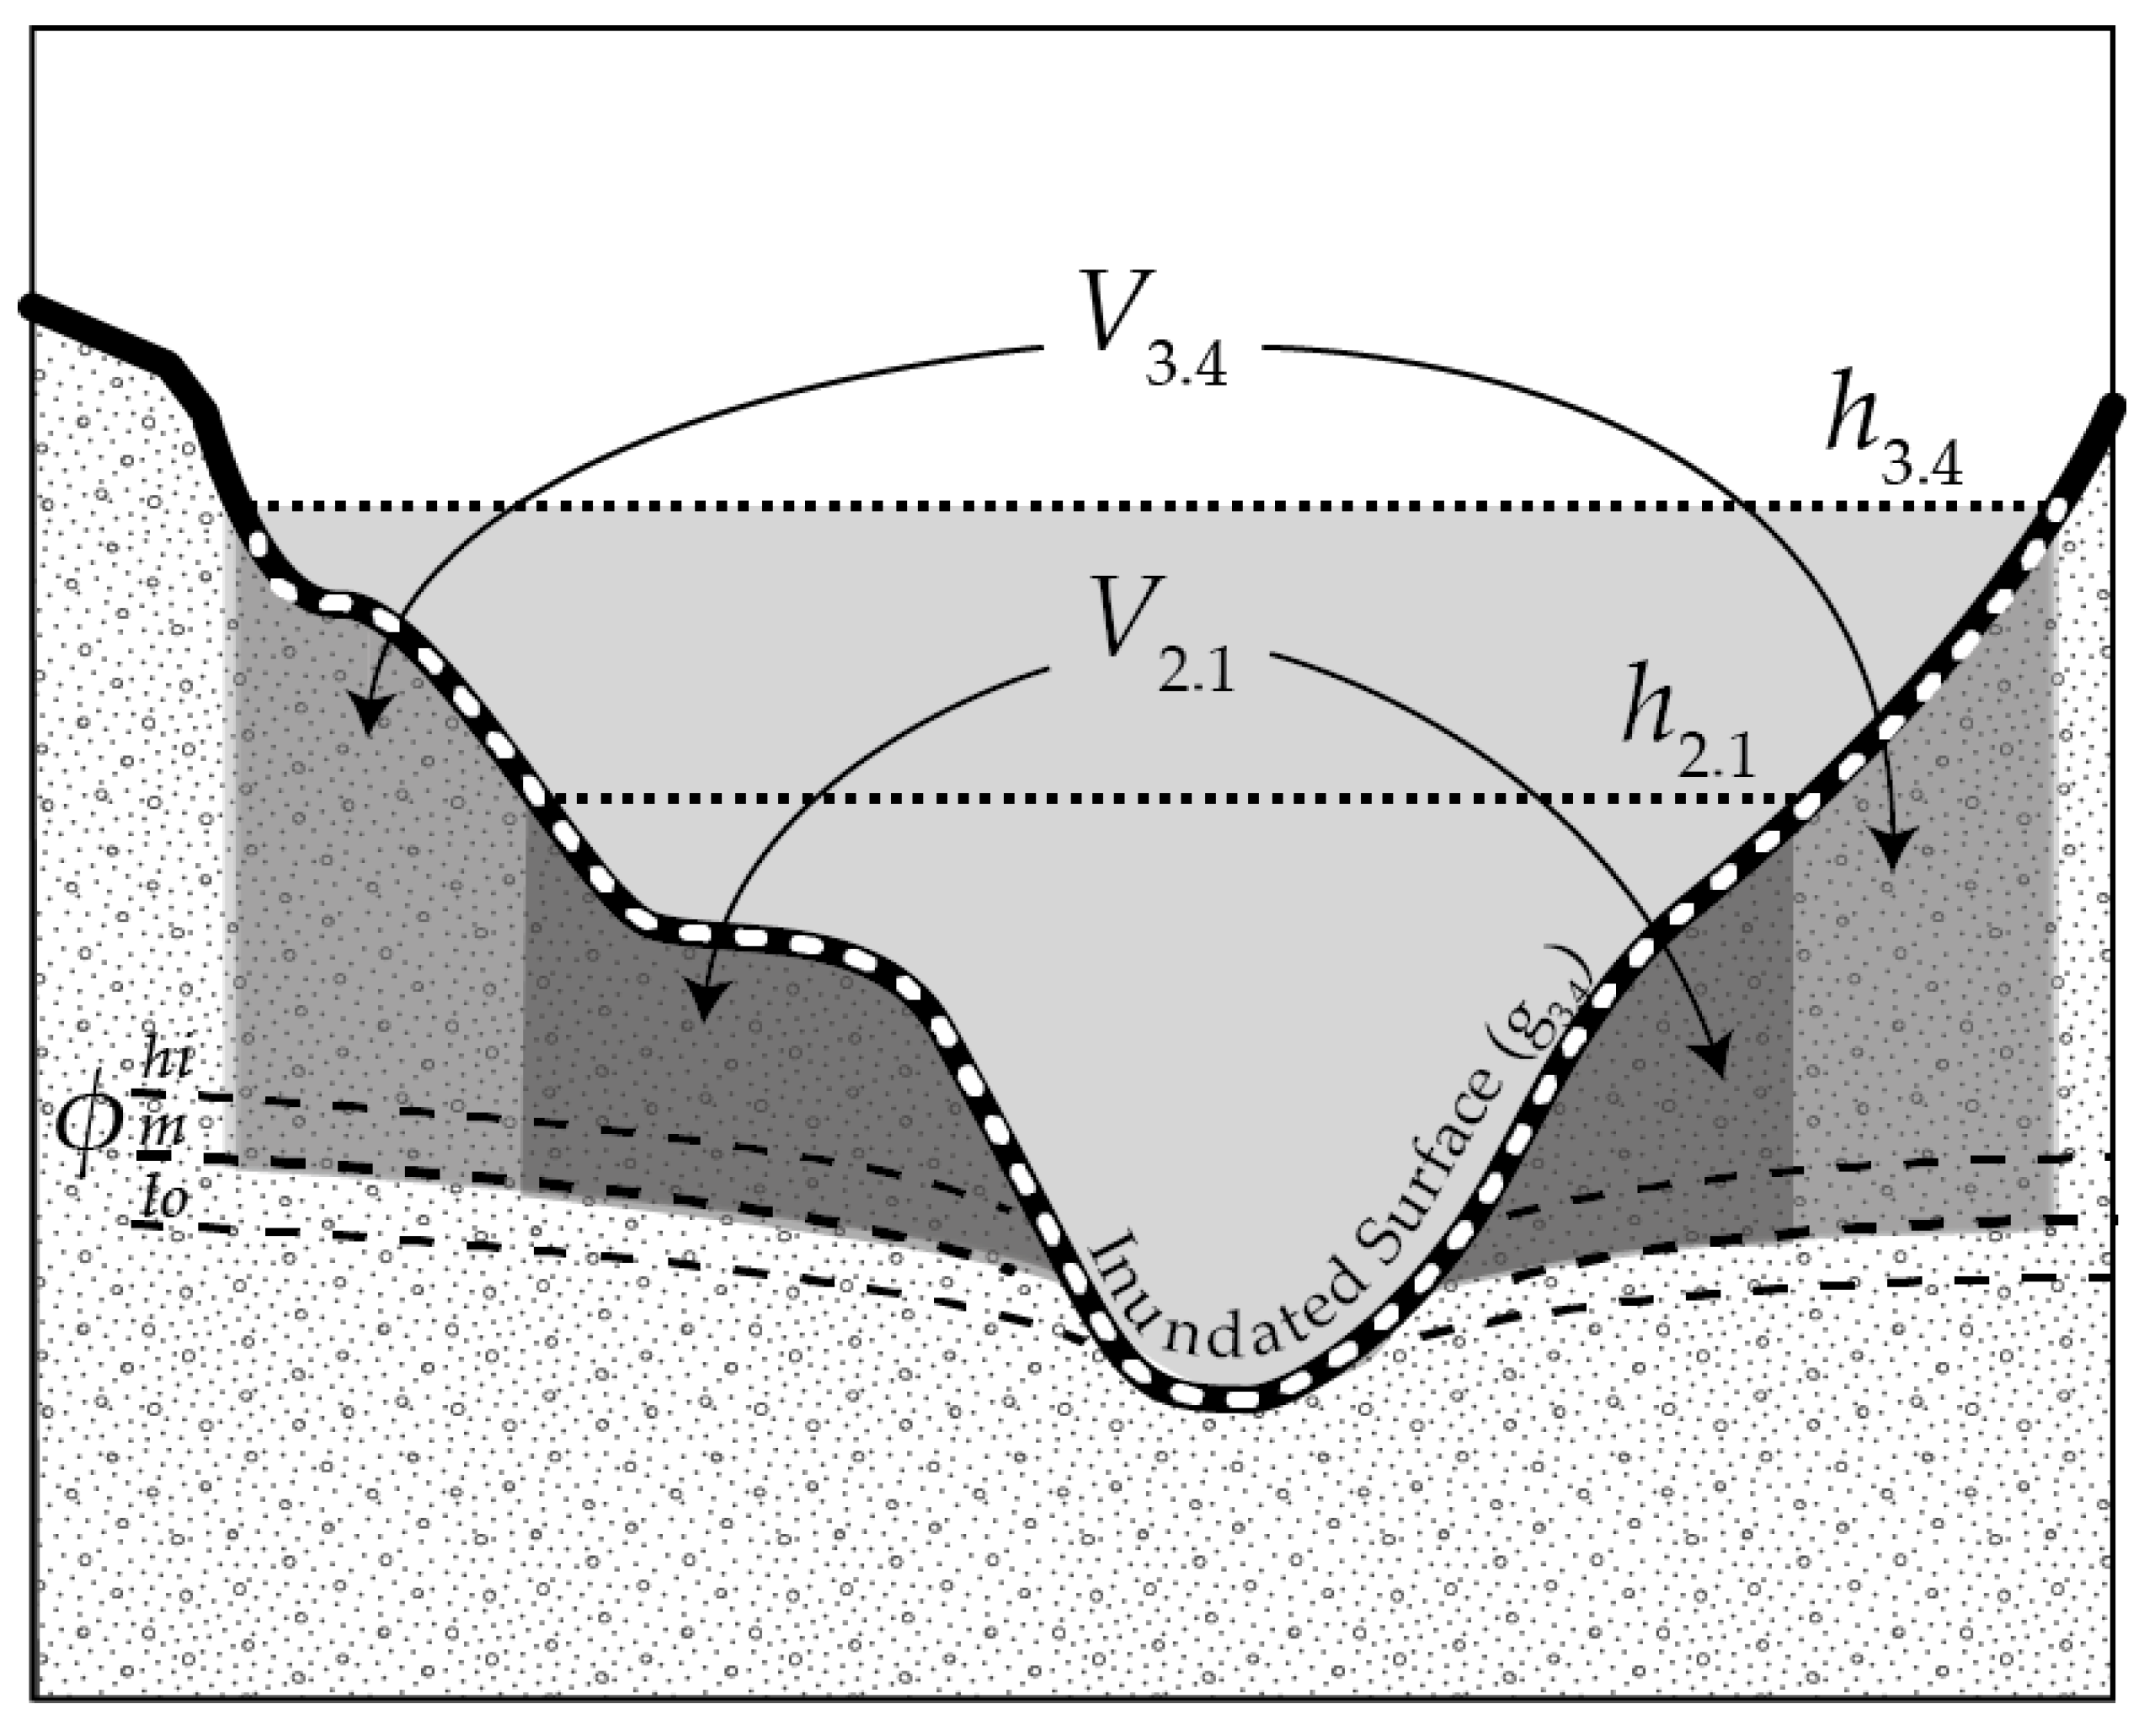
The natural storage potential of the selected site was calculated as:
where
α is the percent volume of the subsurface available to store water, and
Vh is the volume of ground at a selected flood stage (
h) between the inundated surface (
gh) and the groundwater table (
φ) (
Figure 5). As this process is carried out on a GIS platform, the input elevations for
g and
φ are in raster format, with unique values for each cell (
i = individual pixel or cell). The site’s volume represents the sum product of the raster cell resolution (
R) (in this study’s case,
R is equal to 1 m
2) and the potential storage thickness (
gh −
φ), such that:
A range of storage potentials was quantified under different parameter conditions (e.g., high (
φhi) to low (
φlo) groundwater table elevations, and multiple estimates for
α). It was assumed
φ values were spatially uniform in the absence of additional long-term data informing hydraulic gradient. The sensitivity of this storage quantification method to changes in the percent volume space (
α) was assessed by adjusting the SSURGO-derived porosity parameter (which at field capacity = 16%) by values of 1% and 5% (i.e., from 0.16 at field capacity to 0.15 and 0.17, or from 0.16 to 0.11 and 0.21, respectively).
Table 1 describes equation variables, their units, and data sources and
Figure 5 provides a graphical description of the model.
Figure 5 provides a cross sectional diagram which illustrates the relational function of these variables.
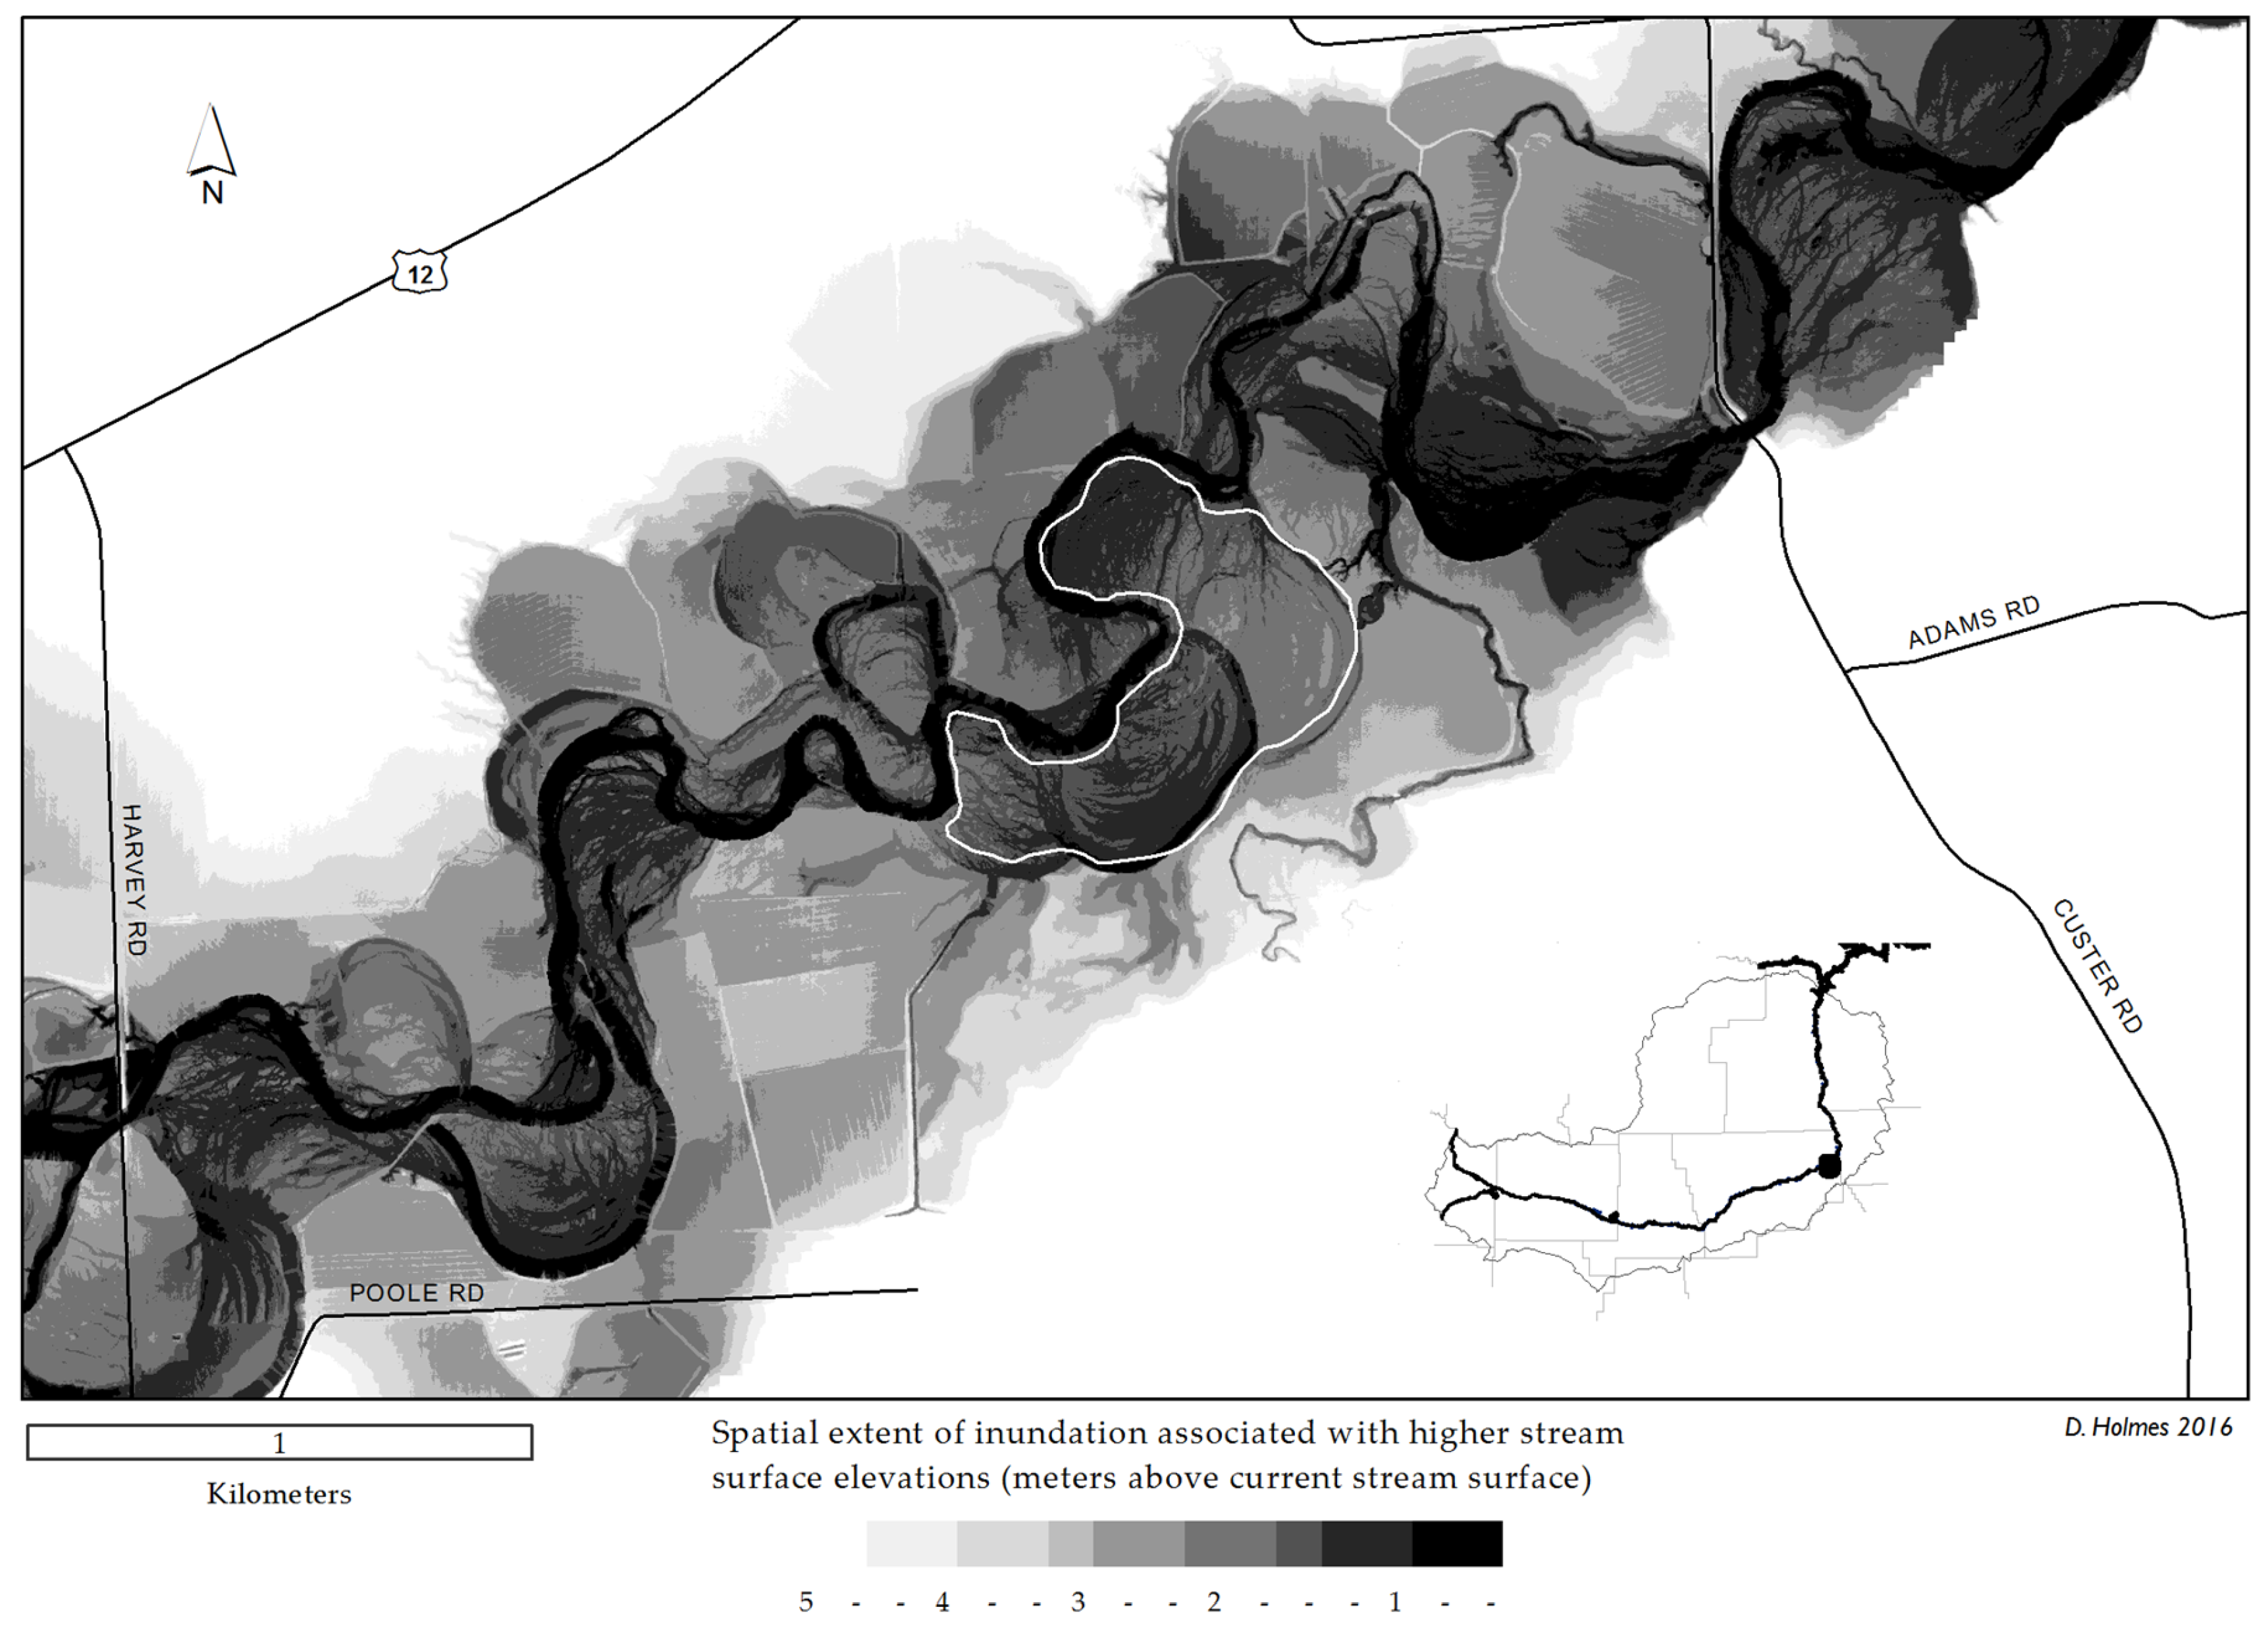
Physical storage capacities were analyzed for the study site during different flood extents. A geospatial inundation model was developed to identify different study site extents that are flooded by water when the stream surface increases in elevation by a specified amount. In this case, the inundation model simulated spatial flood extents on the Melstone study site that correlate with ten higher-than-normal MSR surface elevations (
Figure 6). In this definition, “normal” stream surface elevations are spatially but not temporally variable since they correspond with different stream elevations recorded by the (non-water penetrating) LiDAR sensors during the respective dates of imagery collection.
The inundation model (expanded in
Appendix A) produced an inundation map of the study site using LiDAR elevation data and custom LiDAR cross sections of the floodplain surrounding the study site. This model first calculates the difference in vertical distance (
z) between individual cells in the LiDAR imagery and the lowest
z point of a cross section (i.e., the portion of stream surface intersected by a cross section) nearest to the cell. A given cell is considered to be inundated when the difference in
z distance between the cell and the closest cross section’s lowest
z is surpassed by the modeled stream surface elevation increase. Ninety-eight percent of the study site surface was modeled to be inundated when the stream surface elevation increased by 2.1 m; every cell in the study site was simulated to be inundated when the elevation of the stream surface increased 3 m above normal.
3. Results
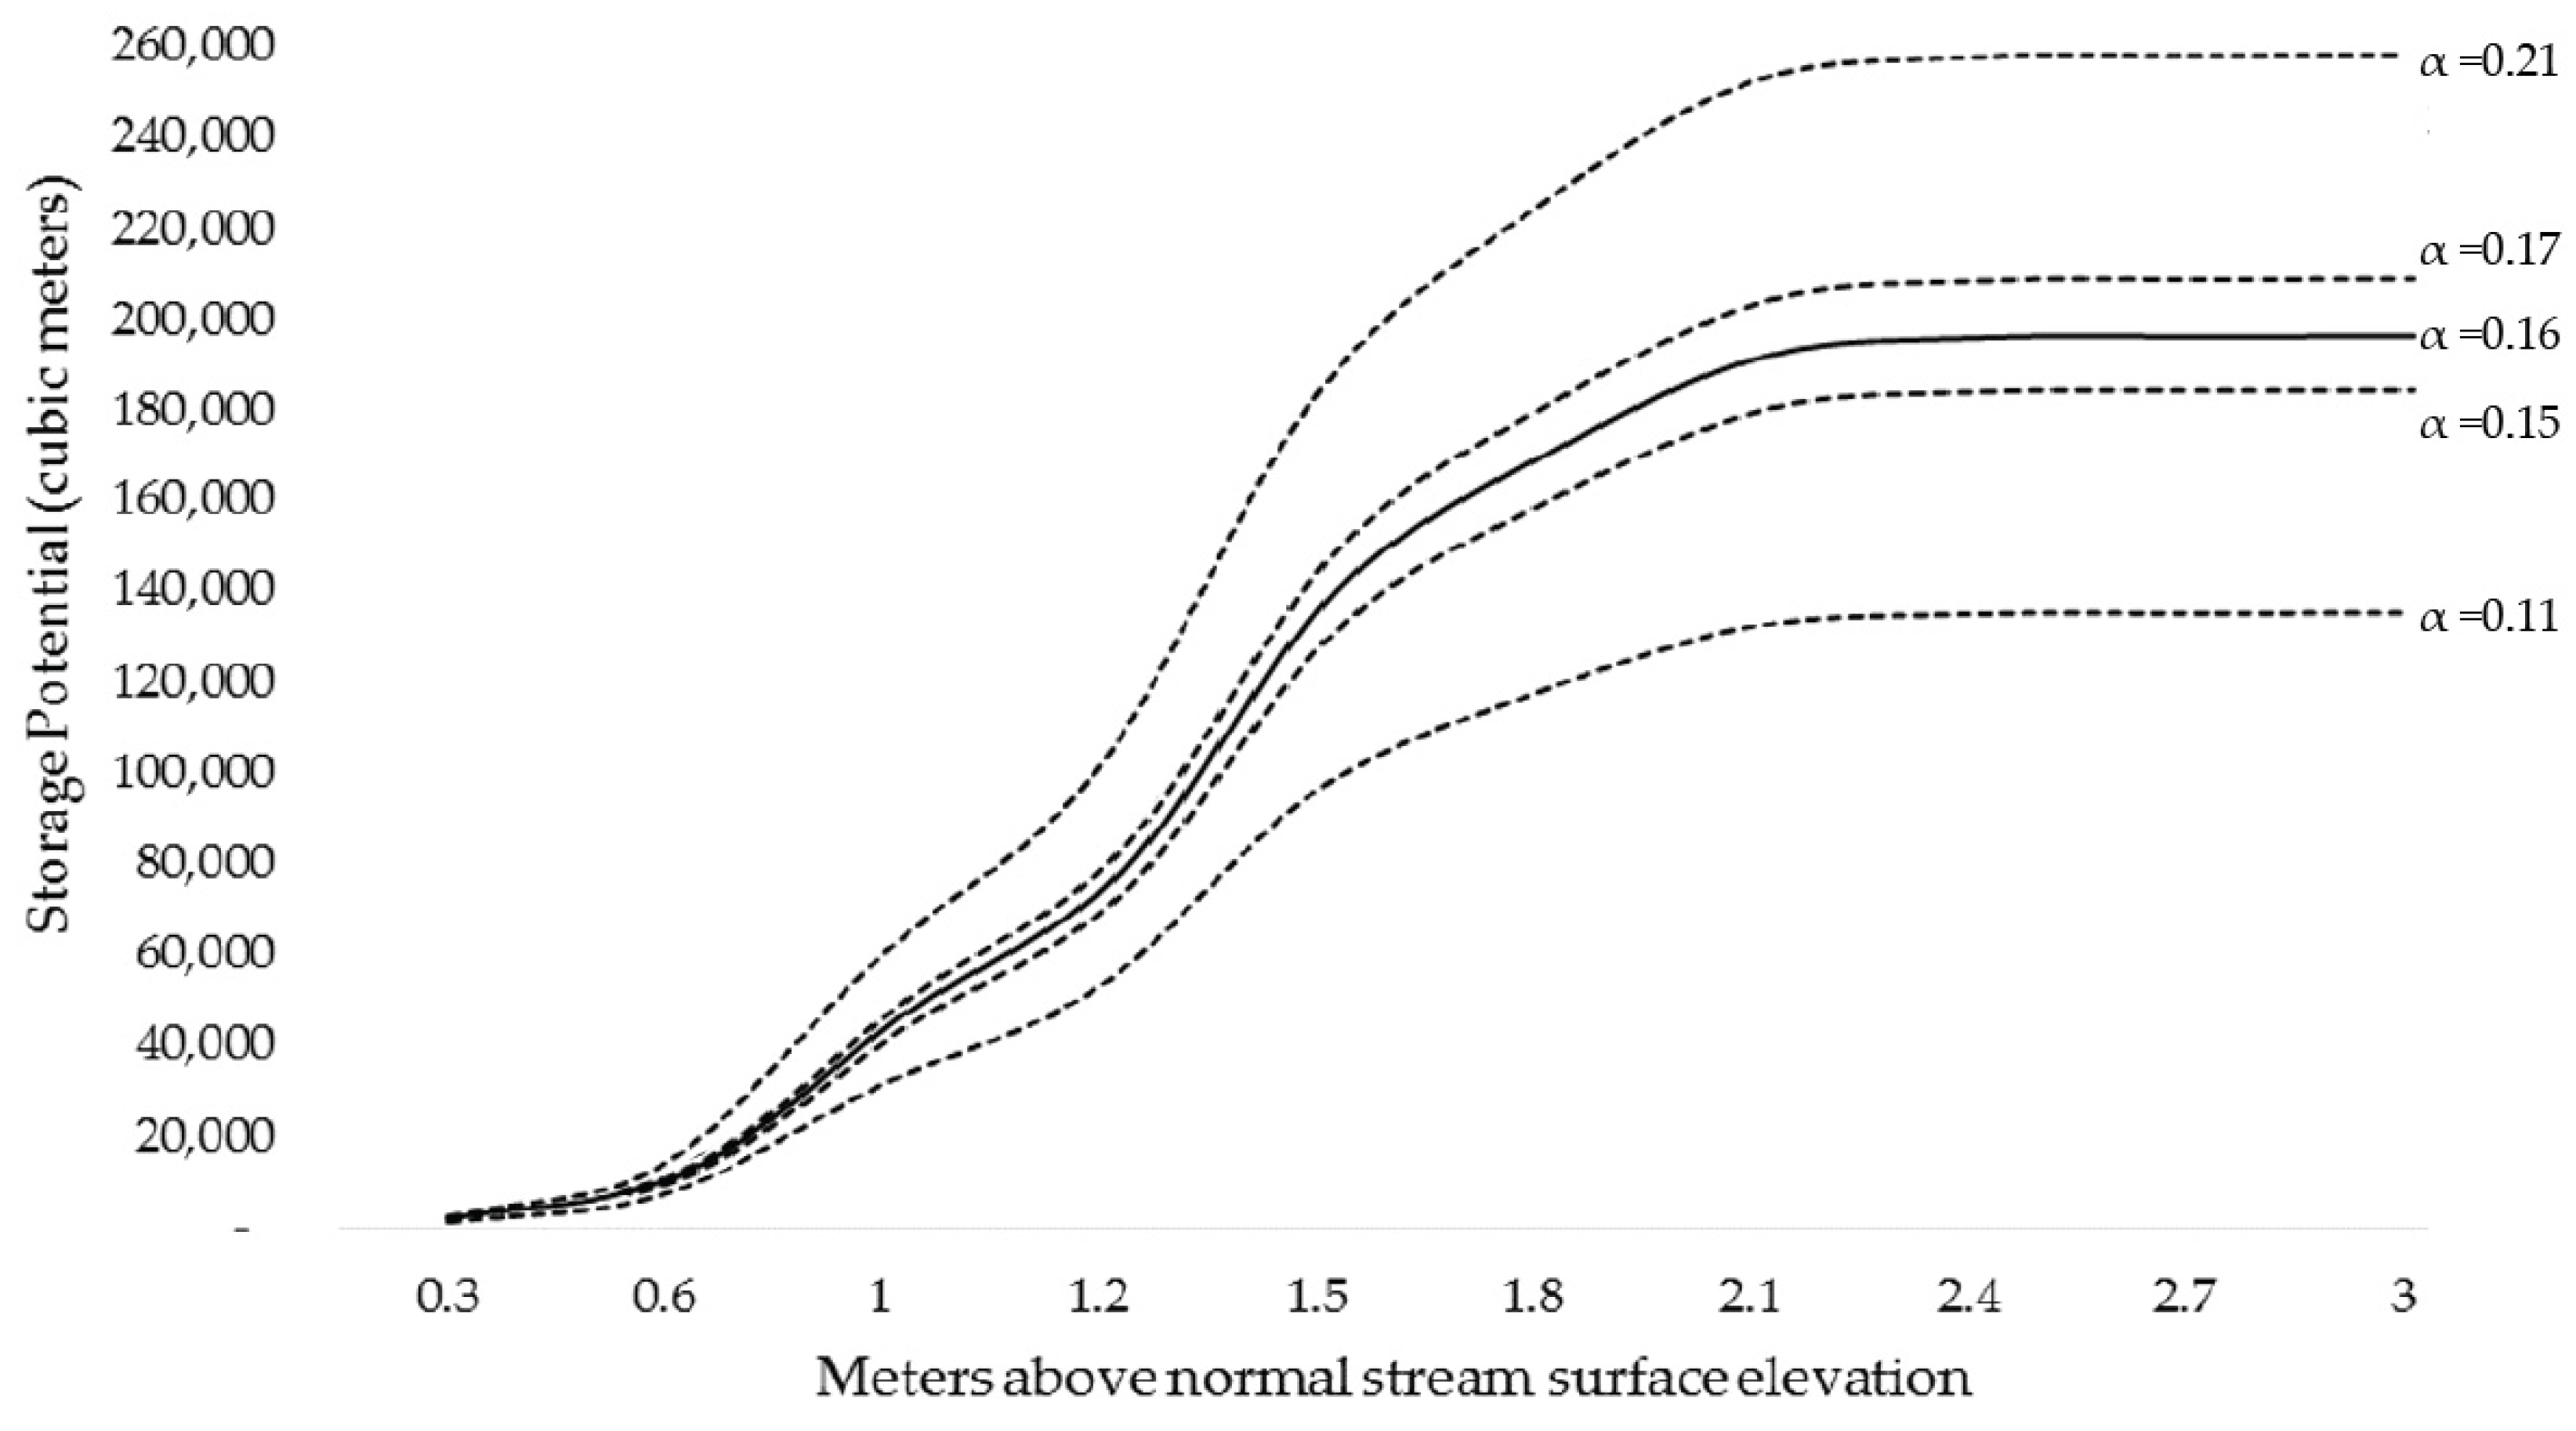
The storage quantification method introduced in this paper produced a wide range of storage potentials that were most sensitive to changing
α values. When simulating storage potential for increases in stream surface elevation up to 3 m (i.e., the stream surface height at which the study site is modeled to be entirely inundated), a 1% change in the value of porosity
α, e.g., from 0.16 to 0.15 or 0.17 adds approximately 6% of uncertainty to the output of the model (196,740 m
3 ± 12,300 m
3) (
Figure 7). A 5% change in the value of
α from 0.16 to 0.11 or 0.21 adds approximately 30% uncertainty to model outputs (196,740 m
3 ± 61,500 m
3) (
Figure 7).
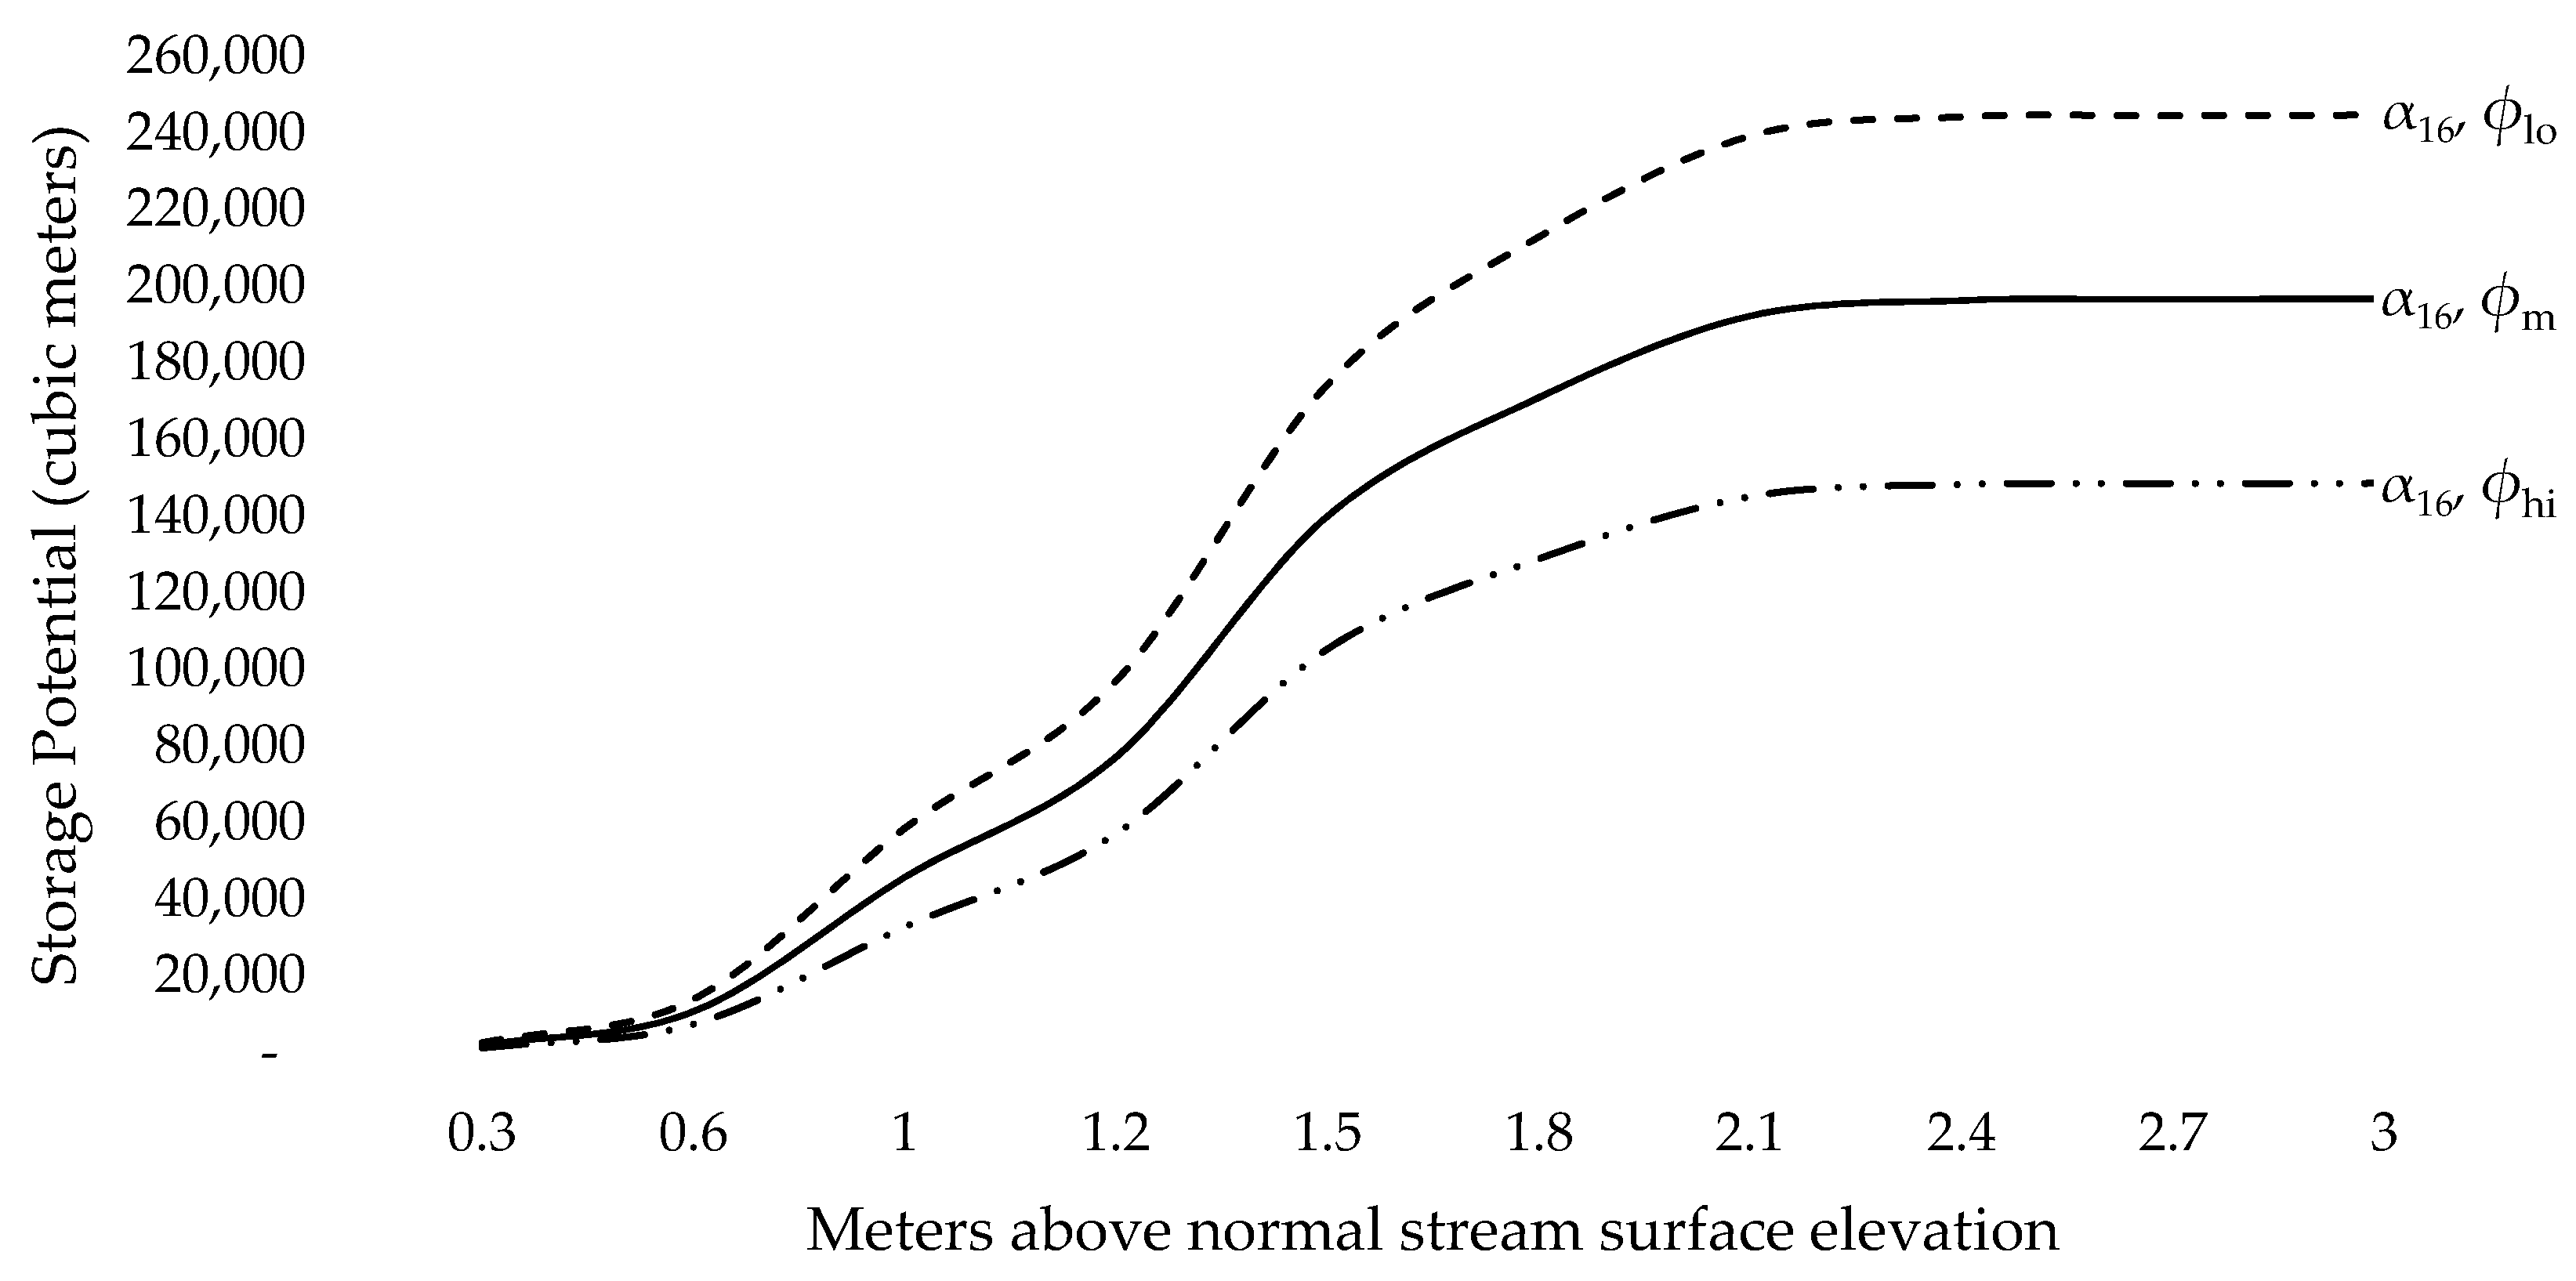
Figure 8 displays the range of site storage potentials when high (874.8 m), middle (873.9 m), and low (873 m) groundwater table elevations are modeled for a variety of flood conditions. The lowest and highest storage potentials simulated for all conditions were 900 m
3 (1 AF) and 321,300 m
3 (260 AF), respectively. All simulated storage potentials are listed in
Table 2.
While the entire study site is inundated by a stream surface elevation increases of 3 m, it was found that less than 2% of the study site would remain above water when stream surface elevations increase by 2.1 m. In general, higher porosity, lower groundwater table elevations, and large increases in stream surface elevations were associated with the simulated storability of more water.
4. Discussion
The results of this natural infrastructure site identification framework and storage quantification method highlight the degree of uncertainty in attempting to estimate natural water storage potential using a single number or condition, and show that reasonable adjustments in one model parameter can substantially influence storage potential. The resulting wide ranging estimates (
Table 2,
Figure 7 and
Figure 8) illuminate the diversity of storage potentials that exist for inherently dynamic floodplains that regularly experience a range of hydrologic conditions, such as fluctuating water tables and stream surface elevations. Similarly, illuminating the range of uncertainty in storage potentials for multiple sites of interest can help natural infrastructure project organizers determine the feasibility of moving forward with project implementation. The availability and need for water in the West are as mutable as the resource itself, and contemporary water resource planning and policy in this region are starting to reflect that reality. Planning at the local level is key, but cultivating strategies to incorporate alternative methods of water storage at larger scales depends on the development of agile tools that can be refined for application in a variety of ecosystems, communities, and political climates.
While the methods outlined in this paper were created using Montana-specific data sources, water concerns and water policy structures in the state embody those unique to the region as a whole. The use of a geographic approach and open-source data allowed for the development of a natural storage estimation and site identification approach that, while coarse, can be used by a variety of stakeholders and institutions who have access to GIS platforms and interest in exploring the feasibility of natural infrastructure before using more complex or expensive hydrologic modeling options. All of the data types described in this paper are publicly available in similar forms for nearly every western state, where communities eager to contribute to drought and flood mitigation strategies are abundant. This natural storage framework is accessible to an assortment of organizations and individuals with different concerns and in diverse geographies. This framework leaves room for the consideration of more traditional yet complicated hydrologic parameters, social science, and political contexts. Future research should explore and encourage this process. The open-source nature of the data inputs in this study facilitate the potential creation of more automated, publicly-accessible programs written in open-source code that carry out the processes in this paper.
The MSR natural storage model provides a method for quickly identifying sites that are assumed to be more likely to function as effective natural storage structures, as well as a method for estimating floodplain water storage potential. However, there are several model limitations that must be addressed in order to realize the hydrologic, agricultural, and economic value of potential natural storage sites. No model can perfectly simulate real-world conditions, but models using a great deal of data that are collected regularly (and in the same time frame) using updated measurement techniques, and that are properly validated and calibrated tend to produce more accurate results. Like most models, the success of a GIS-based natural storage model depends on an abundance of reliable spatiotemporal data. For instance, the model input with the greatest influence on study results was soil porosity (α), but the resolution of the SSURGO soil data used in this research should only be acceptable in natural storage modeling estimations for which coarse results are acceptable. For more refined studies, α should be determined using data collected in situ, and further research should emphasize model input validation and calibration.
The inclusion of observed groundwater elevations, physical soil characteristics, and high resolution elevation data are integral during storage quantification. Groundwater flux, soil porosity, and surface topography are all fundamental components in hydrologic research. There is evidence that natural water storage sites contribute to late-season return flows and floodwater attenuation, and identifying locations adequately suited for natural infrastructure as well as their natural storage capacity is important. As mentioned above, more well data and in situ soil surveys could be used to improve the model accuracy. Nevertheless, research investigating (for instance) the contribution of return flows from natural storage to late-season flows, or the rate of flood attenuation by natural storage sites relies on hydrologic data that vary both spatially and temporally. Assuming that groundwater elevations and soil porosities are uniform for a 0.33 km2 (33 ha) study site may only be acceptable for the most preliminary of natural infrastructure feasibility studies. Making similar assumptions would be inappropriate for later phase analyses, but developing a more reliable and advanced quantification model can be accomplished with a single site visit. More engagement with property owners and water users downstream of potential sites is also critical in evaluating how effectively natural infrastructures can address various water volume needs and water supply concerns. Finally, the assessment of natural storage potential throughout a basin is dependent on the development of hydrologic monitoring projects along tributaries, for which data can be lacking.
Three broad research efforts should be explored to expand upon and refine this work, including (1) improving the accuracy of natural storage potential quantification by incorporating more hydraulic data, local discharge estimates, and analysis of inundation for flood events at the storage areas of interest; (2) identifying the water right implications related to the implementation of natural infrastructure as an alternative method of water storage; and (3) interviewing stakeholders to determine their specific water needs and concerns, as well as their perceptions of natural infrastructure as a water management tool.
4.1. Improving Accuracy in Natural Storage Modeling
Water storage capacity (S) as estimated by the modeling process outlined in this research sufficiently delivers a coarse floodplain water storage quantification method that can be employed inexpensively and relatively quickly in natural infrastructure feasibility assessments. At this stage, this research outlines a method that can estimate a range of water storage potentials, but model calibration targeting input variables is needed to gauge model accuracy and error. Additionally, answering important questions regarding storage potential over time can be accomplished by incorporating temporally abundant data into this framework. Finally, it is essential for researchers making use of this model to comprehend that the various Melstone-specific model input values are least likely to reflect the physical characteristics of other sites. The inputs used in this research are likeliest to generally reflect downstream MSR floodplain conditions, but the MSR is a large and diverse fluvial system with local geomorphologies that are as variable as the system is vast. Because of this, special care should be taken to obtain model inputs specific to research regions and localities of interest to the study at hand.
In general, improving the accuracy of this natural storage model to better understand the contribution of natural storage sites to late-season return flows, for example, requires the consideration of several other hydrologic variables, including (but not limited to):
Projecting inundation of floodwater (or diverted water) to the floodplain based on specific flood event discharge and return periods;
Rates of groundwater discharge based on synoptic flow measurements;
Anthropogenic water diversion and consumption trends;
Streambed cross sections;
Channel migration patterns;
Local hydraulic conductivity, hydraulic gradient, and hydraulic transmissivity;
Precipitation (rain and snow);
Surface roughness;
Local geology and lithology;
Stream discharge and stage data directly upstream and downstream of the study site;
A vegetation profile of the area, as well as local evapotranspiration rates; and
An updated, high-resolution soil survey for more precise physical soil characterization.
Analysis of and data on each of the variables listed above should be scaled and calibrated according to the specific applications at hand, with an eye for model sensitivity. This is critical since a project exploring seasonal fluctuations in the water storage potential for a distributed network of natural infrastructure sites throughout a watershed calls for different data resolutions than a project probing the weekly contribution of outflow from a natural storage site to a receiving stream reach. In the instance that data for some might not be available online, some of these variables (e.g., surface roughness, stream discharge and stage, stream cross sections) can be collected in a single site visit. Perhaps most importantly, measurements for each new variable in a more advanced natural storage model should be collected with minimal spatial and temporal variability between data sampling conditions in order to maintain the greatest degree of accuracy. In Montana, this can be accomplished, in part, through additional investments in more expansive and automated networks of hydrologic monitoring equipment, including stream gauges (already underway), monitoring wells, or climatology stations in Montana’s least-monitored river basins and tributaries. In terms of estimating inundation, exiting hydraulic models developed for other purposes may be available for watersheds to predict flood discharge and in turn model inundation using LiDAR data and models such as HEC-RAS. Moreover, the development of robust natural storage models that meld hydraulic data analyses with geospatial techniques can be expedited through investment in and collaboration with graduate and faculty researchers at higher education institutions. Through investment in and collaboration with natural resource research in higher education, Montana’s state resource management agencies can help generate academic innovation capable of analyzing the services provided by the state’s natural resources in a way that coheres with state water policy and case law.
4.2. Water Right Implications of Natural Infrastructure
States in the western U.S. rely on the Prior Appropriation Doctrine to govern how water for different purposes is allocated to a variety of water users [
5]. Water in the West is owned by the states, while people in those states have the right to use it. Because of this, each new appropriation or diversion of water (including for natural storage) requires a water right—a document that details the specific configuration of how, why, when, for how long, at what rate, and from which source surface or groundwater may be diverted and where it may be put to beneficial use. Prior appropriation dictates that water users who began using their water first are senior to water users who began using water after them, and that those junior water right holders must stop diverting water if a “call” on junior rights is initiated by downstream seniors who find there is not enough water in their source for them to fulfill their use of water. Conversely, though junior water right holders in Montana cannot call on senior water rights, they do have the right to the continuance of the conditions that existed when their water right was first put to beneficial use.
Historically, water use was considered most efficient when every last drop was diverted from a river and used before it could reach the sea, but a shift toward valuing “water for the environment” has complicated a doctrine whose history is rooted in valuing industrial and agricultural innovation over conservation [
4,
5,
12]. Water for the environment is legally a relatively new concept in western water law. Instream flow water rights are common throughout the West, and in many states a seamless process for reserving water specifically for natural infrastructure could prevent future conflict, but such a process has yet to be tested. In particular, Montana’s regulatory process outlining how water can be legally protected instream is extensive and widely utilized [
92]. With regard to natural infrastructure, the Montana Department of Natural Resources and Conservation (DNRC) has determined as a matter of policy that wetland habitat is inextricably linked to beneficial uses such as aquifer recharge and fish and wildlife; however, because wetland restoration, enhancement, and protection methods are so diverse, these activities are neither entirely exempt from water right requirements nor collectively mandated to acquire water rights [
93]. Generally, natural infrastructure projects that require water rights in Montana are those which:
- (a)
construct an artificial wetland on a site that was historically not a wetland;
- (b)
result in deeper than natural wetland pools, higher in elevation water profiles, longer than typical periods of impoundment, curtailment of normative streamflow outputs, or diminished connection to the floodplain;
- (c)
use impoundments, diversions, and headgates to impound water for longer periods, or artificially encourage the generation of a larger area of wetland vegetation in a manner that increases the amount of consumed or diverted water use beyond natural levels;
- (d)
enlarge or enhance a wetland or deepen pools beyond natural dimensions;
- (e)
use water sourced from a dike, dam, ditch, headgate, infiltration gallery, pipeline, pump, pit, or well; and
- (f)
use human-created berms, dams, and dikes that result in wetlands that are perched above the elevation of natural wetlands in the local area (note: only those portions of the wetland that are in excess of a natural wetland formation require a water right).
Examples of natural infrastructure projects that generally do not require water rights in Montana are those which:
- (a)
reestablish or rehabilitate a degraded wetland so that soils, hydrology, vegetative communities, and habitats are restored to a close approximation of the original natural condition that existed prior to modification;
- (b)
augment existing wetlands without artificially controlling water and increase water consumption above and beyond natural levels;
- (c)
have a final design that approximates the natural characteristics of adjacent natural wetlands or approximate something smaller in magnitude;
- (d)
eliminate wetland drains and promote hydric soil development;
- (e)
establish what will become naturally occurring wetland vegetation without increasing the consumption of water above the naturally occurring evapotranspiration of that vegetation once it becomes established; and
- (f)
include the installation of deformable grade (e.g., beaver mimicry) structures that are not entirely water tight and allow upstream and downstream fish passage, as well as the conveyance of base streamflows.
A keystone feature of the water right permitting and change process in western states involves analyzing whether or not a proposed beneficial use of water will cause injury, or adverse effect, to other water users. Water users in the MSRB have expressed concern about the potential adverse effects natural infrastructure may have on water users downstream of natural storage sites. Still, the regulatory toolbox whose purpose is to prevent injury to water users as a result of new appropriations of water remains a central component in the way western water is managed.
Another option which can contribute to greater late season return flows and a decrease in water consumption may involve incentivizing irrigators to partially convert their operation from center pivot or sprinkler irrigation back to flood irrigation which is known to be an important source of late-season return flows [
94]. In Montana, an individual’s decision to retire center pivots and sprinklers in order to switch to flood irrigation does not require a water user to undergo the water right change process so long as the switch to flood irrigation occurs within the water user’s place of use. The water right change process is often criticized for being unpredictable and prone to frequent rule and policy changes, so efforts to incentivize sprinkler-to-flood method switches may be appealing due to the notable lack of regulatory hurdles. However, because such a conversion would normally pose an economic disadvantage to irrigators due to lower annual yields and higher labor costs, the potential financial loss may necessitate offsetting through financial compensation. This issue is important to consider as the state of Montana continues to identify the adverse impacts on water rights that may arise from various types of natural infrastructures and explore strategies that might best curtail those negative consequences in legally water deficient basins. Investigations regarding the potential impact that natural infrastructure may have on legal water agreements should encourage the input of a diverse range of stakeholders including tribal members, irrigators, non-profit conservation organizations and coalitions, other state agencies, academics, and industry leaders.
4.3. Interviewing Stakeholders
Further research should determine more explicitly how natural infrastructures could provide meaningful storage services to different water users, and should cultivate an understanding of the unique water needs of potentially affected stakeholders before the value of a natural storage service can be assessed. For instance, a senior water right holder whose property was destroyed following a 100-year flood event likely has different concerns than a junior water right holder in the same basin whose property does not experience substantial flood damage, but whose water right is regularly called on and relinquished to senior water uses. Even if both water users in this example divert water from the same source, there is significant contrast in the types of natural water storage services needed to address their concerns. The senior water right holder is less likely to have their water called on, but because of their risk to flood damage, they would likely benefit more from the implementation of natural infrastructures that promote the attenuation of large volumes of floodwater from events that may only occur once every 50 years. Alternatively, the junior water right holder in this scenario may prefer the implementation of natural infrastructures that promote the more regular seasonal absorption of comparatively smaller early spring runoff volumes that are slowly re-released in the form of late summer return flows that are legally available during the period of diversion claimed on the junior water right.
Moving forward with natural infrastructure projects after considering the unique and varying needs of the affected stakeholders can maximize the probability that the project likely to offer the most meaningful service is developed. Watershed coalitions and advocacy groups are expediting this process for government agencies in the West by collectively identifying prospective project locations that have the greatest social value. In the MSRB, the MWC contributed to the development of the Musselshell Watershed Plan, a report which summarizes a number of high priority water planning projects intended to assist the MWC in its continued development and implementation of stakeholder-driven water management efforts in the basin. This plan was also designed to continue the MWC’s work to encourage collaboration among landowners, water user associations, conservation districts, counties, municipalities, and state and federal agencies, all of whom assisted in identifying potential management strategies and projects. Beyond mitigating flood risk and water shortage, projects of interest include salinity, total maximum daily load, and cottonwood monitoring, fisheries enhancement, canal and bridge repair, and weed management. This plan facilitates the identification of the most pressing basin-wide water planning projects (including natural storage modeling) for MSRB water users as a collective whole. Similar public and private natural infrastructure feasibility assessments can also benefit from collaboration with individual landowners to better understand how their specific needs can best be addressed.
The implementation of natural infrastructure in a place such as the MSRB would likely begin with a limited number of carefully selected sites and consultation with water users along the most degraded sources. Failure to consult with relevant stakeholders before the enhancement of natural storage sites could result in the development of projects that do not address their concerns. For example, investment in natural infrastructure sites better suited to provide services related to the attenuation of floodwater may be of greater interest and met with more support by water users in the Lower MSRB where the impacts of large flood events have tended to be more severe than in the Upper MSRB. Similarly, dismissing landowner involvement in the planning process could result in the implementation of natural infrastructures in areas where concerns for water shortage are less severe, for example places that are removed from the main stem of the MSR and where dominant farming or ranching practices do not rely on irrigation, or where agricultural development is effectively non-existent. Finally, it is improbable that the existence of a few wetlands or floodplains enhanced by natural infrastructures would be capable of helping meet all of the varying basin-wide water demands. For this reason, a distributed, watershed-scale network of enhanced natural storage sites tailored to the needs of local water users may be necessary for a significant storage service to be realized by the greatest number of people.
The application of natural storage projects hinges on the support of the communities where they will be implemented. Research on the social dimensions of natural infrastructure is required to assess community perceptions of water use, water availability, and management practices. Although this paper is concerned primarily with the physical aspects of natural water storage, future research on the successful implementation of natural infrastructures as alternatives or additions to traditional water capture and retention systems should consider the broader legal, social, political, and economic contexts that shape water scarcity and uneven availability of water among different social groups and ecosystems.
5. Conclusions
Mounting concerns over the impacts of climate change on water resources in the western U.S. are incentivizing state agencies to explore alternative water shortage and flood mitigation strategies. Montana state agencies responsible for monitoring and ensuring adequate water supplies and quality for the benefit of people and the environment are exploring methods of increasing water availability through the protection and enhancement of natural processes and landscapes.
Natural storage processes, such as the services provided by wetlands and floodplains, act to not only slow down water and raise the streambeds in incised and entrenched streams, but have also been shown to effectively attenuate and reduce high peak runoff during large flood events. In the MSRB, the capacity of natural infrastructures to address both water shortage and the unprecedented size of recent flood events has caught the attention of a variety of water users. The MSRB was selected as a broader study region due to the degree of collective participation and expressed interest from MSRB residents to reduce their vulnerability to water shortages and extreme flood events by collaborating with state agencies and academic institutions, and by exploring more environmentally integrated methods of natural water storage.
This research produced a cost- and time-effective GIS-based method of estimating the water storage potential of a portion of MSRB floodplain, and for identifying potentially viable natural storage sites using open source data. This model is intended to be customized and refined by organizations and institutions interested in exploring the feasibility of natural water storage in the West. Still, further research and the addition of other hydrologic variables in this model, as well as model calibration should be considered if a robust framework for assessing the temporal influence of natural storage sites on water supply is to be developed. In addition to the inclusion of hydrologic data within the natural storage model, identifying the implications of natural infrastructure on water rights, and understanding stakeholder water needs, concerns, and landowner perceptions of natural storage would be useful in expanding the applicability of this site identification and storage quantification model to natural infrastructure planning and water management efforts throughout the western U.S., and beyond.


