Article

Chlorophyll-A Prediction of Lakes with Different Water Quality Patterns in China Based on Hybrid Neural Networks

Tianjin Key Laboratory of Water Resources and Environment, Tianjin Normal University, Tianjin 300387, China
*
Author to whom correspondence should be addressed.
Water 2017, 9(7), 524; https://doi.org/10.3390/w9070524
Submission received: 25 May 2017 / Revised: 12 July 2017 / Accepted: 13 July 2017 / Published: 14 July 2017
(This article belongs to the Special Issue Water Quality Monitoring and Modeling in Lakes)

Abstract

:
One of the most important water quality problems affecting lakes and reservoirs is eutrophication, which is caused by multiple physical and chemical factors. As a representative index of eutrophication, the concentration of chlorophyll-a has always been a key indicator monitored by environmental managers. The most influential factors on chlorophyll-a may be dependent on the different water quality patterns in lakes. In this study, data collected from 27 lakes in different provinces of China during 2009–2011 were analyzed. The self-organizing map (SOM) was first applied on the datasets and the lakes were classified into four clusters according to 24 water quality parameters. Comparison amongst the clusters revealed that Cluster I was the least polluted and at the lowest trophic level, while Cluster IV was the most polluted and at the highest trophic level. The genetic algorithm optimized back-propagation neural network (GA-BPNN) was applied to each lake cluster to select the most influential input variables for chlorophyll-a. The results of the four clusters showed that the performance of GA-BPNN was satisfied with nearly half of the input variables selected from the predictor pool. The selected factors varied for the lakes in different clusters, which indicates that the control for eutrophication should be separate for lakes in different provinces of one country.

1. Introduction

The deleterious proliferation of planktonic algae is a main cause of death of aquatic life and damage to aquatic ecosystems and water functions in lakes [1]. Algal blooms have occurred in many lakes around the world in recent years [2,3]. Many factors have influenced the growth of phytoplankton, generally represented by the concentration of chlorophyll-a, such as physical variables, nutrients, organic substances, and metal ions [4,5]. The light conditions and nutrients were known as key elements necessary for the growth of plants and animals and in lake ecosystems.
The light conditions in lakes influence the growth of the plankton community, and the eutrophication caused by the high concentration of chlorophyll-a would impact light availability in lakes [6,7]. Excessive nitrogen and phosphorus inputs are important factors to shift lakes from oligotrophic to hypertrophic conditions [8], and lead to dramatic increases in harmful cyanobacteria blooms, which would create a serious threat to lake ecosystems [9]. The excessive amount of organic substances and metal ions in freshwaters generally originate from domestic sewage, urban run-off, industrial effluents and farm wastes, which are main causes of water pollution. Dissolved organic matter in lakes would absorb light and alter the light environment at depth, which would subsequently affect phytoplankton [10] and could also be consumed directly or indirectly by aquatic life and have widespread effects on zooplankton, benthic invertebrates, and fish [11]. Heavy metals (e.g., Pb, Cd, Cr, Zn, and Cu) from a variety of sources often have the environmental persistence, toxicity, and capacity to bio-accumulate and bio-magnify in food webs, so they are amongst the most important pollutants in lake ecosystems [12,13]. It has always been difficult to understand the nonlinear and complicated relationships between chlorophyll-a and multiple physicochemical parameters [14].
As a developing country, a large amount of contaminants are discharged into lakes each year in China, and numerous lakes in different provinces have been threatened by extensive eutrophication [8,15]. We decided to first cluster the lakes with similarities and then explore the relationships between chlorophyll-a and the multiple physicochemical variables for each group. The self-organizing map (SOM) is a type of artificial neural network that has been widely used in recent years in many fields [16]. The SOM made it possible to extract information from a complex system by dividing the multivariate datasets into a number of clusters representing different characteristics [17]. Based on the results of classification, the back propagation neural network (BPNN) could be used for prediction. However, as the network trained with data sets including a wide range of variables, this often leads to over-fitting problems, which is especially true when the sample size is small. To avoid the possible over-fitting problem of BPNNs, a genetic algorithm (GA) was often used for optimization in order to refine the selection of input variables and strengthen the models’ validity in recent years [18,19]. The clustering of lakes with spatial variations and the selection of factors that most influenced the concentration of chlorophyll-a for each cluster in one country were the area of our focus.
In this study, the sampling sites were distributed across 27 lakes in 18 provinces of China. The objectives of the study were: (1) to classify the lakes into clusters with similar water quality characteristics based on the SOM, and also analyze the trophic levels of lakes in each cluster; (2) to select the specific variables that most influenced the growth of algae for each lake cluster by GA-BPNN. The water-quality patterns were different amongst the clusters, so the limiting factors for plant growth may also be diverse. The potential causes of eutrophication for the lakes with various polluted characteristics and trophic levels will be determined and discussed in this study.

2. Materials and Methods
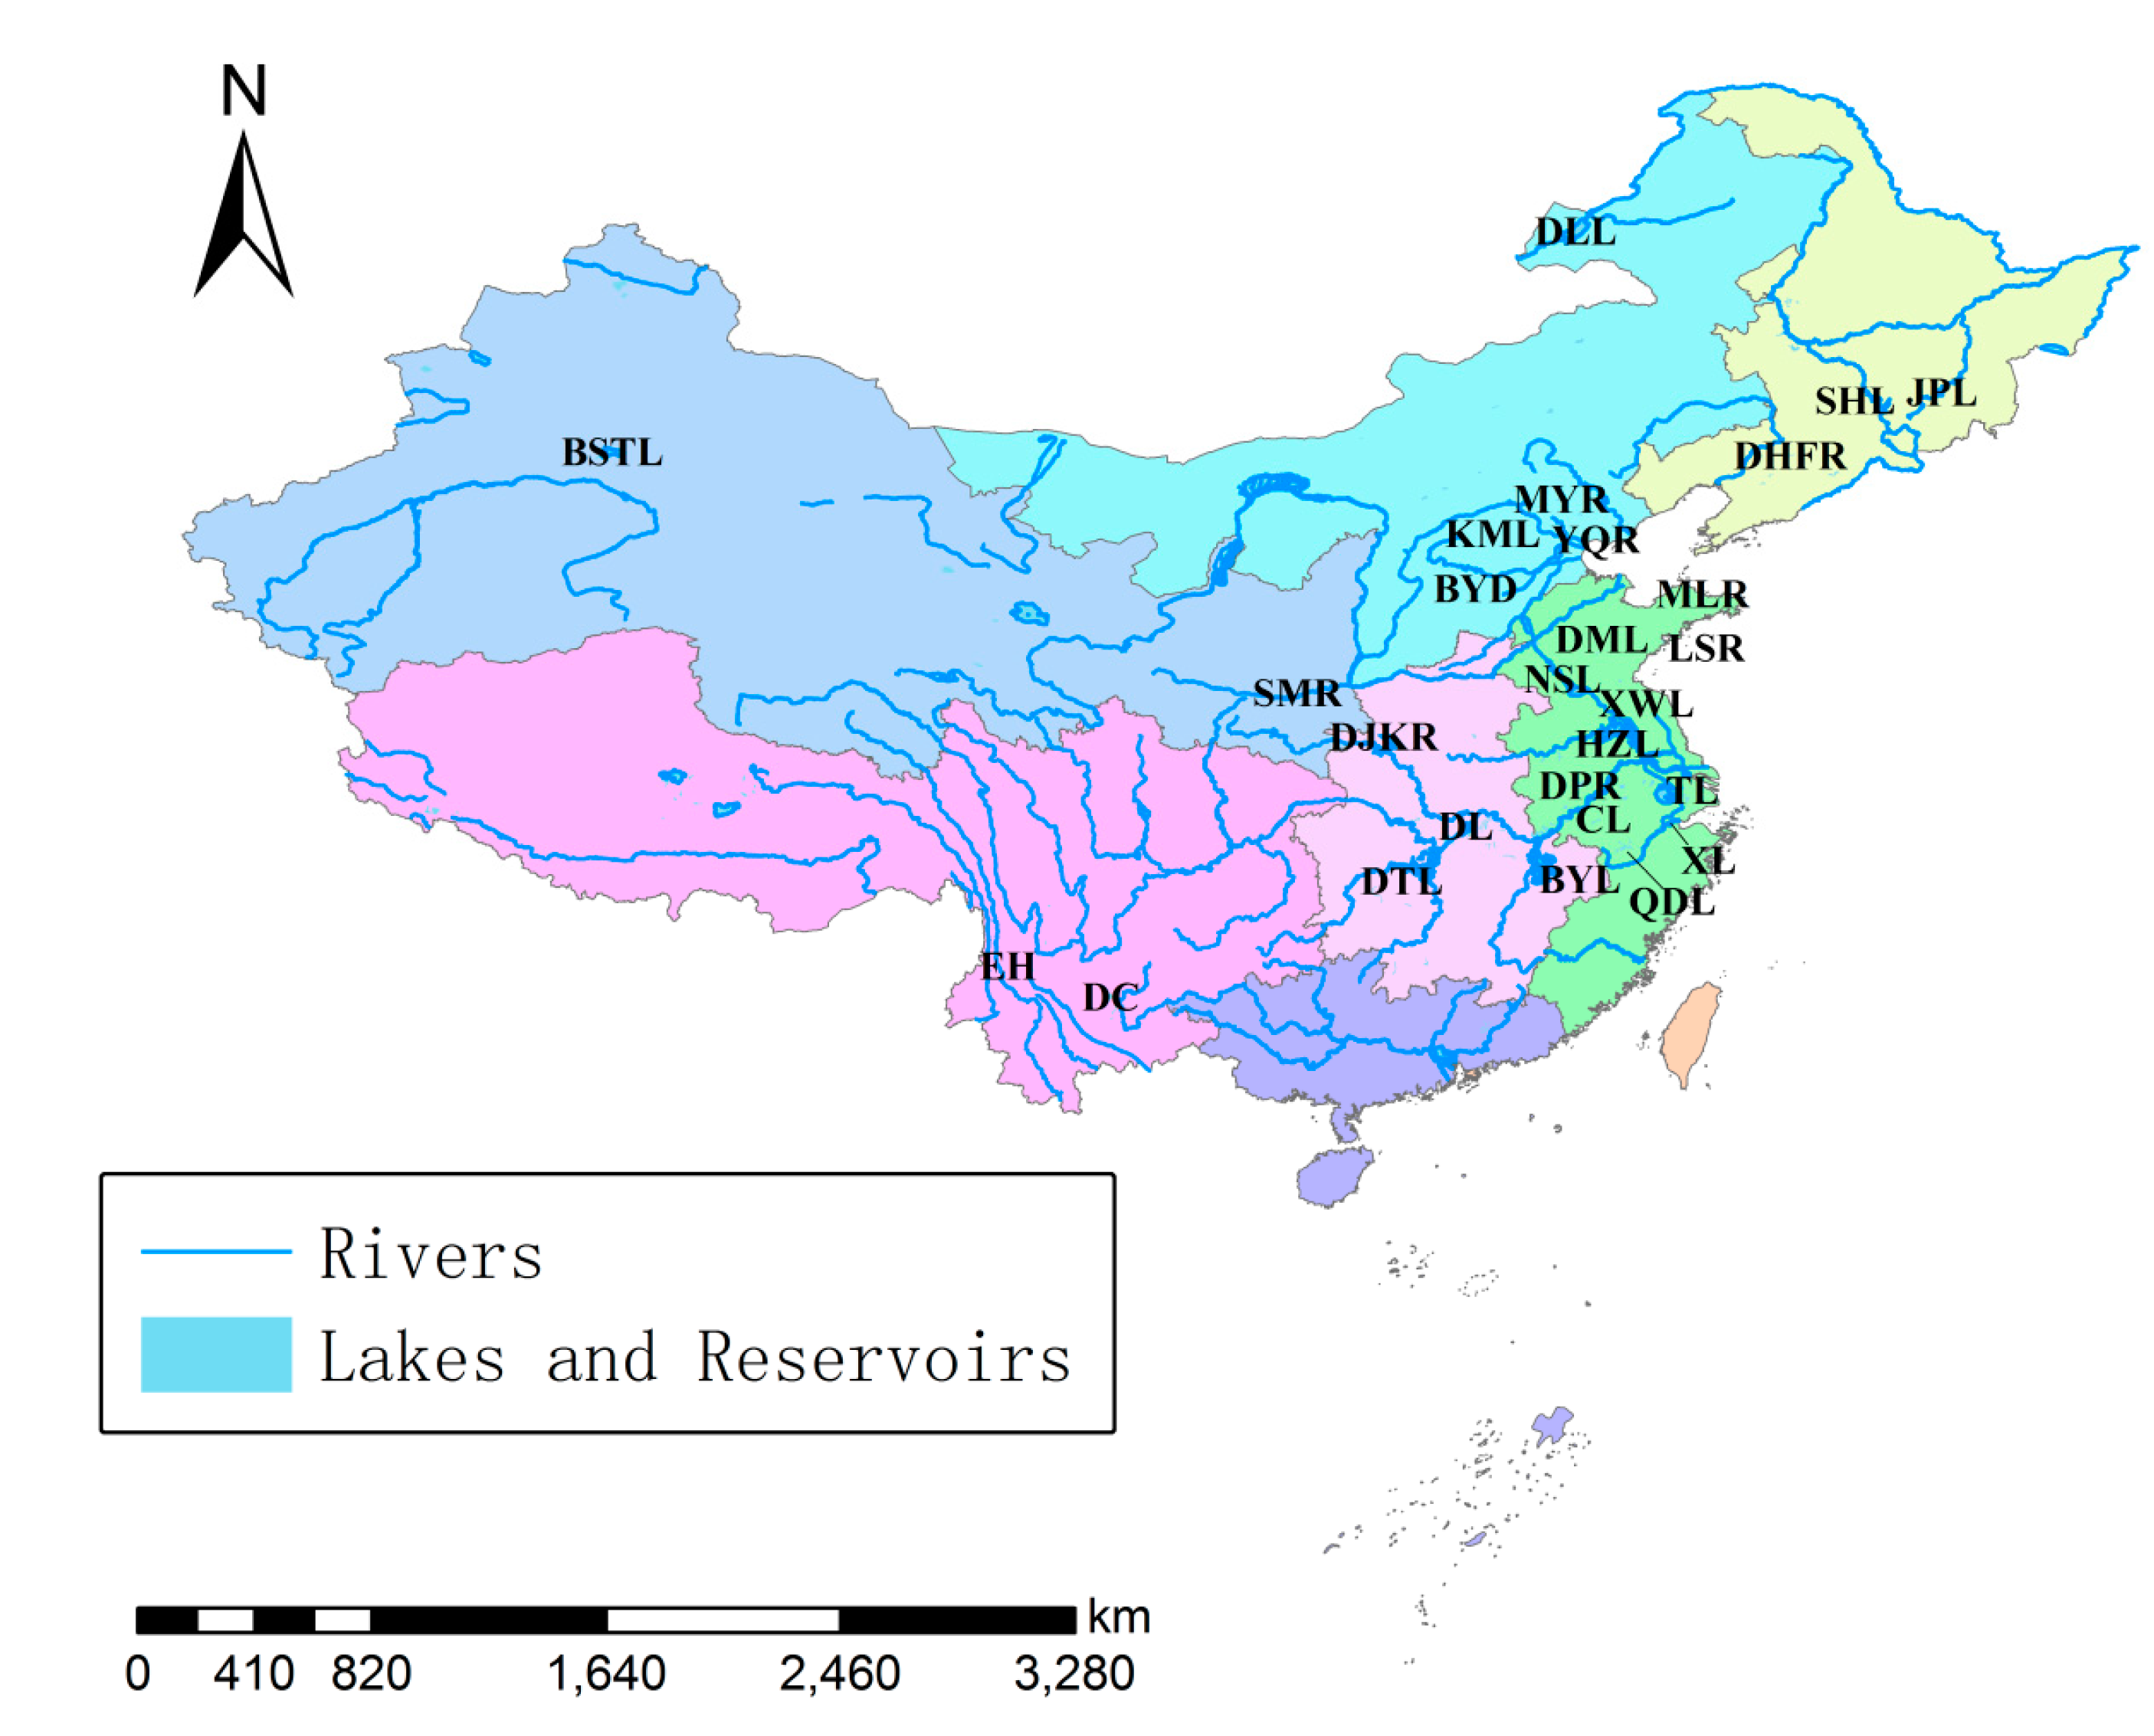
2.1. Data Set

The data set used in this study included 27 representative lakes distributed across 18 provinces in China during the period of 2009–2011 (Figure 1). The local environmental monitoring centers collected water samples at least three times every year from each of the lakes and reservoirs during the wet, level, and dry water periods. Twenty-four water quality parameters were analyzed according to the national standards for surface waters in China (GB3838-2002) in local laboratories. The number and location of sampling sites in each lake or reservoir were different according to the lake volumes and areas. Without consideration of temporal effects, the annual averages of the parameters were calculated for each sampling site. The monitoring sites with missing variables were not taken into account, and the final data set included two-year monitoring data of 149 sites.
Amongst the lakes, Chao Lake (CL, 12 sites), Daming Lake (DML, three sites), Dongpu Reservoir (DPR, two sites), Hongze Lake (HZL, six sites), Laoshan Reservoir (LSR, three sites), Menlou Reservoir (MLR, two sites), Nansi Lake (NSL, five sites), Qiandao Lake (QDL, three sites), Tai Lake (TL, 21 sites), Xi Lake (XL, three sites), and Xuanwu Lake (XWL, two sites) are located in eastern China. Danjiangkou Reservoir (DJKR, four sites), Dong Lake (DL, five sites), Dongting Lake (DTL, 12 sites), and Boyang Lake (BYL, four sites) are located in central China. Uneven geographical distribution of precipitation has resulted in uneven distribution of water resources in China. The north of the country, with similar land area and population as the south, held only 18% of the total water resources [20]. There are many more lakes and reservoirs distributed in the south of the country, with larger water surface area than in the north. Baiyangdian (BYD, eight sites), Dalai Lake (DLL, two sites), Kunming Lake (KML, one site), Miyun Reservoir (MYR, one site), and Yuqiao Reservoir (YQR, three sites) are located in northern China, which has the lowest water surface area in the country. Bosten Lake (BSTL, 14 sites) and Shimen Reservoir (SMR, one site) are located in northwestern China, while Dianchi (DC, 10 sites) and Erhai (EH, nine sites) are located in southwestern China. These two areas are urbanized to a lower degree than the others [21]. Dahuofang Reservoir (DHFR, five sites), Jingpo Lake (JPL, three sites), and Songhua Lake (SHL, five sites) are located in the coldest area of the country, northeastern China. The geographical variation of the lakes and reservoirs may lead to the differences in the factors influencing chlorophyll-a, which was explored in this study.
Twenty-four parameters were analyzed at each sampling site, included chlorophyll-a (Chla), water temperature (Temp), pH, clarity (SD), dissolved oxygen (DO), potassium permanganate index (CODMn), biochemical oxygen demand (BOD), ammonia nitrogen (NH3-N), total nitrogen (TN), total phosphorus (TP), petroleum, volatile phenol, mercury (Hg), lead (Pb), copper (Cu), zinc (Zn), fluoride, selenium (Se), arsenic (As), cadmium (Cd), hexavalent chrome (Cr), cyanide, anionic surfactant, and sulfide. Firstly, all the parameters were used to classify the lakes into several groups. Then Chla was used as the output variable, and the other 23 physicochemical parameters were considered as potential input variables. The most influential variables for Chla were selected for the lakes with similarities in each group. The raw data were standardized between zero and one before analysis to eliminate the effects of various dimensions and maintain the same or similar importance.

2.2. Trophic Level Index

In order to understand the trophic states of lakes, a comprehensive trophic level index (TLI) based on Chla concentrations [22] was used to estimate trophic state as follows:
T L I ( ) = j = 1 m W j · T L I ( j )
where TLI(∑) denotes the integrated trophic level index, TLI(j) is the trophic level index of parameter j, and Wj is correlative weight of the parameter j.
W j = r 1 j 2 j = 1 m r 1 j 2
Chla was defined as a standard parameter and r1j represents the correlation coefficient between Chla and parameter j. TN, TP, SD and CODMn were used for quantitative evaluation of trophic level for eutrophication [23]:
T L I ( C h l a ) = 10 ( 2.5 + 1.086 l n C h l a )
T L I ( T P ) = 10 ( 9.436 + 1.624 l n T P )
T L I ( T N ) = 10 ( 5.453 + 1.694 l n T N )
T L I ( S D ) = 10 ( 5.118 1.94 l n S D )
T L I ( C O D ) = 10 ( 0.109 + 2.661 l n C O D )
The eutrophication scale was classified into five grades: oligotrophic (TLI(∑) < 30), mesotrophic (30 ≤ TLI(∑) < 50), light eutrophic (50 ≤ TLI(∑) < 60), middle eutrophic (60 ≤ TLI(∑) < 70), and hyper eutrophic (TLI(∑) ≥ 70). The lakes with TLI(∑) higher than 50 were considered as eutrophic.

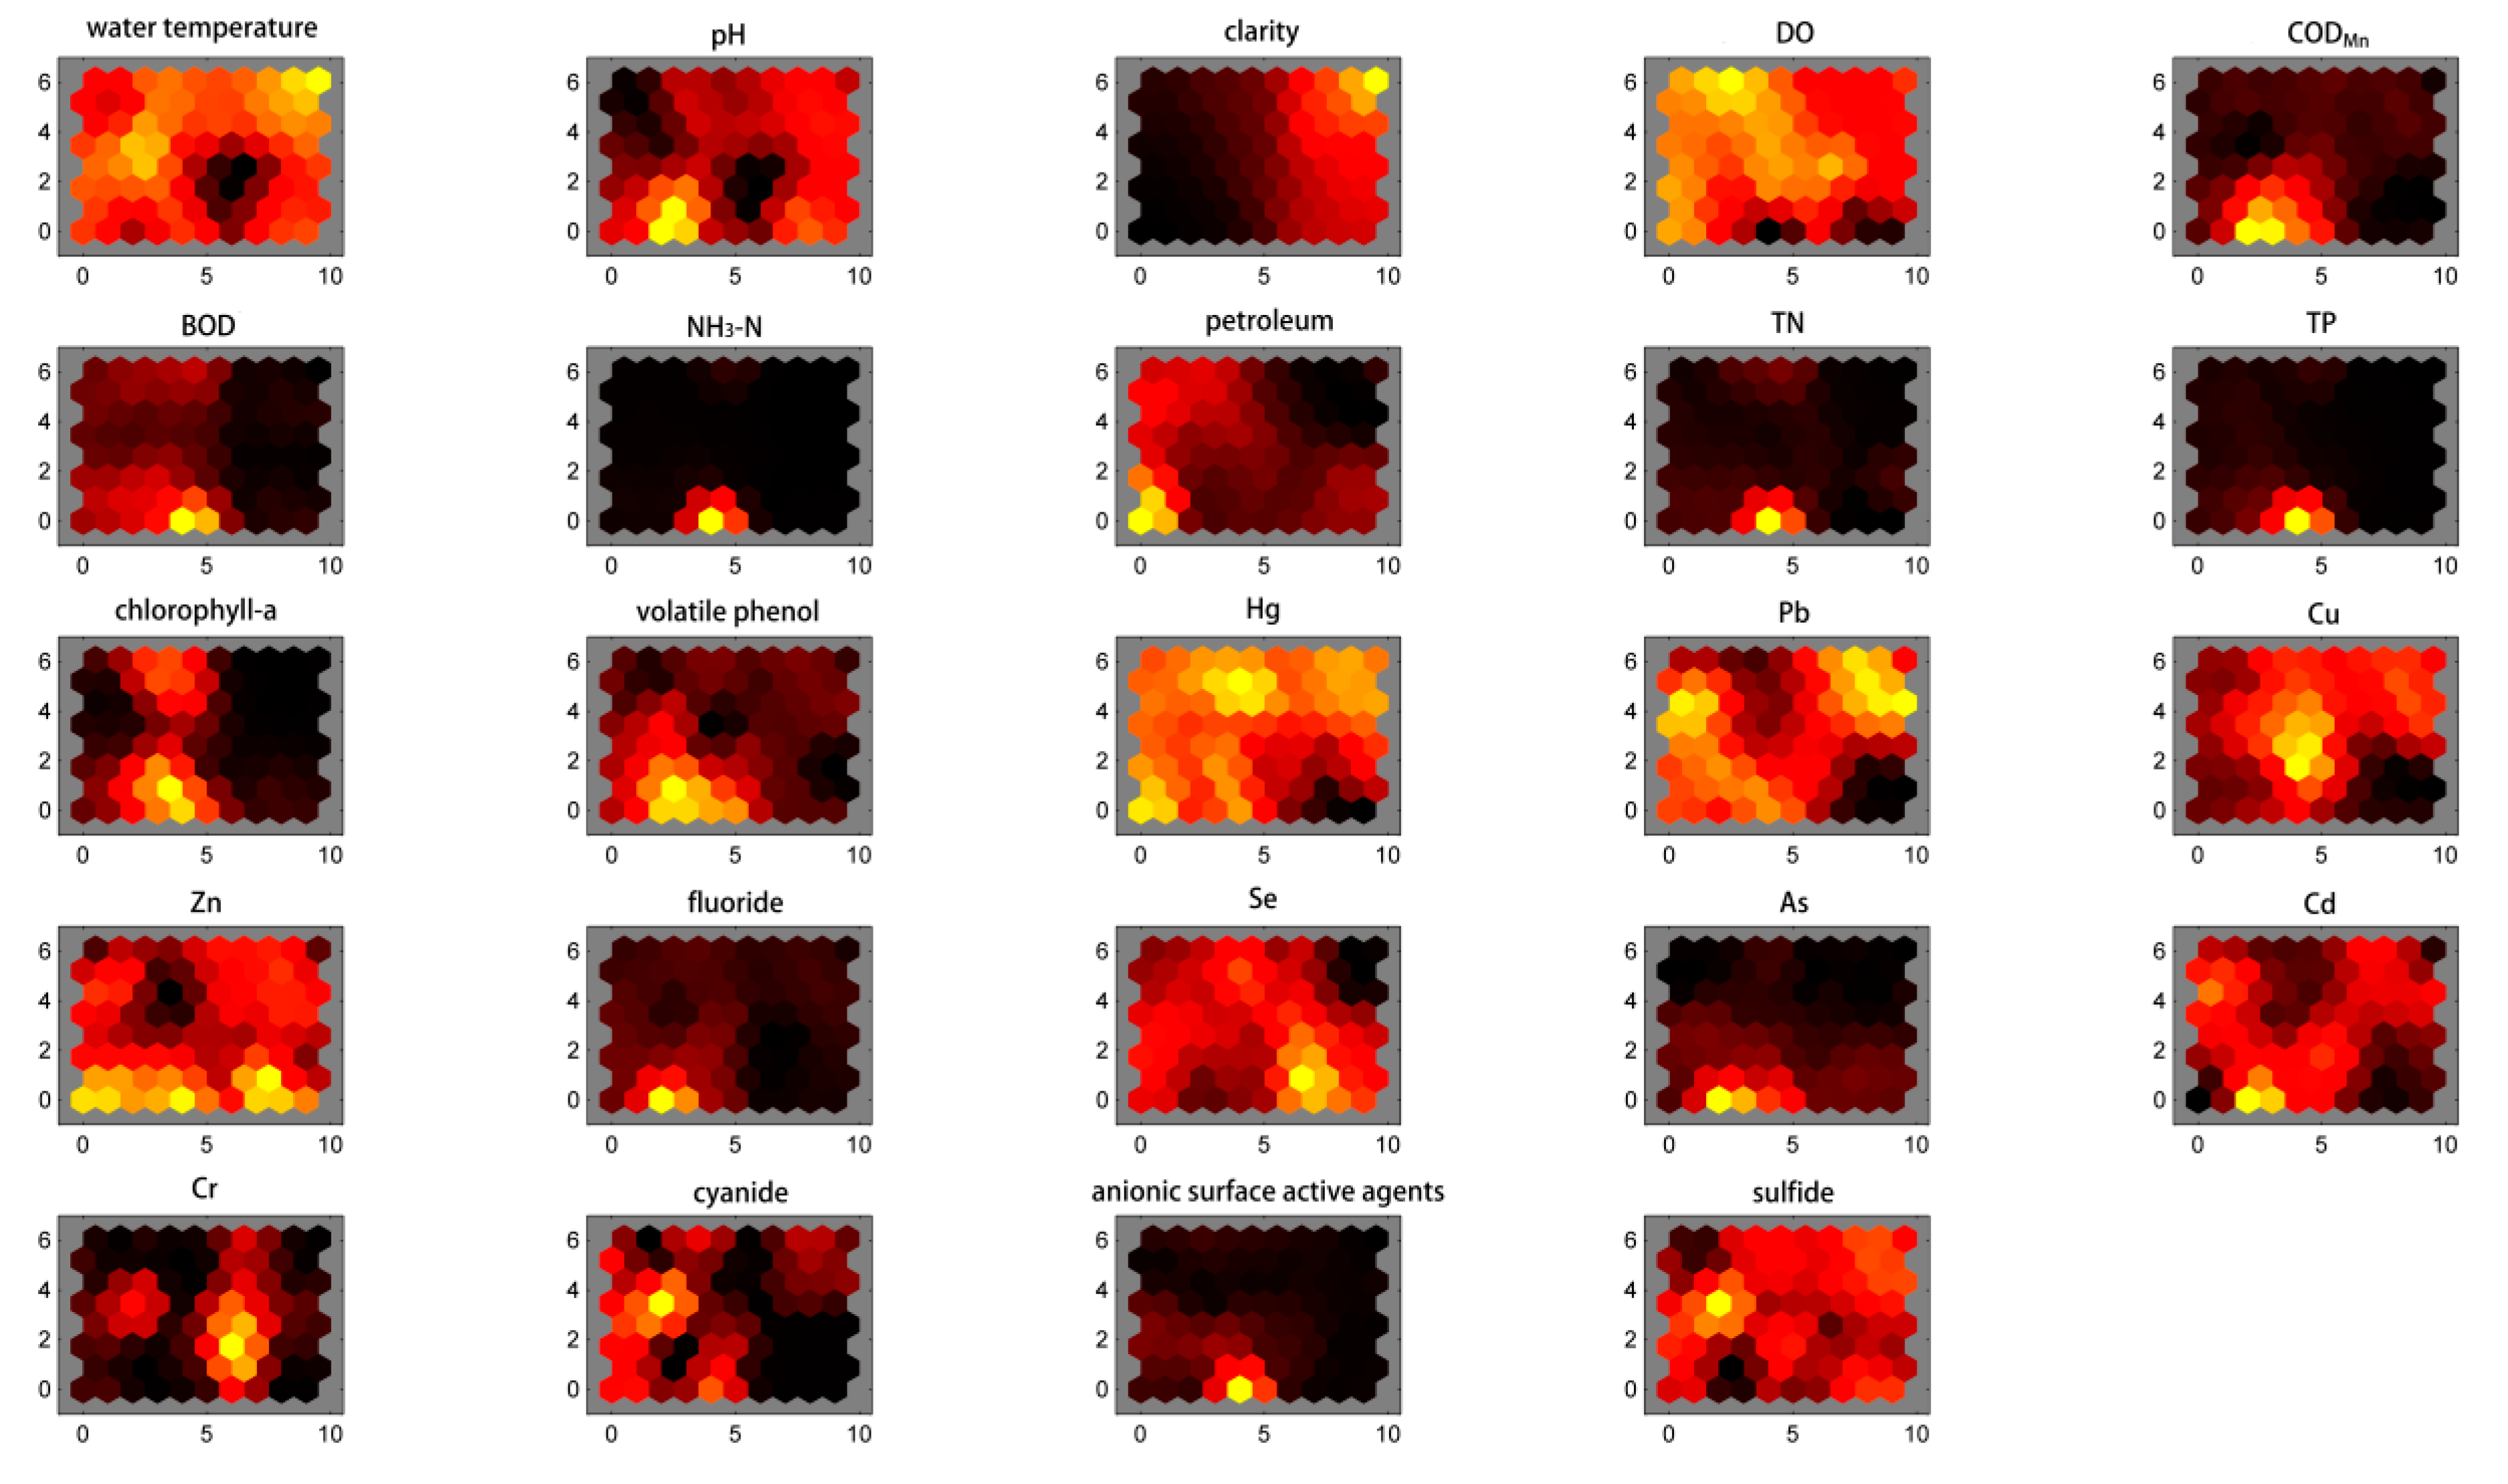
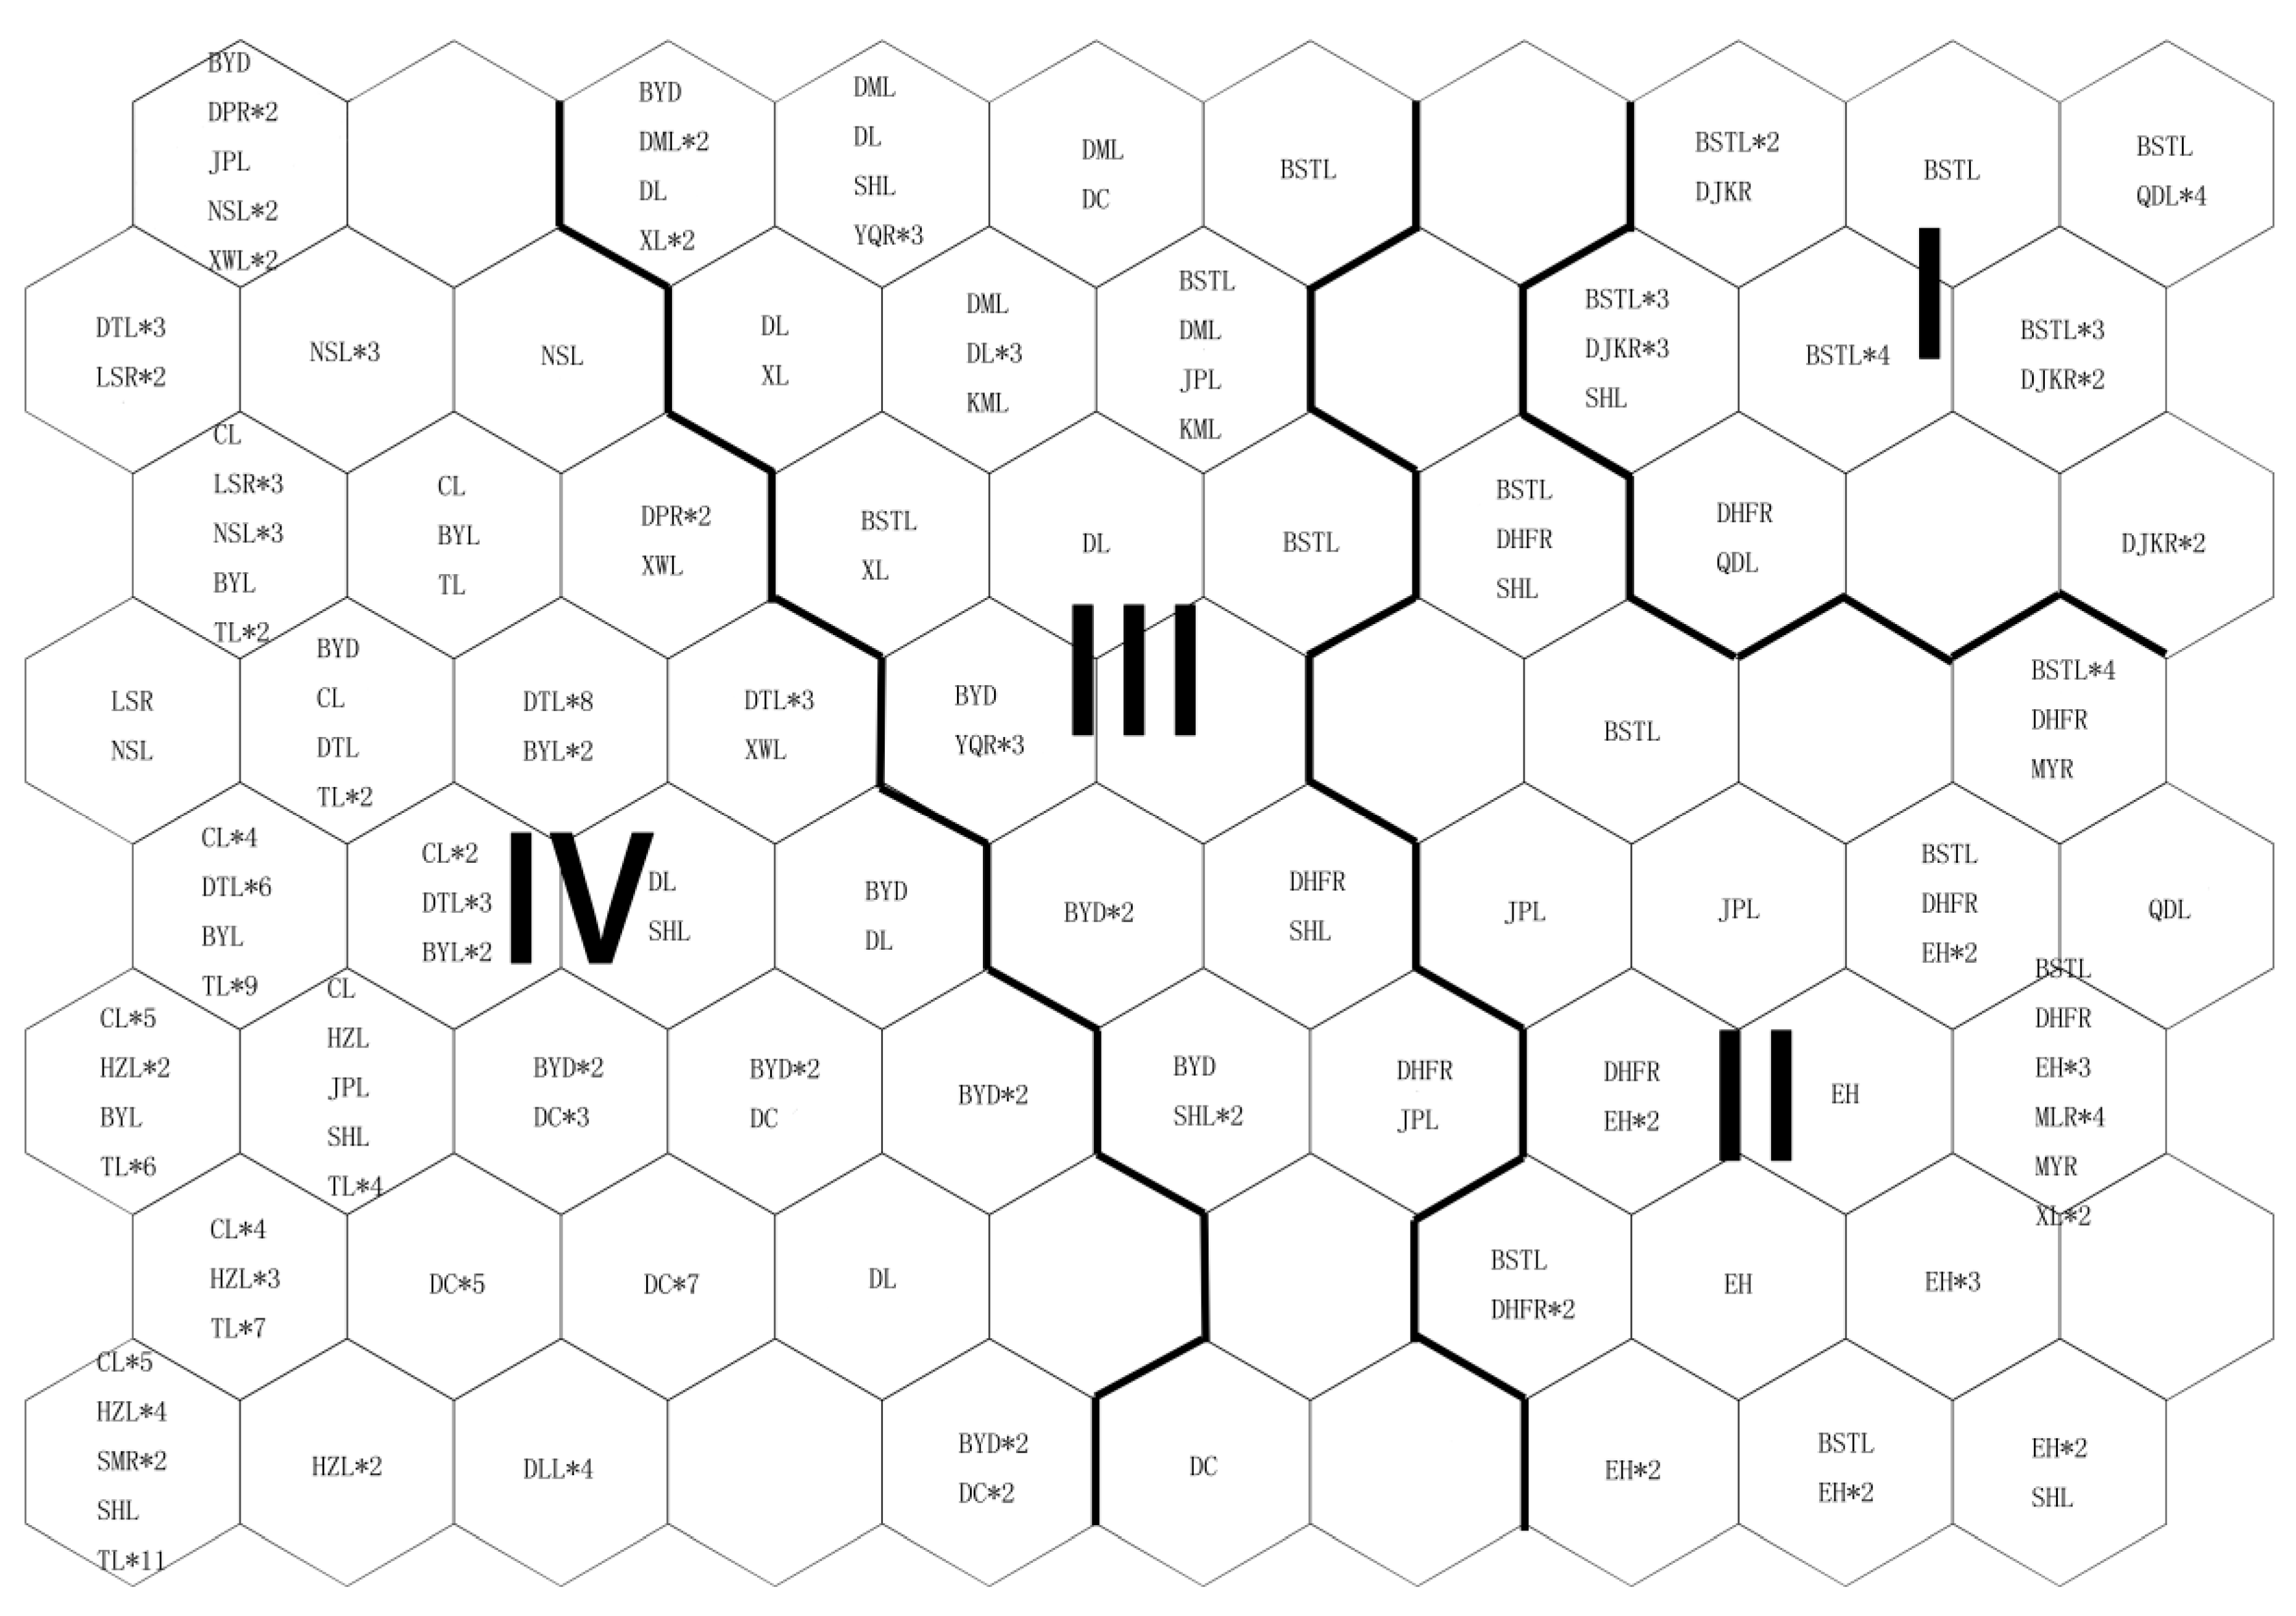
2.3. The Self-Organizing Map

The self-organizing map (SOM), as an unsupervised learning method, has been used extensively in various fields to extract information from complex data sets and map them into fewer dimensions [24]. One objective of the SOM was to construct a topological map, which can visualize the clustered input variables and explore similarities among the data. In general, the SOM comprises an input layer and a clustering layer, which consist of nodes distributed on the two-dimensional map [25]. A weight vector of the same dimension as the input vector is associated with each node and obtained from the results after iterative updates of the SOM. The determination of the number of map nodes has important effects on the accuracy and generalization capability of the SOM. In this study, we chose a heuristic rule often used in previous studies to calculate the number of nodes. The rule was known as m = 5 n , in which m is the number of SOM nodes and n is the number of input sites [26]. After the training process, preliminary grouping of samples was achieved and further clustering could be applied for the referenced vectors. The k-means algorithm was one of the most frequently used methods and chosen for use in this study [27]. The Davies–Bouldin index (DBI) was calculated for different numbers of clusters, while the number with the lowest DBI was considered as the most optimal one for the trained SOM [26,28]. The samples with similar characteristics were classified into the same group and supplemented by additional analysis.

2.4. The Optimized Back-Propagation Neural Networks

The back-propagation neural network (BPNN) was a popular algorithm applied in many subject areas showing great nonlinear regression capability [29]. The model was constructed from examples of data and known outputs based on supervised learning with a hypothesis that all the information contained in the data sets could be used to establish the relationships between inputs and outputs [30]. However, when the sample size was small, the myriad of input variables often lead to an over-fitting problem. In this study, we used genetic algorithms (GA) to select the optimal subset from a predictor variables pool for the BPNN. The GA-optimized BPNN (GA-BPNN) was applied for each cluster obtained from the SOM. The Chla concentration was used as the output variable, while all the other parameters acted as input variables at first. Then the selection process of input variables was performed, which started with an initial random set of weights and a global search was executed on the net weight range to find a better result. The initial population size of GA was 20, the length of chromosome was 23, and the maximum generation value was 100. When the generation was reaching maximum value, the chromosome with the minimum error value was chosen as the best solution for the model and used to optimize the initialized weights and the threshold of BPNN. The data set of each cluster was randomly divided into training and testing subsets, with proportions of 80% and 20%, respectively. The leave-one-out cross-validation is known as a most extreme form of k-fold cross-validation, in which k is the number of training patterns [31]. It was applied to limit the over-fitting problem and provide an almost unbiased estimate of the true generalization ability of the model [32]. The training subsets were used to obtain best structures and parameters of GA-BPNNs through the leave-one-out cross-validation method, and the randomly extractive testing subsets were used to validate the models. The performance of the GA-BPNNs was assessed by two standard statistical performance evaluation criteria, including the coefficient of determination (R2) and root mean squared error (RMSE) on both the training and testing data sets in this study.

3. Results and Discussion

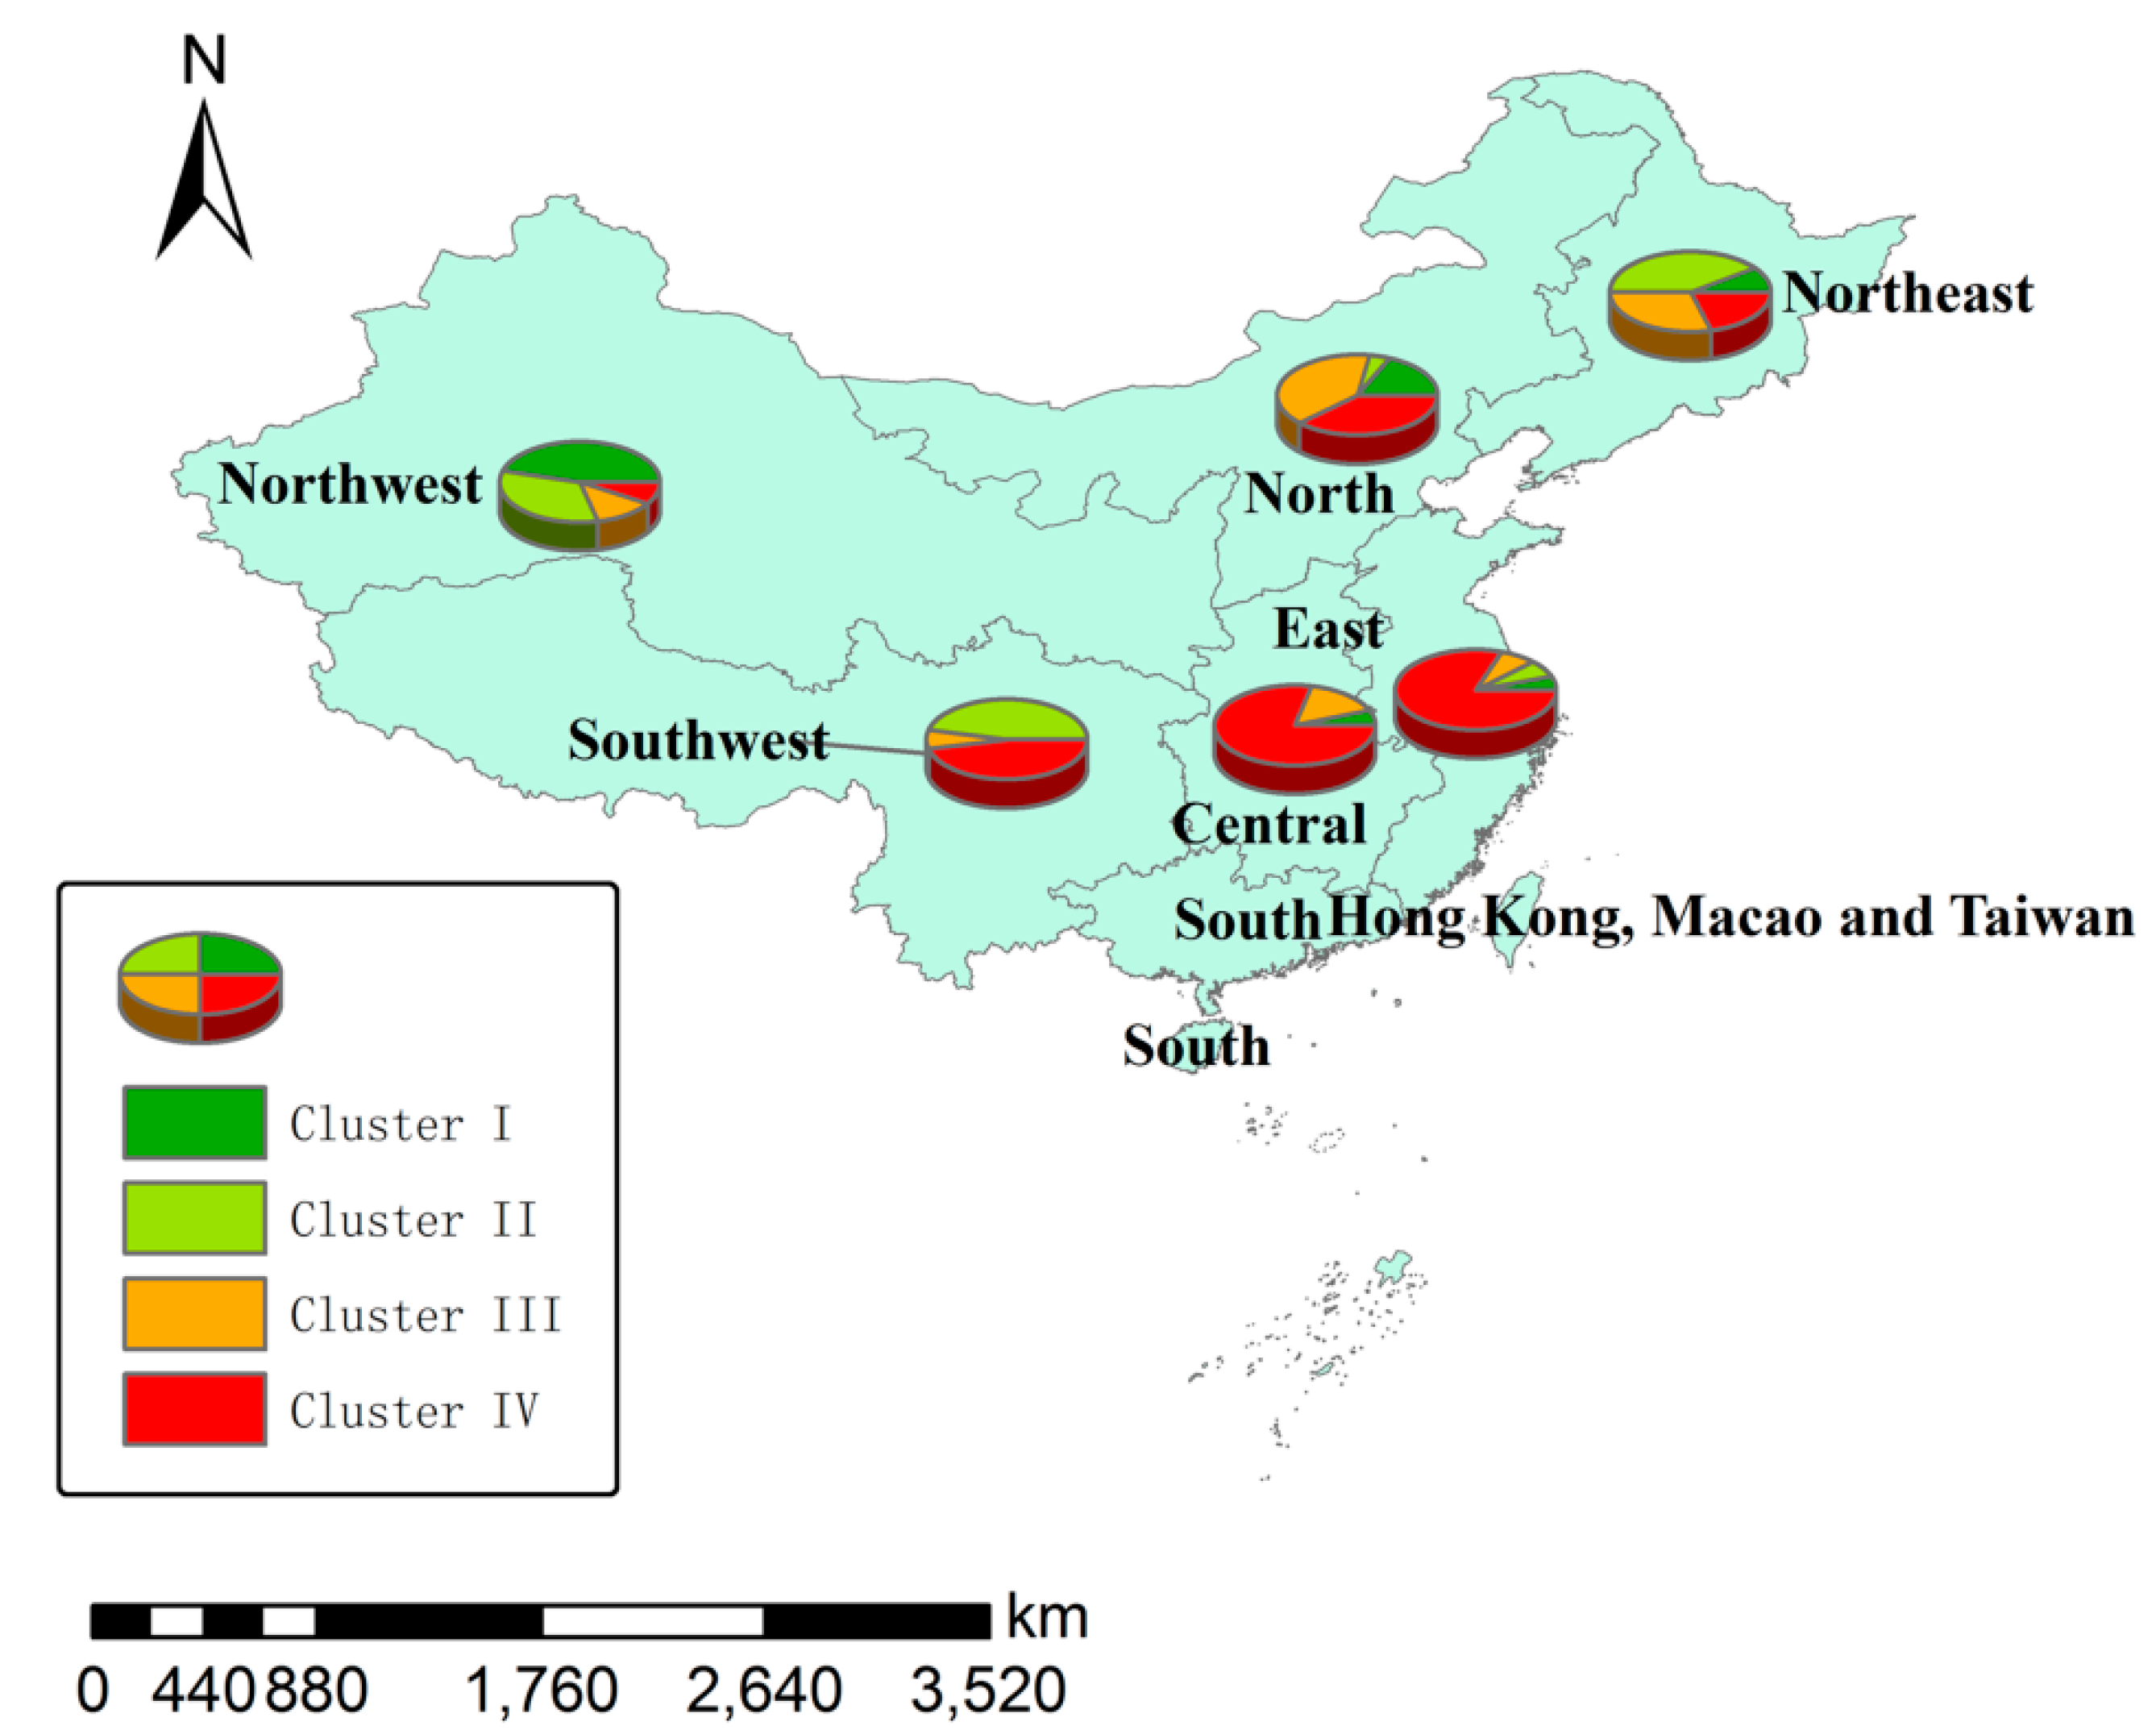
3.1. The Clustering Results of Sampling Sites

According to the methodology described above, a SOM with 80 nodes (eight vertical and 10 in a horizontal direction) was applied for preliminary classification of sampling sites based on standardized environmental monitoring data including 24 parameters. The component planes of each parameter in neurons on the trained map are shown in Figure 2. The nodes in varied colors represent different weighted values. The relationships amongst the variables could be explained by comparing the component planes. For example, the component planes of NH3-N, TN, TP and anionic surfactant with similar distributed patterns on the map indicate that these four parameters have positive correlations. In order to quantitatively evaluate the correlations, the Pearson correlation analysis was performed between these four parameters. There were significantly positive correlations between NH3-N and TN (0.90, p < 0.01), NH3-N and TP (0.90, p < 0.01), TN and TP (0.83, p < 0.01). The positive correlation coefficients between anionic surfactant and NH3-N (0.58, p < 0.01), TN (0.49, p < 0.01), TP (0.55, p < 0.01) were a little lower. The component planes of Hg and Pb showed visually positive correlation, with a Pearson correlation coefficient of 0.48 (p < 0.01). There were no significant correlations between DO and the other parameters from component planes, which was consistent with the results of the correlation analysis.
The k-means algorithm was further applied to cluster the neurons on the trained SOM map. The optimal number of clusters was selected based on the DBI values, which was calculated for clusters two through 10. The results (Table 1) showed that the most appropriate number of clusters was four, which corresponded to the minimum DBI value. Therefore, the sampling records could be classified into four groups, denoted by I, II, III, IV on the trained SOM map (Figure 3), and the number of records of different lakes included in each neuron were also marked in the figure.
The sites in Cluster I were mainly distributed in BSTL, DJKR, and QDL. The average TLI of BSTL, DJKR, and QDL were 36.67, 35.19, and 32.80, exceeding the minimum mesotrophic criterion. These oligotrophic to mesotrophic lakes often had very clear waters, with high drinking-water quality. DJKR and QDL, located in Hubei Province and Zhejiang Province respectively, had rich water resources and an abundant amount of rainfall each year. BSTL is in Xinjiang Uygur Autonomous Region, a vast territory with a sparse population and a low level of urbanization. The mean values and standard deviation (STD) of the 24 parameters for the four clusters are summarized in Table 2. The mean concentrations of TN and TP in Cluster I were 1.08 mg/L and 0.02 mg/L, respectively, which were lower than the values in the other clusters. The values of water temperature and SD were the highest in Cluster I, while Se and As were the lowest in this cluster. The water quality in these three lakes was fairly good, basically attaining the functioning requirements as a drinking water source or rare aquatic habitat.
Cluster II included the sites in EH, DHFR, MYR, MLR and some of the sites were located in the upper basin of BSTL. The TLI values of EH, DHFR, MYR, and MLR were 40.74, 40.10, 34.12, and 39.77, which indicated that they were at the mesotrophic level. The sites in BSTL in Cluster II had a TLI value 39.73, which was higher than the sites in Cluster I. The mesotrophic lakes were often clear water lakes and ponds with an intermediate level of productivity and medium levels of nutrients. The reservoirs DHFR, MYR, and MLR were located in the provinces with serious water shortage problems. Freshwater is valuable in these regions and the reservoirs have always acted as important drinking water sources. BSTL is located in Xinjiang, which is situated deep in the hinterland of Eurasia and one of the driest zones in the world [33]. Due to climate change and human activity, many lakes in Xinjiang have disappeared in the past decades and lake wetlands were destroyed by municipal wastewater and industrial sewage [34]. The ecological environment is very fragile in this region and more attention should be paid on water resources in this arid ecological system. The TLI values in Cluster II were generally higher than Cluster I, indicating a higher risk of eutrophication.
The sites in Cluster III were mainly distributed in DML, DL, XL, and YQR, with TLI values of 53.73, 61.43, 50.11, and 46.62 respectively. The lakes DML, DL, and XL were lightly eutrophic, while YQR was considered mesotrophic. The mean values of the parameters in this cluster were a little lower than Cluster IV, but higher than Cluster I and Cluster II, indicating worse water quality. Due to the cultural significance of DML, DL, and XL, intense eutrophication was occurring due to human activities as the regions have experienced rapid economic development and environmental change [35]. YQR is the main water source for industrial, agricultural, and daily use in Tianjin, and has played an important role in the economic development of Tianjin City [36]. The TLI value of YQR was approaching the minimum eutrophic range and the eutrophication risk would induce adverse effects on human health.
The sites in BYD, DC, CL, DTL, HZL, DLL, TL, and NSL were mainly grouped in Cluster IV. The TLI values of DTL and NSL were 49.17 and 49.95 respectively, which were close to the minimum eutrophic criterion. The lakes BYD, CL, and HZL were at the light eutrophic level, with TLI values of 54.54, 57.82, and 58.11 respectively. The lake DLL was at the middle eutrophic level (66.49), while DC was the most eutrophic lake with a TLI value of 70.69. These lakes are mostly located in economically developed provinces with large populations, such as Shandong, Jiangsu, Anhui, Hunan, and Hebei. Under the tremendous pressure of human influence, large amounts of nutrients have been discharged into lakes and the mean concentrations of TN and TP were 2.33 mg/L and 0.13 mg/L, respectively. These eutrophic lakes commonly have an excess amount of nutrients, which would induce the growth of plants and algae, leading to higher Chla concentrations and oxygen depletion in the water body [37]. The mean values of CODMn, BOD, NH3-N, and fluoride were the highest in Cluster IV while SD was much lower than in the other clusters. These lakes were at a higher risk of eutrophication and some of them have had several blue-green algae blooms [38,39]. The result of classification based on the 24 parameters was not completely consistent with the TLI values, as more comprehensive water quality characteristics were considered in this classification.

3.2. Different Predictors of Chlorophyll-A for Sites with Various Water Quality Characteristics

The SOM grouped the sampling sites from different lakes into four clusters according to the values of physicochemical parameters. As an indicator of the amount of phytoplankton or algae presented in a water body, Chla concentration was used to estimate biomass productivity and ecosystem health. In this study, we tried to determine the factors that most influence Chla for the lakes with different types and amounts of pollution in each SOM cluster. The results of GA-BPNNs with best fit structure during training and testing periods for Cluster I-IV are summarized in Table 3.
The results of selected input variables of each cluster are shown in Table 4. The results indicate that the predicted accuracies of GA-BPNNs were satisfied with nearly half of the predictors for the four clusters. In Cluster I and Cluster IV, SD was an important physical factor reflecting the Chla concentrations [40]. Previous studies had demonstrated that spatial and temporal variations in SD were highly associated with variations in Chla [41,42]. The growth of various species of algae produces chlorophyll and gives water its green tint in productive areas, meaning excessive algae growth or algal blooms often lead to reduced water clarity and light penetration [43]. Cluster II and Cluster III both chose Temp and pH as the most influential physical factors. In both clusters, Temp and pH showed significant positive linear correlation with Chla, which was consistent with previous studies [44]. The aquatic environment, with increasing water temperatures, would favor the bloom of toxin-producing harmful cyanobacteria, so that cyanobacteria grew rapidly during spring and summer, while they were not likely to reproduce during winter [45]. Furthermore, cyanobacteria with efficient carbon concentration mechanisms could outcompete other phytoplankton species under high pH [46].
Except for these physical parameters, nutrients, organic substances, and metal ions also had significant effects on the growth of phytoplankton [40,47]. Nitrogen and phosphorus were important nutrients for algae growth and often identified as limiting factors to algal biomass [48]. The excess input of nutrients results in the deleterious proliferation of planktonic alga and causes disruption of the aquatic environment [9]. For the lakes at a lower trophic level (Cluster I and Cluster II), both TN and TP were limiting factors of chlorophyll-a, while in the eutrophic lakes (Cluster III and Cluster IV), TP was more important. The ratio of TN:TP was higher in Cluster I and Cluster II than in Cluster III and Cluster IV, which indicates that the natural and undisturbed lakes received much less phosphorus than nitrogen, and eutrophic lakes received a large amount of wastewater and sewage with a lower average N:P [49]. The pollution caused by organic substances was a main anthropogenic driver of ecological change in ecosystems and may affect the ecological functions of lakes [50]. One or more parameters, which indicated the amount of organic matter in the water, included CODMn, BOD, and petroleum, were grouped into four clusters, demonstrating the important influence organic matter has on the concentration of Chla. Organic pollutants, even without toxicity, were one of the causes of water pollution because of the consumption of dissolved oxygen in the water. The organic matter was made up of a complex mixture of lipids, carbohydrates, proteins, and other biological chemicals, with significantly different physical, chemical, and toxicological properties [51], so that the specific contents were different in each cluster. Metal ions always had detrimental effect on ecosystems because of their toxicity and persistence in the water environment [52]. Some metals (Cu, Zn, etc.) played an important role for the physiological functions of living tissue and regulate many biochemical processes when presented in trace concentrations [53]. However, the same metals at elevated concentrations discharged from sewage or industrial effluents would have severe toxicological effects on the aquatic ecosystem, which has been demonstrated in marine phytoplankton [54]. Some other heavy metals, such as Pb and Hg, were non-essential heavy metals and their role in cells is not known [55]. They may affect organisms by accumulating in the body directly or by transferring to the next trophic level of the food chain, which would be a danger to human health [56]. Notably, the concentrations of Hg and Pb in Cluster IV were not lower than the other clusters, but they were not selected as input variables. This indicates that the control of nutrients and organic substances would be more crucial for the lakes in Cluster IV.
The composition of the site clusters in different parts of China had significant geographic variation, as shown in Figure 4. The percent of sites belonging to Cluster IV was 82.11% and 79.55% in eastern and central China, respectively. There are many lakes and abundant water in these two parts of China, but the water quality was very poor. Emphasis should be laid on controlling the inputs of TP and organic substances into the water in these regions. The proportions of sites belonging to Cluster III and Cluster IV in northern China were 37.84% and 40.54%, respectively. It indicates that the trend of the deterioration of water quality should be curbed and the inputs of influential factors need to be controlled in this region. The sites in northwestern China were mostly grouped into Cluster I and Cluster II. A general nationwide pattern emerged from Figure 4: the lakes in economically advanced regions in the east always had poorer water quality than those in the less developed western territories [57]. However, the water shortage problems were particularly severe in northwestern China. The protection of lakes in this region should focus on both the quantity and quality of water. The sites in southwestern China were mainly grouped into Cluster II and Cluster IV. The water quality in this region was generally good except for lake DC. With a rapid increase in local population and inputs of massive amounts of municipal and industrial sewage into the lake, it was in a status of heavy eutrophication and frequently accompanied by cyanobacteria blooms [58]. The pollution control of DC should be continued in the future. The number of lakes in northeastern China was relatively lower than in other regions, and they were mainly grouped into Cluster II and Cluster III. Northeastern China plays a vital role in national economic development with its developed industry, high degree of urbanization, and fertile cropland [59]. Limiting the inputs of metal ions and nutrients should be emphasized as a part of water pollution control. As the coldest region in China, the eutrophication risk was relatively lower in this region than others.

4. Conclusions

The potential for artificial neural networks (ANNs) in the classification of lakes and chlorophyll-a estimation was examined in this study. The SOM was applied first to group the sampling records into four clusters based on 24 parameters. Most of the physical factors and nutrients steadily deteriorated from Cluster I to Cluster IV, which indicated better water quality in Cluster I than the other clusters. The classification result was a little different from the trophic levels as it took more comprehensive parameters into consideration. Based on the result of classification, GA-BPNN was applied to each cluster to select the specific factors that most influenced the concentration of chlorophyll-a. The results of R2 and RMSE showed that the performance of GA-BPNN was satisfied with nearly half of the input variables selected from the predictor pool for each cluster. The composition of lake clusters showed that the lakes in the economically advanced eastern regions had poorer water quality than those in less-developed western territories. The organic substances discharged from anthropogenic activities were important factors in all four clusters. Based on the results, the combination of SOM and GA-BPNN was found to be effective on clustering and predicting, and the results could give some suggestions as to the management of lakes with diverse water quality characteristics in China. Our approach could be of great interest to lake managers who are concerned with controlling the undesirable effects of eutrophication, as the results suggested that the limiting nutrient factor for eutrophication was TP in eastern, central, and northern China, while both TN and TP were emphasized in northwestern, southwestern, and northeastern China.

Acknowledgments

This work was supported by Tianjin Normal University Doctor Foundation (52XB1517), the innovation team training plan of the Tianjin Education Committee (TD12-5037) and the National Natural Science Foundation of China (No. 41372373). Thanks very much for the careful work of anonymous reviewers and editor.

Author Contributions

Zhong-liang Wang designed framework of the article; Xue Li and Jian Sha analyzed the data; Xue Li wrote the paper.

Conflicts of Interest

The authors declare no conflict of interest.

References

  1. Paerl, H.W.; Paul, V.J. Climate change: Links to global expansion of harmful cyanobacteria. Water Res. 2012, 46, 1349–1363. [Google Scholar] [CrossRef] [PubMed]
  2. Berry, M.A.; Davis, T.W.; Cory, R.M.; Duhaime, M.B.; Johengen, T.H.; Kling, G.W.; Marino, J.A.; Den Uyl, P.A.; Gossiaux, D.; Dick, G.J. Cyanobacterial harmful algal blooms are a biological disturbance to western Lake Erie bacterial communities. Environ. Microbiol. 2017, 19, 1149–1162. [Google Scholar] [CrossRef] [PubMed]
  3. Mallin, M.A.; McIver, M.R.; Wambach, E.J.; Robuck, A.R. Algal blooms, circulators, waterfowl, and eutrophic Greenfield Lake, North Carolina. Lake Reserv. Manag. 2016, 32, 168–181. [Google Scholar] [CrossRef]
  4. De Oliveira Marcionilio, S.M.L.; Machado, K.B.; Carneiro, F.M.; Ferreira, M.E.; Carvalho, P.; Vieira, L.C.G.; de Moraes Huszar, V.L.; Nabout, J.C. Environmental factors affecting chlorophyll-a concentration in tropical floodplain lakes, Central Brazil. Environ. Monit. Assess. 2016, 188, 611. [Google Scholar] [CrossRef] [PubMed]
  5. Wei, D.; Yuan, G.; Simon, F. Seasonal characteristics of chlorophyll-a and its relationship with environmental factors in Yunmeng Lake of China. J. Environ. Biol. 2016, 37, 1073. [Google Scholar]
  6. Jeppesen, E.; Brucet, S.; Naselli-Flores, L.; Papastergiadou, E.; Stefanidis, K.; Noges, T.; Noges, P.; Attayde, J.L.; Zohary, T.; Coppens, J. Ecological impacts of global warming and water abstraction on lakes and reservoirs due to changes in water level and related changes in salinity. Hydrobiologia 2015, 750, 201–227. [Google Scholar] [CrossRef]
  7. Mahdy, A.; Hilt, S.; Filiz, N.; Beklioğlu, M.; Hejzlar, J.; Özkundakci, D.; Papastergiadou, E.; Scharfenberger, U.; Šorf, M.; Stefanidis, K. Effects of water temperature on summer periphyton biomass in shallow lakes: A pan-European mesocosm experiment. Aquat. Sci. 2015, 77, 499–510. [Google Scholar] [CrossRef]
  8. Paerl, H.W.; Xu, H.; Hall, N.S.; Rossignol, K.L.; Joyner, A.R.; Zhu, G.; Qin, B. Nutrient limitation dynamics examined on a multi-annual scale in Lake Taihu, China: Implications for controlling eutrophication and harmful algal blooms. J. Freshw. Ecol. 2015, 30, 5–24. [Google Scholar] [CrossRef]
  9. Xu, H.; Paerl, H.W.; Qin, B.; Zhu, G.; Hall, N.; Wu, Y. Determining critical nutrient thresholds needed to control harmful cyanobacterial blooms in eutrophic Lake Taihu, China. Environ. Sci. Technol. 2014, 49, 1051–1059. [Google Scholar] [CrossRef] [PubMed]
  10. Daggett, C.T.; Saros, J.E.; Lafrancois, B.M.; Simon, K.S.; Amirbahman, A. Effects of increased concentrations of inorganic nitrogen and dissolved organic matter on phytoplankton in boreal lakes with differing nutrient limitation patterns. Aquat. Sci. 2015, 77, 511–521. [Google Scholar] [CrossRef]
  11. Carpenter, S.R.; Cole, J.J.; Pace, M.L.; Wilkinson, G.M. Response of plankton to nutrients, planktivory and terrestrial organic matter: A model analysis of whole-lake experiments. Ecol. Lett. 2016, 19, 230–239. [Google Scholar] [CrossRef] [PubMed]
  12. Wang, Z.; Yao, L.; Liu, G.; Liu, W. Heavy metals in water, sediments and submerged macrophytes in ponds around the Dianchi Lake, China. Ecotoxicol. Environ. Saf. 2014, 107, 200–206. [Google Scholar] [CrossRef] [PubMed]
  13. Yang, J.; Chen, L.; Liu, L.-Z.; Shi, W.-L.; Meng, X.-Z. Comprehensive risk assessment of heavy metals in lake sediment from public parks in Shanghai. Ecotoxicol. Environ. Saf. 2014, 102, 129–135. [Google Scholar] [CrossRef] [PubMed]
  14. Huo, S.; Ma, C.; He, Z.; Xi, B.; Su, J.; Zhang, L.; Wang, J. Prediction of physico-chemical variables and chlorophyll a criteria for ecoregion lakes using the ratios of land use to lake depth. Environ. Earth Sci. 2015, 74, 3709–3719. [Google Scholar] [CrossRef]
  15. Jiang, Y.-J.; He, W.; Liu, W.-X.; Qin, N.; Ouyang, H.-L.; Wang, Q.-M.; Kong, X.-Z.; He, Q.-S.; Yang, C.; Yang, B. The seasonal and spatial variations of phytoplankton community and their correlation with environmental factors in a large eutrophic Chinese lake (Lake Chaohu). Ecol. Indic. 2014, 40, 58–67. [Google Scholar] [CrossRef]
  16. Kohonen, T. Essentials of the self-organizing map. Neural Netw. 2013, 37, 52–65. [Google Scholar] [CrossRef] [PubMed]
  17. Yu, H.; Song, Y.; Liu, R.; Pan, H.; Xiang, L.; Qian, F. Identifying changes in dissolved organic matter content and characteristics by fluorescence spectroscopy coupled with self-organizing map and classification and regression tree analysis during wastewater treatment. Chemosphere 2014, 113, 79–86. [Google Scholar] [CrossRef] [PubMed]
  18. Kuo, J.-T.; Wang, Y.-Y.; Lung, W.-S. A hybrid neural–genetic algorithm for reservoir water quality management. Water Res. 2006, 40, 1367–1376. [Google Scholar] [CrossRef] [PubMed]
  19. Fu, Z.; Mo, J.; Chen, L.; Chen, W. Using genetic algorithm-back propagation neural network prediction and finite-element model simulation to optimize the process of multiple-step incremental air-bending forming of sheet metal. Mater. Des. 2010, 31, 267–277. [Google Scholar] [CrossRef]
  20. Piao, S.; Ciais, P.; Huang, Y.; Shen, Z.; Peng, S.; Li, J.; Zhou, L.; Liu, H.; Ma, Y.; Ding, Y. The impacts of climate change on water resources and agriculture in China. Nature 2010, 467, 43–51. [Google Scholar] [CrossRef] [PubMed]
  21. Deng, X. Sustainable Urbanization in Western China. Environ. Sci. Policy Sustain. Dev. 2014, 56, 12–24. [Google Scholar] [CrossRef]
  22. Huo, S.; Ma, C.; Xi, B.; Su, J.; Zan, F.; Ji, D.; He, Z. Establishing eutrophication assessment standards for four lake regions, China. J. Environ. Sci. 2013, 25, 2014–2022. [Google Scholar] [CrossRef]
  23. Jin, X.-C.; Tu, Q.-Y. Rules of Eutrophication Investigation in Lake; China Environmental Science Press: Beijing, China, 1990. [Google Scholar]
  24. Chang, L.-C.; Shen, H.-Y.; Chang, F.-J. Regional flood inundation nowcast using hybrid som and dynamic neural networks. J. Hydrol. 2014, 519, 476–489. [Google Scholar] [CrossRef]
  25. Chon, T.-S. Self-organizing maps applied to ecological sciences. Ecol. Inform. 2011, 6, 50–61. [Google Scholar] [CrossRef]
  26. Nguyen, T.T.; Kawamura, A.; Tong, T.N.; Nakagawa, N.; Amaguchi, H.; Gilbuena, R. Clustering spatio–seasonal hydrogeochemical data using self-organizing maps for groundwater quality assessment in the Red River Delta, Vietnam. J. Hydrol. 2015, 522, 661–673. [Google Scholar] [CrossRef]
  27. Park, Y.-S.; Céréghino, R.; Compin, A.; Lek, S. Applications of artificial neural networks for patterning and predicting aquatic insect species richness in running waters. Ecol. Model. 2003, 160, 265–280. [Google Scholar] [CrossRef]
  28. Jin, Y.-H.; Kawamura, A.; Park, S.-C.; Nakagawa, N.; Amaguchi, H.; Olsson, J. Spatiotemporal classification of environmental monitoring data in the Yeongsan River Basin, Korea, using self-organizing maps. J. Environ. Monit. 2011, 13, 2886–2894. [Google Scholar] [CrossRef] [PubMed]
  29. Maier, H.R.; Jain, A.; Dandy, G.C.; Sudheer, K.P. Methods used for the development of neural networks for the prediction of water resource variables in river systems: Current status and future directions. Environ. Model. Softw. 2010, 25, 891–909. [Google Scholar] [CrossRef]
  30. Najah, A.; El-Shafie, A.; Karim, O.A.; El-Shafie, A.H. Application of artificial neural networks for water quality prediction. Neural Comput. Appl. 2013, 22, 187–201. [Google Scholar] [CrossRef]
  31. Li, X.; Sha, J.; Wang, Z.-L. A comparative study of multiple linear regression, artificial neural network and support vector machine for the prediction of dissolved oxygen. Hydrol. Res. 2016. [Google Scholar] [CrossRef]
  32. Cawley, G.C.; Talbot, N.L. Fast exact leave-one-out cross-validation of sparse least-squares support vector machines. Neural Netw. 2004, 17, 1467–1475. [Google Scholar] [CrossRef] [PubMed]
  33. Leiwen, J.; Yufen, T.; Zhijie, Z.; Tianhong, L.; Jianhua, L. Water resources, land exploration and population dynamics in arid areas-the case of the Tarim River Basin in Xinjiang of China. Popul. Environ. 2005, 26, 471–503. [Google Scholar] [CrossRef]
  34. Lei, X.; Lu, J.; Liu, Z.; Tong, Y.; Li, S. Concentration and distribution of antibiotics in water-sediment system of Bosten Lake, Xinjiang. Environ. Sci. Pollut. Res. 2015, 22, 1670–1678. [Google Scholar] [CrossRef] [PubMed]
  35. Torbick, N.; Hu, F.; Zhang, J.; Qi, J.; Zhang, H.; Becker, B. Mapping chlorophyll-a concentrations in West Lake, China using Landsat 7 ETM+. J. Gt. Lakes Res. 2008, 34, 559–565. [Google Scholar] [CrossRef]
  36. Li, X.; Xu, Y.; Zhao, G.; Shi, C.; Wang, Z.-L.; Wang, Y. Assessing threshold values for eutrophication management using Bayesian method in Yuqiao Reservoir, North China. Environ. Monit. Assess. 2015, 187, 195. [Google Scholar] [CrossRef] [PubMed]
  37. Smith, V.H.; Tilman, G.D.; Nekola, J.C. Eutrophication: Impacts of excess nutrient inputs on freshwater, marine, and terrestrial ecosystems. Environ. Pollut. 1999, 100, 179–196. [Google Scholar] [CrossRef]
  38. Liu, Y.; Chen, W.; Li, D.; Shen, Y.; Li, G.; Liu, Y. First report of aphantoxins in China—waterblooms of toxigenic aphanizomenon flos-aquae in Lake Dianchi. Ecotoxicol. Environ. Saf. 2006, 65, 84–92. [Google Scholar] [CrossRef] [PubMed]
  39. Muqi, X.; Jiang, Z.; Yuyao, H.; Yurong, G.; Shen, Z.; Yijian, T.; Chengqing, Y.; Zijian, W. The ecological degradation and restoration of Baiyangdian lake, China. J. Freshw. Ecol. 1998, 13, 433–446. [Google Scholar] [CrossRef]
  40. Admiraal, W.; Blanck, H.; Buckert-de Jong, M.; Guasch, H.; Ivorra, N.; Lehmann, V.; Nyström, B.; Paulsson, M.; Sabater, S. Short-term toxicity of zinc to microbenthic algae and bacteria in a metal polluted stream. Water Res. 1999, 33, 1989–1996. [Google Scholar] [CrossRef]
  41. McPherson, B.F.; Miller, R.L. Causes of Ught Avi'enuation in Tampa Bay and Charlotte Harbor, Southwestern Florida1. JAWRA J. Am. Water Resour. Assoc. 1994, 30, 43–53. [Google Scholar] [CrossRef]
  42. Morrison, G.; Sherwood, E.T.; Boler, R.; Barron, J. Variations in water clarity and chlorophylla in Tampa Bay, Florida, in response to annual rainfall, 1985–2004. Estuaries Coasts 2006, 29, 926–931. [Google Scholar] [CrossRef]
  43. Hoyer, M.V.; Frazer, T.K.; Notestein, S.K.; Canfield, J.; Daniel, E. Nutrient, chlorophyll, and water clarity relationships in Florida’s nearshore coastal waters with comparisons to freshwater lakes. Can. J. Fish. Aquat. Sci. 2002, 59, 1024–1031. [Google Scholar] [CrossRef]
  44. Rinta-Kanto, J.M.; Wilhelm, S.W. Diversity of microcystin-producing cyanobacteria in spatially isolated regions of Lake Erie. Appl. Environ. Microbiol. 2006, 72, 5083–5085. [Google Scholar] [CrossRef] [PubMed]
  45. Cheung, M.Y.; Liang, S.; Lee, J. Toxin-producing cyanobacteria in freshwater: A review of the problems, impact on drinking water safety, and efforts for protecting public health. J. Microbiol. 2013, 51, 1. [Google Scholar] [CrossRef] [PubMed]
  46. Wicks, R.J.; Thiel, P.G. Environmental factors affecting the production of peptide toxins in floating scums of the cyanobacterium Microcystis aeruginosa in a hypertrophic African reservoir. Environ. Sci. Technol. 1990, 24, 1413–1418. [Google Scholar] [CrossRef]
  47. Rinaldi, M.; Fuzzi, S.; Decesari, S.; Marullo, S.; Santoleri, R.; Provenzale, A.; Hardenberg, J.; Ceburnis, D.; Vaishya, A.; O’Dowd, C.D. Is chlorophyll-a the best surrogate for organic matter enrichment in submicron primary marine aerosol? J. Geophys. Res.: Atmos. 2013, 118, 4964–4973. [Google Scholar] [CrossRef]
  48. Phillips, G.; Pietiläinen, O.-P.; Carvalho, L.; Solimini, A.; Solheim, A.L.; Cardoso, A. Chlorophyll–nutrient relationships of different lake types using a large European dataset. Aquat. Ecol. 2008, 42, 213–226. [Google Scholar] [CrossRef]
  49. Downing, J.A.; McCauley, E. The nitrogen: Phosphorus relationship in lakes. Limnol. Oceanogr. 1992, 37, 936–945. [Google Scholar] [CrossRef]
  50. Sanz-Lázaro, C.; Fodelianakis, S.; Guerrero-Meseguer, L.; Marín, A.; Karakassis, I. Effects of organic pollution on biological communities of marine biofilm on hard substrata. Environ. Pollut. 2015, 201, 17–25. [Google Scholar] [CrossRef] [PubMed]
  51. Meyers, P.A.; Ishiwatari, R. Lacustrine organic geochemistry—An overview of indicators of organic matter sources and diagenesis in lake sediments. Org. Geochem. 1993, 20, 867–900. [Google Scholar] [CrossRef]
  52. Tonietto, A.E.; Lombardi, A.T.; Choueri, R.B.; Vieira, A.A.H. Chemical behavior of Cu, Zn, Cd, and Pb in a eutrophic reservoir: Speciation and complexation capacity. Environ. Sci. Pollut. Res. 2015, 22, 15920–15930. [Google Scholar] [CrossRef] [PubMed]
  53. Giguère, A.; Campbell, P.G.; Hare, L.; McDonald, D.G.; Rasmussen, J.B. Influence of lake chemistry and fish age on cadmium, copper, and zinc concentrations in various organs of indigenous yellow perch (Perca flavescens). Can. J. Fish. Aquat. Sci. 2004, 61, 1702–1716. [Google Scholar] [CrossRef]
  54. Xue, H.; Kistler, D.; Sigg, L. Competition of copper and zinc for strong ligands in a eutrophic lake. Limnol. Oceanogr. 1995, 40, 1142–1152. [Google Scholar] [CrossRef]
  55. Karadede-Akin, H.; Ünlü, E. Heavy metal concentrations in water, sediment, fish and some benthic organisms from Tigris River, Turkey. Environ. Monit. Assess. 2007, 131, 323–337. [Google Scholar] [CrossRef] [PubMed]
  56. Altındağ, A.; Yiğit, S. Assessment of heavy metal concentrations in the food web of Lake Beyşehir, Turkey. Chemosphere 2005, 60, 552–556. [Google Scholar] [CrossRef] [PubMed]
  57. Jun, X.; Chen, Y.D. Water problems and opportunities in the hydrological sciences in China. Hydrol. Sci. J. 2001, 46, 907–921. [Google Scholar] [CrossRef]
  58. Wang, Z.; Zhang, Z.; Zhang, J.; Zhang, Y.; Liu, H.; Yan, S. Large-scale utilization of water hyacinth for nutrient removal in Lake Dianchi in China: The effects on the water quality, macrozoobenthos and zooplankton. Chemosphere 2012, 89, 1255–1261. [Google Scholar] [CrossRef] [PubMed]
  59. Yang, X.; Lin, E.; Ma, S.; Ju, H.; Guo, L.; Xiong, W.; Li, Y.; Xu, Y. Adaptation of agriculture to warming in Northeast China. Clim. Chang. 2007, 84, 45–58. [Google Scholar] [CrossRef]
Figure 1. The locations of 27 representative lakes in China.
Water 09 00524 g001
Figure 2. Component planes of the 24 parameters.
Water 09 00524 g002
Figure 3. The clustering results of the trained SOM neurons. The k-means method was applied to define boundaries (dark lines) of the four clusters (I–IV) on the map.
Water 09 00524 g003
Figure 4. The composition of clusters in different regions of China.
Water 09 00524 g004
Table 1. Davies-Bouldin index (DBI) values of different numbers of clusters on the trained SOM.
Cluster Numbers2345678910
DBI0.520.500.480.570.500.500.530.650.49
Table 2. Summary statistics of 24 parameters for the four clusters.
ParametersCluster ICluster IICluster IIICluster IV
MeanSTDMeanSTDMeanSTDMeanSTD
Temp (°C)18.872.0616.762.3217.373.2217.241.96
pH8.280.398.340.378.150.398.130.48
SD (m)2.911.252.000.781.110.780.4428.59
DO (mg/L)7.831.207.281.188.631.688.511.18
CODMn (mg/L)3.721.753.371.274.862.545.303.79
BOD (mg/L)1.370.481.360.412.381.112.731.70
NH3-N (mg/L)0.120.070.120.070.773.160.691.91
petroleum (10−1 mg/L)0.100.070.180.110.230.160.380.48
TN (mg/L)1.080.351.481.612.814.032.332.47
TP (mg/L)0.020.010.030.020.090.190.130.17
Chla (10−2 mg/L)0.410.310.820.772.333.464.649.56
volatile phenol (10−2 mg/L)0.100.030.100.020.100.040.130.07
Hg (10−4 mg/L)0.250.080.160.110.240.160.240.10
Pb (10−2 mg/L)0.460.250.240.200.230.180.390.26
Cu (10−2 mg/L)1.411.090.830.971.591.080.930.95
Zn (10−1 mg/L)0.190.080.210.110.170.100.210.12
fluoride (mg/L)0.310.140.260.110.420.190.580.74
Se (10−3 mg/L)0.190.260.640.520.500.560.480.30
As (10−2 mg/L)0.160.220.250.160.190.170.360.47
Cd (10−3 mg/L)0.370.280.220.190.240.210.340.40
Cr (10−2 mg/L)0.240.100.290.220.230.100.250.11
cyanide (10−2 mg/L)0.220.050.200.050.220.040.240.08
anionic surfactant (10−1 mg/L)0.280.090.290.080.360.320.430.35
sulfide (10−2 mg/L)1.000.390.770.320.770.830.810.82
Table 3. The performance statistics of GA-BPNNs for each cluster during training and testing periods.
ClustersTrainingTesting
R2RMSER2RMSE
Cluster I0.840.00160.930.0030
Cluster II0.960.00110.890.0006
Cluster III0.960.0120.960.012
Cluster IV0.970.00930.930.0040
Table 4. The results of input variables selected from 23 parameters for each cluster.
ClustersSelected Variables
Cluster ITemp, SD, DO, CODMn, TN, TP, Hg, Cu, Zn, fluoride, cyanide
Cluster IITemp, pH, NH3-N, petroleum, TN, TP, volatile phenol, Hg, Pb, Zn, fluoride, Se, sulfide
Cluster IIITemp, pH, DO, BOD, TP, Pb, Se, anionic surfactant
Cluster IVpH, SD, CODMn, NH3-N, petroleum, TP, Zn, Se, Cd, Cr, cyanide, anionic surfactant, sulfide

