The Use of Molluscan Fauna as Model Taxon for the Ecological Classification of River Estuaries
Abstract
:1. Introduction
2. Materials and Methods
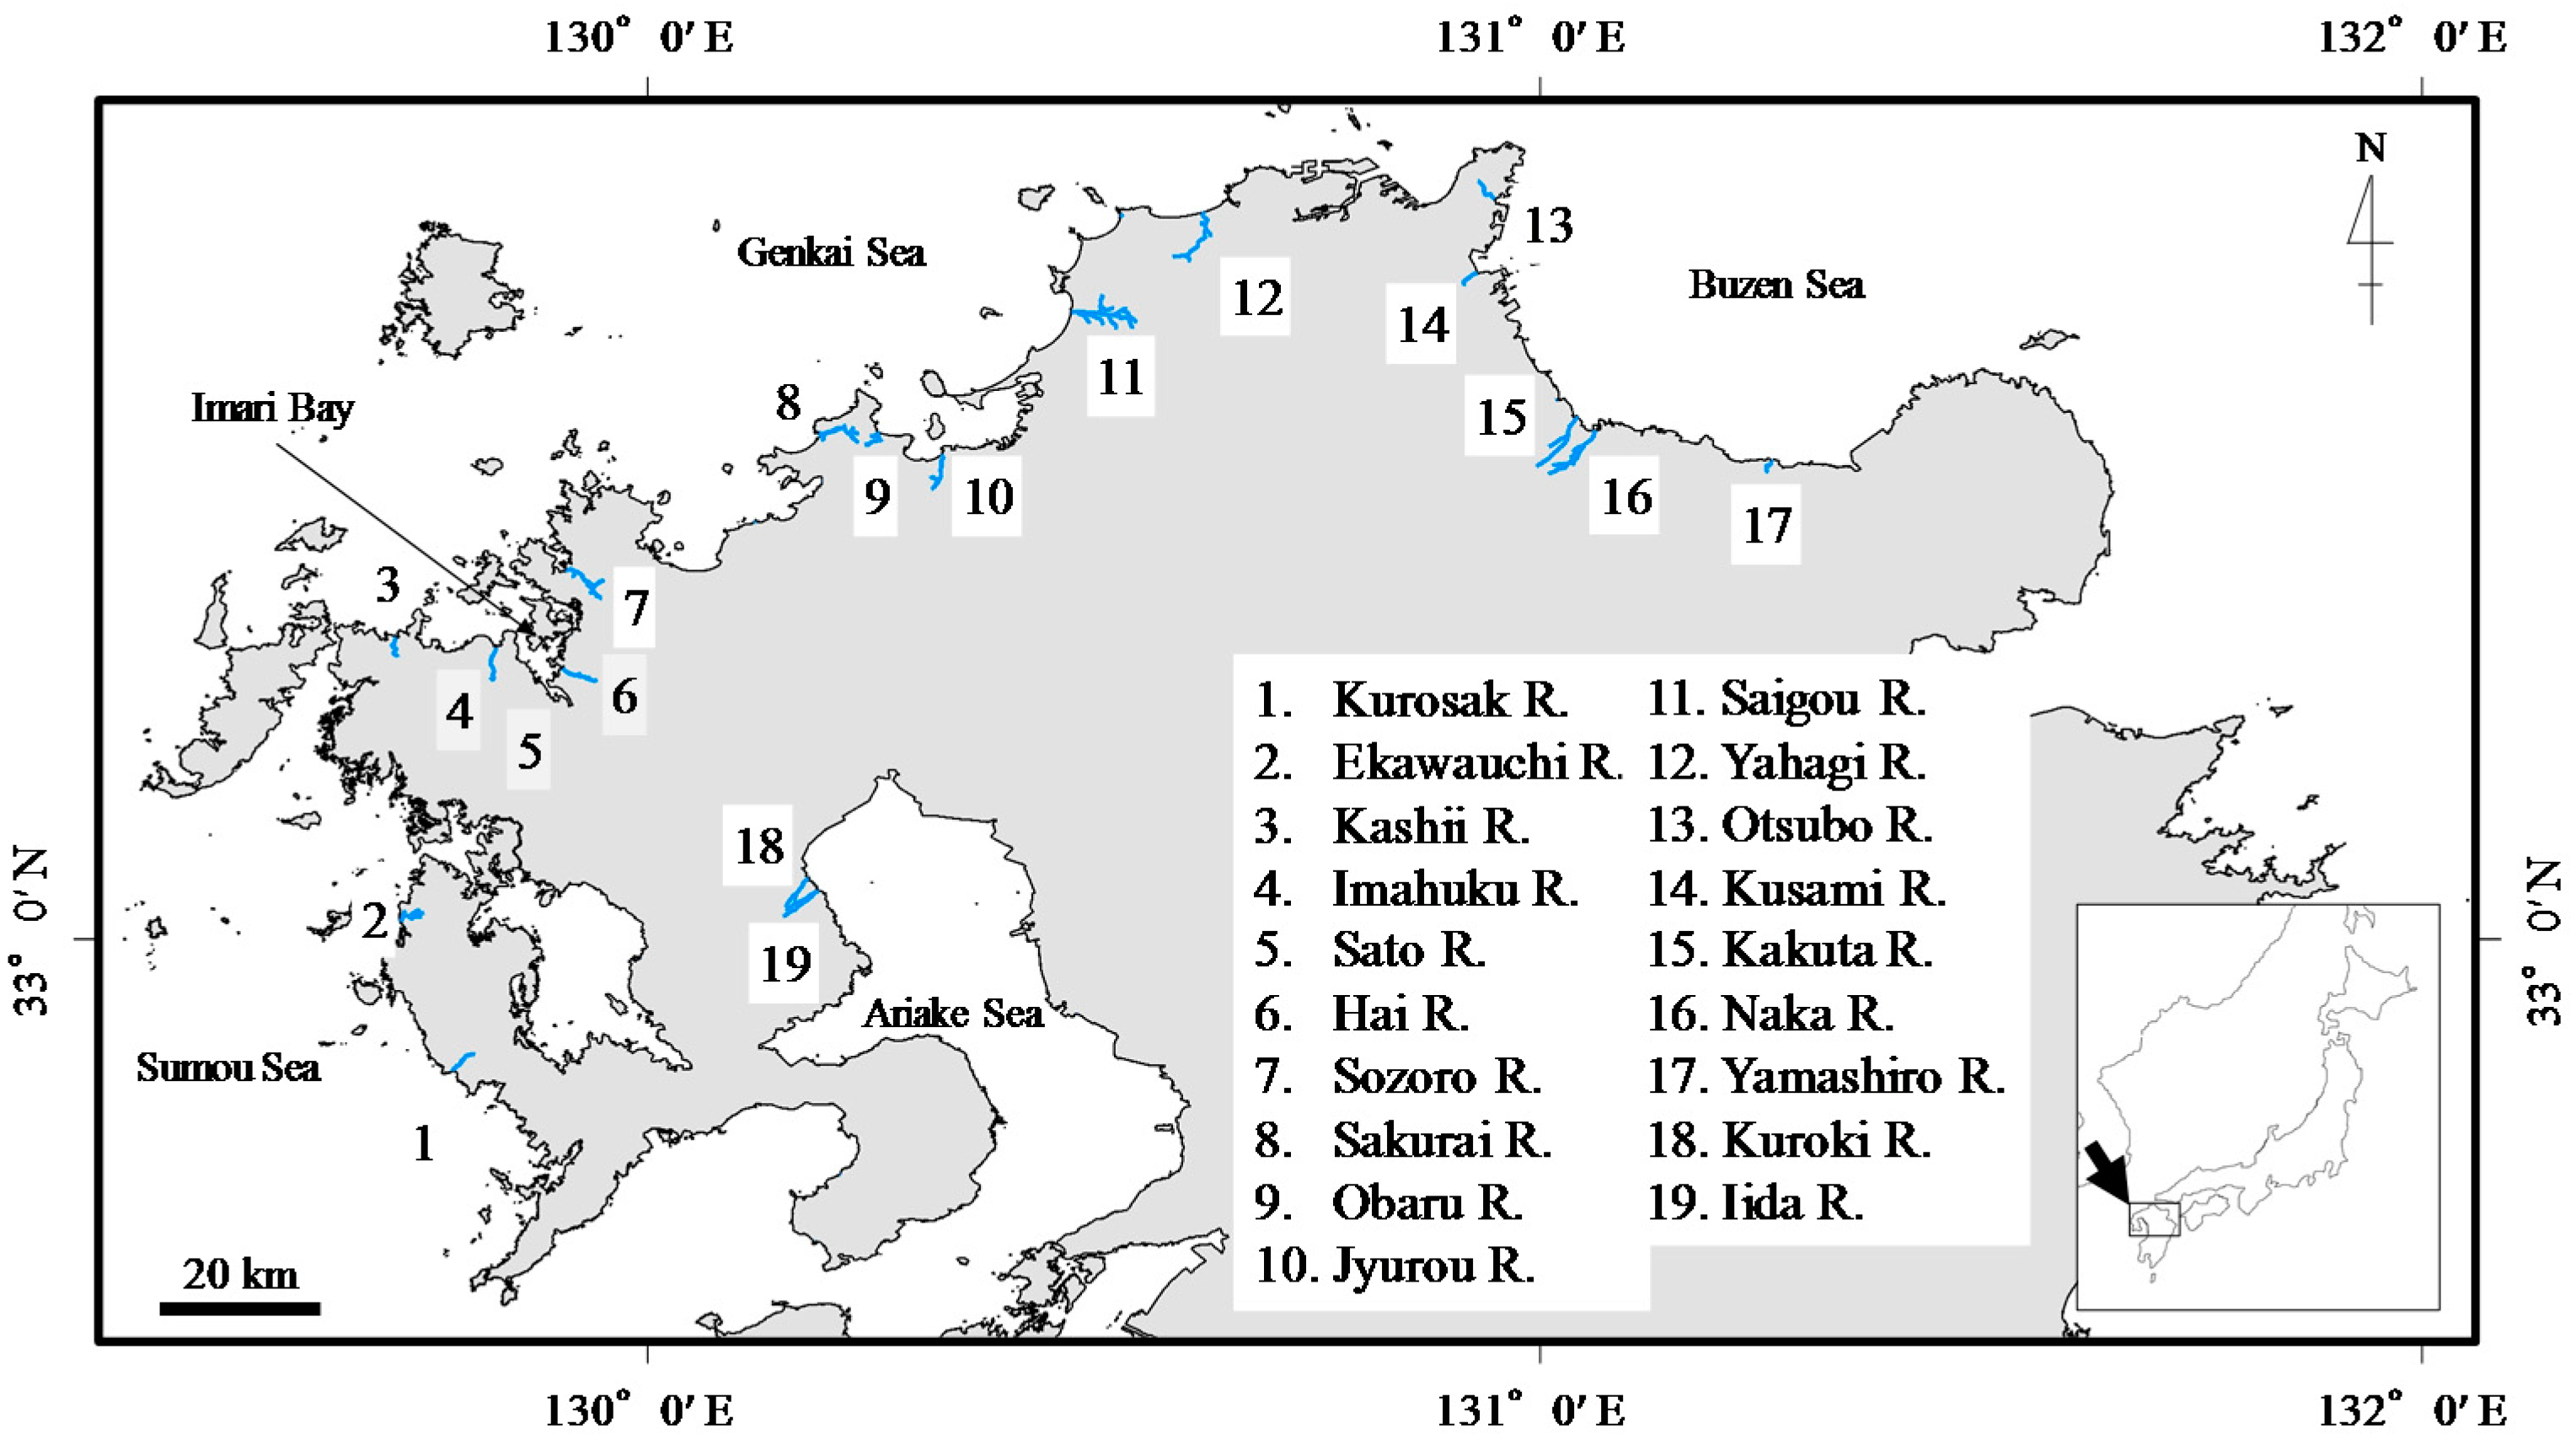
2.1. Study Area
2.2. Molluscan Fauna Data
2.3. Physical Environment Data
2.4. Calculation of Physical Indicators
2.5. Statistical Analysis
3. Results
3.1. Molluscan Fauna Survey
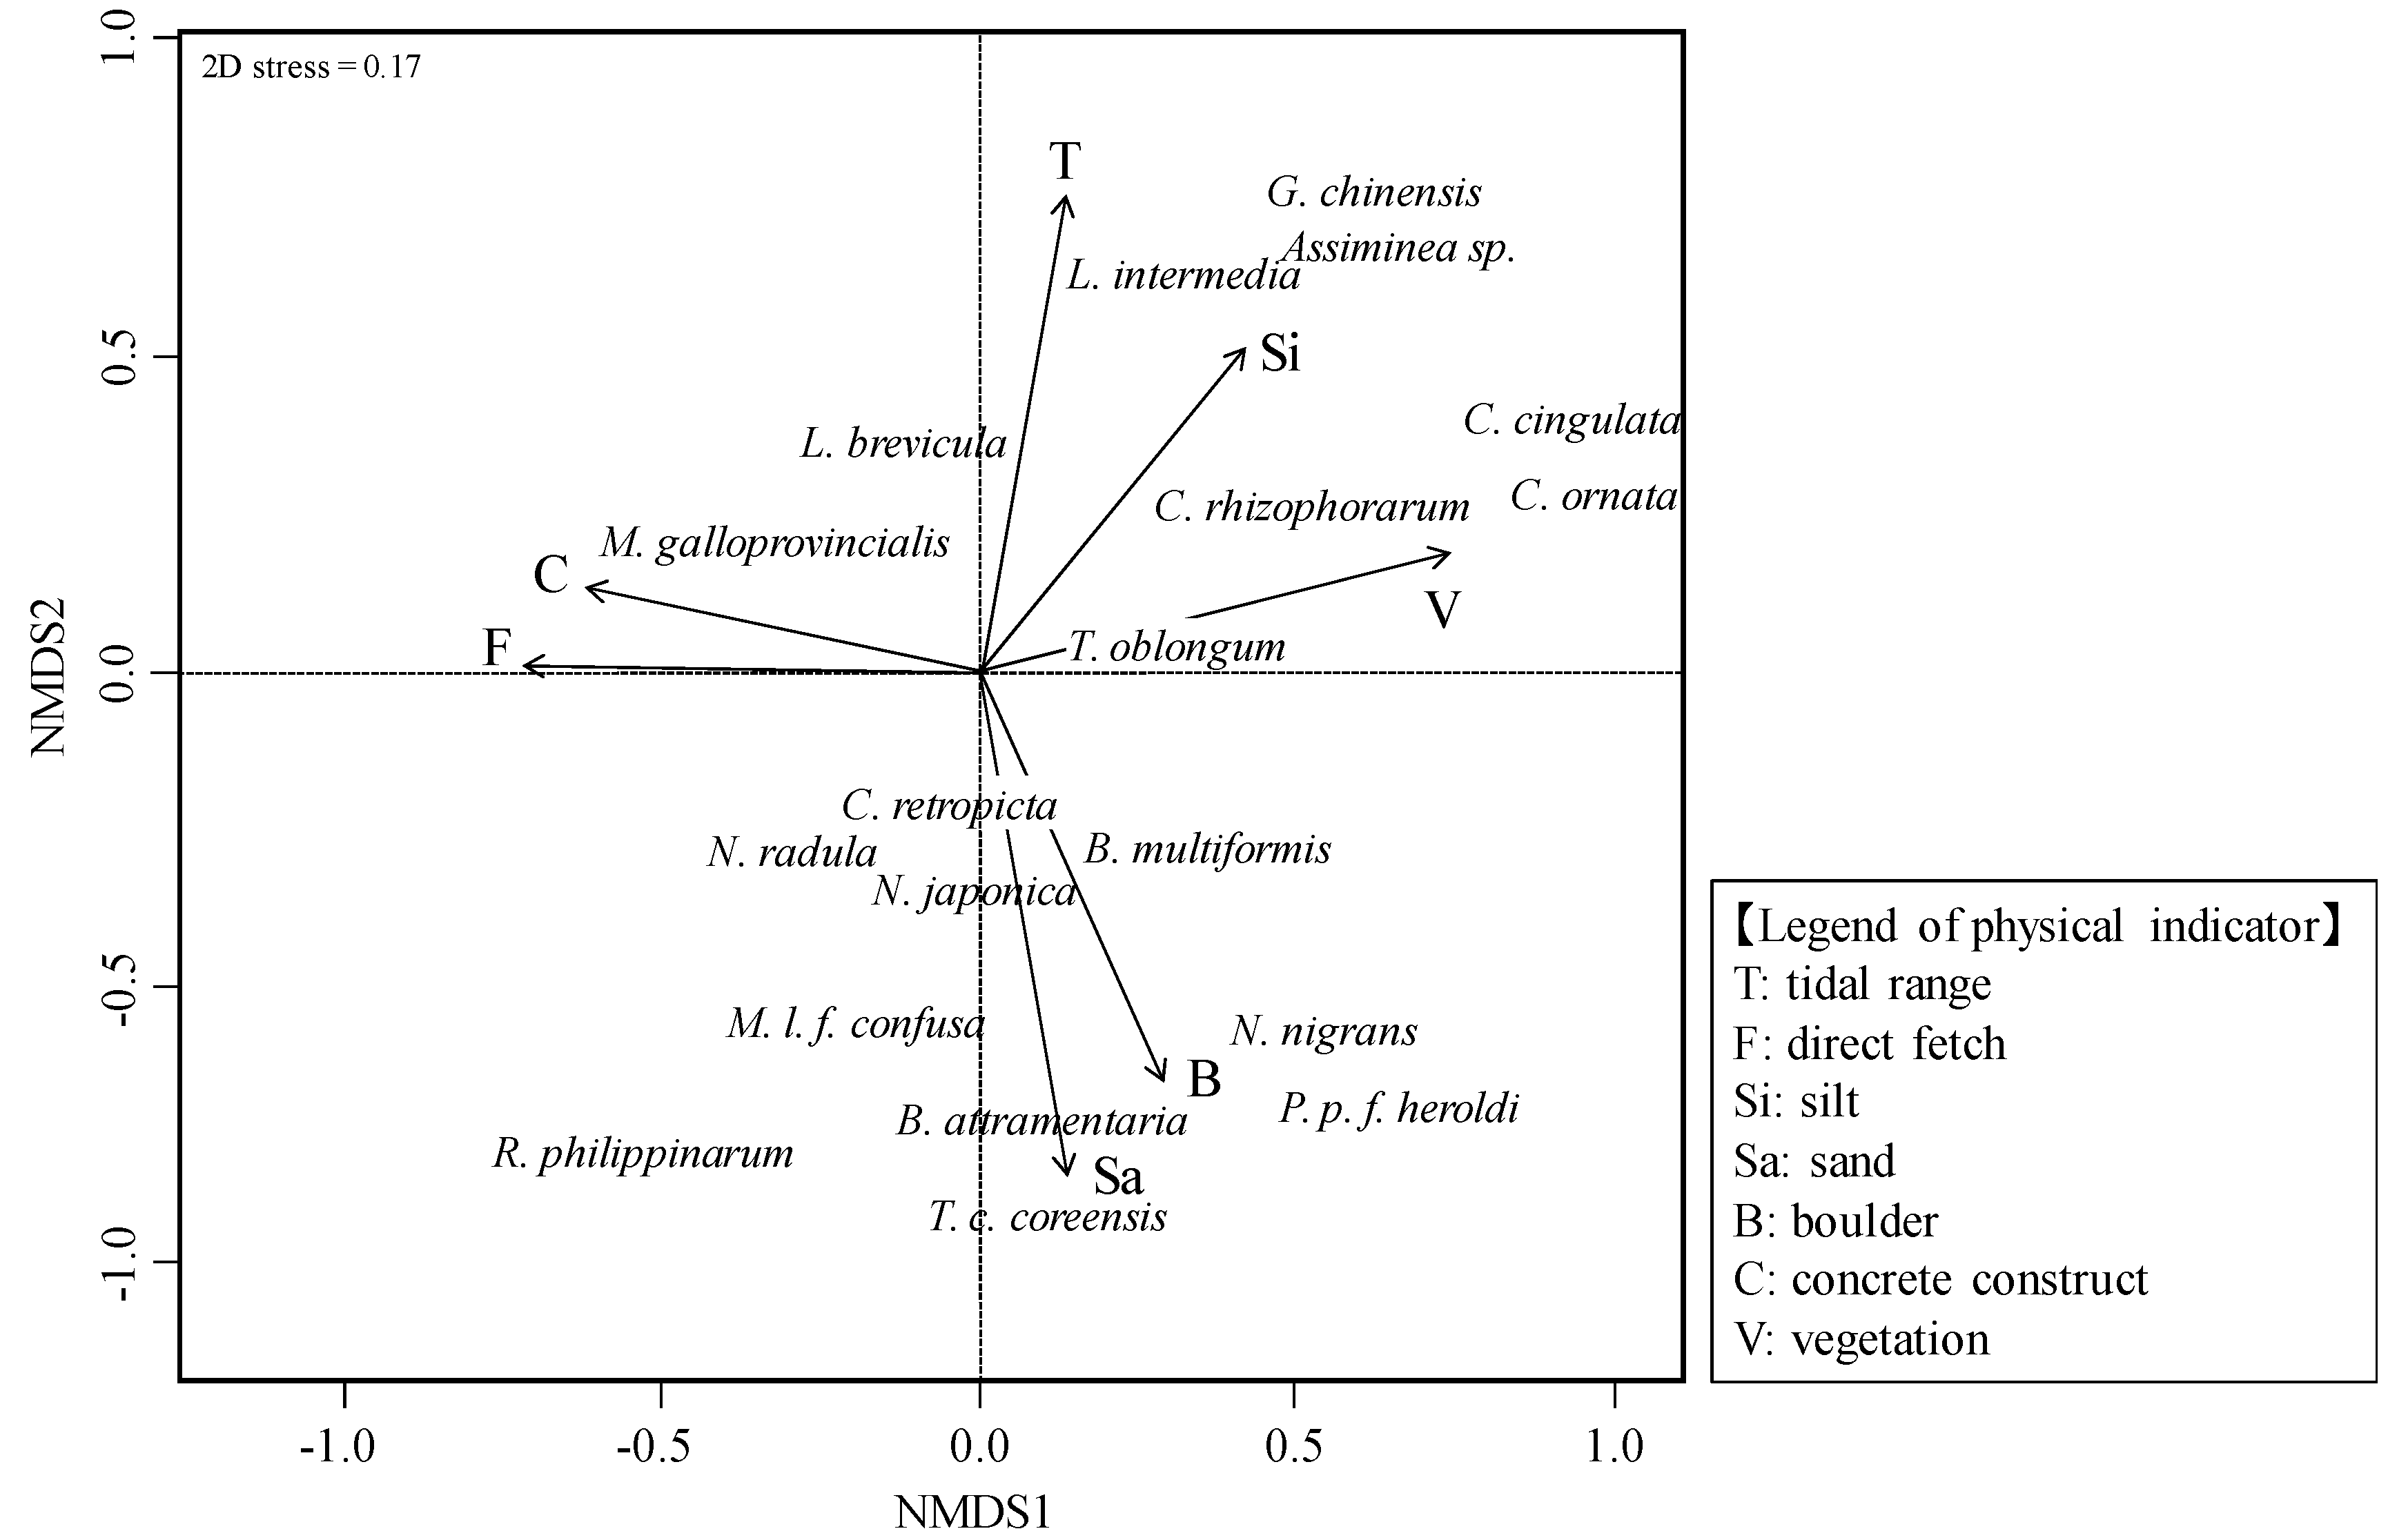
3.2. Relationship between Molluscan Fauna and Physical Indicators
3.3. River Estuary Classification Using Molluscan Fauna
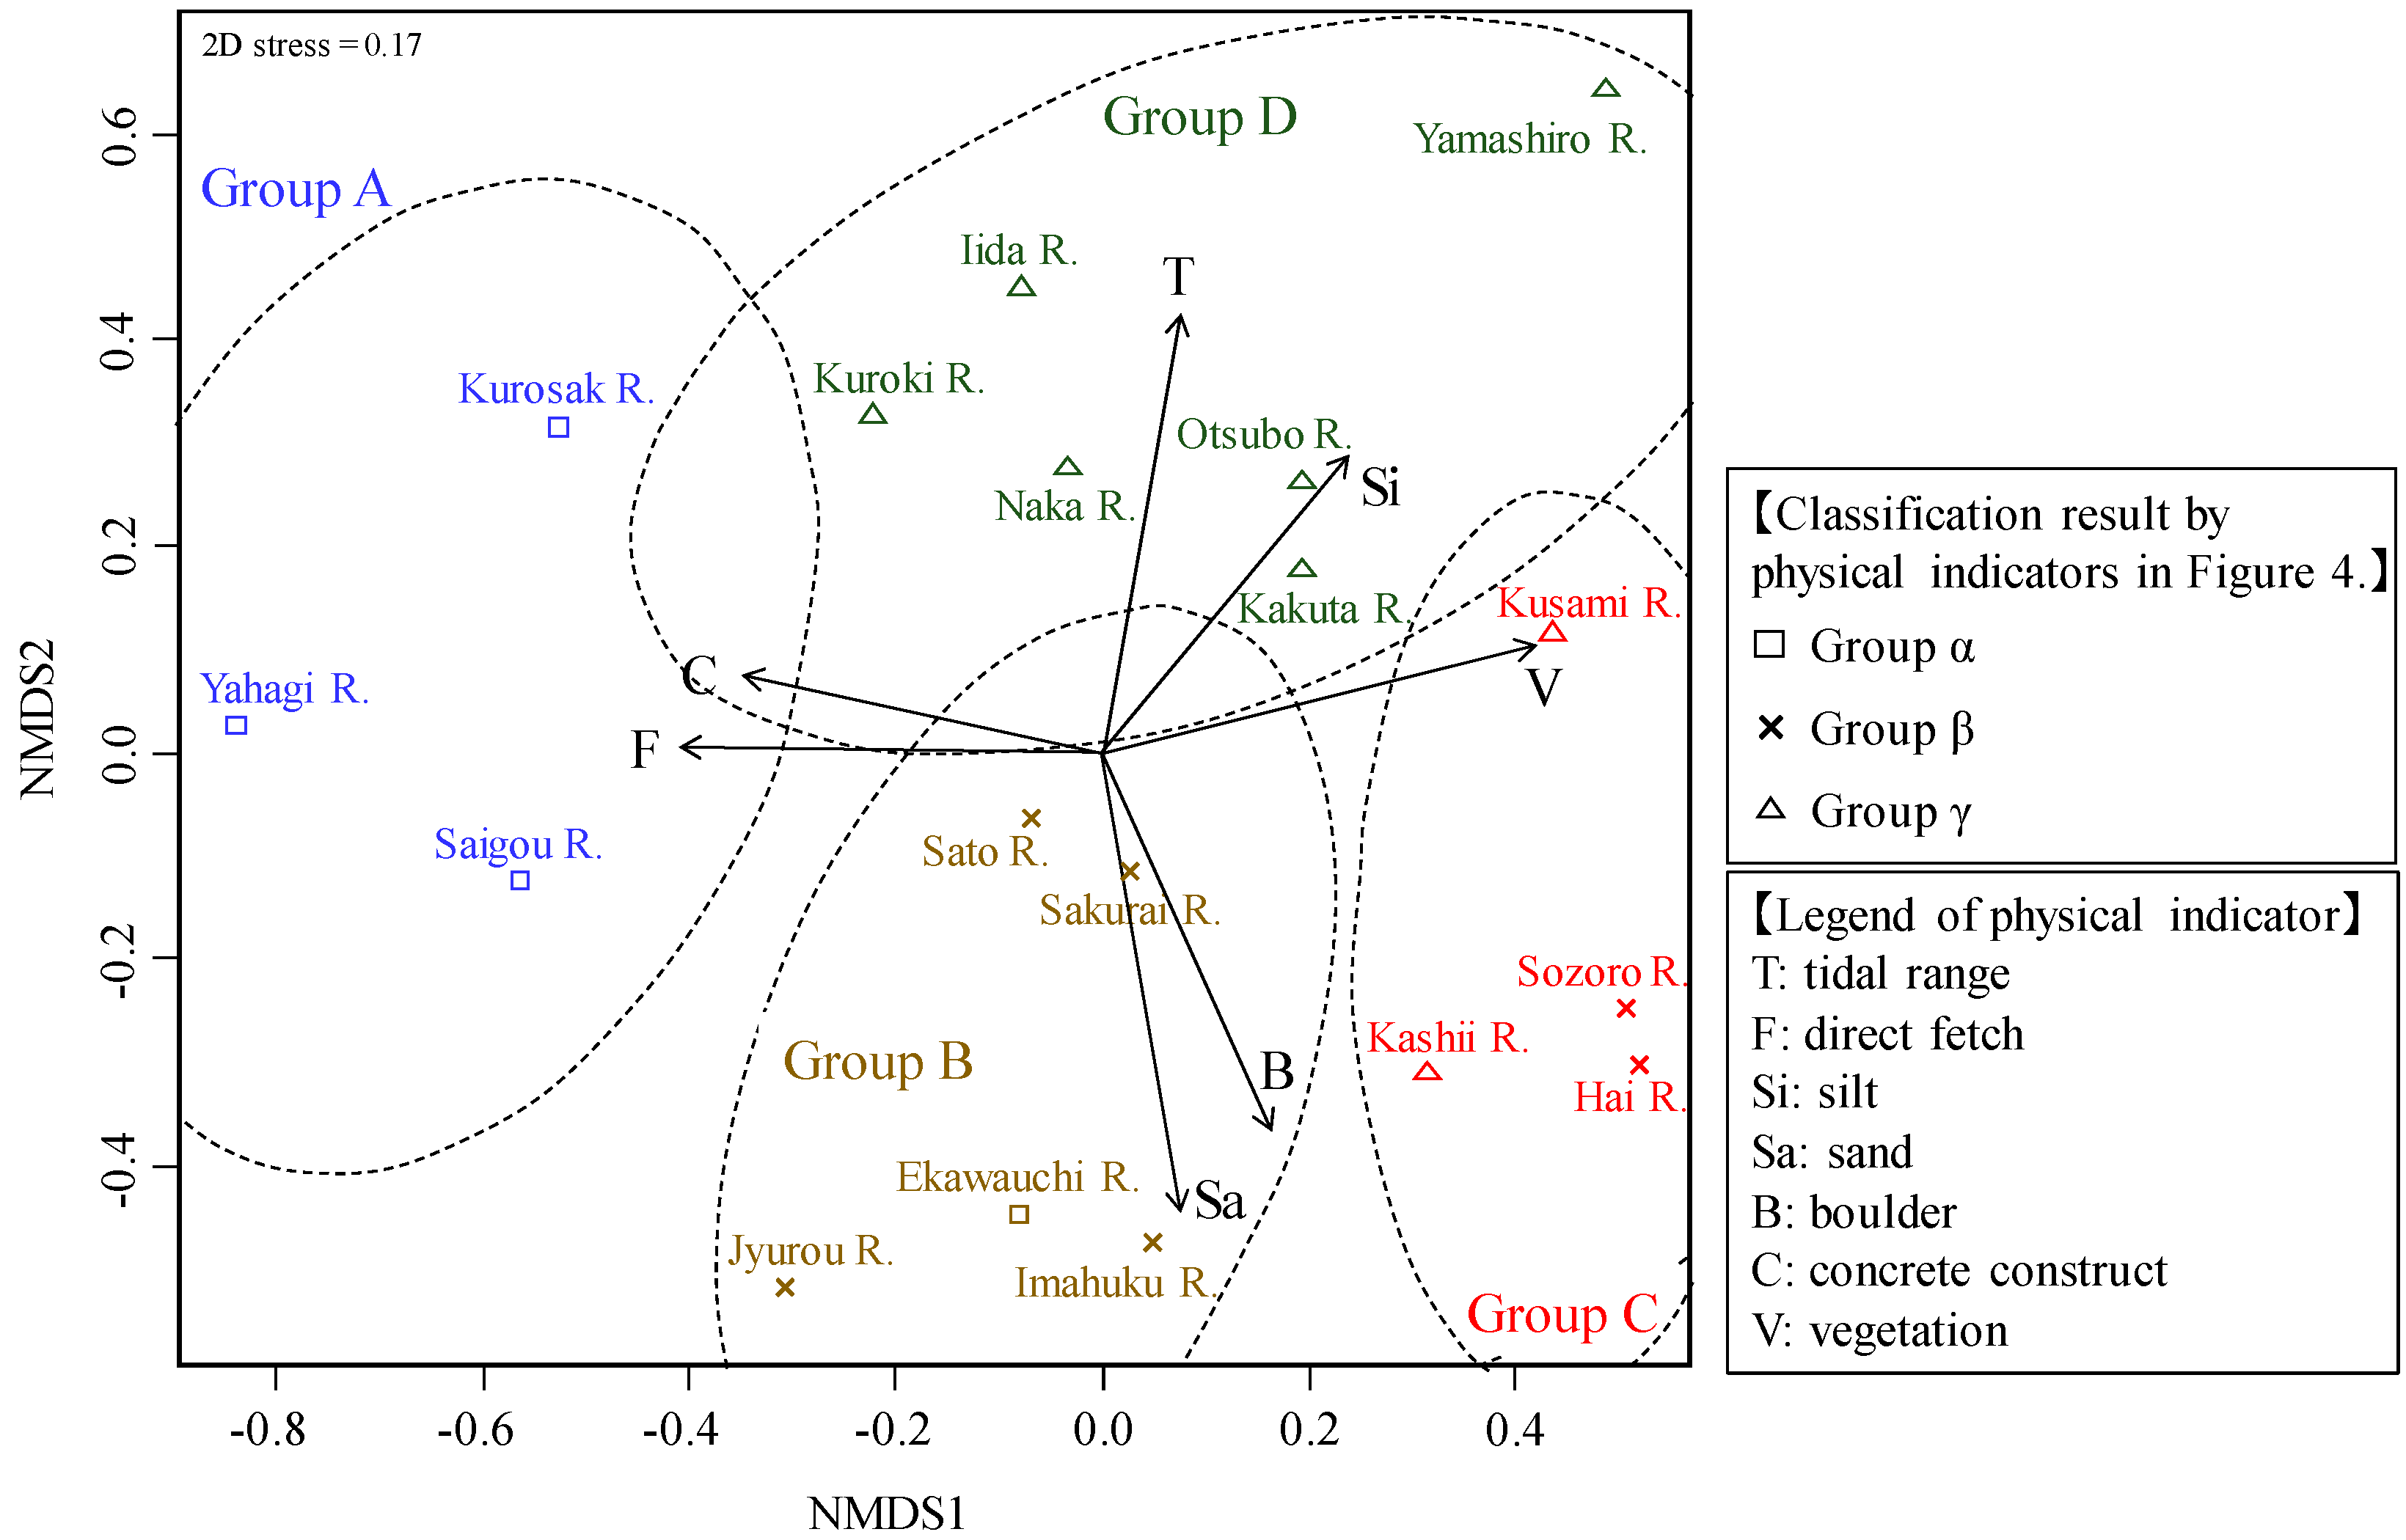
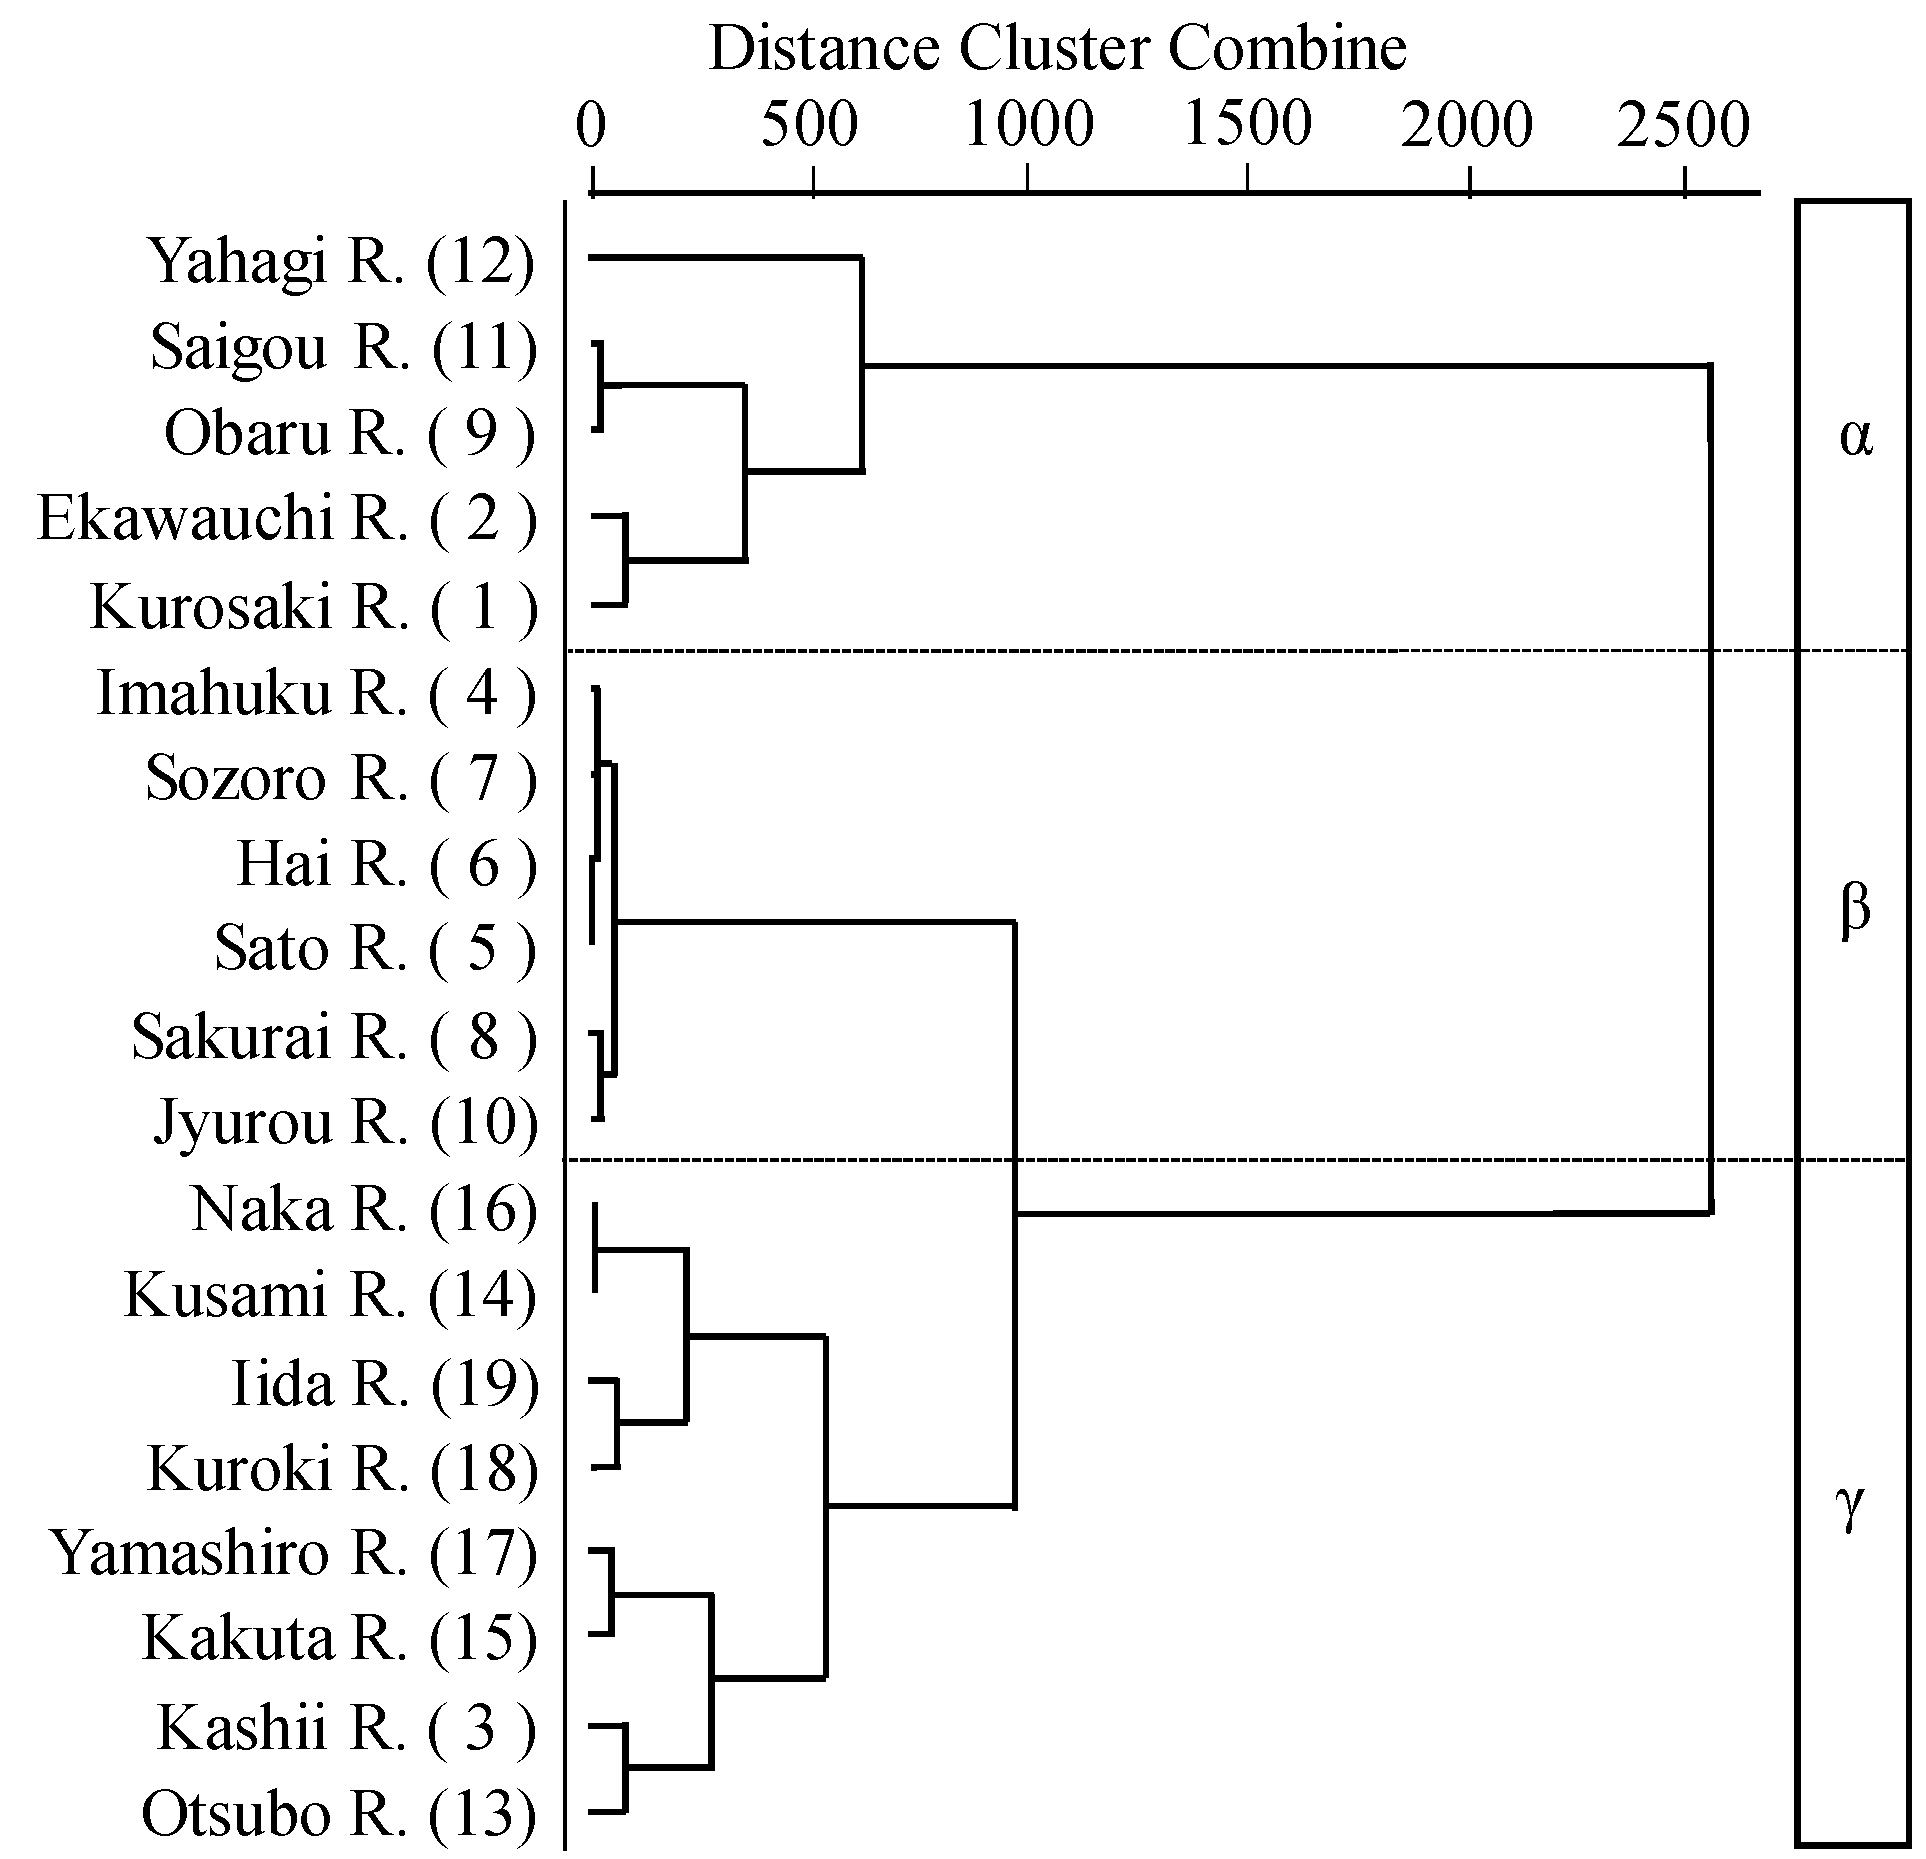
3.4. River Estuary Classification Using Physical Indicators
4. Discussion
4.1. Physical Indicators Affecting Molluscan Fauna
4.2. Comparison of the Classification Results of Molluscan Fauna and Physical Indicators
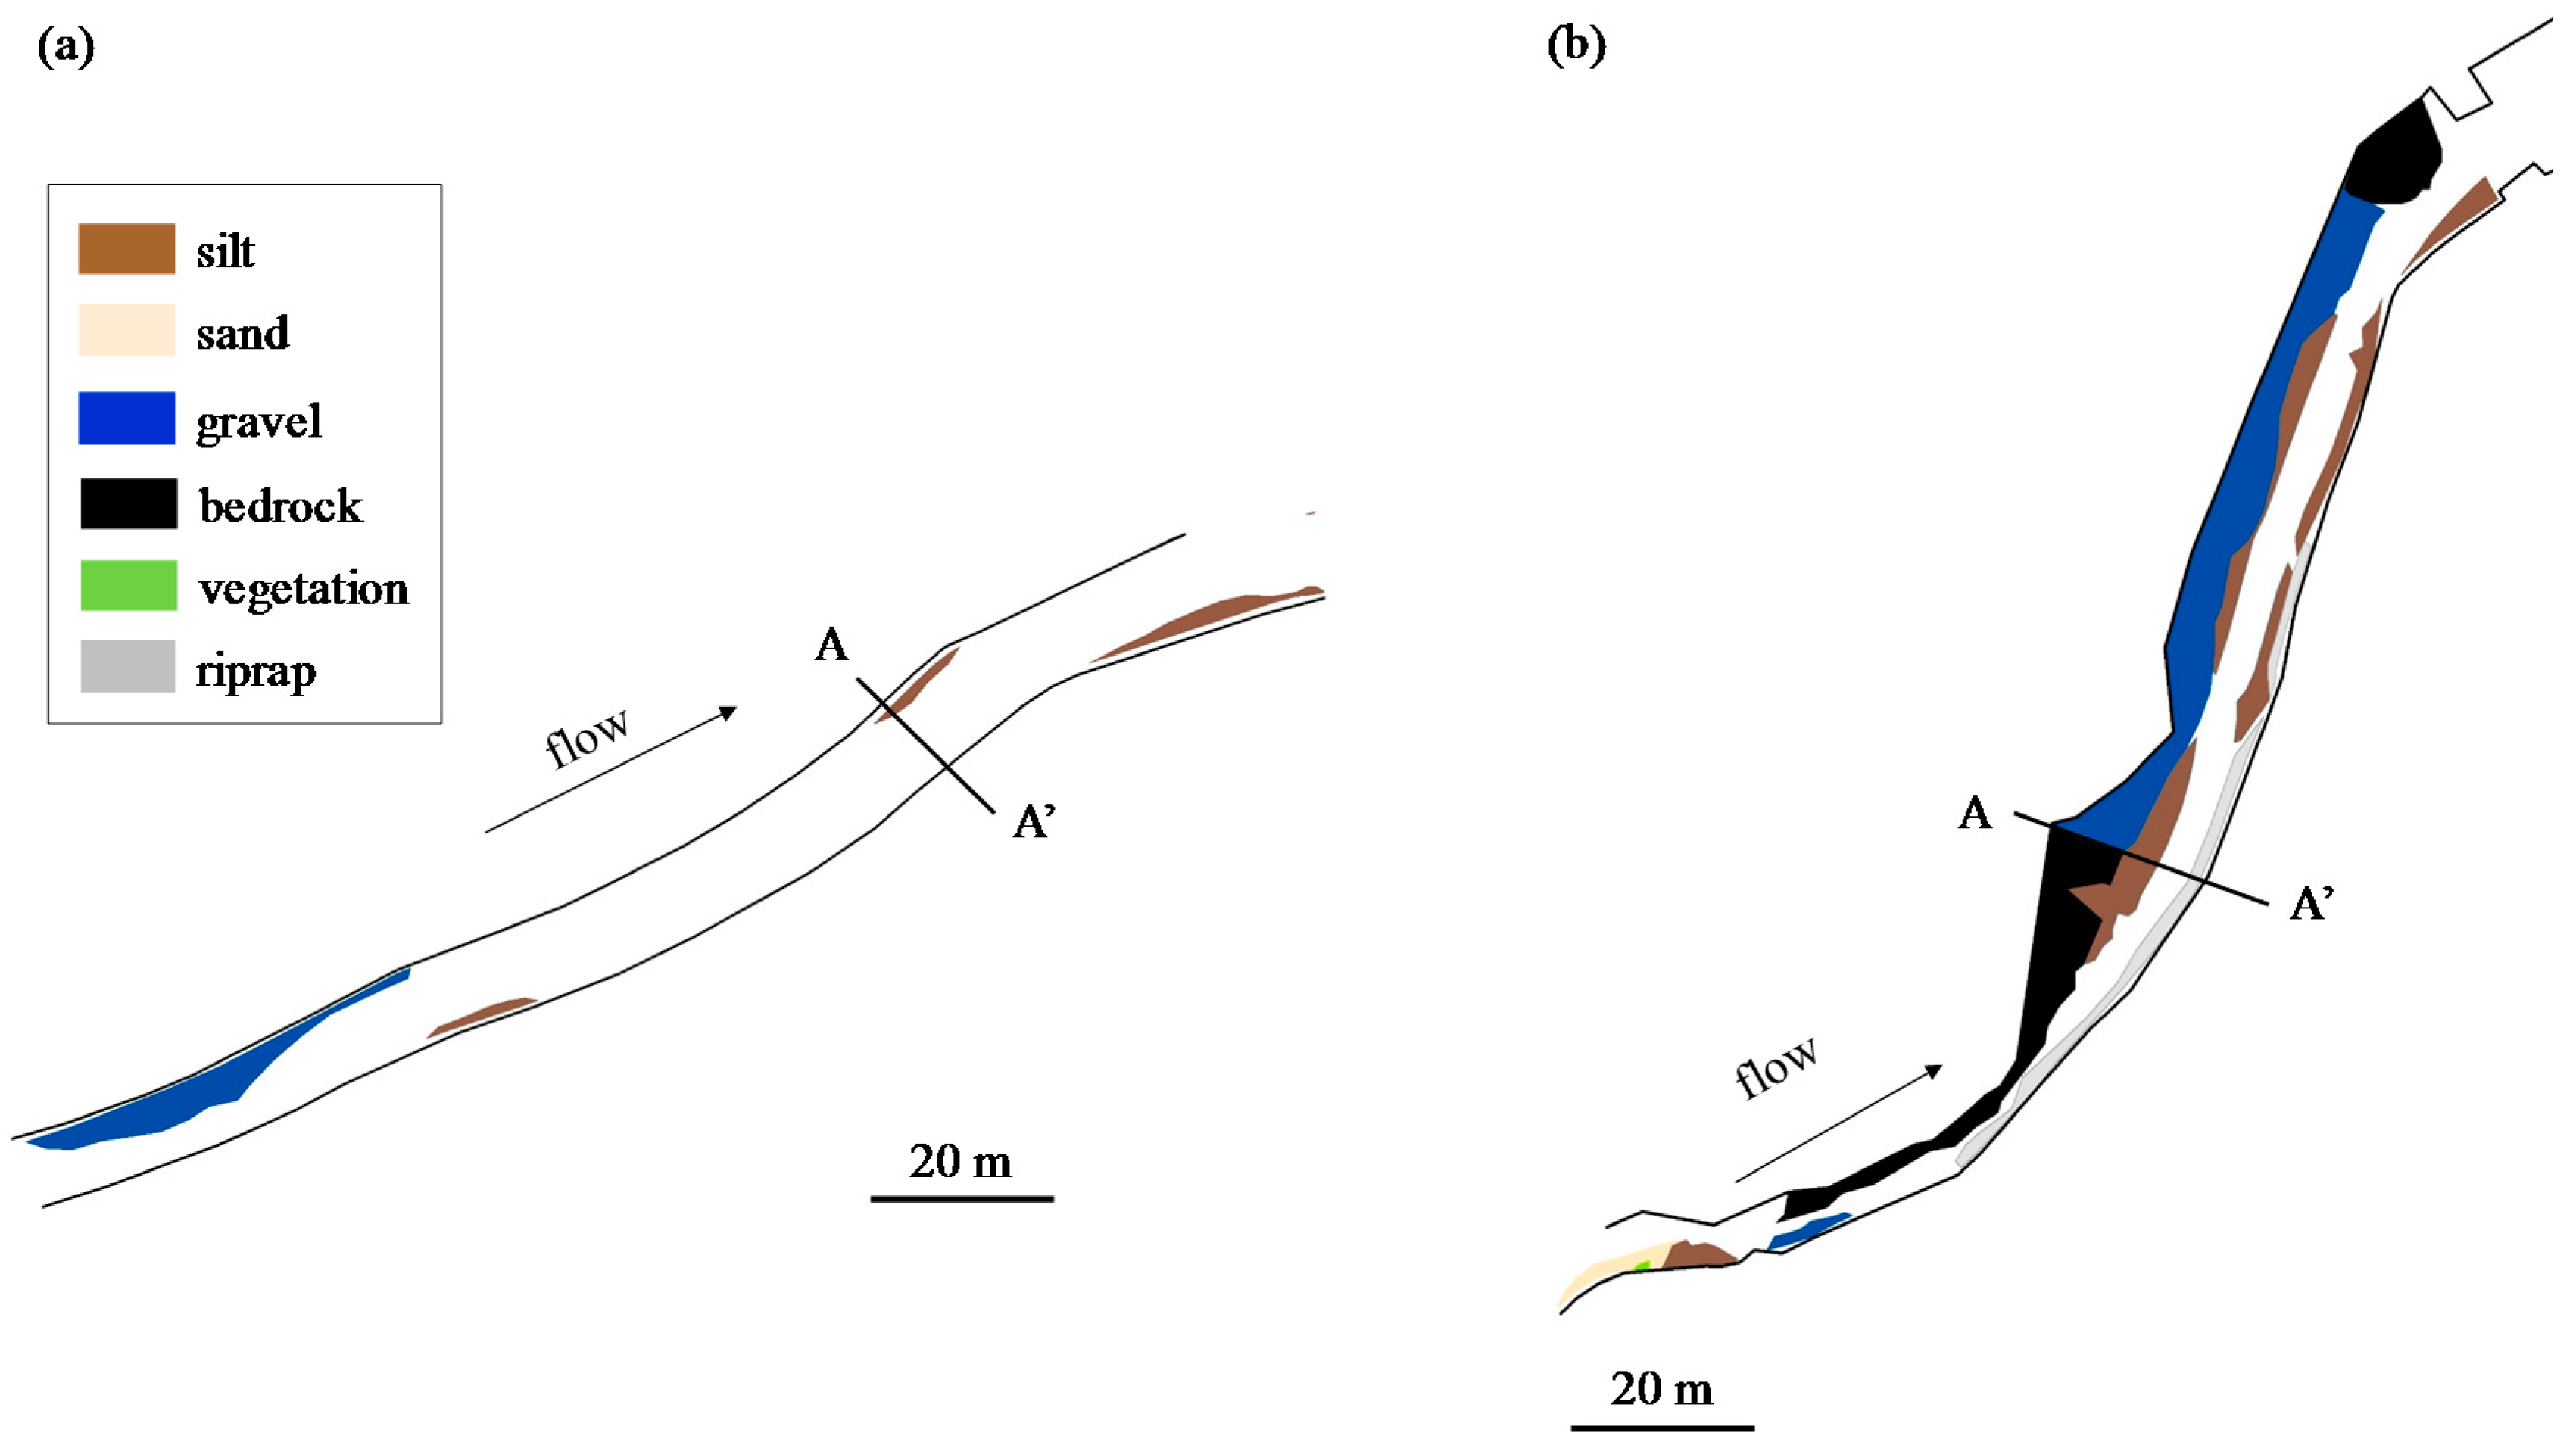
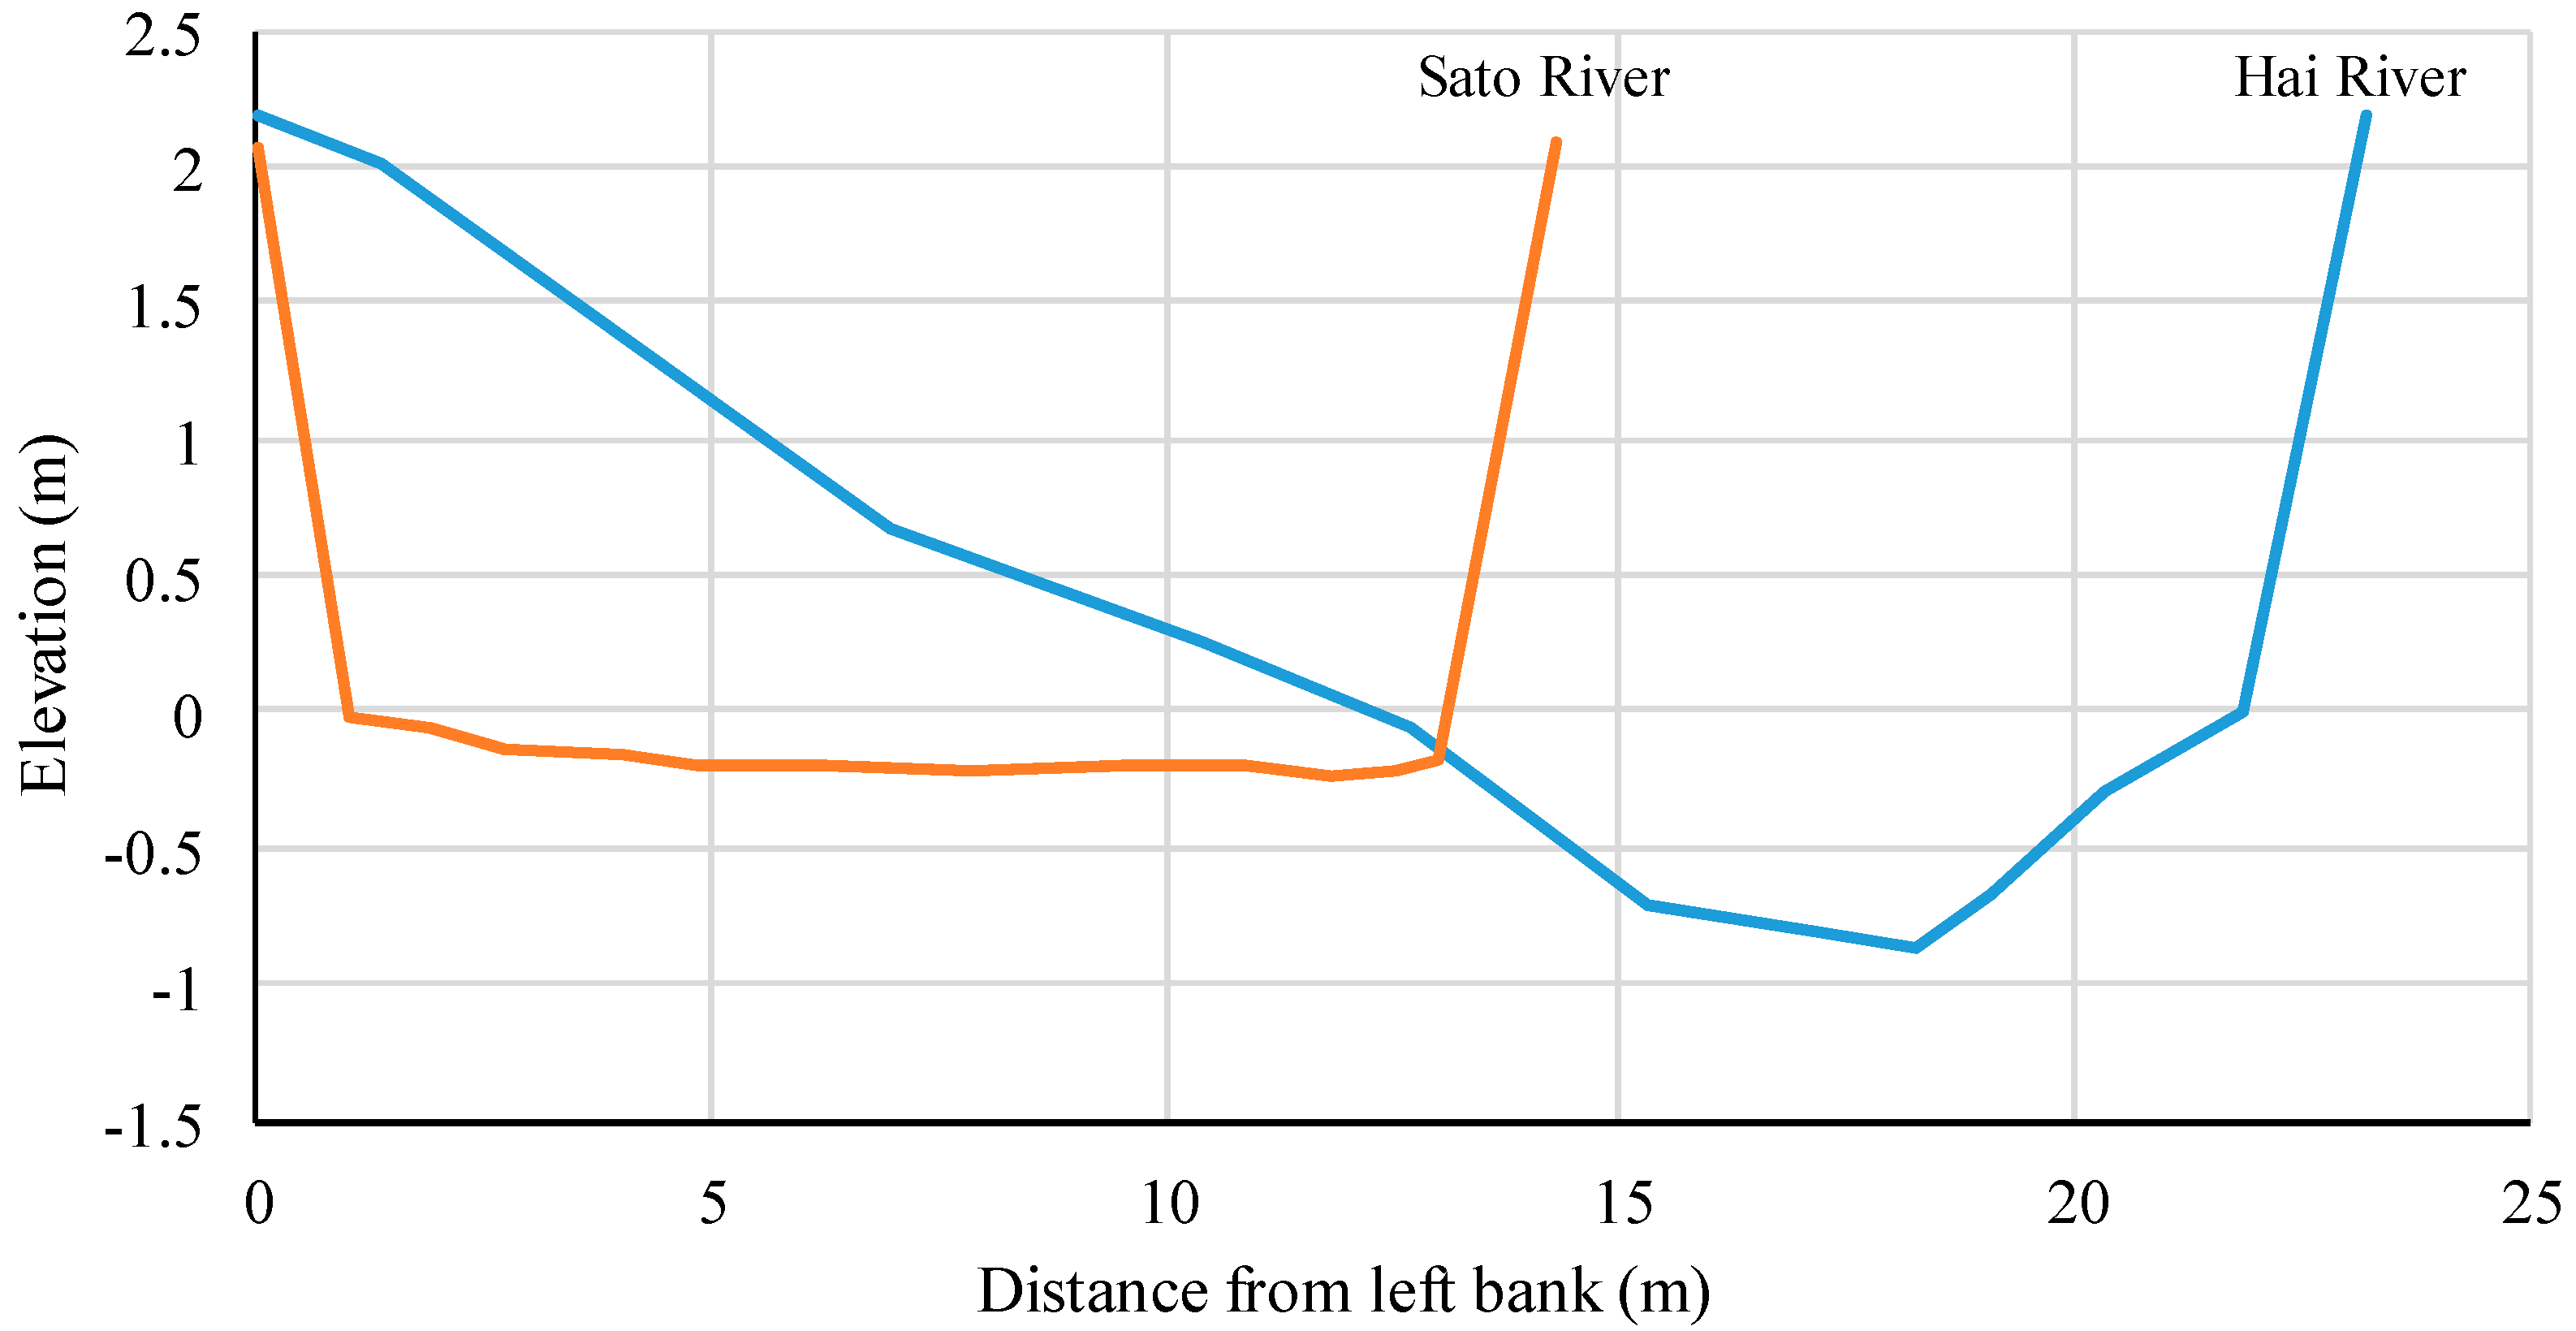
4.3. Physical Environment Degradation by Human Activities and Molluscan Fauna
5. Conclusions
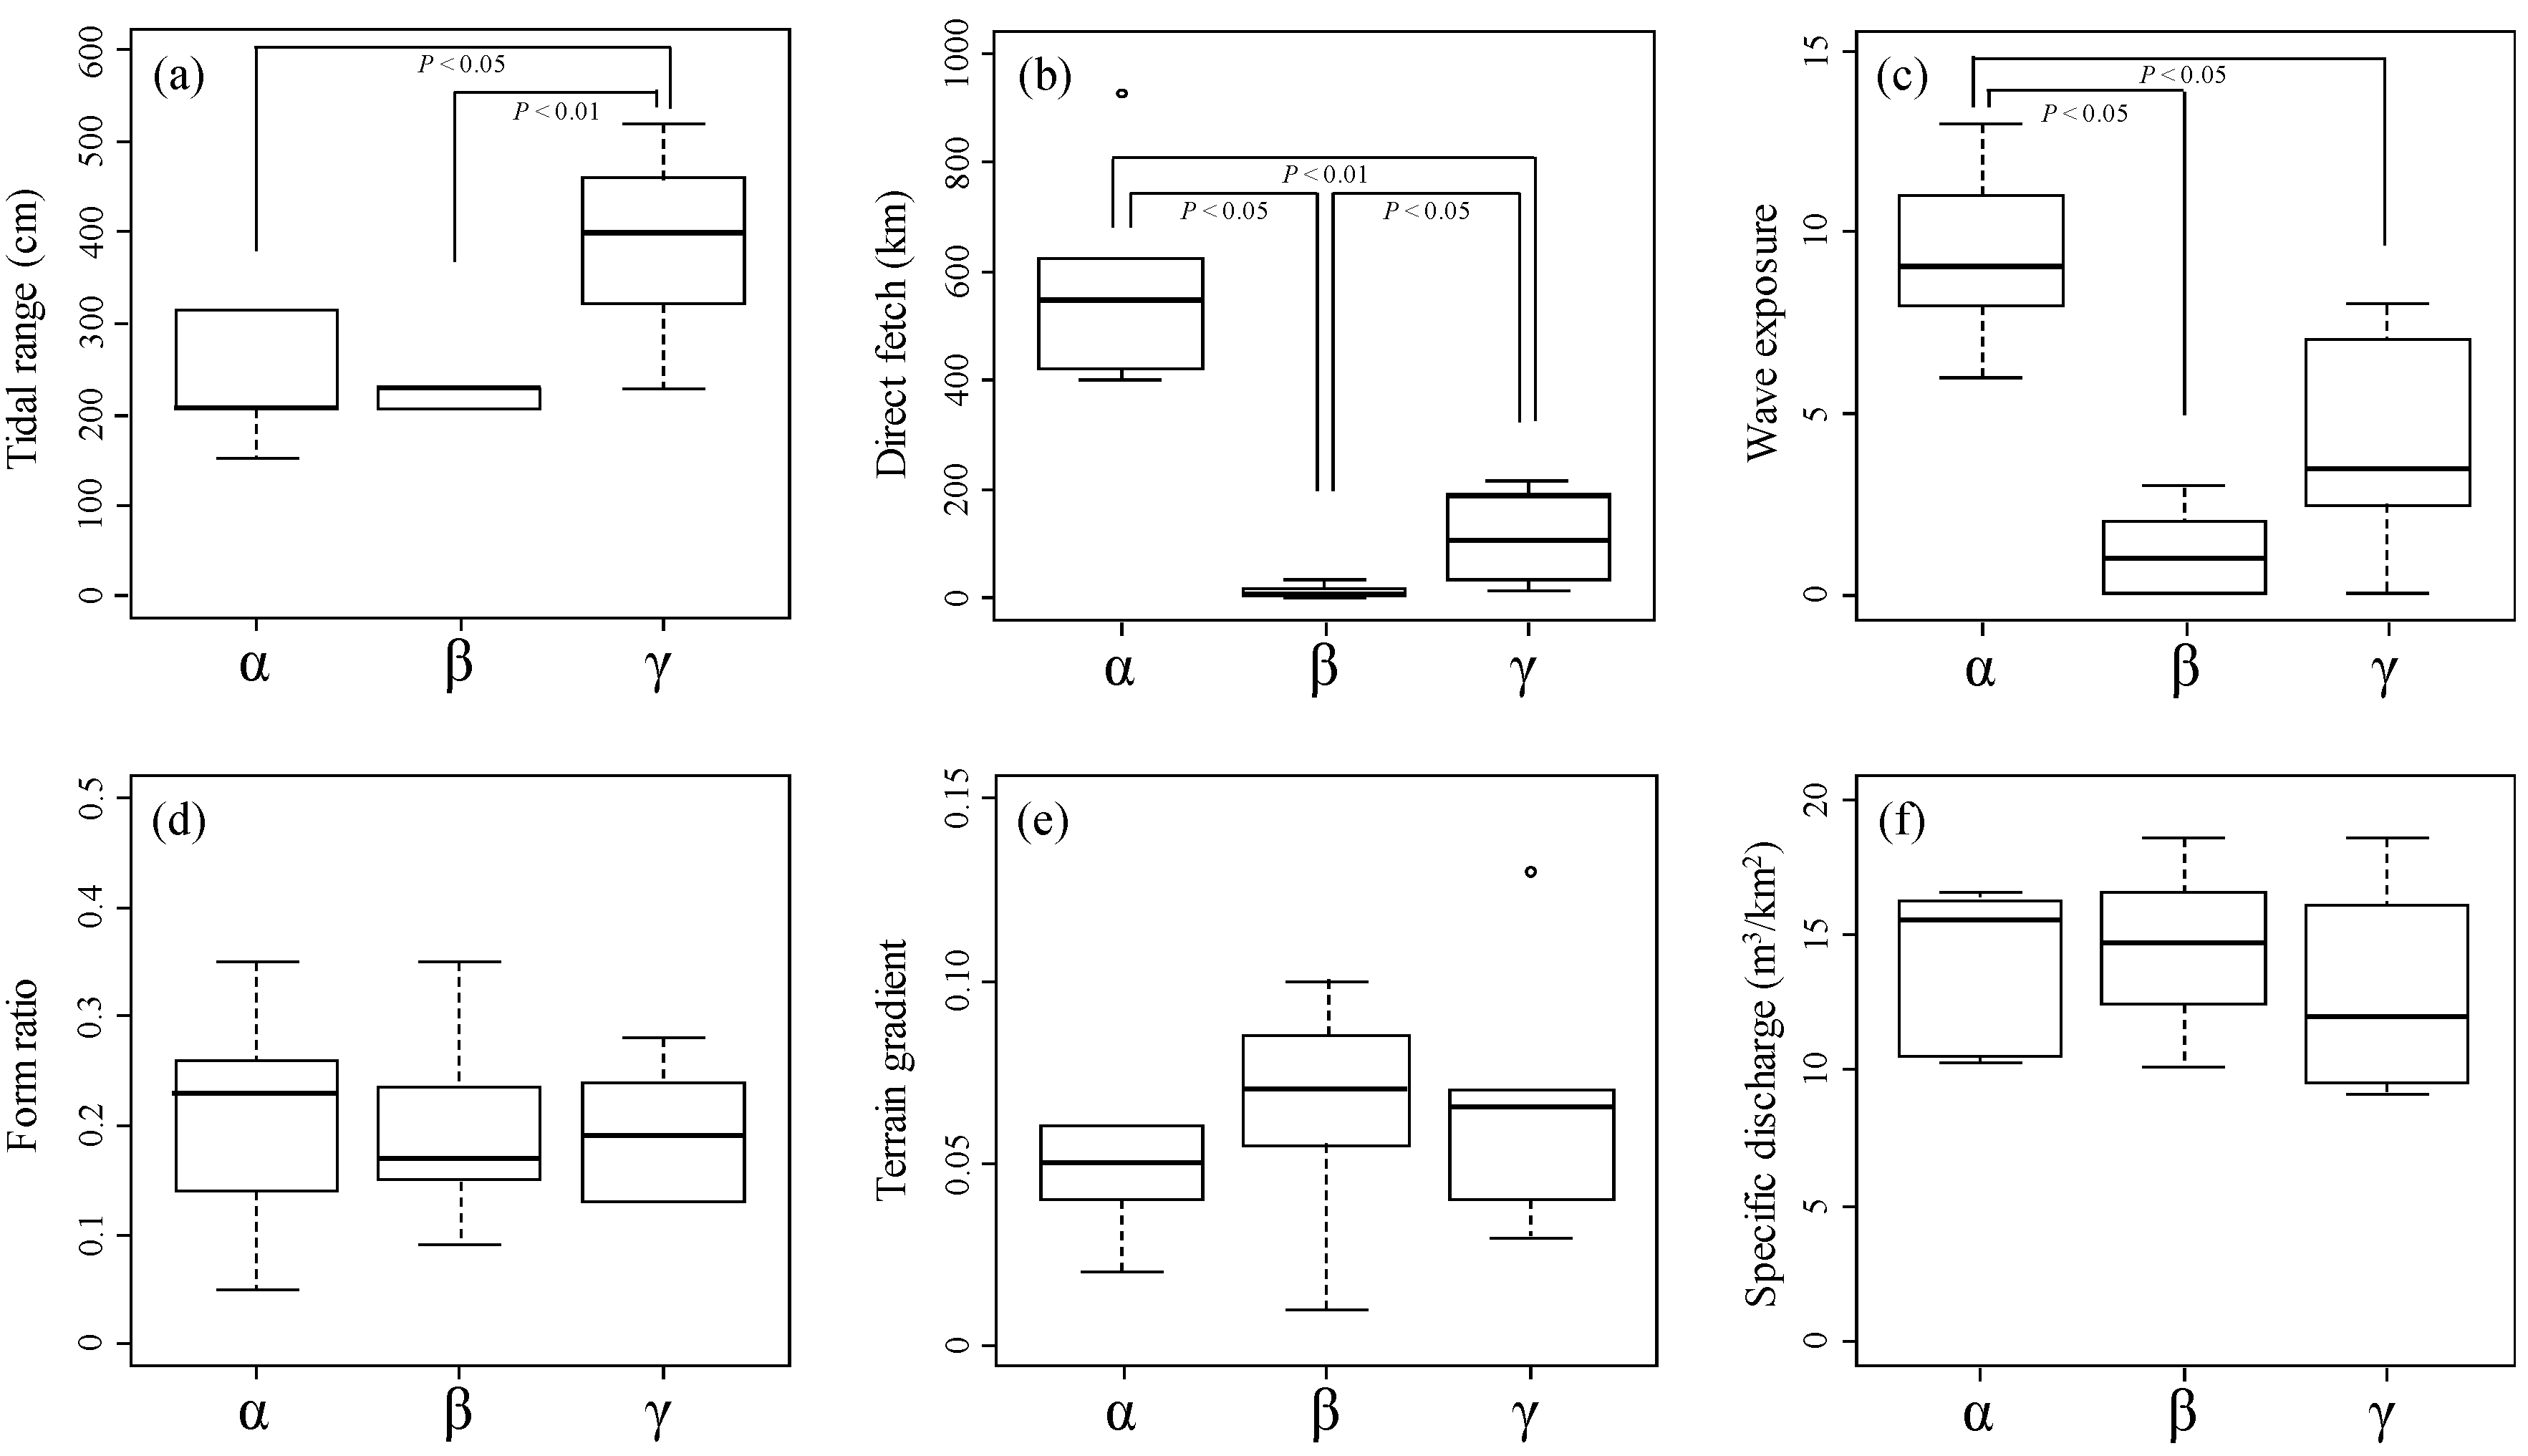
- As a result of nMDS, seven physical indicators (tidal range, direct fetch, specific discharge, silt, gravel, concrete construct, and vegetation) were selected with a strong relationship with molluscan fauna. At the watershed scale, the energy levels of the tide and waves were found to influence the molluscan fauna of a river estuary, while at the habitat scale, the factors of silt, gravel, concrete construct, and vegetation exerted this same influence.
- The classification results using physical indicators indicated three types of river estuaries (wave energy-dominated group, tide energy-dominated group, and low tide and wave energy group). This classification result was similar to the classification of molluscan fauna. Therefore, it was suggested that molluscan fauna is extremely useful as a feature representing the river estuary environment.
- From the comparison between molluscan fauna and the physical environment, some rivers were not classified into the same group as in the classification of molluscan fauna, despite them having similar physical environments. Some of these rivers with molluscan fauna that diverged from expectations had undergone channel modification, which is expected to have caused a shift in the fauna group. Comparing the classification results of the biota and the physical indicators suggested that it was possible to extract rivers with degraded biota by artificial influence.
Acknowledgments
Author Contributions
Conflicts of Interest
References
- Dyer, K.R. Estuaries, a Physical Introduction, 2nd ed.; John Wiley & Sons: Chichester, UK, 1997. [Google Scholar]
- Schröder-Adams, C.J.; Boyd, R.L.; Tran, T. Estuarine foraminiferal biofacies pattern compared to the brackish ichnofacies model: Port Stephens, southeast Australia. Estuar. Coast. Shelf Sci. 2014, 139, 78–87. [Google Scholar] [CrossRef]
- Carpenter, S.R.; Mooney, H.A.; Agard, J.; Capistrano, D.; Defries, R.S.; Diaz, S.; Dietz, T.; Duraiappah, A.K.; Oteng-Yeboah, A.; Pereira, H.M.; et al. Science for managing ecosystem services: Beyond the Millennium Ecosystem Assessment. Proc. Natl. Acad. Sci. USA 2009, 106, 1305–1312. [Google Scholar] [CrossRef] [PubMed]
- Costanza, R.; D’Arge, R.; De Groot, R.; Farber, S.; Grasso, M.; Hannon, B.; Limburg, K.; Naeem, S.; O’Neill, R.V.; Paruelo, J.; et al. The value of the world’s ecosystem services and natural capital. Nature 1997, 387, 253–260. [Google Scholar] [CrossRef]
- Edgar, G.J.; Barrett, N.S.; Graddon, D.J.; Last, P.R. The conservation significance of estuaries: A classification of Tasmanian estuaries using ecological, physical and demographic attributes as a case study. Biol. Conserv. 2000, 92, 383–397. [Google Scholar] [CrossRef]
- Cohen, A.N.; Carlton, J.T. Accelerating invasion rate in a highly invaded estuary. Science 1998, 279, 555–558. [Google Scholar] [CrossRef] [PubMed]
- Kennish, M.J. Environmental threats and environmental future of estuaries. Environ. Conserv. 2002, 29, 78–107. [Google Scholar] [CrossRef]
- Clark, R.B. Marine Pollution, 3rd ed.; Clarendon Press: Oxford, NY, USA, 1992. [Google Scholar]
- McIntyre, A.D. Human impact on the oceans: The 1990s and beyond. Mar. Pollut. Bull. 1995, 31, 147–151. [Google Scholar] [CrossRef]
- Kennish, M.J. Coastal salt marsh systems in the U.S.: A review of anthropogenic impacts. J. Coast. Res. 2001, 17, 731–748. [Google Scholar]
- Howarth, R.W. Coastal nitrogen pollution: A review of sources and trends globally and regionally. Harmful Algae 2008, 8, 14–20. [Google Scholar] [CrossRef]
- Brown, A.C.; McLachlan, A. Sandy shore ecosystems and the threats facing them: Some predictions for the year 2025. Environ. Conserv. 2002, 29, 62–77. [Google Scholar] [CrossRef]
- Borja, A.; Bricker, S.B.; Dauer, D.M.; Demetriades, N.T.; Ferreira, J.G.; Forbes, A.T.; Hutchings, P.; Jia, X.; Kenchington, R.; Marques, J.C.; et al. Overview of integrative tools and methods in assessing ecological integrity in estuarine and coastal systems worldwide. Mar. Pollut. Bull. 2008, 56, 1519–1537. [Google Scholar] [CrossRef] [PubMed]
- Diaz, R.J.; Solan, M.; Valente, R.M. A review of approaches for classifying benthic habitats and evaluating habitat quality. J. Environ. Manag. 2004, 73, 165–181. [Google Scholar] [CrossRef] [PubMed]
- Dalrymple, R.W.; Zaitlin, B.A.; Boyd, R. Estuarine facies models: Conceptual basis and stratigraphic implications. J. Sediment. Petrol. 1992, 62, 1130–1146. [Google Scholar] [CrossRef]
- Boyd, R.; Dalrymple, R.; Zaitlin, B.A. Classification of clastic coastal depositional environments. Sediment. Geol. 1992, 80, 19–150. [Google Scholar] [CrossRef]
- Heap, A.; Bryce, S.; Ryan, D.; Redke, L.; Smith, R. Australian Estuaries and Coastal Waterways: A Geoscience Perspective for Improved and Integrated Resource Management; Record 2001/07; Australian Geological Survey Organization: Canberra, Australia, 2001. [Google Scholar]
- Fairweather, P.G. Determining the ‘health’ of estuaries: Priorities for ecological research. Aust. Ecol. 1999, 24, 441–451. [Google Scholar] [CrossRef]
- Voulvoulis, N.; Arpon, K.D.; Giakoumis, T. The EU Water Framework Directive: From great expectations to problems with implementation. Sci. Total Environ. 2017, 575, 358–366. [Google Scholar] [CrossRef] [PubMed]
- Borja, A.; Elliott, M.; Andersen, J.H.; Cardoso, A.C.; Carstensen, J.; Ferreira, J.G.; Heiskanen, A.-S.; Marques, J.C.; Neto, J.M.; Teixeira, H.; et al. Good environmental status of marine ecosystems: What is it and how do we know when we have attained it? Mar. Pollut. Bull. 2013, 76, 16–27. [Google Scholar] [CrossRef] [PubMed]
- Borja, A.; Franco, J.; Pérez, V. The application of a Marine Biotic Index to different impact sources affecting soft-bottom benthic communities along European coasts. Mar. Pollut. Bull. 2000, 40, 1110–1114. [Google Scholar] [CrossRef]
- Muxika, I.; Borja, A.; Bald, J. Using historical data, expert judgement and multivariate analysis in assessing reference conditions and benthic ecological status, according to the European Water Framework Directive. Mar. Pollut. Bull. 2007, 55, 16–29. [Google Scholar] [CrossRef] [PubMed]
- Bald, J.; Borja, A.; Muxika, I.; Franco, J.; Valencia, V. Document Assessing reference conditions and physico-chemical status according to the European Water Framework Directive: A case-study from the Basque Country (Northern Spain). Mar. Pollut. Bull. 2005, 50, 1508–1522. [Google Scholar] [CrossRef] [PubMed]
- Borja, A.; Heinrich, H. Implementing the European Water Framework Directive: The debate continues. Mar. Pollut. Bull. 2005, 50, 486–488. [Google Scholar] [CrossRef] [PubMed]
- Rodríguez, J.G.; Tueros, I.; Borja, A.; Belzunce, M.J.; Franco, J.; Solaun, O.; Valencia, V.; Zuazo, A. Maximum likelihood mixture estimation to determine metal background values in estuarine and coastal sediments within the European Water Framework Directive. Sci. Total Environ. 2006, 370, 278–293. [Google Scholar] [CrossRef] [PubMed]
- Galván, C.; Juanes, J.A.; Puente, A. Ecological classification of European transitional waters in the North-East Atlantic eco-region. Estuar. Coast. Shelf Sci. 2010, 87, 442–450. [Google Scholar] [CrossRef]
- Pritchard, D.W. Salinity distribution and circulation in the Chesapeake Bay estuarine system. J. Mar. Res. 1952, 11, 106–123. [Google Scholar]
- Davies, J.H. A morphogenetic approach to world shorelines. Z. Geomorphol. 1964, 8, 127–142. [Google Scholar]
- Fairbridge, R.W. The estuary: Its definition and geodynamic cycle. In Chemistry and Biogeochemistry of Estuaries; Wiley: New York, NY, USA, 1980; pp. 1–35. [Google Scholar]
- Harrison, T.D.; Whitfield, A.K. Estuarine typology and the structuring of fish communities in South Africa. Environ. Biol. Fishes 2006, 75, 269–293. [Google Scholar] [CrossRef]
- Harrison, T.D.; Whitfield, A.K. Geographical and typological changes in fish guilds of South African estuaries. J. Fish Biol. 2008, 73, 2542–2570. [Google Scholar] [CrossRef]
- Harrison, T.D.; Whitfield, A.K. Fish trophic structure in estuaries, with particular emphasis on estuarine typology and zoogeography. J. Fish Biol. 2012, 81, 2005–2029. [Google Scholar] [CrossRef] [PubMed]
- Cooper, J.A.G.; Ramm, A.E.L.; Harrison, T.D. The estuarine health index: A new approach to scientific information transfer. Ocean Coast. Manag. 1994, 25, 103–141. [Google Scholar] [CrossRef]
- Whitfield, A.K. An estuary-association classification for the fishes of southern Africa. S. Afr. J. Sci. 1994, 90, 441–447. [Google Scholar]
- Colloty, B.M.; Adams, J.B.; Bate, G.C. Classification of estuaries in the Ciskei and Transkei regions based on physical and botanical characteristics. S. Afr. J. Bot. 2002, 68, 312–321. [Google Scholar] [CrossRef]
- Sato, S. Report on Four Academic Societies Joint Symposium of Biodiversity Conservation of Ariake Bay. Jpn. J. Benthol. 2011, 66, 102–116. [Google Scholar] [CrossRef]
- Blanchet, H.; Gouillieux, B.; Alizier, S.; Amouroux, J.-M.; Bachelet, G.; Barillé, A.-L.; Dauvin, J.-C.; de Montaudouin, X.; Derolez, V.; Desroy, N.; et al. Multiscale patterns in the diversity and organization of benthic intertidal fauna among French Atlantic estuaries. J. Sea Res. 2014, 90, 95–110. [Google Scholar] [CrossRef]
- Zenetos, A. Classification and interpretation of the established Mediterranean biocoenoses based solely on bivalve molluscs. J. Mar. Biol. Assoc. UK 1996, 76, 403–416. [Google Scholar] [CrossRef]
- Koutsoubas, D.; Dounas, C.; Arvanitidis, C.; Kornilios, S.; Petihakis, G.; Triantafyllou, G.; Eleftheriou, A. Macrobenthic community structure and disturbance assessment in Gialova Lagoon, Ionian Sea. ICES J. Mar. Sci. 2000, 57, 1472–1480. [Google Scholar] [CrossRef]
- Kusuda, T.; Yamamoto, K. River Brackish Area; Gihodo Shuppan: Tokyo, Japan, 2008. [Google Scholar]
- Japanese Geotechnical Society. Japanese Geotechnical Society Standards Laboratory Testing Standards of Geomaterials; Japanese Geotechnical Society: Tokyo, Japan, 2014; Volume 1. [Google Scholar]
- Baardseth, E. A Square Scanning, Two Stage Sampling Method of Estimating Sea Weed Quantities; Norskinstitutt for Tang-Ogtareforskning; Tapir: Oslo, Norway, 1970; Volume 33, pp. 1–41. [Google Scholar]
- Ruuskanen, A.; Bäck, S.; Reitalu, T. A Comparison of Two Cartographic Exposure Methods Using Fucusvesicu-losus as an Indicator. Mar. Biol. 1999, 134, 139–145. [Google Scholar] [CrossRef]
- Keddy, P.A. Quantifying a within-lake gradient of wave energy in Gillfillan Lake, Nova Scotia. Can. J. Bot. 1982, 62, 301–309. [Google Scholar] [CrossRef]
- Burrows, M.; Harvey, R.; Robb, L. Wave Exposure Indices from Digital Coastlines and the Prediction of Rocky Shore Community Structure. Mar. Ecol.-Prog. Ser. 2008, 353, 1–12. [Google Scholar] [CrossRef]
- Dufrêne, M.; Legendre, P. Species assemblages and indicator species: The need for a flexible asymmetrical ap-proach. Ecol. Monogr. 1997, 67, 345–366. [Google Scholar] [CrossRef]
- Vermeiren, P.; Sheaves, M. Predicting habitat associations of five intertidal crab species among estuaries. Estuar. Coast. Shelf Sci. 2014, 149, 133–142. [Google Scholar] [CrossRef]
- Bancroft, G.T.; Gawlik, D.E.; Rutchey, K. Distribution of wading birds relative to vegetation and water depths in the northern Everglades of Florida, USA. Waterbirds 2002, 25, 265–277. [Google Scholar] [CrossRef]
- Kobayashi, S. Distribution pattern and ecology of brachyuran crabs in the riverine environment: Their significance in the ecosystem and present condition. Ecol. Civil Eng. 2000, 3, 113–130. [Google Scholar] [CrossRef]
- Ke, C.-Q.; Zhang, D.; Wang, F.-Q.; Chen, S.-X.; Schmullius, C.; Boerner, W.-M.; Wang, H. Analyzing coastal wetland change in the Yancheng National Nature Reserve, China. Reg. Environ. Chang. 2011, 11, 161–173. [Google Scholar] [CrossRef]
- Zuo, P.; Wan, S.W.; Qin, P.; Du, J.J.; Wang, H. A comparison of the sustainability of original and constructed wetlands in Yancheng Biosphere Reserve, China: Implications from emergy evaluation. Environ. Sci. Policy 2004, 7, 329–343. [Google Scholar] [CrossRef]
- Weinstein, M.P.; Balletto, J.H. Does the common reed, Phragmites australis reduce essential habitat for fishes? Estuaries 1999, 22, 793–802. [Google Scholar] [CrossRef]
- Hagan, S.M.; Brown, S.A.; Able, K.W. Production of mummichog (Fundulus heteroclitus): Response in marshes treated for common reed (Phragmites australis) removal. Wetlands 2007, 27, 54–67. [Google Scholar] [CrossRef]
- Weinstein, M.P.; Litvin, S.Y.; Guida, V.G. Essential fish habitat and wetland restoration success: A tier III approach to the biochemical condition of common mummichog Fundulus heteroclitus in common reed Phragmites australis- and smooth cordgrass Spartina alterniflora-dominated salt marshes. Estuaries Coasts 2009, 32, 1011–1022. [Google Scholar] [CrossRef]
- Martins, R.; Sampaio, L.; Quintino, V.; Rodrigues, A.M. Diversity, distribution and ecology of benthic molluscann communities on the Portuguese continental shelf. J. Sea Res. 2014, 93, 75–89. [Google Scholar] [CrossRef]
- Martins, R.; Sampaio, L.; Rodrigues, A.M.; Quintino, V. Soft-bottom portuguese continental shelf polychaetes: Diversity and distribution. J. Mar. Syst. 2013, 123–124, 41–54. [Google Scholar] [CrossRef]
- Martins, R.; Quintino, V.; Rodrigues, A.M. Diversity and spatial distribution patterns of the soft-bottom macrofauna communities on the Portuguese continental shelf. J. Sea Res. 2013, 83, 56–64. [Google Scholar] [CrossRef]
| Species | River No | ||||||||||||||||||
|---|---|---|---|---|---|---|---|---|---|---|---|---|---|---|---|---|---|---|---|
| 1 | 2 | 3 | 4 | 5 | 6 | 7 | 8 | 9 | 10 | 11 | 12 | 13 | 14 | 15 | 16 | 17 | 18 | 19 | |
| Chitonidae | |||||||||||||||||||
| Ischnochiton comptus | 0 | 0 | 0 | 5 | 0 | 0 | 0 | 0 | 0 | 0 | 0 | 0 | 0 | 0 | 0 | 0 | 0 | 0 | 0 |
| Nacellidae | |||||||||||||||||||
| Cellana nigrolineata | 2 | 2 | 0 | 0 | 0 | 0 | 0 | 0 | 0 | 0 | 0 | 0 | 0 | 0 | 0 | 0 | 6 | 0 | 0 |
| Lottiidae | |||||||||||||||||||
| Nipponacmea gloriosa | 0 | 0 | 0 | 1 | 0 | 0 | 0 | 0 | 0 | 0 | 0 | 0 | 0 | 0 | 0 | 0 | 0 | 0 | 0 |
| Nipponacmea radula | 5 | 5 | 0 | 12 | 0 | 0 | 0 | 0 | 0 | 0 | 0 | 0 | 0 | 1 | 0 | 0 | 0 | 0 | 0 |
| Nipponacmea nigrans | 0 | 0 | 8 | 9 | 1 | 43 | 10 | 0 | 0 | 0 | 0 | 0 | 0 | 0 | 0 | 0 | 0 | 0 | 0 |
| Patelloida pygmaea | 0 | 0 | 0 | 0 | 0 | 0 | 0 | 1 | 0 | 0 | 0 | 1 | 0 | 0 | 0 | 0 | 0 | 0 | 0 |
| Patelloida pygmaea form conulus | 0 | 0 | 2 | 1 | 0 | 8 | 0 | 0 | 0 | 0 | 0 | 0 | 0 | 0 | 0 | 0 | 0 | 0 | 0 |
| Pattelloida pygmaea form heroldi | 0 | 2 | 4 | 0 | 0 | 8 | 4 | 0 | 0 | 0 | 0 | 0 | 0 | 0 | 0 | 0 | 0 | 0 | 0 |
| Trochidae | |||||||||||||||||||
| Chlorostoma xanthostigma | 0 | 1 | 0 | 0 | 0 | 0 | 0 | 0 | 0 | 0 | 0 | 0 | 0 | 0 | 0 | 0 | 0 | 0 | 0 |
| Monodonta labio form confusa | 4 | 19 | 1 | 11 | 0 | 3 | 0 | 0 | 0 | 1 | 0 | 0 | 0 | 0 | 0 | 0 | 0 | 0 | 0 |
| Omphalius rusticus | 0 | 0 | 0 | 0 | 0 | 0 | 0 | 0 | 0 | 1 | 0 | 0 | 0 | 0 | 0 | 0 | 0 | 0 | 0 |
| Turbinidae | |||||||||||||||||||
| Turbo coronoatus coronatus | 0 | 2 | 0 | 2 | 0 | 0 | 0 | 0 | 0 | 0 | 0 | 0 | 0 | 0 | 0 | 0 | 0 | 0 | 0 |
| Turbo cornatus coreensis | 0 | 5 | 1 | 3 | 0 | 2 | 13 | 0 | 0 | 19 | 0 | 0 | 0 | 0 | 0 | 0 | 0 | 0 | 0 |
| Neritidae | |||||||||||||||||||
| Nerita japonica | 42 | 79 | 19 | 0 | 0 | 23 | 40 | 0 | 0 | 0 | 0 | 0 | 0 | 0 | 0 | 0 | 0 | 0 | 0 |
| Clithon retropicta | 0 | 0 | 14 | 9 | 6 | 0 | 4 | 44 | 0 | 0 | 5 | 0 | 0 | 0 | 8 | 0 | 0 | 0 | 0 |
| Neripteron cornucopia | 0 | 0 | 0 | 0 | 0 | 0 | 0 | 0 | 0 | 0 | 0 | 0 | 1 | 0 | 0 | 0 | 12 | 0 | 0 |
| Phenacolepadidae | |||||||||||||||||||
| Phenacolepas unguiformis | 0 | 0 | 0 | 0 | 0 | 0 | 0 | 2 | 0 | 0 | 0 | 0 | 0 | 0 | 0 | 0 | 0 | 0 | 0 |
| Cinnalepeta pulchella | 0 | 0 | 6 | 0 | 0 | 0 | 0 | 0 | 0 | 0 | 0 | 0 | 0 | 0 | 0 | 0 | 0 | 0 | 0 |
| Cerithiidae | |||||||||||||||||||
| Ceritium coralium | 0 | 0 | 0 | 0 | 0 | 0 | 1 | 0 | 0 | 0 | 0 | 0 | 0 | 0 | 0 | 0 | 0 | 0 | 0 |
| Batillariidae | |||||||||||||||||||
| Batillaria multiformis | 0 | 28 | 138 | 111 | 2 | 216 | 76 | 101 | 0 | 16 | 0 | 0 | 0 | 205 | 1 | 208 | 0 | 0 | 3 |
| Batillaria attramentaria | 0 | 3 | 10 | 89 | 0 | 73 | 0 | 92 | 0 | 52 | 0 | 0 | 0 | 1 | 0 | 0 | 0 | 0 | 0 |
| Potamididae | |||||||||||||||||||
| Cerithidea djadjariensis | 0 | 0 | 0 | 0 | 0 | 396 | 136 | 0 | 0 | 0 | 0 | 0 | 0 | 0 | 0 | 0 | 0 | 0 | 0 |
| Cerithidea largillierti | 0 | 0 | 0 | 0 | 0 | 0 | 3 | 0 | 0 | 0 | 0 | 0 | 8 | 0 | 0 | 0 | 33 | 0 | 0 |
| Cerithidea ornata | 0 | 0 | 1 | 0 | 0 | 15 | 11 | 0 | 0 | 0 | 0 | 0 | 0 | 2 | 1 | 0 | 13 | 0 | 0 |
| Cerithidea rhizophorarum | 0 | 0 | 18 | 0 | 1 | 16 | 53 | 0 | 0 | 0 | 0 | 0 | 54 | 46 | 3 | 0 | 99 | 0 | 0 |
| Cerithidea cingulata | 0 | 0 | 0 | 0 | 0 | 319 | 85 | 0 | 0 | 0 | 0 | 0 | 0 | 4 | 0 | 0 | 675 | 0 | 0 |
| Littorinidae | |||||||||||||||||||
| Cerithidea rhizophorarum | 11 | 0 | 0 | 0 | 0 | 4 | 2 | 13 | 0 | 0 | 7 | 0 | 0 | 29 | 23 | 21 | 1 | 43 | 13 |
| Littoraria intermedia | 0 | 0 | 0 | 0 | 0 | 0 | 0 | 0 | 0 | 0 | 0 | 0 | 1 | 14 | 87 | 104 | 1 | 0 | 6 |
| Littoraria articulata | 0 | 0 | 0 | 0 | 0 | 0 | 0 | 0 | 0 | 0 | 0 | 0 | 0 | 0 | 0 | 20 | 0 | 73 | 0 |
| Assimineidae | |||||||||||||||||||
| Assiminea sp. | 0 | 0 | 38 | 0 | 0 | 0 | 0 | 0 | 0 | 0 | 0 | 0 | 18 | 274 | 2 | 3 | 280 | 0 | 442 |
| Muricidae | |||||||||||||||||||
| Thais clavigera | 2 | 0 | 0 | 4 | 0 | 0 | 0 | 0 | 0 | 9 | 0 | 0 | 0 | 0 | 0 | 0 | 0 | 0 | 0 |
| Reishia bronni | 0 | 1 | 0 | 0 | 0 | 0 | 0 | 0 | 0 | 0 | 0 | 0 | 0 | 0 | 0 | 0 | 0 | 0 | 0 |
| Nassariidae | |||||||||||||||||||
| Reticunassa festiva | 0 | 0 | 1 | 0 | 0 | 0 | 0 | 0 | 0 | 0 | 0 | 0 | 0 | 0 | 0 | 0 | 0 | 0 | 0 |
| Nassarius multigranosa | 0 | 0 | 0 | 0 | 0 | 6 | 0 | 0 | 0 | 0 | 0 | 0 | 0 | 0 | 0 | 0 | 0 | 0 | 0 |
| Buccinidae | |||||||||||||||||||
| Japeuthria ferrea | 0 | 4 | 0 | 0 | 0 | 0 | 0 | 0 | 0 | 0 | 0 | 0 | 0 | 0 | 0 | 0 | 0 | 0 | 0 |
| Ellobiidae | |||||||||||||||||||
| Laemodonta exaratoides | 0 | 0 | 0 | 0 | 0 | 0 | 0 | 0 | 0 | 0 | 0 | 0 | 0 | 0 | 0 | 1 | 0 | 0 | 0 |
| Arcidae | |||||||||||||||||||
| Barbatia virescens | 0 | 2 | 0 | 2 | 0 | 0 | 1 | 0 | 0 | 0 | 0 | 0 | 0 | 0 | 0 | 0 | 0 | 0 | 0 |
| Mytilidae | |||||||||||||||||||
| Modiolus nipponicus | 0 | 0 | 0 | 0 | 0 | 0 | 0 | 0 | 0 | 0 | 33 | 0 | 0 | 0 | 0 | 0 | 0 | 0 | 0 |
| Hormomya mutabilis | 2 | 15 | 0 | 0 | 0 | 0 | 2 | 0 | 0 | 0 | 0 | 0 | 0 | 0 | 0 | 0 | 0 | 0 | 0 |
| Mytilus galloprovincialis | 4 | 0 | 6 | 0 | 5 | 90 | 7 | 2 | 0 | 0 | 0 | 11 | 0 | 1 | 1 | 5 | 0 | 32 | 10 |
| Mactridae | |||||||||||||||||||
| Raetellops pulchellus | 0 | 0 | 0 | 0 | 0 | 0 | 0 | 2 | 0 | 0 | 0 | 0 | 0 | 0 | 0 | 0 | 0 | 0 | 0 |
| Mesodesmatidae | |||||||||||||||||||
| Coecella chinensis | 0 | 0 | 0 | 3 | 0 | 0 | 0 | 0 | 0 | 0 | 0 | 0 | 0 | 0 | 0 | 0 | 0 | 0 | 0 |
| Tellinidae | |||||||||||||||||||
| Nitidotellina hokkaidoensis | 0 | 0 | 0 | 0 | 0 | 0 | 0 | 0 | 0 | 2 | 0 | 0 | 0 | 0 | 0 | 0 | 0 | 0 | 0 |
| Moerella iridescens | 0 | 0 | 0 | 0 | 0 | 0 | 0 | 0 | 0 | 1 | 0 | 0 | 0 | 0 | 0 | 0 | 0 | 0 | 0 |
| Psammobiidae | |||||||||||||||||||
| Nuttallia commoda | 0 | 0 | 0 | 0 | 0 | 0 | 0 | 1 | 0 | 0 | 0 | 0 | 0 | 0 | 0 | 0 | 0 | 0 | 0 |
| Psammotaea virescens | 0 | 0 | 0 | 0 | 0 | 0 | 0 | 0 | 0 | 0 | 8 | 10 | 0 | 0 | 0 | 0 | 0 | 0 | 0 |
| Psammotaea minor | 0 | 0 | 0 | 0 | 0 | 0 | 0 | 3 | 0 | 0 | 0 | 0 | 0 | 0 | 0 | 0 | 0 | 0 | 0 |
| Trapezidae | |||||||||||||||||||
| Trapezium oblongum | 0 | 0 | 0 | 0 | 1 | 2 | 11 | 0 | 0 | 0 | 0 | 0 | 0 | 0 | 0 | 0 | 0 | 9 | 0 |
| Corbiculidae | |||||||||||||||||||
| Corbicula japonica | 0 | 0 | 0 | 0 | 0 | 0 | 0 | 0 | 0 | 0 | 0 | 0 | 0 | 2 | 0 | 0 | 0 | 0 | 0 |
| Glauconomidae | |||||||||||||||||||
| Glauconome chinensis | 0 | 0 | 0 | 0 | 0 | 0 | 0 | 0 | 0 | 0 | 0 | 0 | 7 | 50 | 0 | 0 | 5 | 0 | 1 |
| Veneridae | |||||||||||||||||||
| Ruditapes philippinarum | 0 | 0 | 0 | 2 | 0 | 0 | 0 | 1 | 0 | 83 | 1 | 0 | 0 | 0 | 0 | 0 | 0 | 0 | 0 |
| Cyclina sinensis | 0 | 0 | 1 | 0 | 0 | 25 | 0 | 0 | 0 | 1 | 0 | 0 | 0 | 0 | 0 | 0 | 0 | 0 | 0 |
| Meretrix lusoria | 0 | 0 | 0 | 0 | 0 | 0 | 0 | 2 | 0 | 0 | 0 | 0 | 0 | 0 | 0 | 0 | 0 | 0 | 0 |
| Laternulidae | |||||||||||||||||||
| Laternula boschasina | 0 | 0 | 0 | 0 | 0 | 0 | 0 | 0 | 0 | 0 | 0 | 0 | 0 | 1 | 0 | 0 | 0 | 0 | 0 |
| Pomacea canaliculate | 0 | 0 | 0 | 0 | 18 | 0 | 0 | 0 | 0 | 0 | 0 | 0 | 0 | 0 | 0 | 0 | 0 | 0 | 0 |
| number of species | 8 | 14 | 16 | 15 | 7 | 17 | 17 | 12 | 0 | 10 | 5 | 3 | 7 | 13 | 8 | 7 | 10 | 4 | 6 |
| number of individuals | 72 | 168 | 268 | 264 | 34 | 1249 | 459 | 264 | 0 | 185 | 54 | 22 | 89 | 630 | 126 | 362 | 1125 | 157 | 475 |
| Species | Indval | |||
|---|---|---|---|---|
| A | B | C | D | |
| Nipponacmea radula | 11 | 16 | 6 | 0 |
| Nipponacmea nigrans | 0 | 14 | 49 | 0 |
| Pattelloida pygmaea form heroldi | 0 | 4 | 59 | 0 |
| Monodonta labio form confusa | 8 | 25 | 17 | 0 |
| Turbo cornatus coreensis | 0 | 27 | 42 | 0 |
| Nerita japonica | 9 | 3 | 44 | 0 |
| Clithon retropicta | 7 | 23 | 16 | 2 |
| Batillaria multiformis | 0 | 40 | 40 | 10 |
| Batillaria attramentaria | 0 | 41 | 36 | 0 |
| Cerithidea ornata | 0 | 0 | 75 | 8 |
| Cerithidea rhizophorarum | 0 | 2 | 59 | 15 |
| Cerithidea cingulata | 0 | 0 | 61 | 3 |
| Littorina brevicula | 18 | 2 | 23 | 28 |
| Littoraria intermedia | 0 | 0 | 6 | 64 |
| Assiminea sp. | 0 | 0 | 19 | 52 |
| Mytilus galloprovincialis | 16 | 6 | 37 | 16 |
| Trapezium oblongum | 0 | 5 | 29 | 3 |
| Glauconome chinensis | 0 | 0 | 8 | 33 |
| Ruditapes philippinarum | 12 | 39 | 0 | 0 |
| Group | River | Silt | Sand | Gravel | Boulder | Bed Rock | Riprap | Concrete Construct | Vegetation | Number of Habitats |
|---|---|---|---|---|---|---|---|---|---|---|
| α | Kurosak.R | 0 | 0 | 1 | 0 | 1 | 0 | 1 | 0 | 3 |
| Ekawachi.R | 0 | 1 | 1 | 1 | 0 | 0 | 0 | 0 | 3 | |
| Ohara.R | 0 | 1 | 0 | 0 | 0 | 0 | 0 | 0 | 1 | |
| Saigou.R | 0 | 1 | 0 | 1 | 0 | 0 | 1 | 0 | 3 | |
| Yahagi.R | 0 | 1 | 0 | 0 | 0 | 0 | 1 | 0 | 2 | |
| Average | 0 | 0.8 | 0.4 | 0.4 | 0.2 | 0 | 0.6 | 0 | 2.4 | |
| β | Imahuku.R | 0 | 1 | 1 | 1 | 0 | 1 | 0 | 0 | 4 |
| Sato.R | 1 | 1 | 0 | 0 | 0 | 0 | 0 | 0 | 2 | |
| Hai.R | 1 | 1 | 1 | 1 | 1 | 1 | 0 | 1 | 6 | |
| Sozoro.R | 1 | 1 | 1 | 1 | 0 | 1 | 0 | 1 | 6 | |
| Sakurai.R | 1 | 1 | 1 | 1 | 0 | 1 | 0 | 0 | 5 | |
| Jyurou.R | 0 | 1 | 0 | 1 | 0 | 0 | 0 | 0 | 2 | |
| Average | 0.7 | 1 | 0.7 | 0.8 | 0.2 | 0.7 | 0 | 0.3 | 4.2 | |
| γ | Kashii.R | 0 | 1 | 1 | 1 | 0 | 0 | 0 | 1 | 4 |
| Otsubo.R | 1 | 1 | 1 | 1 | 0 | 0 | 0 | 1 | 5 | |
| Kusami.R | 0 | 1 | 0 | 1 | 0 | 1 | 0 | 1 | 4 | |
| Kakuta.R | 1 | 1 | 1 | 0 | 0 | 0 | 0 | 1 | 4 | |
| Naka.R | 1 | 0 | 1 | 1 | 0 | 1 | 0 | 0 | 4 | |
| Yamashiro.R | 1 | 0 | 0 | 0 | 0 | 0 | 0 | 1 | 2 | |
| Kuroki.R | 1 | 0 | 1 | 1 | 0 | 1 | 0 | 0 | 4 | |
| Iida.R | 1 | 0 | 1 | 0 | 0 | 0 | 1 | 0 | 3 | |
| Average | 0.75 | 0.5 | 0.75 | 0.63 | 0 | 0.38 | 0.13 | 0.63 | 3.75 |
© 2017 by the authors. Licensee MDPI, Basel, Switzerland. This article is an open access article distributed under the terms and conditions of the Creative Commons Attribution (CC BY) license (http://creativecommons.org/licenses/by/4.0/).
Share and Cite
Itsukushima, R.; Morita, K.; Shimatani, Y. The Use of Molluscan Fauna as Model Taxon for the Ecological Classification of River Estuaries. Water 2017, 9, 356. https://doi.org/10.3390/w9050356
Itsukushima R, Morita K, Shimatani Y. The Use of Molluscan Fauna as Model Taxon for the Ecological Classification of River Estuaries. Water. 2017; 9(5):356. https://doi.org/10.3390/w9050356
Chicago/Turabian StyleItsukushima, Rei, Kai Morita, and Yukihiro Shimatani. 2017. "The Use of Molluscan Fauna as Model Taxon for the Ecological Classification of River Estuaries" Water 9, no. 5: 356. https://doi.org/10.3390/w9050356
APA StyleItsukushima, R., Morita, K., & Shimatani, Y. (2017). The Use of Molluscan Fauna as Model Taxon for the Ecological Classification of River Estuaries. Water, 9(5), 356. https://doi.org/10.3390/w9050356


