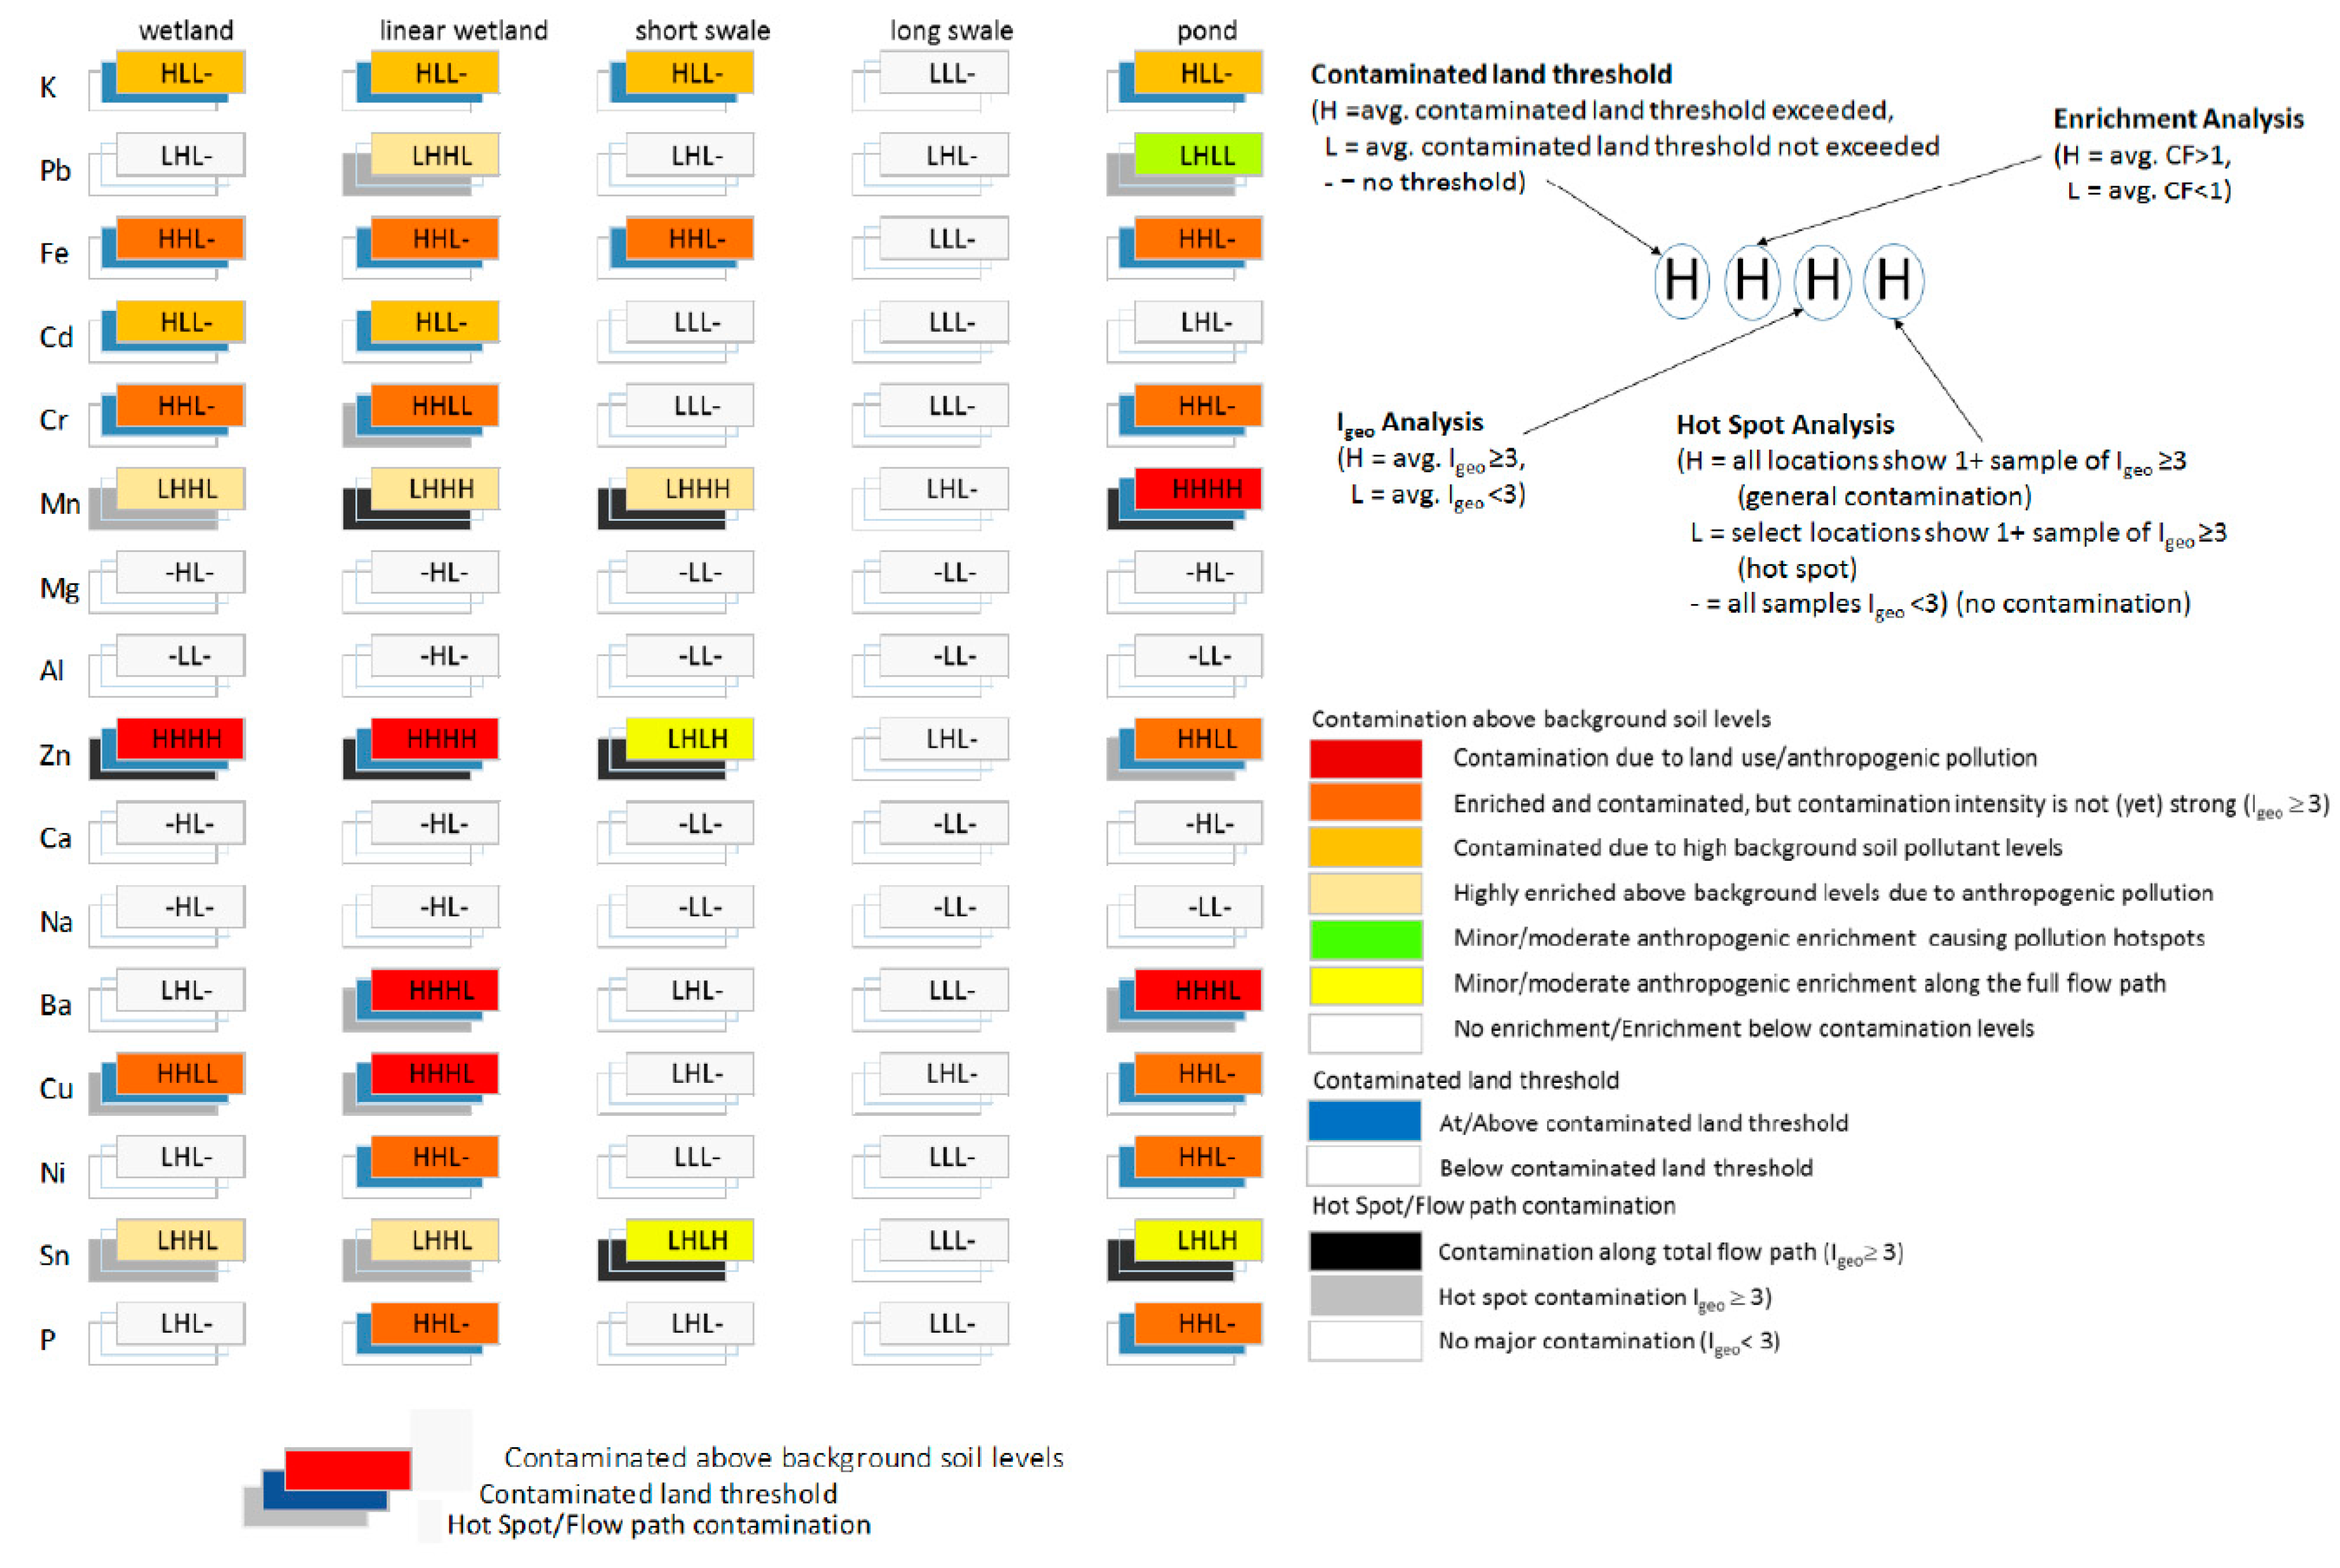
3.1. Deposited Sediment contAminant Concentrations
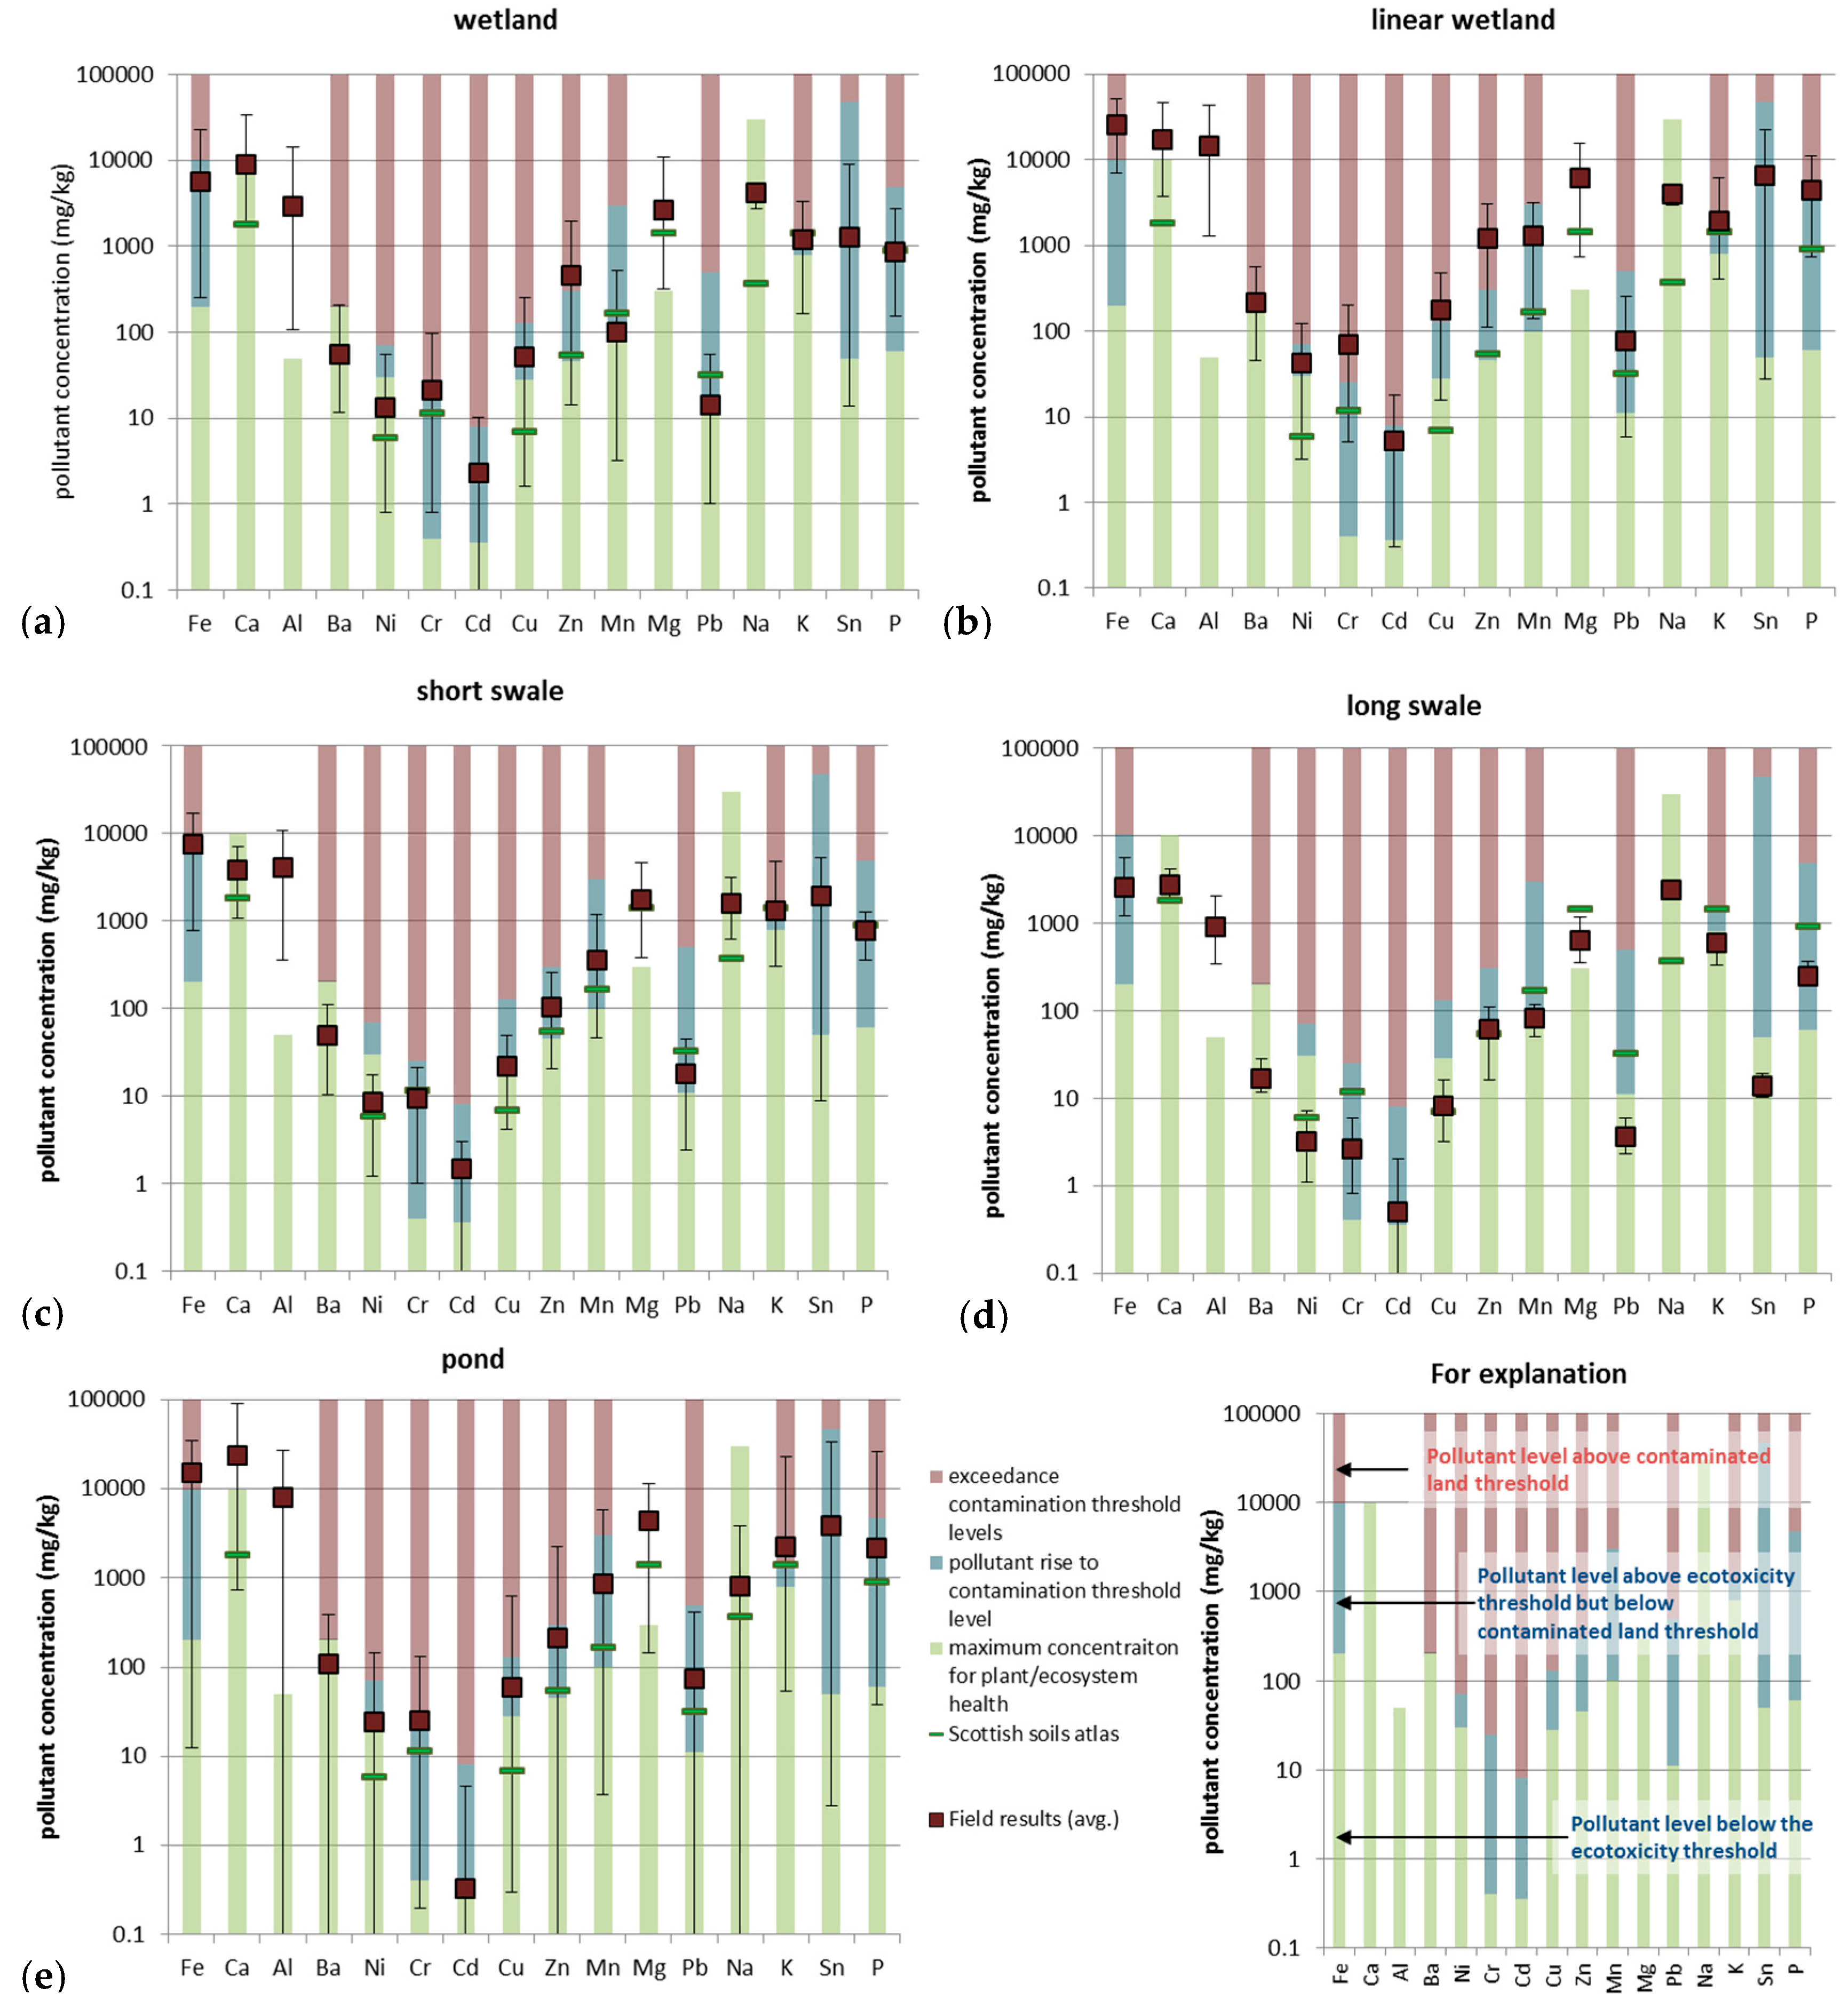
The contaminant concentrations of bed deposited sediment samples were analysed and compared to the contaminated land and ecotoxicity thresholds (presented in
Table 3). The comparison was undertaken to provide context to the contaminant levels within the different monitored SuDS assets. The contaminant concentrations of deposited sediment for each of the monitored assets are presented (
Figure 1) to identify the level of contamination relative to literature published thresholds.
Figure 1 presents the existing contaminant levels and thus the risk of contamination in individual SuDS assets without specifically considering the reason or cause of differences in contaminant concentrations.
Field collected sediment contamination results were compared to published contaminant threshold levels (red: contamination trigger exceedance; blue: ecotoxicity trigger exceedance within
Figure 1). Key published contaminant contamination levels are presented in
Table 3. Guideline and threshold values chosen for further field data set analysis were selected by relative proximity to the field sample sites (UK), placing priority on use of the UK ICRCL information followed by EU information.
Table 3 illustrates that not all guidelines consider the same contaminants, and that threshold levels vary between authorities and guidance documents. The UK guidelines provide threshold levels for Ni, Cr, Cd, Cu, Zn and Pb, and these are similar to published USA/Canada/Australia/NZ guidance threshold levels. As the sediment contaminant levels found within SuDS are not frequently described in literature, field sample contaminant results were compared to the contaminated land/ecotoxicity indicators provided in the guidance documents (
Table 3).
The deposited sediment contaminant concentrations for the established wetland, linear wetland, swale and pond SuDS assets are illustrated in
Figure 1, in conjunction with published threshold levels (detailed in
Table 3) to provide context and comparison of contamination levels.
The field results show that, with the exception of the long swale, the monitored SuDS sediment contamination levels reach or exceed the contaminated land threshold (for at least one sample and at least one contaminant). This suggests that the adsorption process functioning within SuDS to remove solute contaminants from stormwater may be effective, resulting in contaminants becoming temporarily detained through adsorption to urban fine sediment deposited on the SuDS bed.
The average field sample results are generally below the contamination threshold levels, but above ecotoxicity levels. The exception to this is: Cr and K, where field average values fall at the contamination threshold levels; Zn, where average field results are above contamination threshold levels; and Ba, Ni and Na which show average field values below ecotoxicity levels.
The wetland sediment contaminant levels (
Figure 1a) range and average values are generally greater than previously published result (for wetlands) for Cd, Zn and Cu (tyre wear contaminants) (
Table 4). This may be due to traffic use in the field sample location or other source related variations between field sites. Field results are at or below published sediment contamination results for Ni and Cr (primarily vehicle and motor degradation contaminants).
The sediment within the investigated linear wetland is found to show a greater variation in contamination, with seven (7) contaminants illustrating average values at or above contamination threshold levels (Fe, Ba, Cr, Cu, Zn, K and P). Only one contaminant, Na, presented average deposited sediment concentrations below ecotoxicity levels, while Ca, Ba, Ni, Cd, Cu, Pb, K and Sn show the lower range of results extending below ecotoxicity threshold levels.
The sediment deposited within the investigated short swale (
Figure 1c) showed elevated contaminant levels for K, with average sediment contaminant concentrations falling at or close to the contamination threshold level. Fe and K are the only two contaminants to show an upper range of results within the contamination exceedance range. The majority of contaminants (Cr, Cd, Cu, Zn, Mn, Pb, Zn, Sn and P) illustrate average contaminant levels between ecotoxicity and contamination levels, but it is important to note that Cr and P data range lies consistently in breach of ecotoxicity threshold levels. Only Ca, Ni, Na and Ba average sediment contaminant concentrations fall below ecotoxicity levels. Thus, sediment deposited within the short swale is not generally illustrated to be contaminated, but is above the ideal levels with regards to ecosystem health (within the swale).
The long swale (
Figure 1d) does not show any results above contaminated land threshold levels. Fe, Cr, Cd, Zn, Mn, K and P average contaminant concentrations are above the threshold ecotoxicity levels (but below contamination threshold levels). Of these contaminants, Fe, Cr and P show the lower range of field results to also fall in exceedance of the ecotoxicity threshold levels. This suggests that while these contaminants are not of concern with regards to contaminated land conditions they may influence the long swale ecosystem health. The long swale may show lower contaminant concentration levels on deposited sediment due to the location of the swale. While the short swale receives stormwater directly from impermeable road surface, the long swale runoff is conveyed via an upstream SuDS asset prior to reaching the long swale. Thus, the lower sediment contaminant concentrations in this swale may be due to its placement as 2nd SuDS asset within a SuDS treatment train.
The pond’s results (
Figure 1e) show nine major elements and trace metals to have at least one sample with concentration levels above contaminated land threshold levels (Fe, Ba, Ni, Cr, Cu, Zn, Mn, K and P). Of these, only two contaminants, Fe and K, show average concentrations above contamination threshold levels. Notably all contaminants tested show a wide concentration range suggesting temporal and/or spatial variability in the results.
The pond contamination levels have been compared to those reported by Heal and Drain for a range of UK ponds (
Table 5). The pond sediment contamination levels (
Figure 1e) for Cr and Ni are generally below those presented in Heal and Drain [
37],
Table 5. However, Cu, Cd, Pb, and Zn sediment contaminant concentrations in the monitored pond are higher than literature reported levels.
The wetland, linear wetland, short swale and pond all show some level of deposited sediment contamination (average sediment contaminant concentrations above contamination threshold levels).
Table 6 summarises the average sediment contaminant concentrations for each SuDS asset. K is consistently elevated above contaminated threshold levels across these SuDS assets, while elevated levels of Fe are found in the pond, short swale and linear wetland.
The linear wetland has the greatest number of contaminants (7) illustrating average (mean) concentrations above contaminated land threshold levels. The tabulation of average contaminant concentrations relative to threshold levels suggests a SuDS asset ranking of the linear wetland > wetland > short swale, pond > long swale in the detention (within the deposited sediment) of the number of contaminants above the contaminated land threshold. It also suggests that all the monitored SuDS assets illustrate deposited sediment contaminant levels that may be of concern with regard to ecosystem health (all assets show a minimum of 7 contaminants with concentrations above ecotoxicity threshold levels). Na appears to consistently fall below ecotoxicity threshold levels for all SuDS assets, suggesting that this contaminant is not of concern within any of the monitored SuDS assets.
3.2. Spatial Contaminant Concentration with SuDS
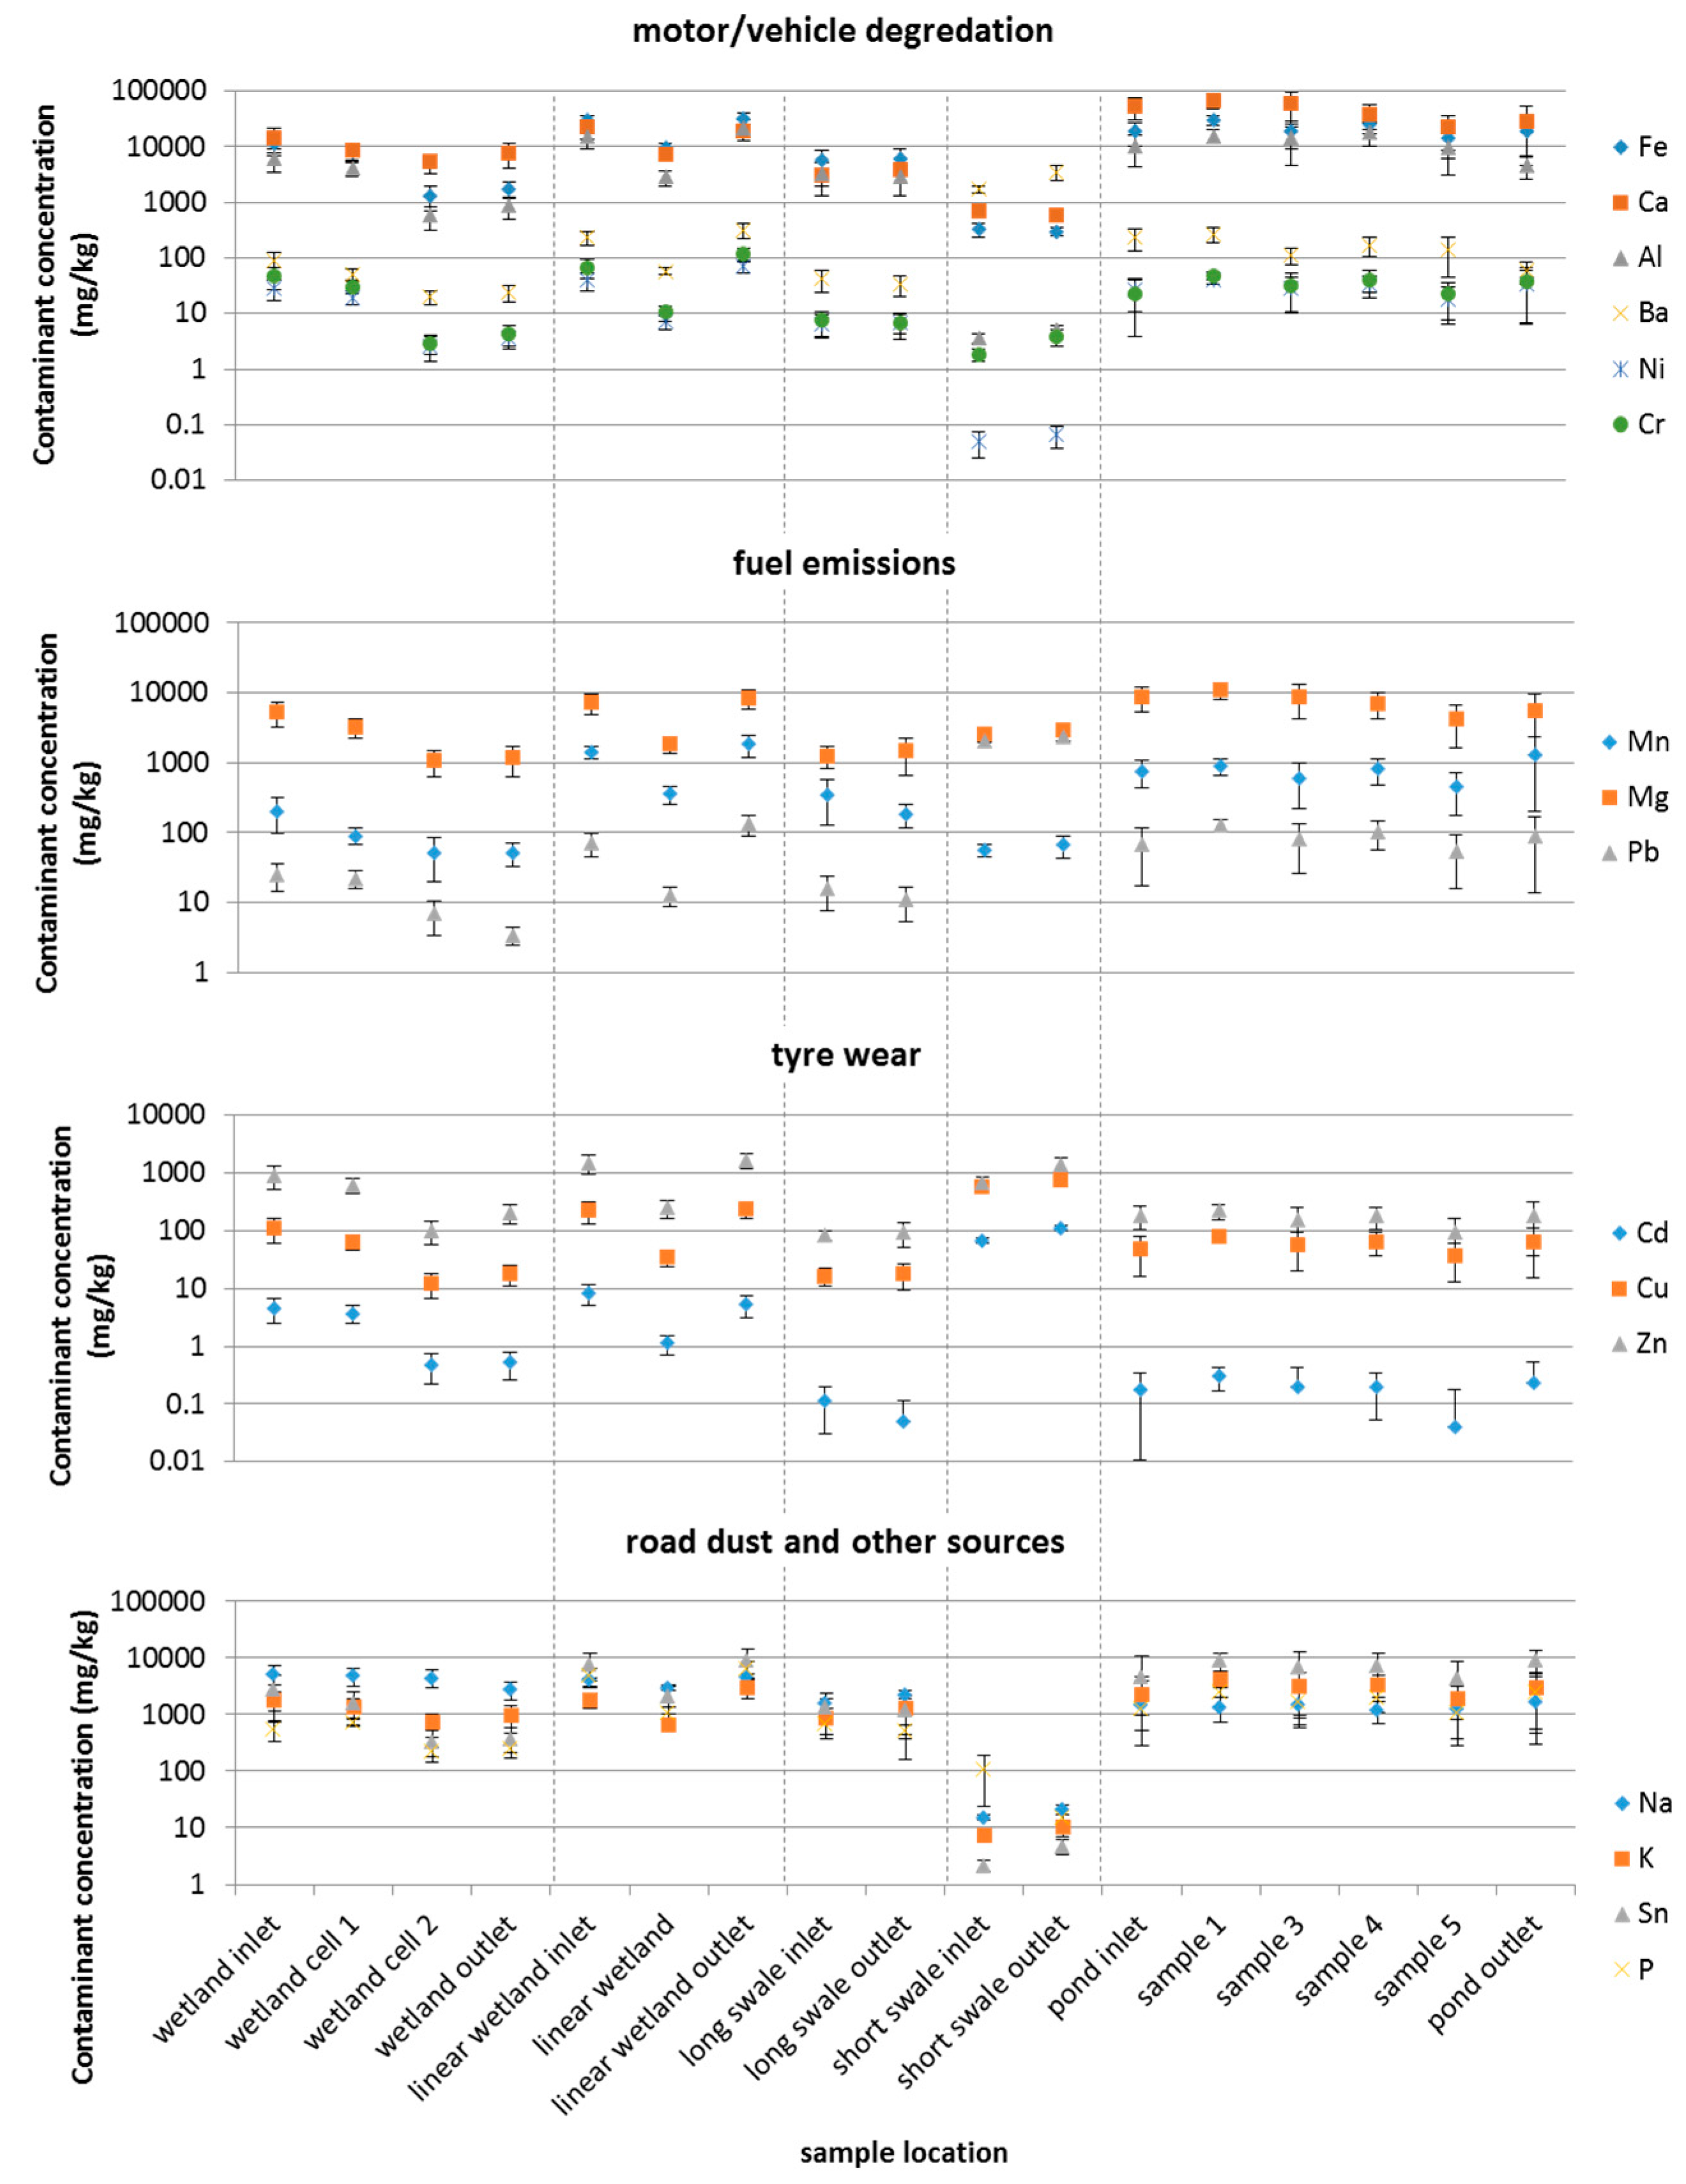
The spatial contaminant concentration of deposited sediment within the monitored SuDS assets have been graphically visualised (
Figure 2). Although the number of sampling points is limited, this identifies whether the SuDS asset sediment contamination could be generalised, if sediment contaminant trends occur, and if there are hot spots of contamination within the SuDS assets. In conjunction with the graphical representation of sediment contaminant levels, correlation analysis was undertaken to identify the linkage between sediment deposition and particle size distribution of deposited material at each sample location.
Sediment adsorbed contaminant concentrations are found to decline in the wetland and upper-mid section of the linear wetland, but not consistently within the swale or pond. The wetland is the only SuDS asset showing a decrease in sediment contaminant concentration for all contaminants. Both the swales and pond show sediment enrichment for multiple contaminants (also found at the linear wetland outlet). Overall, K and Na are found to increase in concentration across all SuDS assets except the wetland, while Mg becomes enriched in the linear wetland and swales.
Investigated SuDS asset inlet concentration is found to show negligible correlation to the outlet concentration of sediment contaminants in the wetland, linear wetland and pond (perennial assets), but strong correlations with both the long and short swales (ephemeral assets). Thus, ephemeral vs. perennial flow may provide an influence on sediment contaminant enrichment or remediation activities, with the concentration of contaminants at the inlet of perennial assets being of little influence but the concentration at ephemeral SuDS assets being of potential importance and influence on sediment remediation or enrichment.
3.3. Sediment Deposition with SuDS
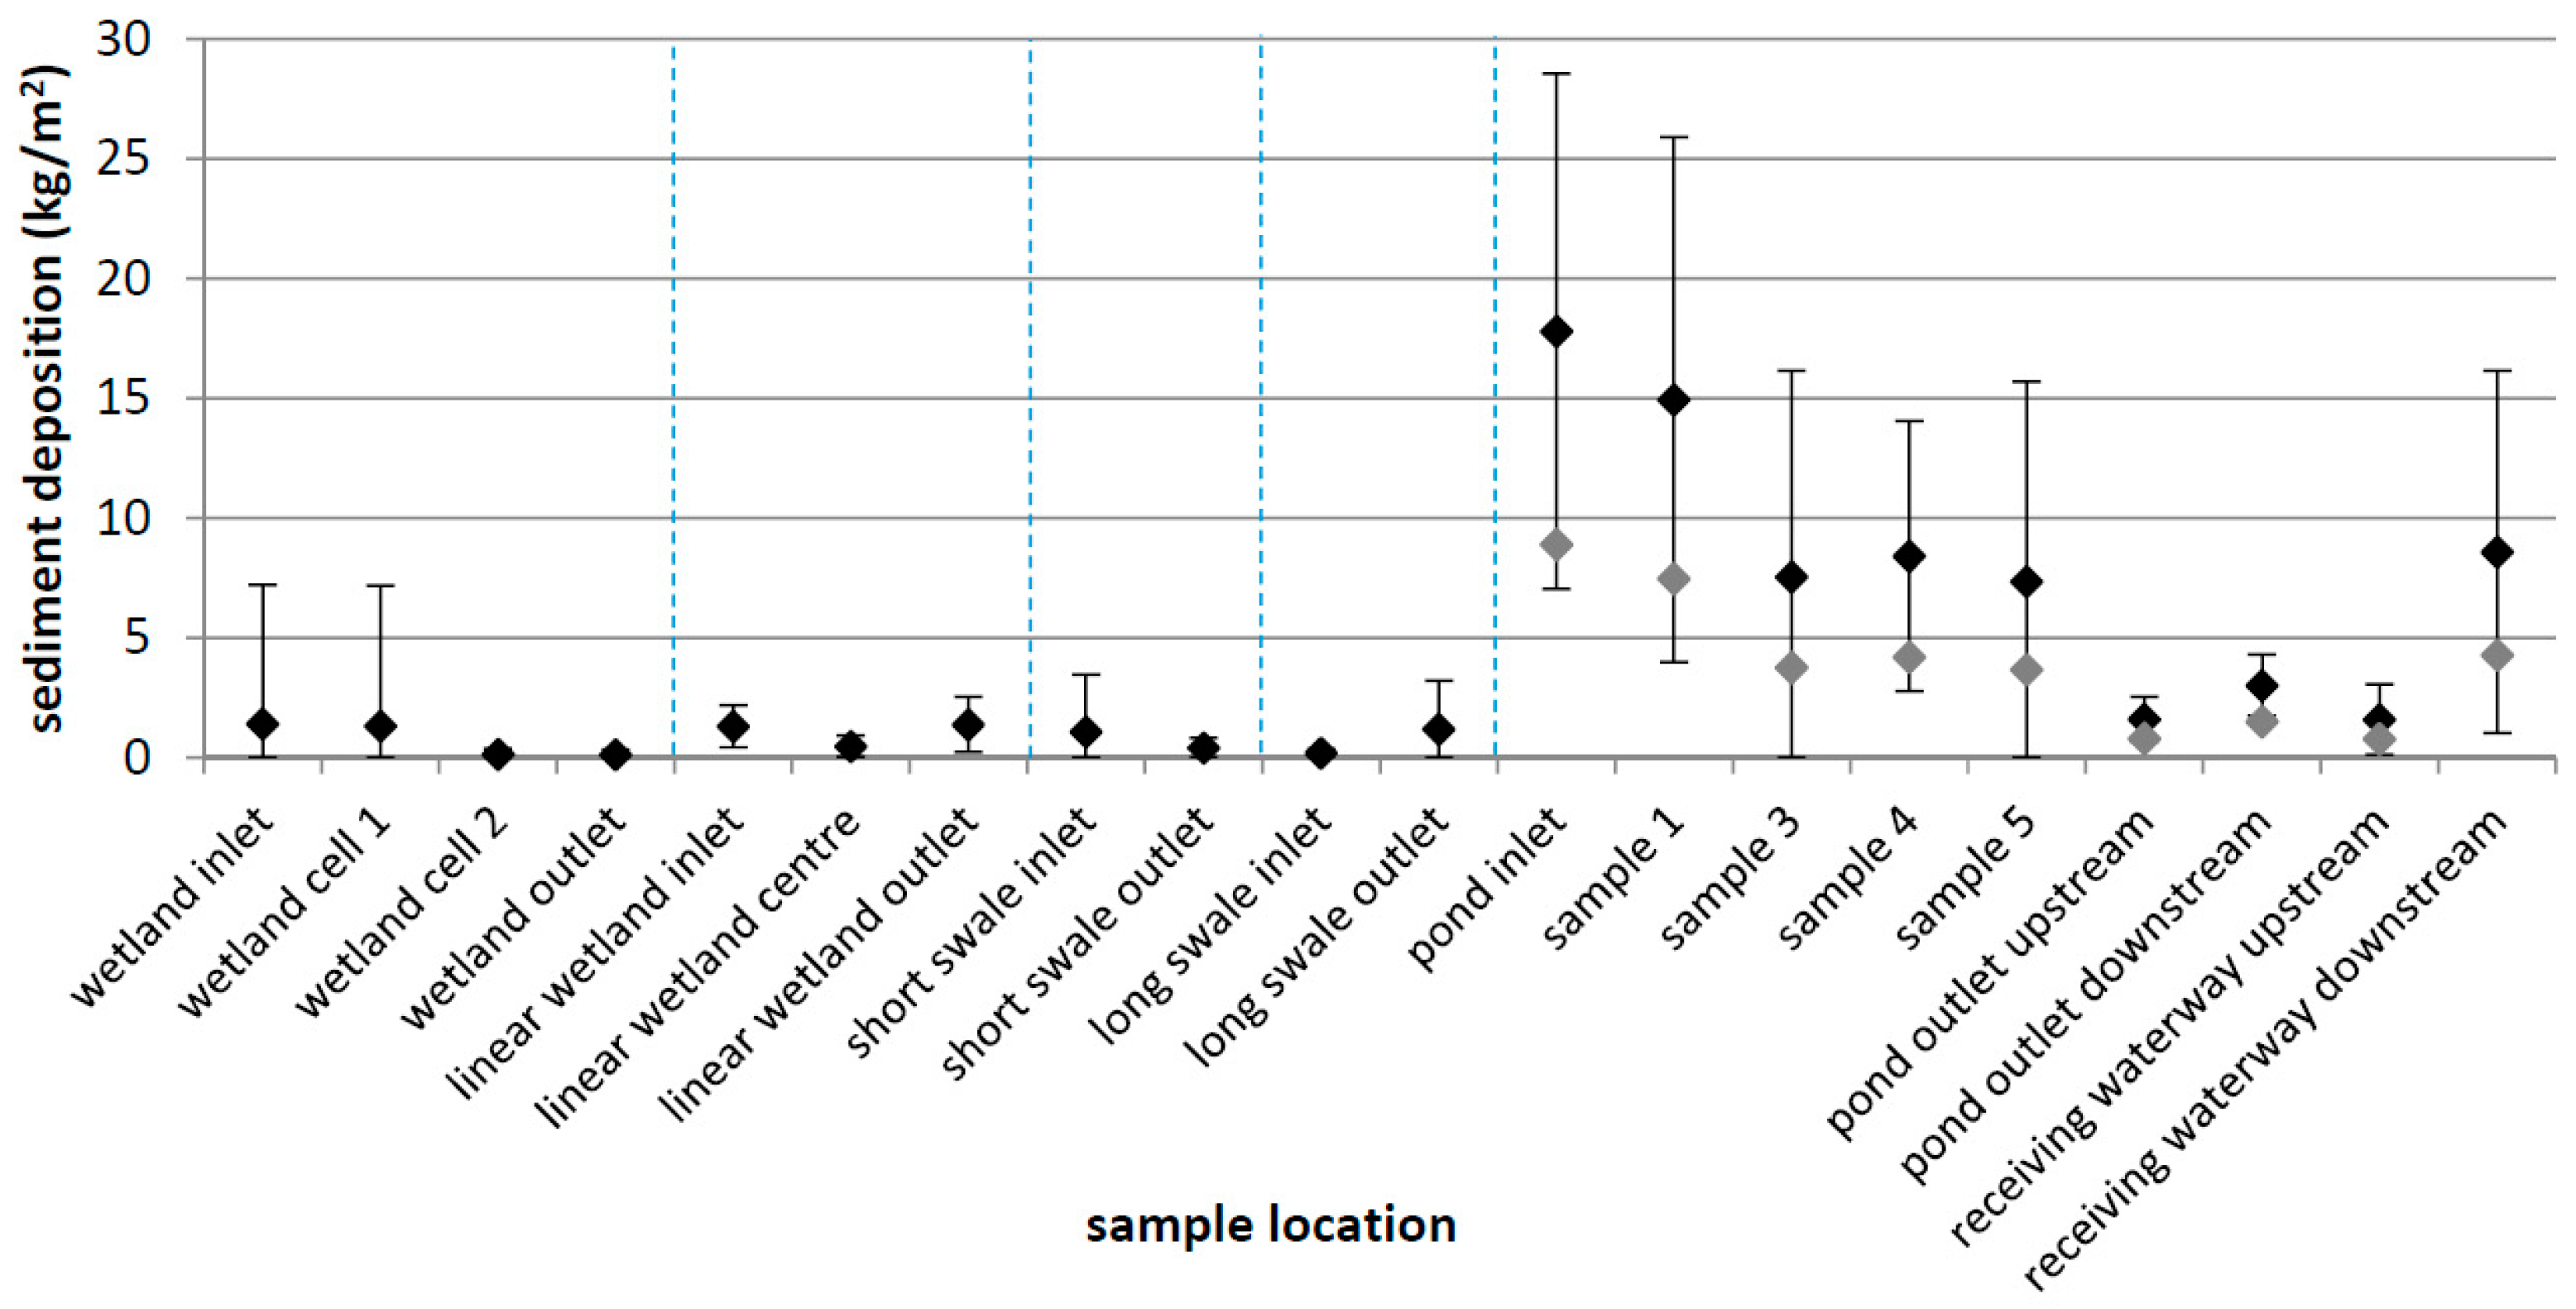
Bed deposition for each monitored SuDS asset for the relative sample period is presented in
Figure 3. The standard deviation of results is indicated by the black lines. Average values and standard deviations are presented to emphasize the asset specific changes and trends in deposited sediment. The sampling frequency for the wetland, linear wetland and swales are fortnightly; while the pond was monthly (due to access constraints). To allow for direct comparison, the approximate fortnightly sediment deposition averages for the pond are presented (grey points,
Figure 3).
The overall investigated SuDS asset deposition data show the linear wetland to achieve the highest average deposition (1.1 kg/m2). When disaggregated to sample location, the inlet section (inlet and cell 1) of the wetland, short swale inlet and long swale outlet all exhibit deposition rates of approximately 1.3 kg/m2 ± 0.2 kg/m2. The linear wetland illustrates multiple sample locations above 1.3 kg/m2 illustrating this asset to be consistent in achieving relative elevated sediment detention. However, it is noted that the upstream half of the wetland has elevated (with large standard deviation) detention results and both swales show an area of elevated detention. The wetland inlet and cell 1 higher deposition results may occur due to the direct supply (surface source) and/or flow dynamics of overland/piped stormwater entering a waterbody (resulting in velocity decrease and deposition potential). Similar influences may result in the short swale inlet elevated sediment detention results. The long swale outlet discharges into a pond/standing waterbody and thus has a wet downstream boundary condition water level. This may reduce flow velocity at the outlet section of this swale and correspondingly result in the elevated sediment detention at this location.
Review of the pond results suggests an overall 1.0–3.2 kg/m2 bed deposition. Consideration of location specific deposition within the pond suggests a general declining trend along the flow path (both in sample location average and general standard deviation range). The greatest deposition occurs at the inlet, similar to the wetland, suggesting effective general detention design of the pond (i.e., detention is occurring throughout the pond not just in one location, e.g., at the inlet or outlet). However, while detention is illustrated within the pond, receiving waterway results do suggest the potential release of sediment from the pond to impact on downstream water quality. This tentatively suggests that while the pond is functioning as a sink for urban sediment from the upstream development, it may also be acting as a source of sediment to the receiving waterway. The overall asset hierarchy (based on overall deposition) of the investigated SuDS may be pond > linear wetland > wetland~short swale > long swale.
3.4. Deposited Sediment Modal Particle Size with Investigated SuDS
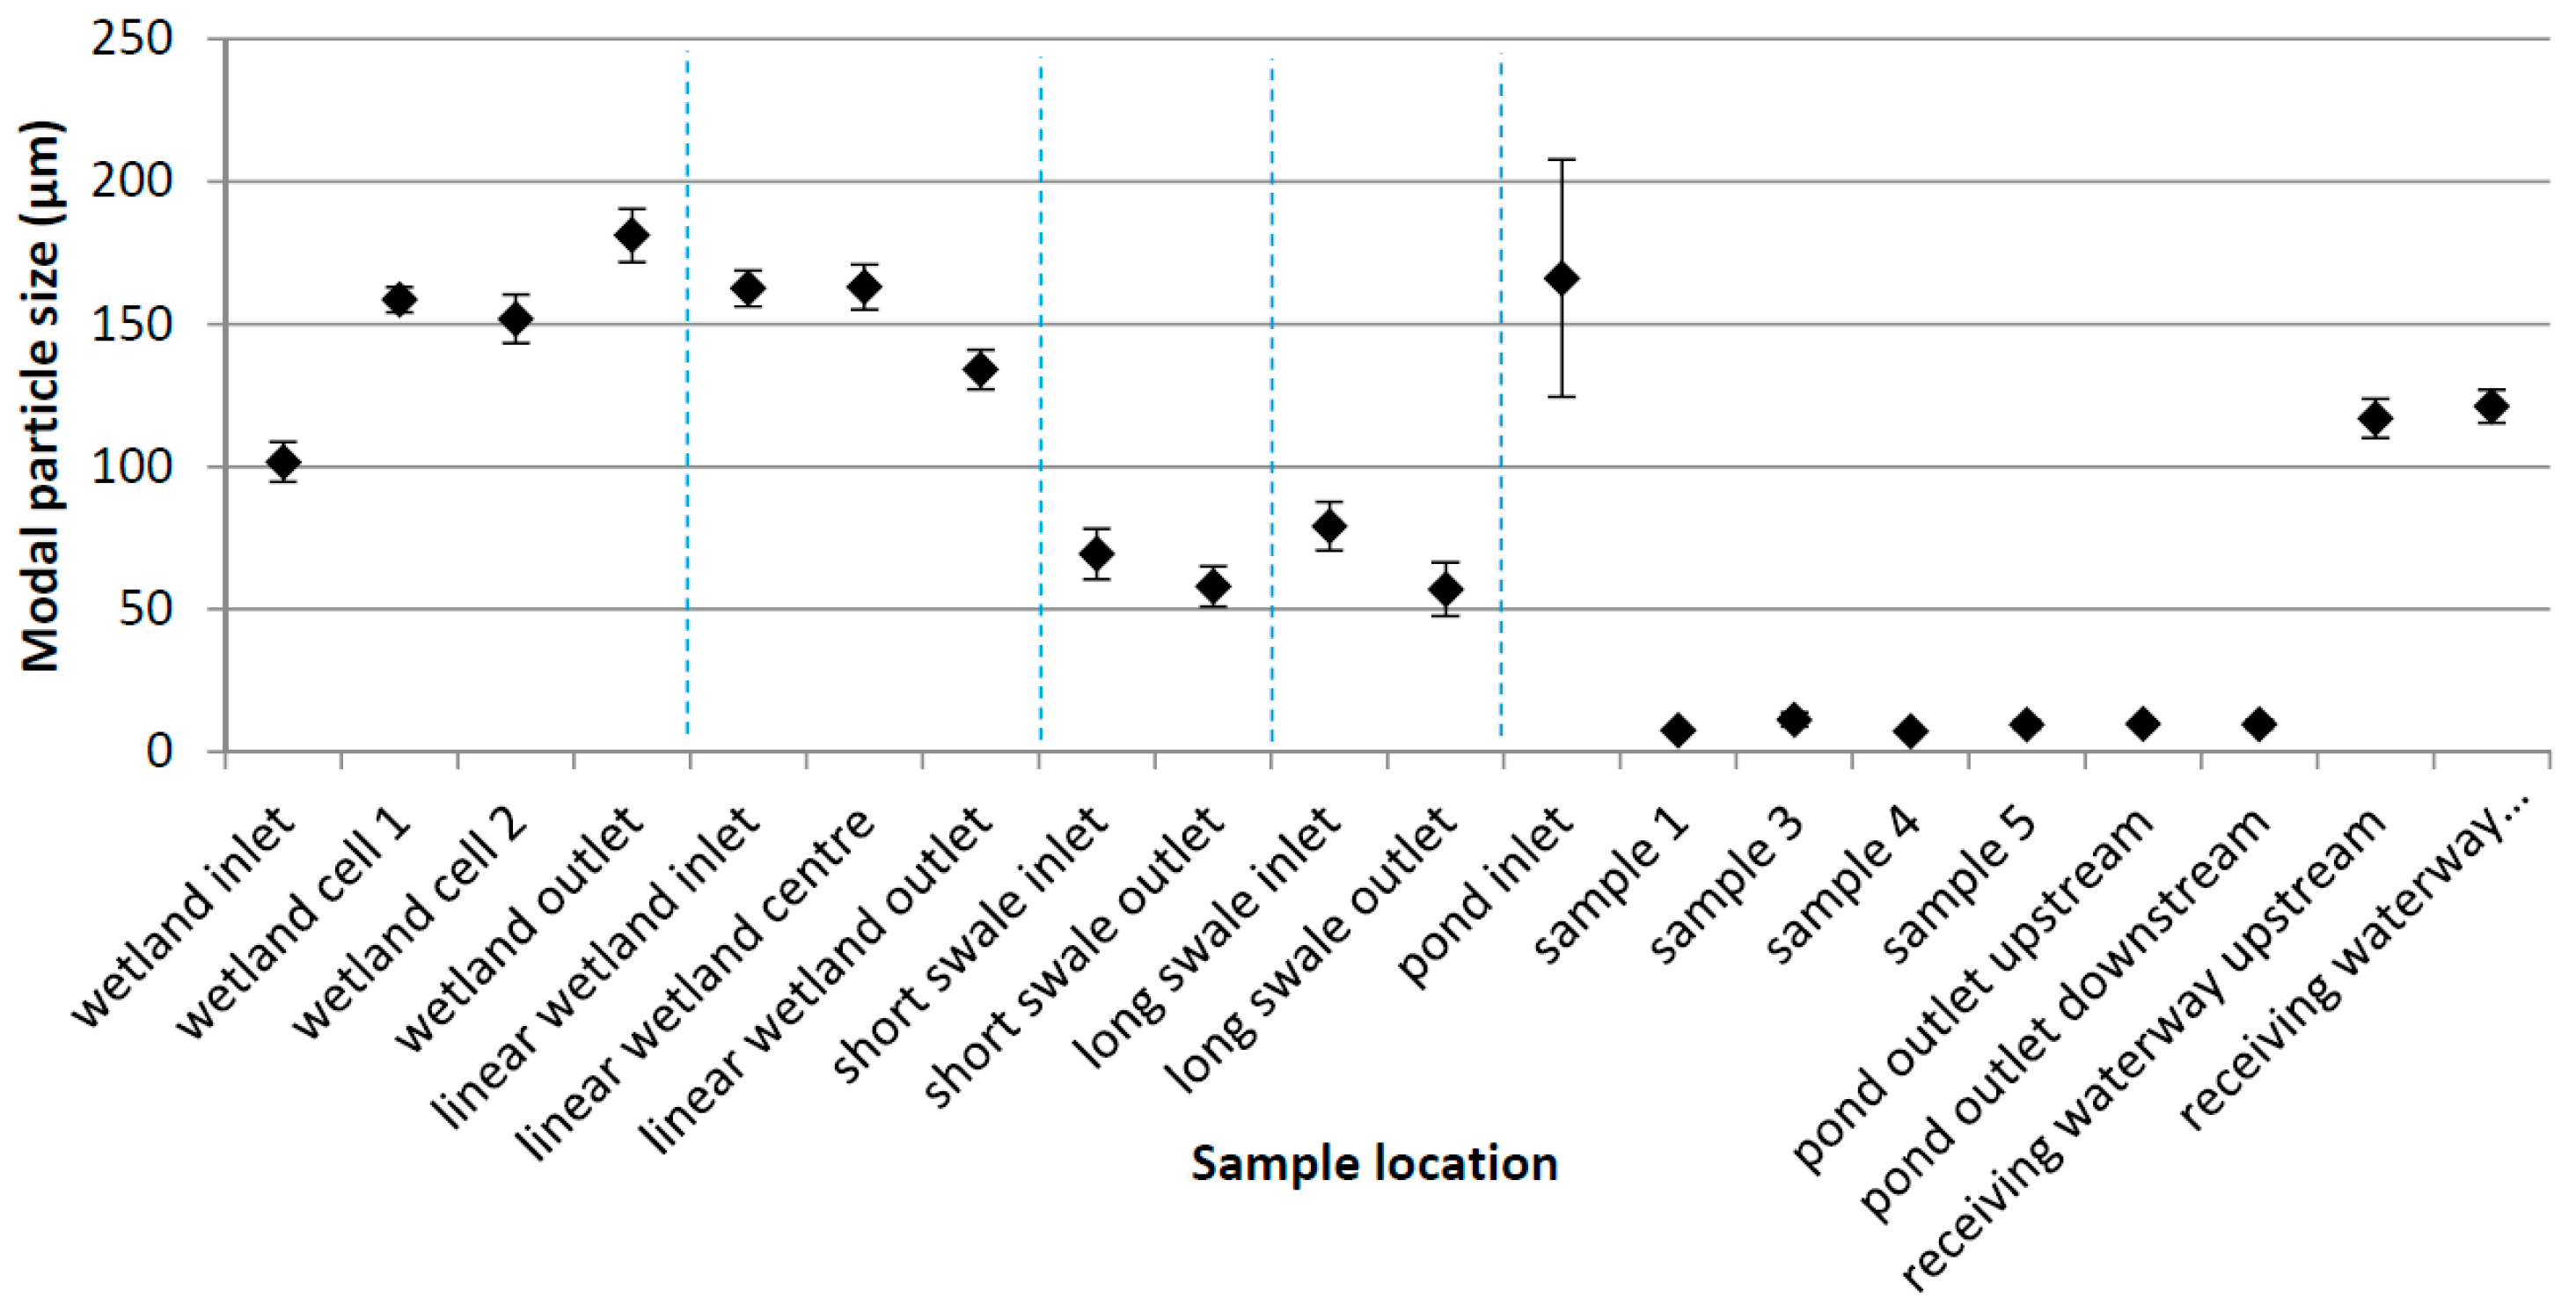
In conjunction with deposited sediment contamination concentration analysis and investigated SuDS asset deposition, the modal particle size of deposited sediment was also analysed. The average (and standard deviation) values for each sample location are presented in
Figure 4.
All samples illustrated a monodisperse (unimodal) result with a well-defined modal particle size range found within each sample. Within the wetland, bed deposition particle size is found to be finest at the inlet and between 151 and 181 μm across the remainder of the wetland. The fine sediment deposition found at the wetland inlet may correlate to higher general deposition (
Figure 3) and the turbulent flow supportive of larger sediment (re-) entrainment and suspension. The bed deposition maximum particle size increases up to 300 μm. This suggests that the fraction below 30 μm is mobile and subject to deposition—re-entrainment within and through the wetland asset. In general, the wetland detained a greater quantity of larger (>100 μm) sediment particles than smaller ones, effectively shifting the modal particle size and particle size distribution down (towards 0.45 μm). The wetland functions to decrease the overall quantity of larger sediment conveyed downstream, with a lesser impact on the conveyance of fine (clay sized) particles.
Bed deposits in the linear wetland show a distinct gradual inverse relationship between grain size and distance from inlet. The decrease in modal particle size of deposited material in the linear wetland moving downstream is potentially due to (increasing) aggregation of clay and silt (cohesive) particles along the flow path and thus deposition of aggregated cohesive sediment further through the linear wetland. This does suggest that the linear wetland functions as an effective fine sediment filter.
The short and long swale illustrates a decrease in modal particle size between inlet and outlet. The decrease in modal particle size is from an average of 69 to 57 μm in the short swale and 79 to 56 μm in the long swale. The decrease in modal particle size may be due the efficiency of short vegetation and a shallow flow depth through the swale resulting in effective vegetation filtration of fine sediment. It may also result from cohesive particle aggregation and settling resulting in greater individual particle fine sediment deposition down the swale flow path.
Within the pond, larger modal particle sizes are found deposited adjacent to the pond inlet. The central pond flow path, samples 1-pond outlet upstream, all illustrate notably smaller modal particle sizes (below 40 µm). The pond is highly effective at detaining fine, clay sized, particles. This may be partly due to the higher clay fraction in the supply and the controlled outlet design.
3.5. Correlation of Deposited Sediment Contamination Concentration, Modal Particle Size and Depostion Mass
Contaminant concentration of deposited sediment was correlated to deposited sediment particle size and the quantity of sediment deposited during the monitoring period. Pearson’s correlation analysis was completed for each asset, comparing the deposition at each location and modal particle size (
Figure 3 and
Figure 4) to contaminant concentrations (
Figure 2). The correlation results are presented in
Table 7, and illustrate the overall correlation results for each asset. It should be noted that all strong correlations illustrated a
p < 0.05.
Overall, sediment contaminant concentration is found to correlate strongly with modal particle size and deposition rate in the wetland and linear wetland, but correlation results are not strong in the swales or pond. In general, greater deposition and smaller modal particle size are found to correlate to higher sediment contaminant concentration. Modal particle size is strongly correlated (for a few contaminants) to contaminant concentration in the short swale and pond (both assets show strong correlations for Mg, but also for numerous different additional contaminants). Thus, modal particle size is found to have a more widespread strong correlation to sediment contaminant concentrations than deposition rate. This result falls in line with published contamination theory and research, such as Forstner and Wittmann [
39].
The long swale shows no strong correlations, suggesting this asset’s sediment contaminant concentrations are perhaps driven by more complex factors such as inflow concentration, d10 or d90 particle size, long term deposition, location of the asset within the network, asset design (and potentially unmonitored parameters, such as erosion or vegetation maintenance) rather than any clearly dominant, single, parameter (modal particle size or short term deposition).
