Assessment of Flood Frequency Alteration by Dam Construction via SWAT Simulation
Abstract
:1. Introduction
2. Methodology
2.1. SWAT Model Description
2.2. Study Area
2.3. Approach for Flood Frequency Assessment
3. SWAT Modeling
3.1. Input Data and Model Preparation
3.2. Model Calibration and Validation
3.3. Model Results
4. Results and Discussion
4.1. Flood Frequency Analysis of the Observed and Simulated Daily Inflows
4.2. Influence of Regulated Flow by the Dam on Daily Flood Frequency
4.3. Influence of Regulated Flow by the Dam on the Hourly Flood Frequency
5. Conclusions
- (1)
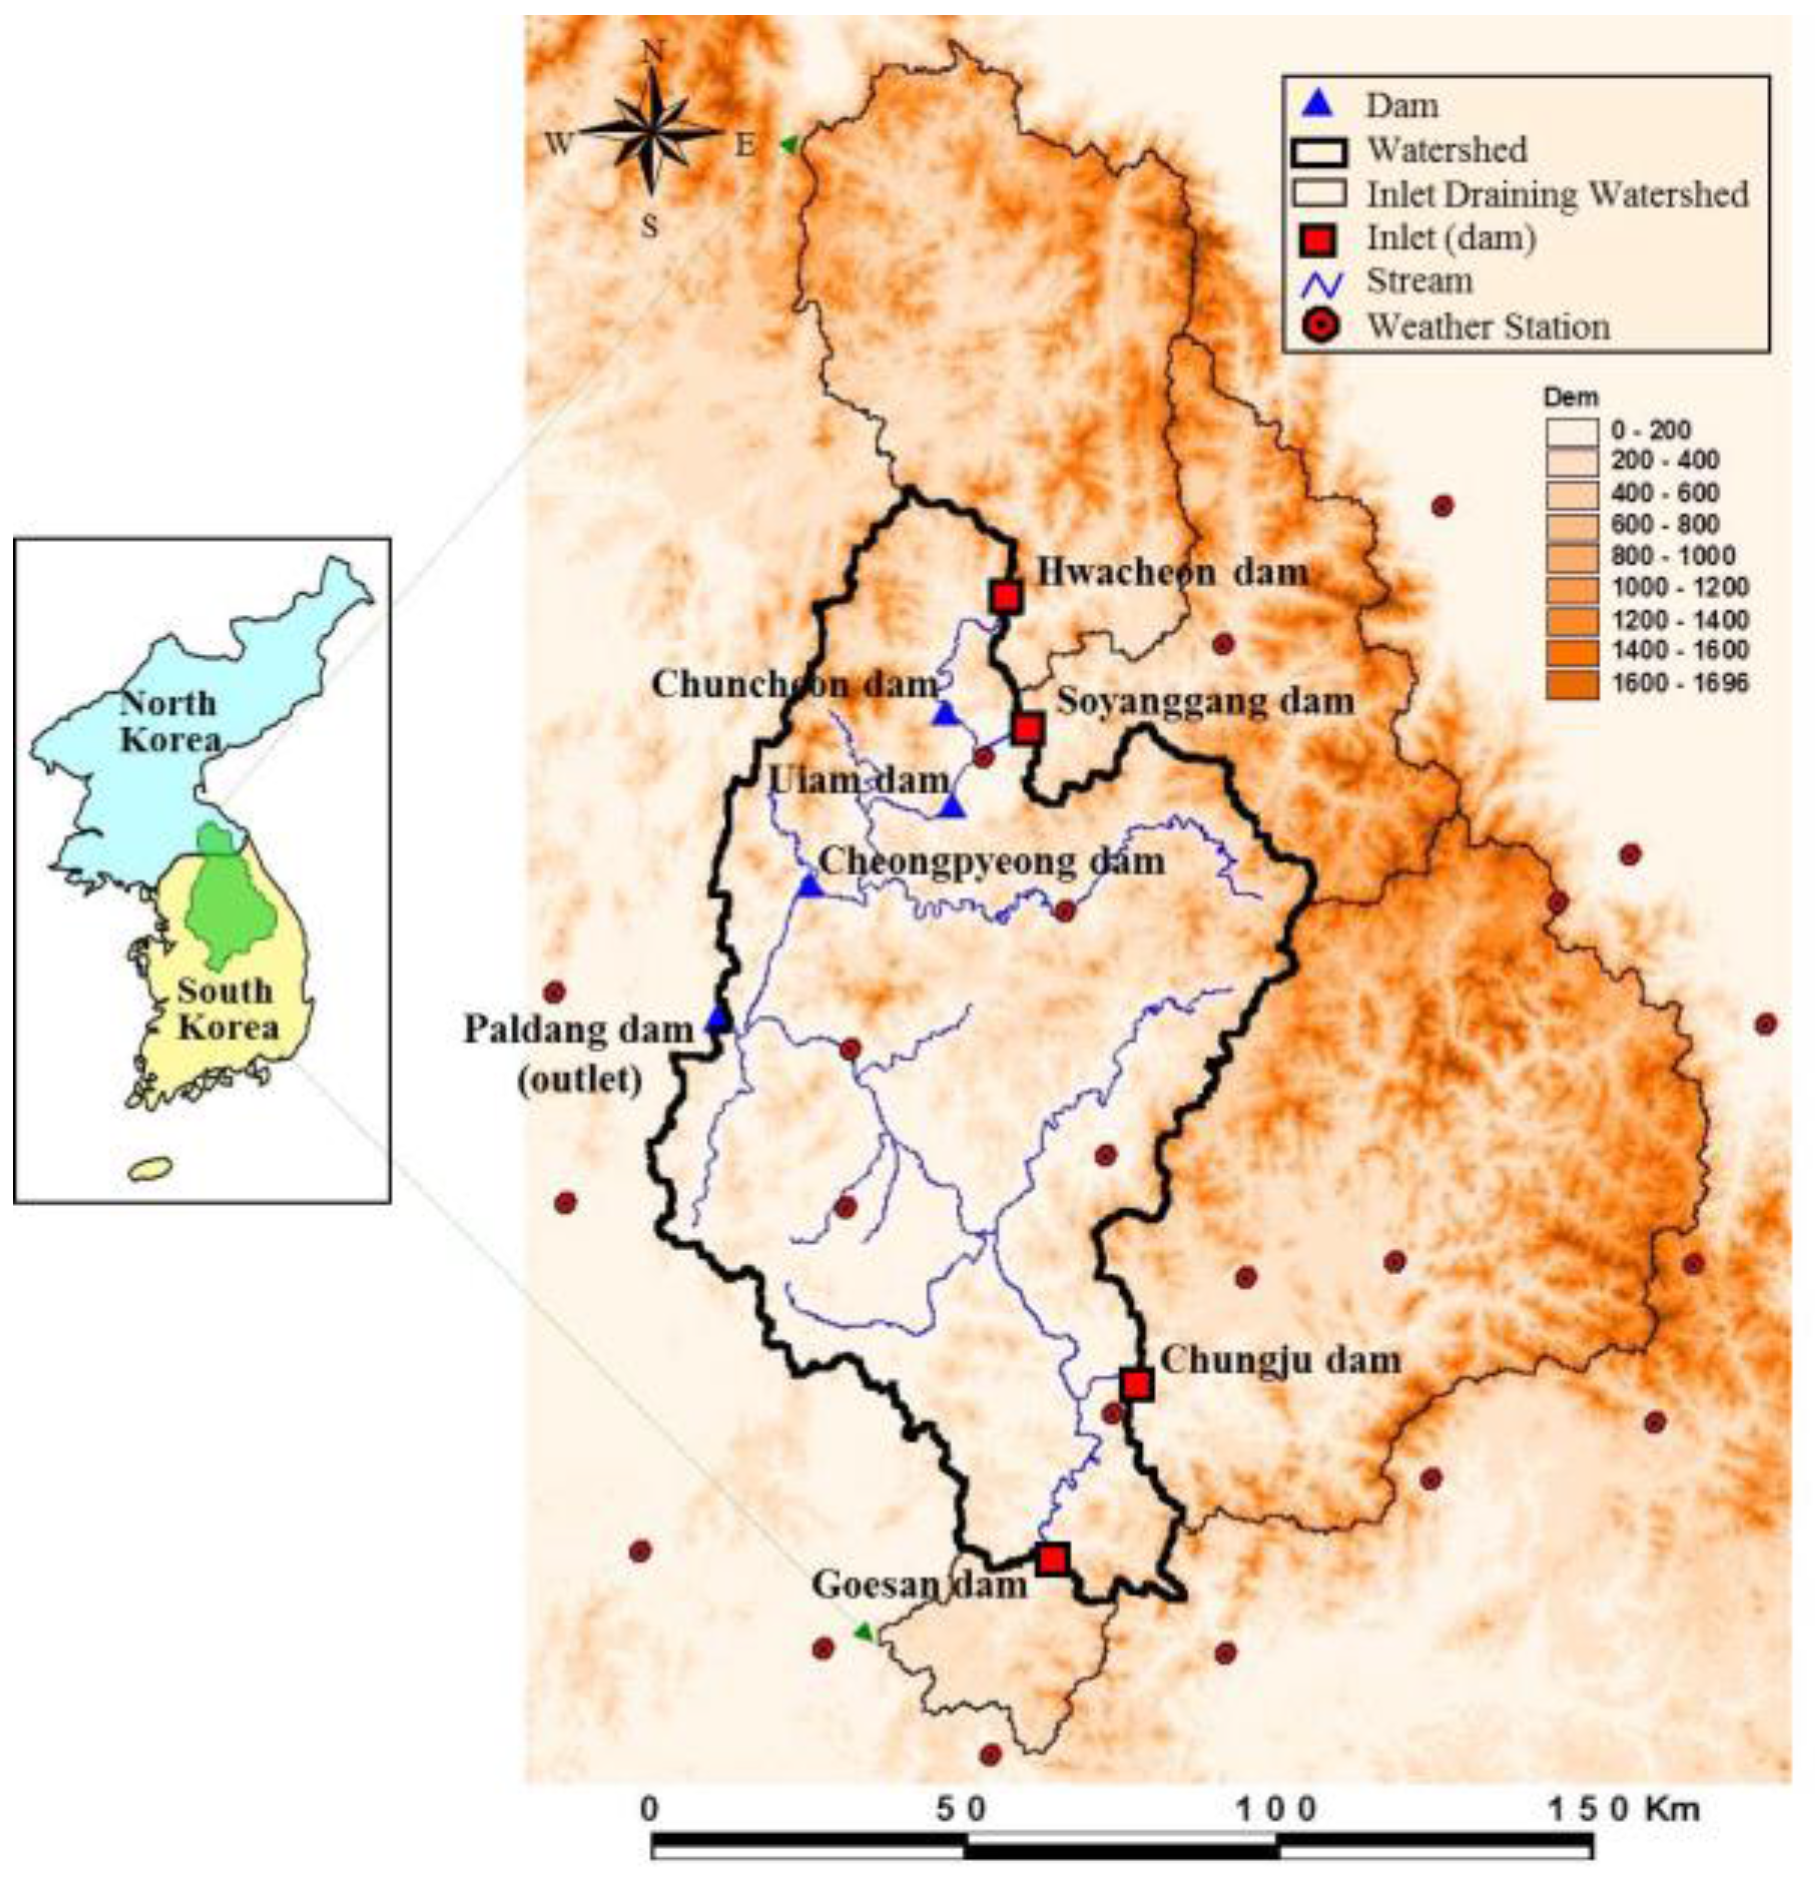
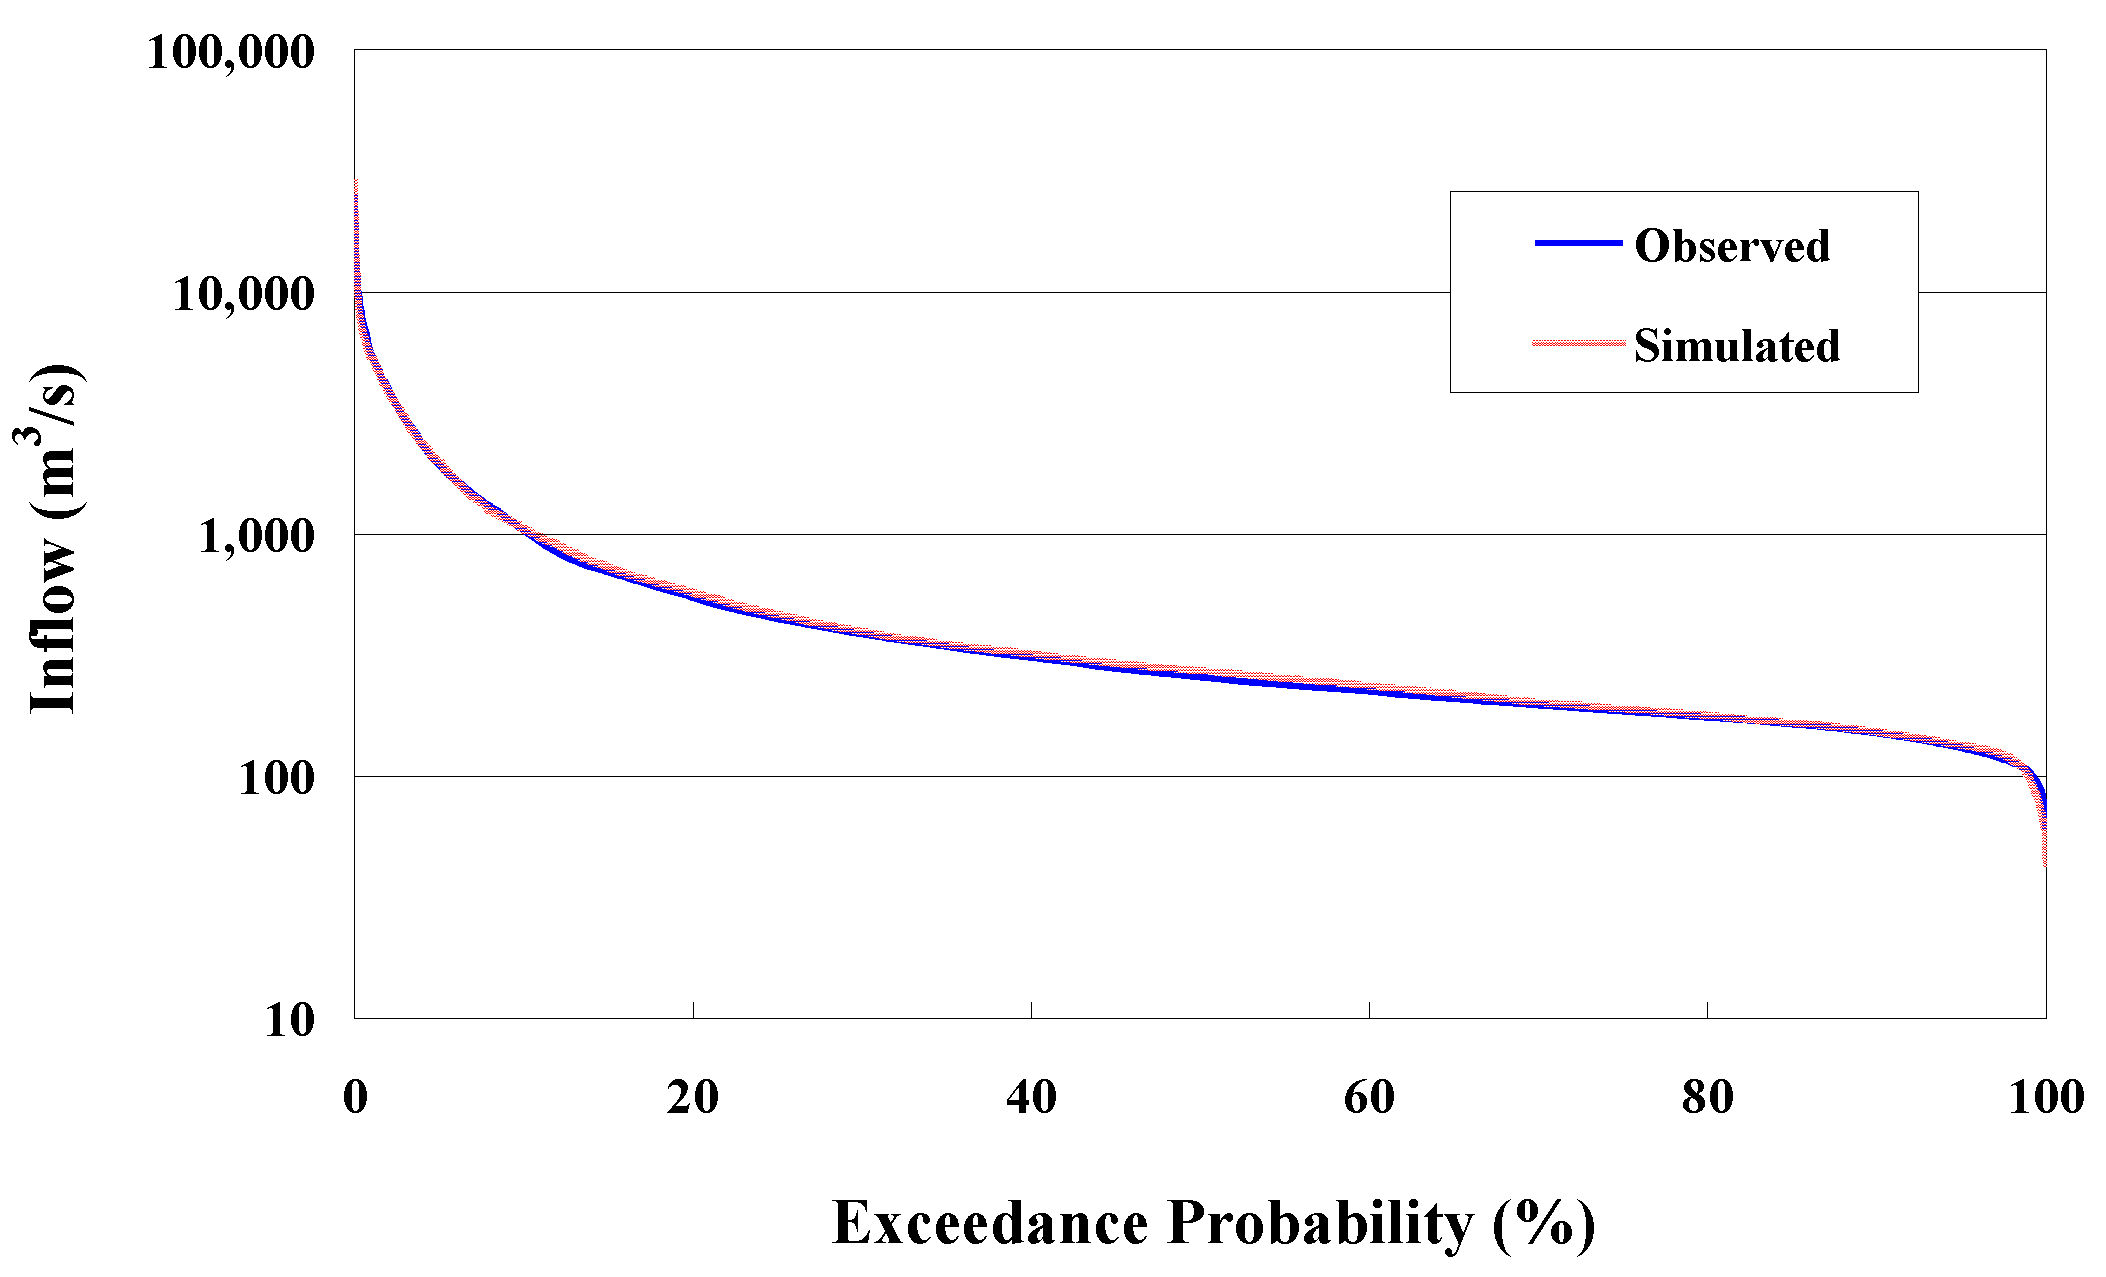
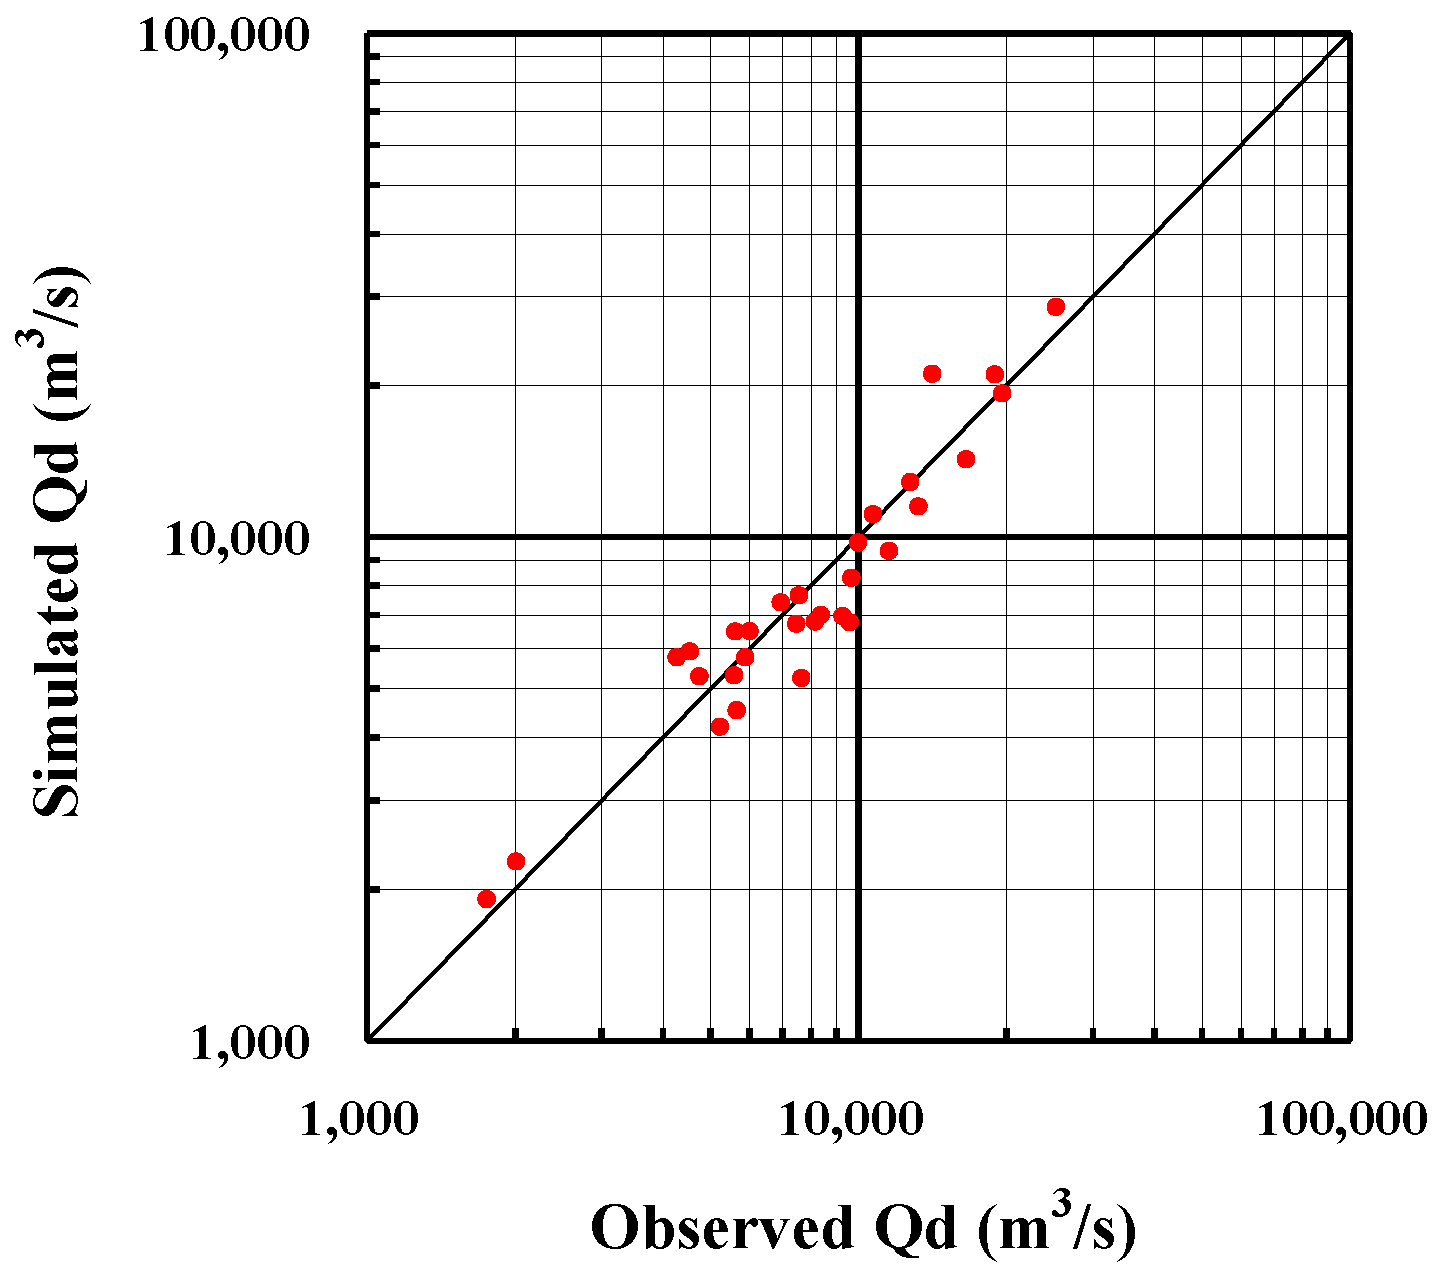
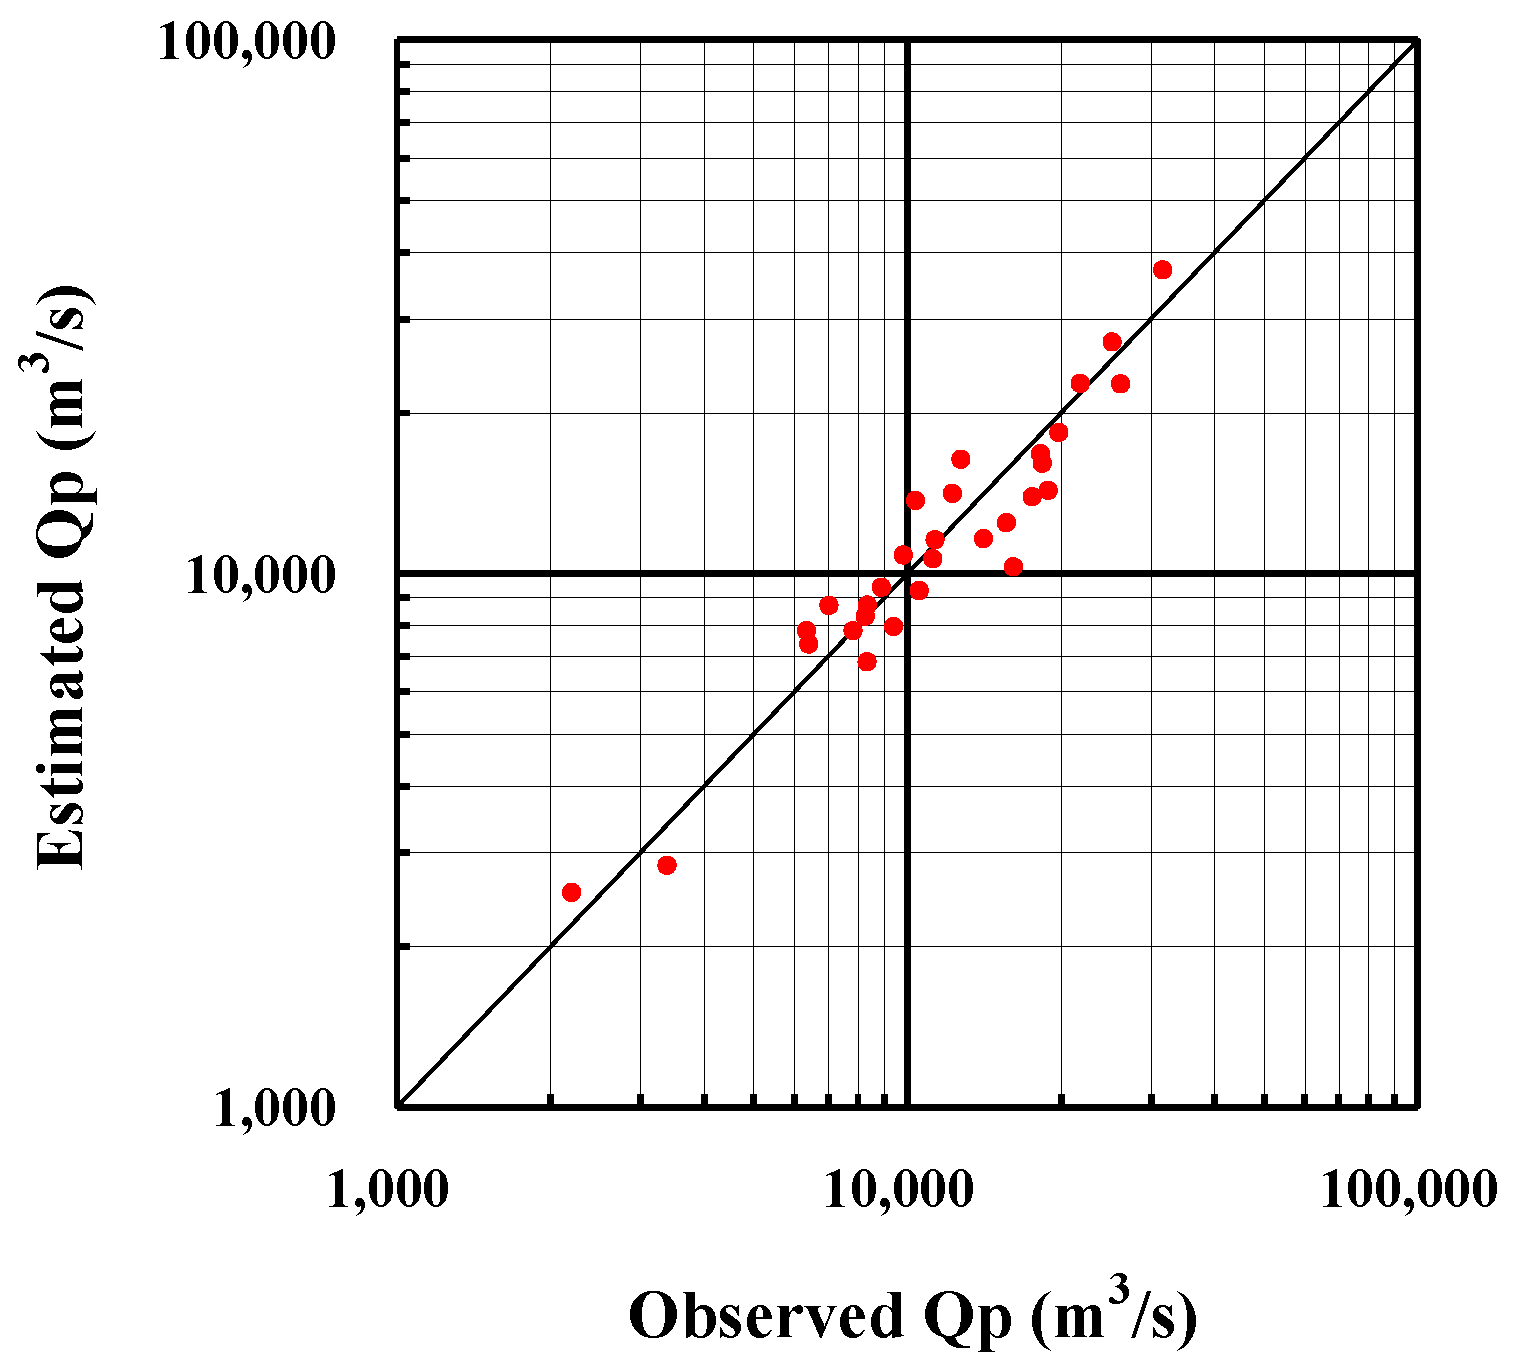
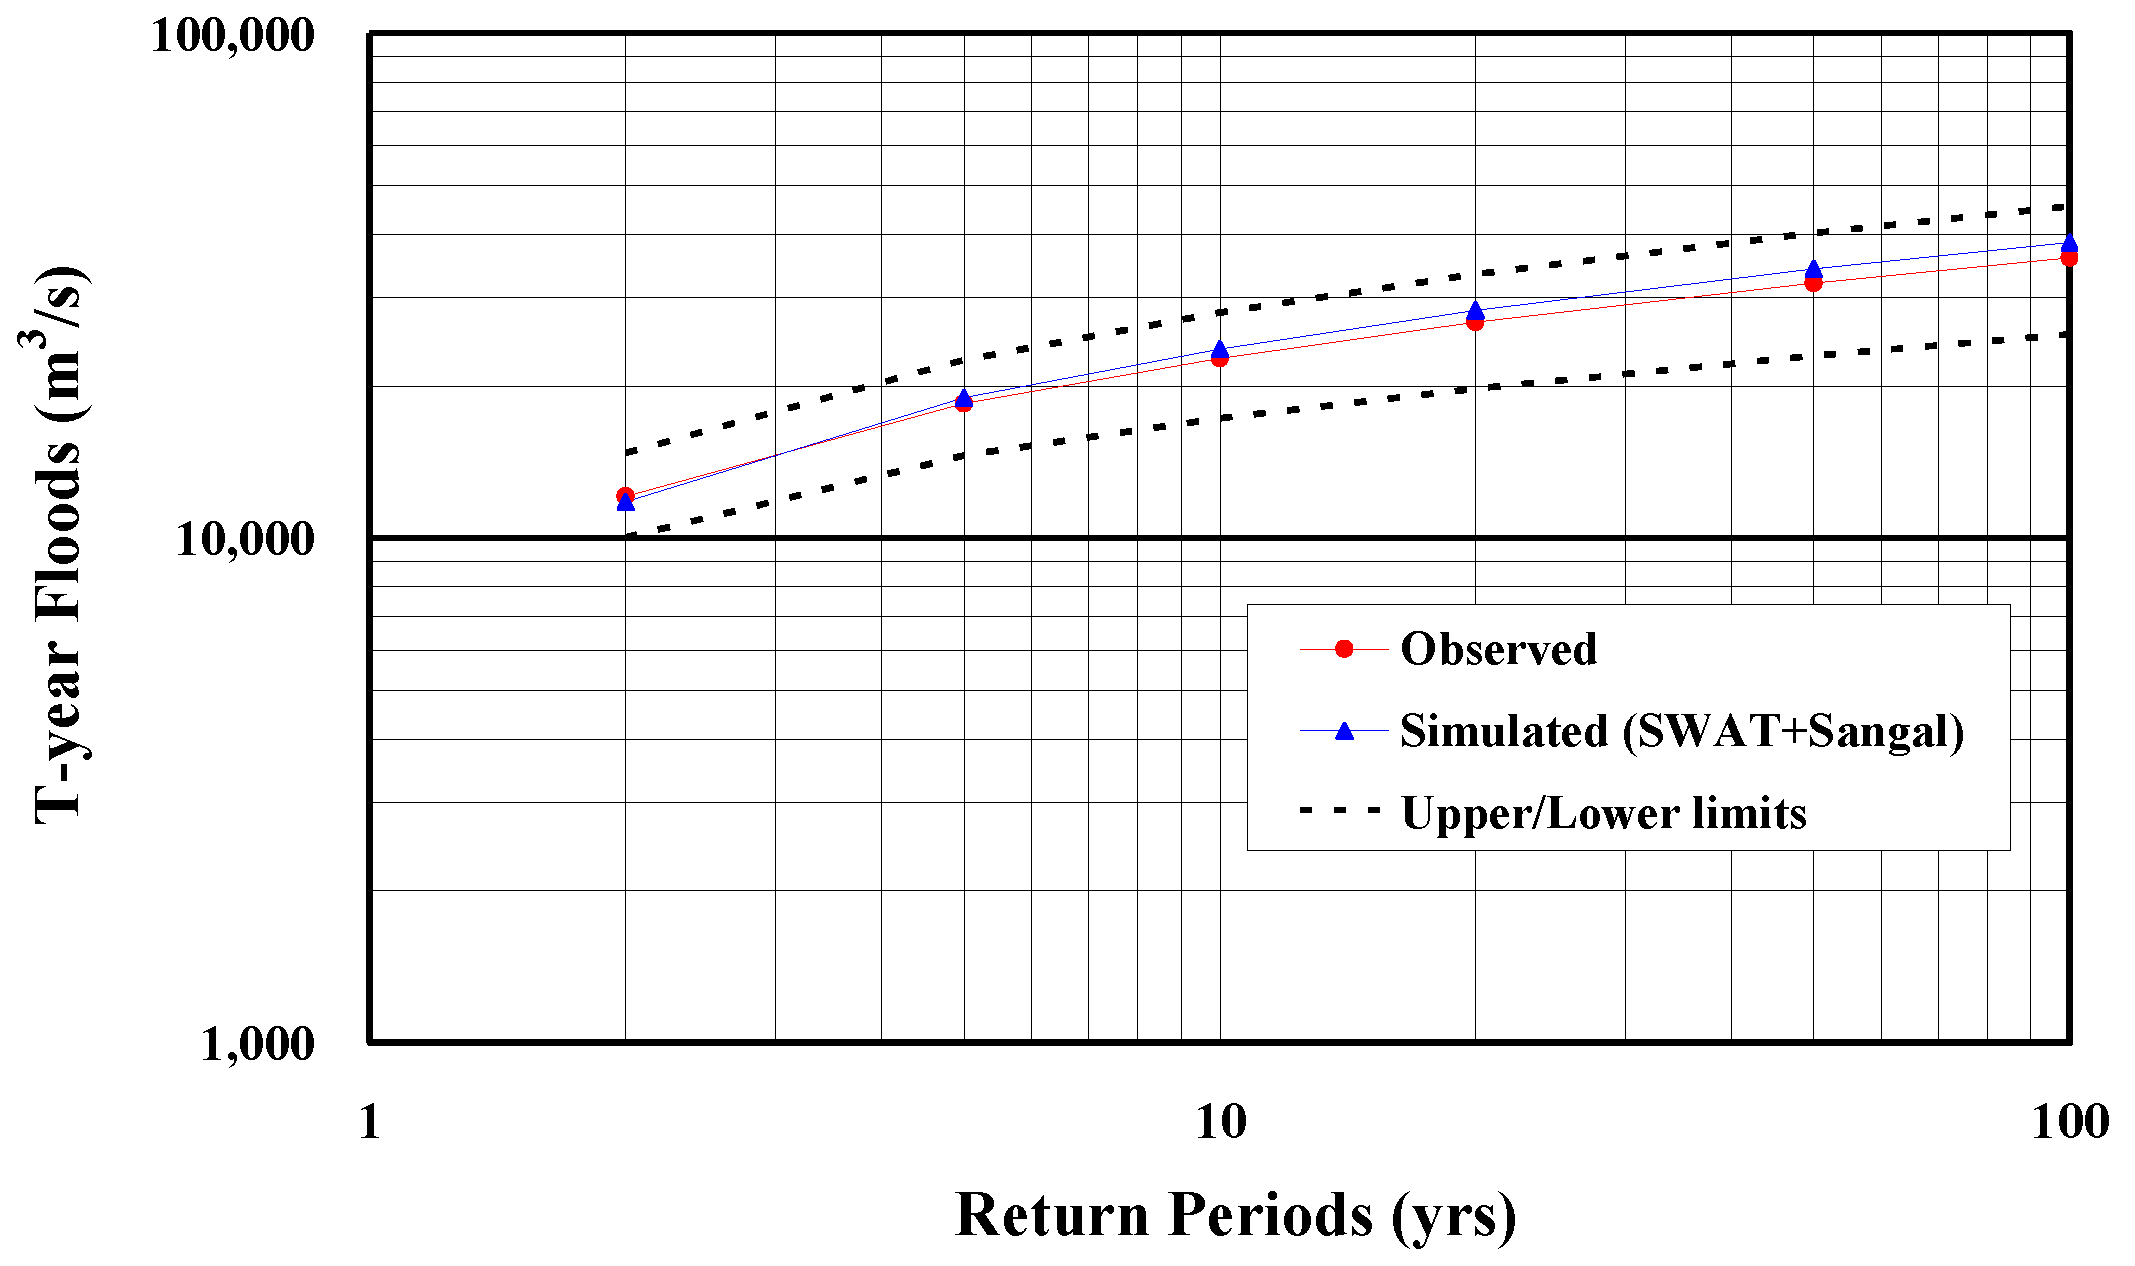
- A comparison of the simulated daily peak flows with the observed data indicated that the use of the SWAT model was suitable for estimating the flood frequency. A close correlation (R2 = 0.903, RMSE = 0.187 m3/s) between the daily flood estimates for the return periods of 2, 5, 10, 20, 50 and 100 years, computed from the observed and simulated daily inflows to the Paldang Dam, was achieved under the current condition, i.e., with the Soyanggang and Chungju dams in place.
- (2)
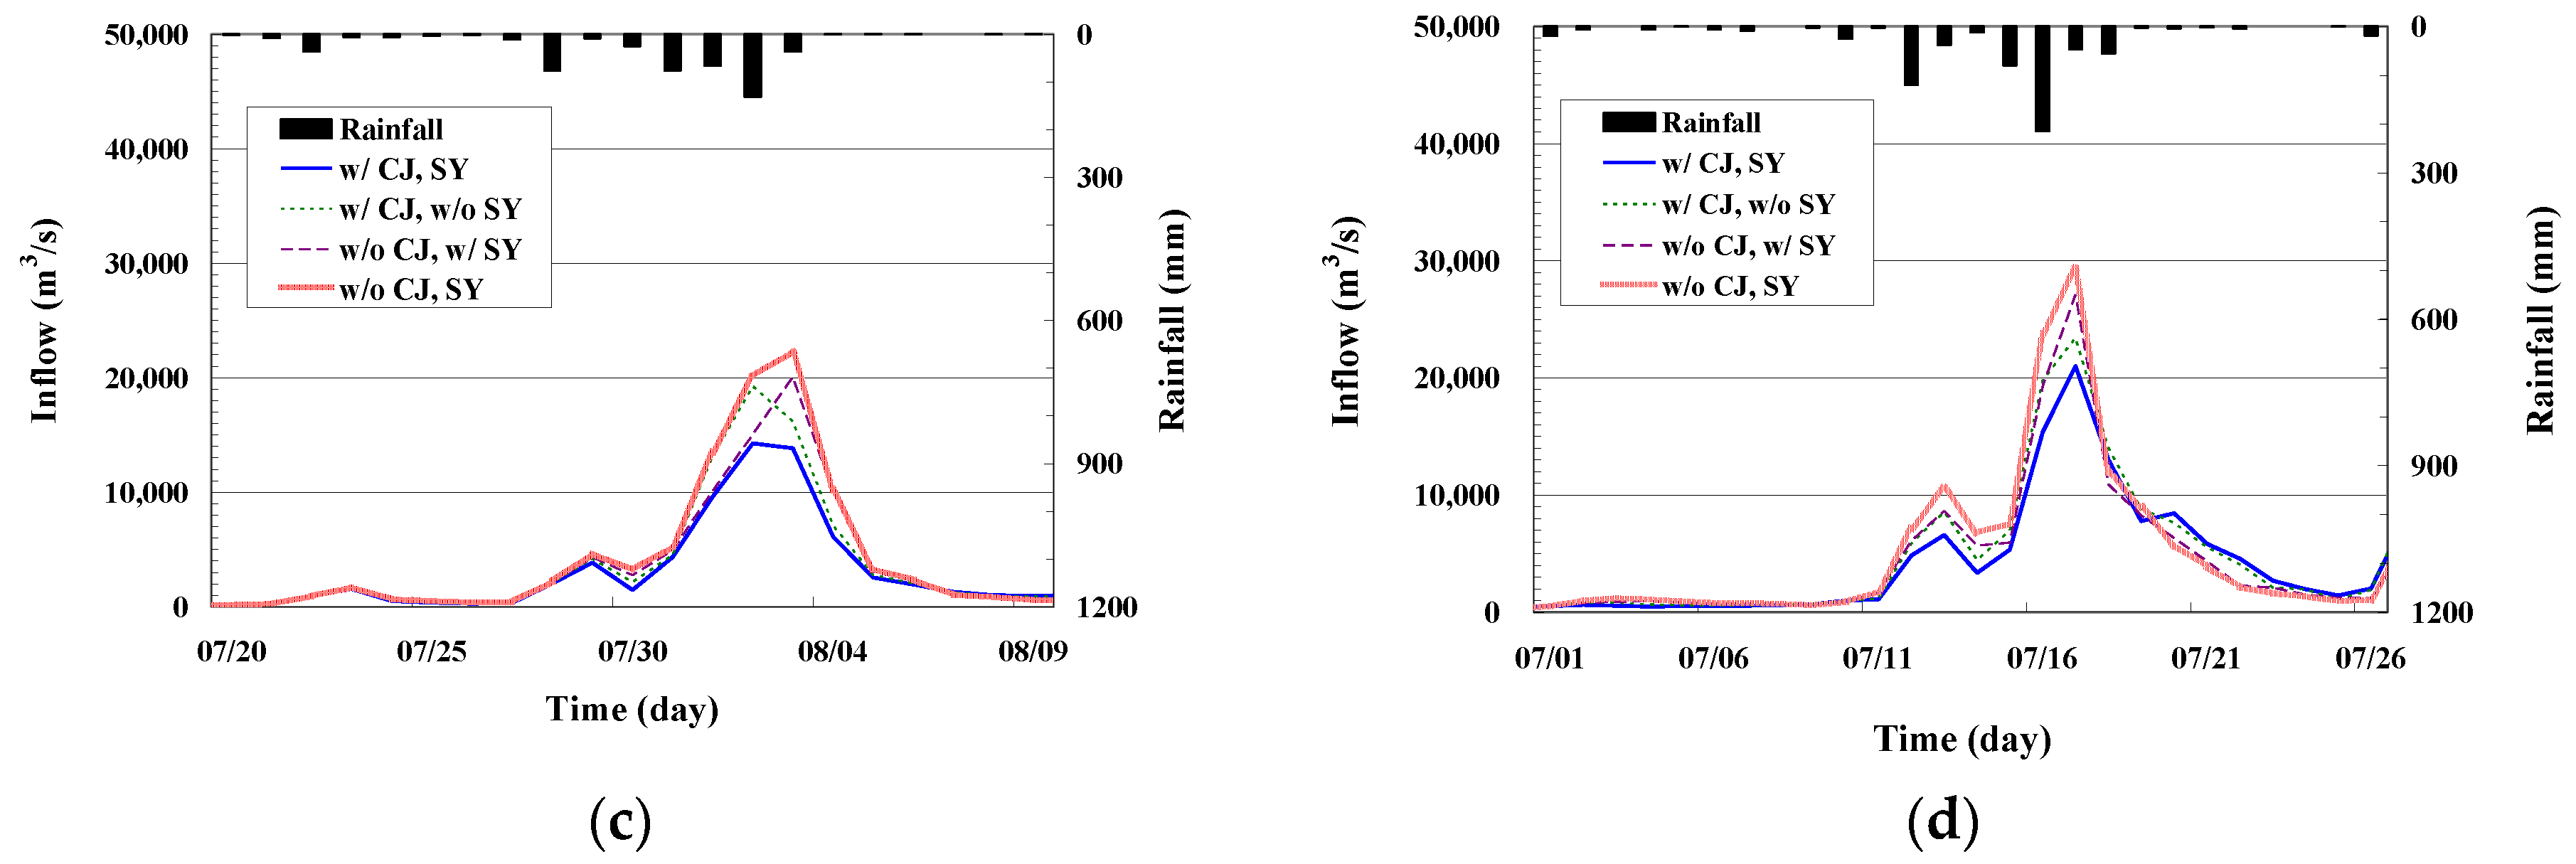
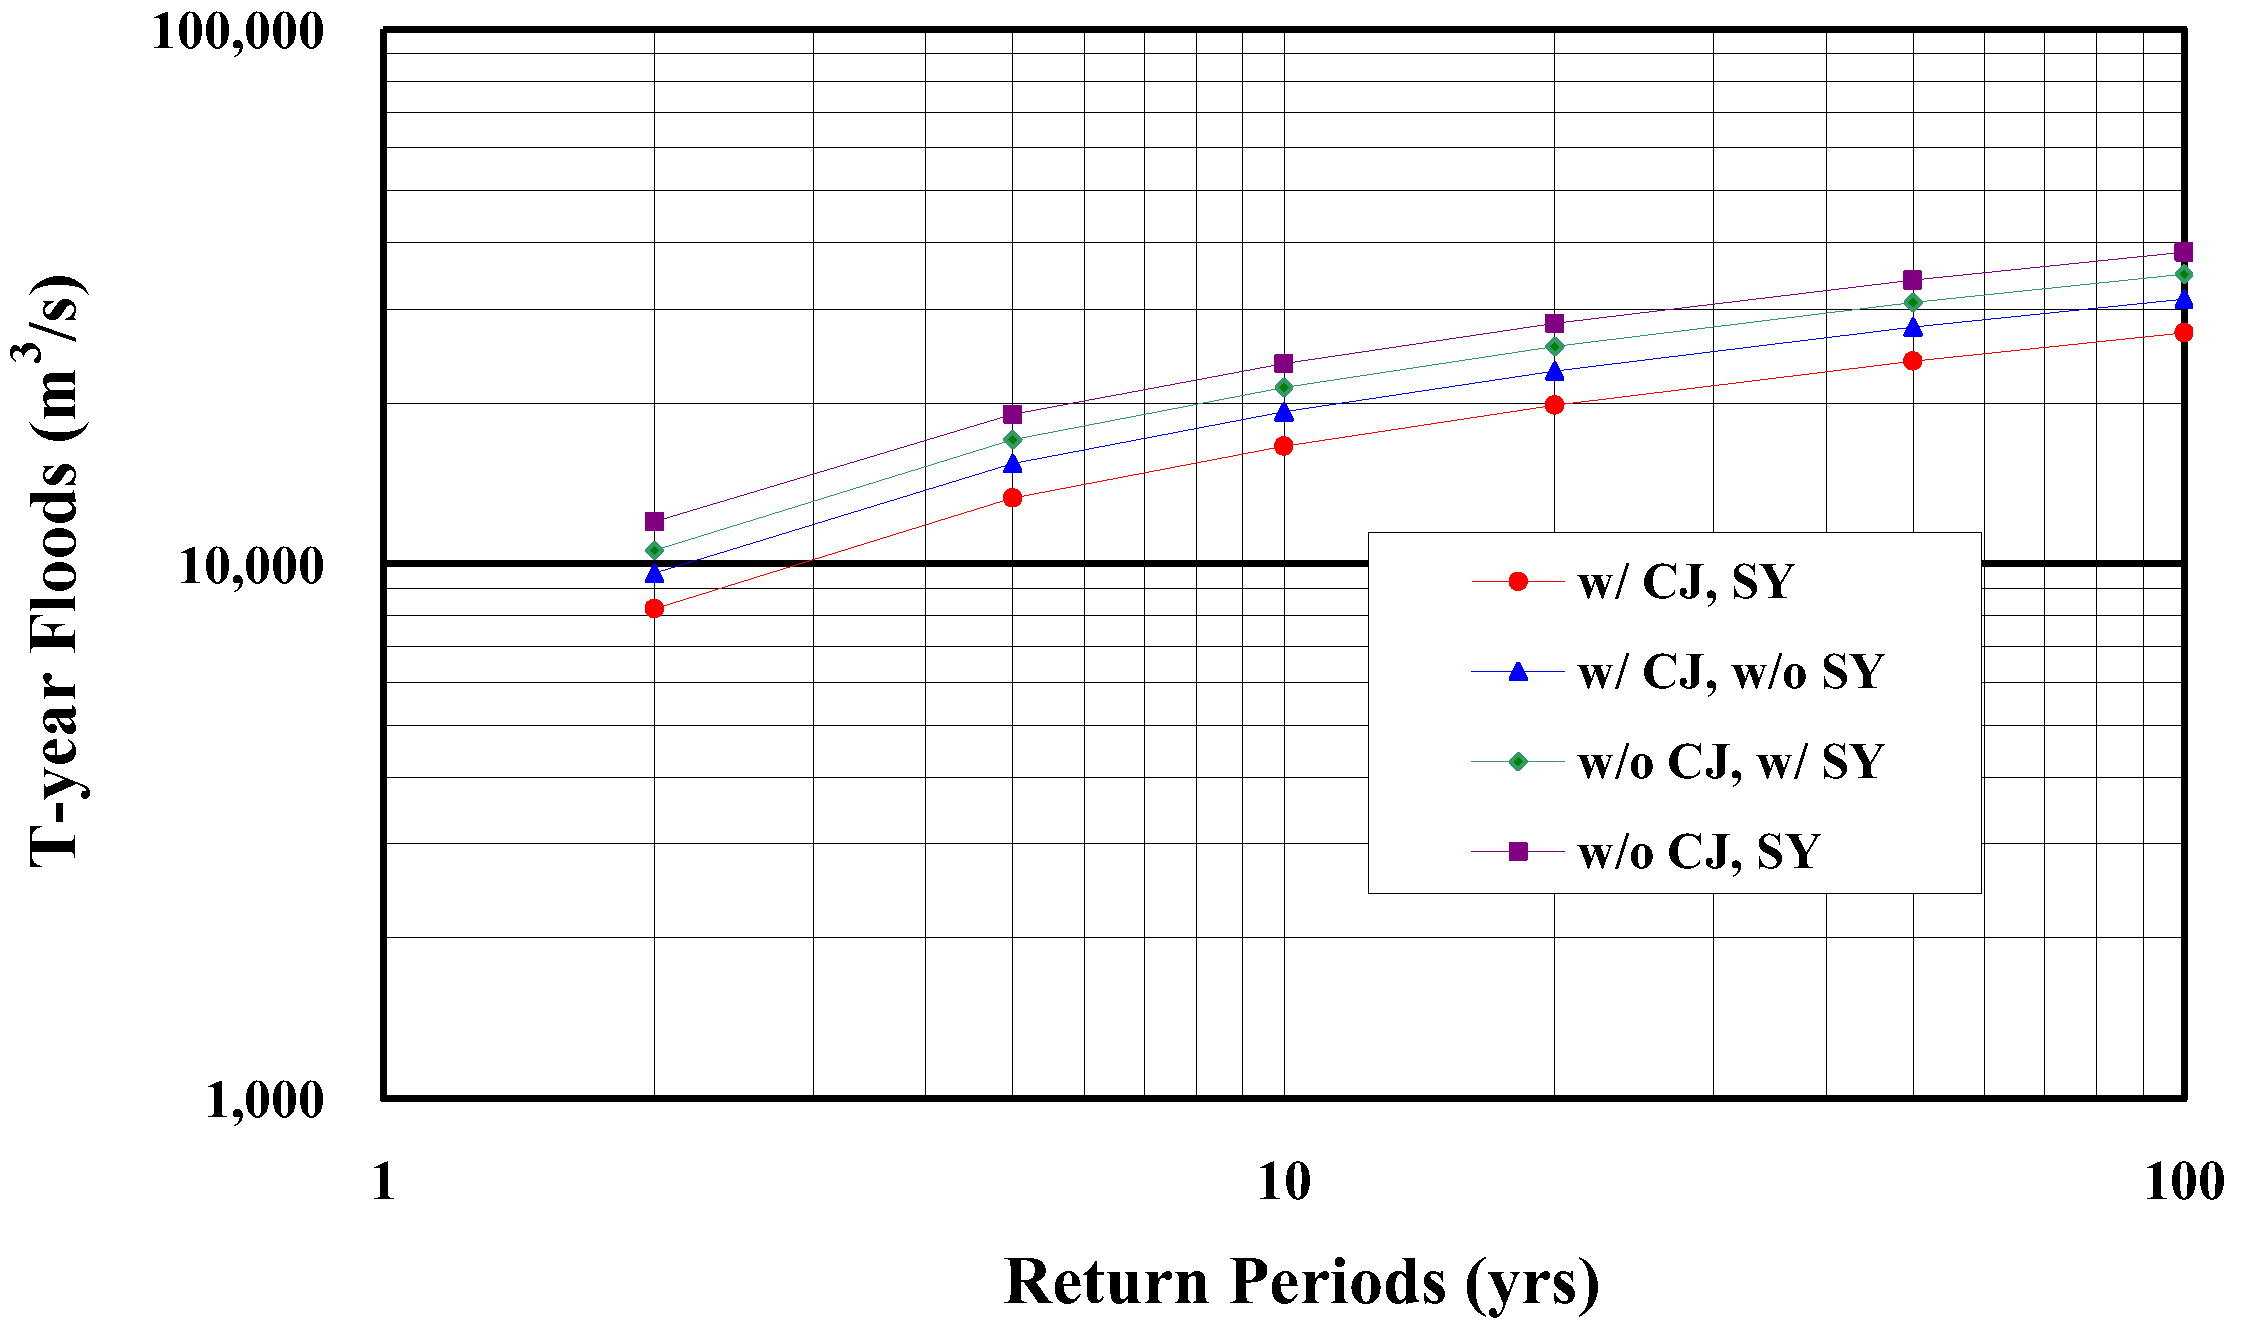
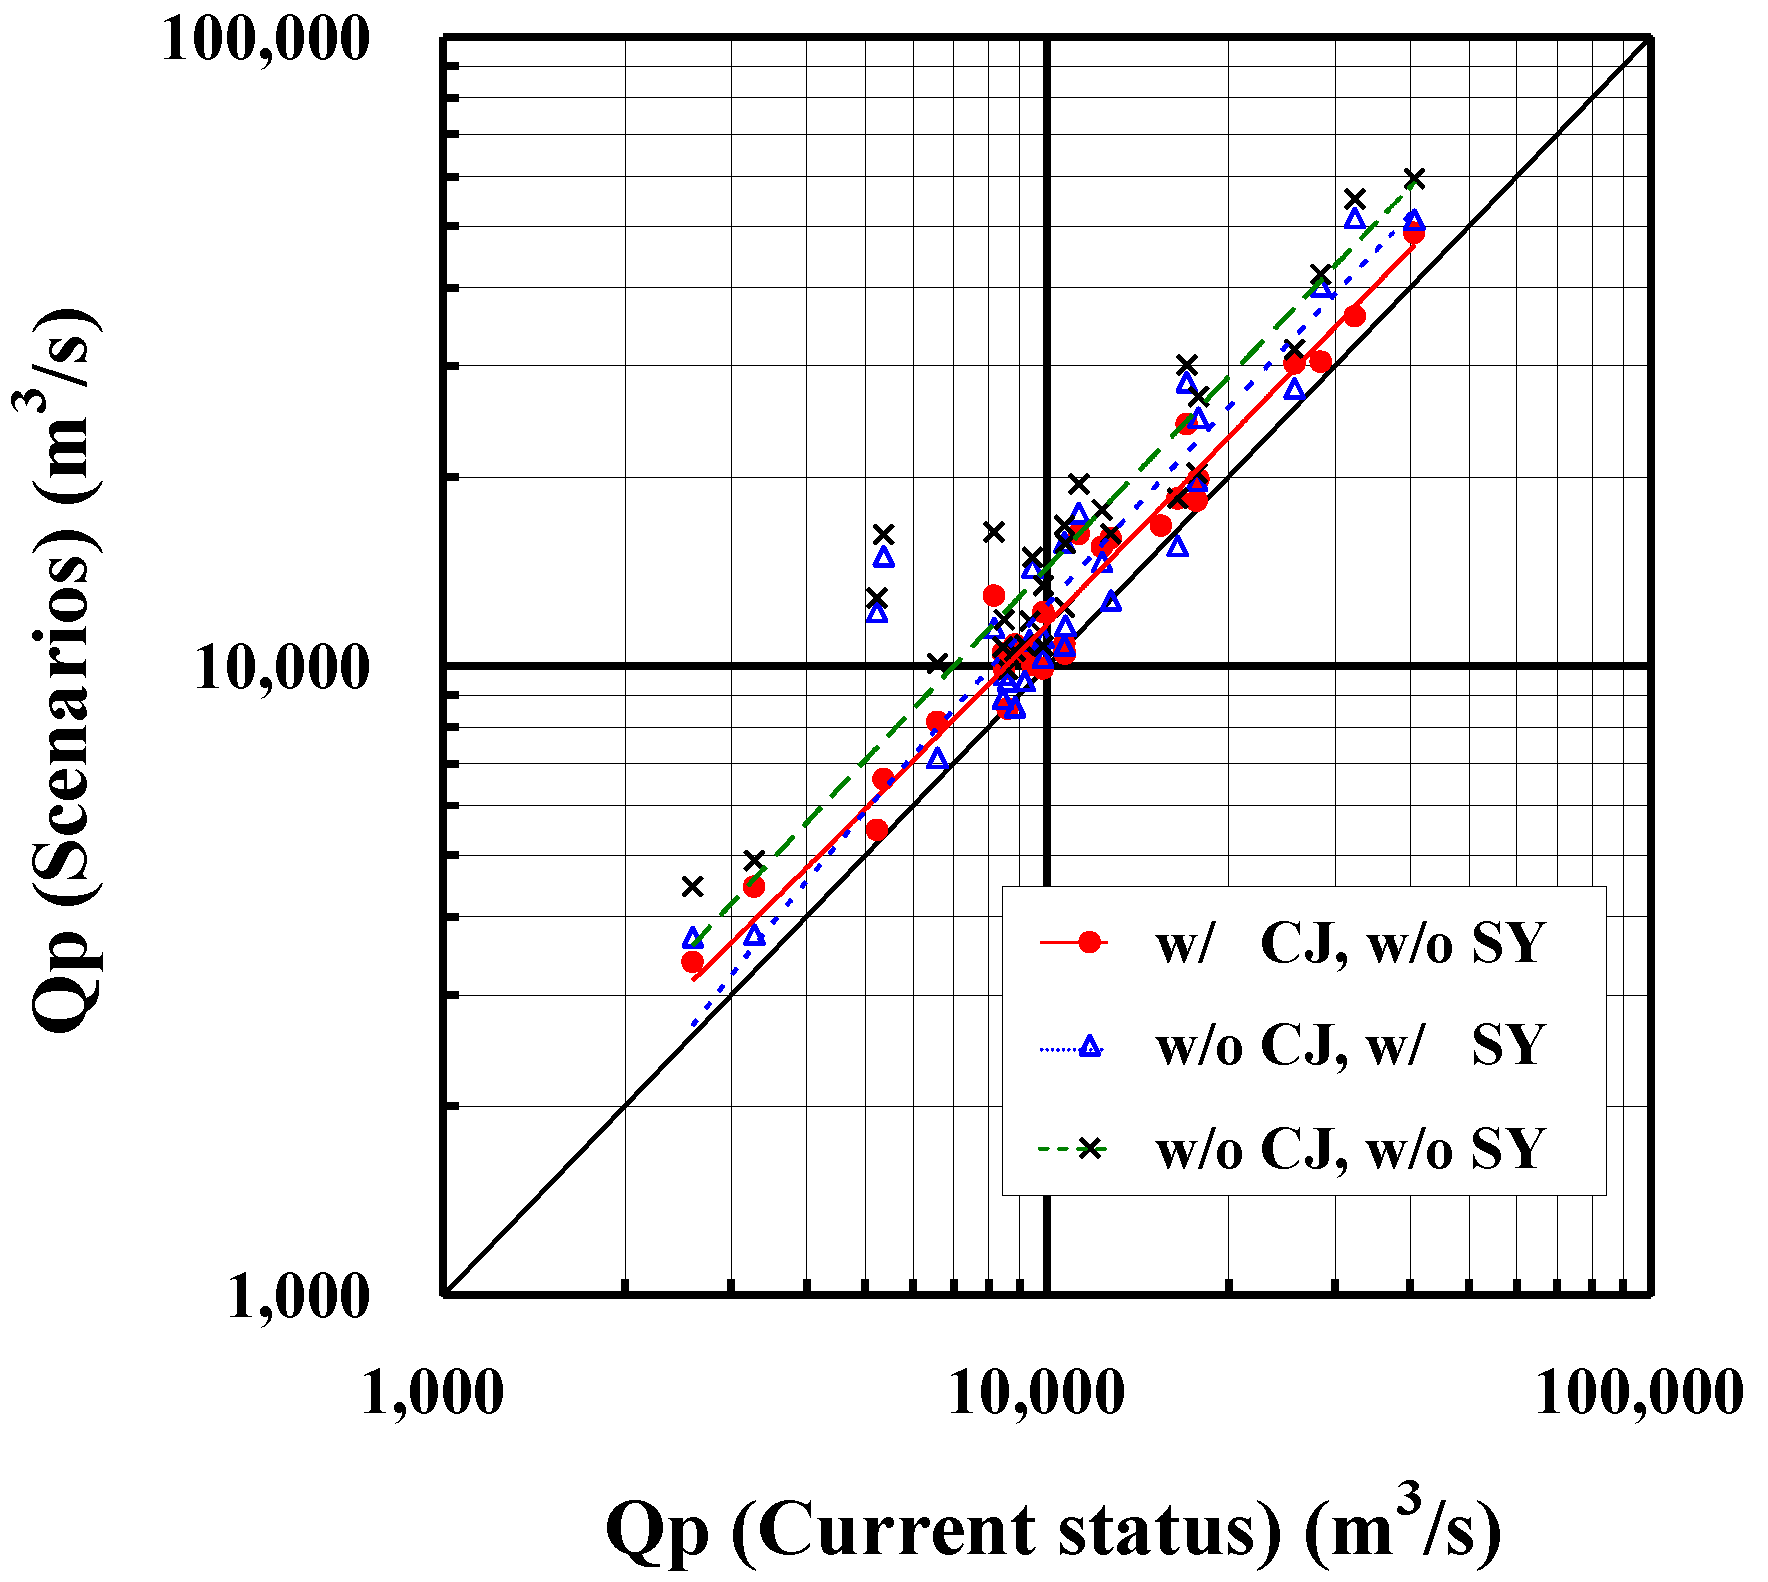
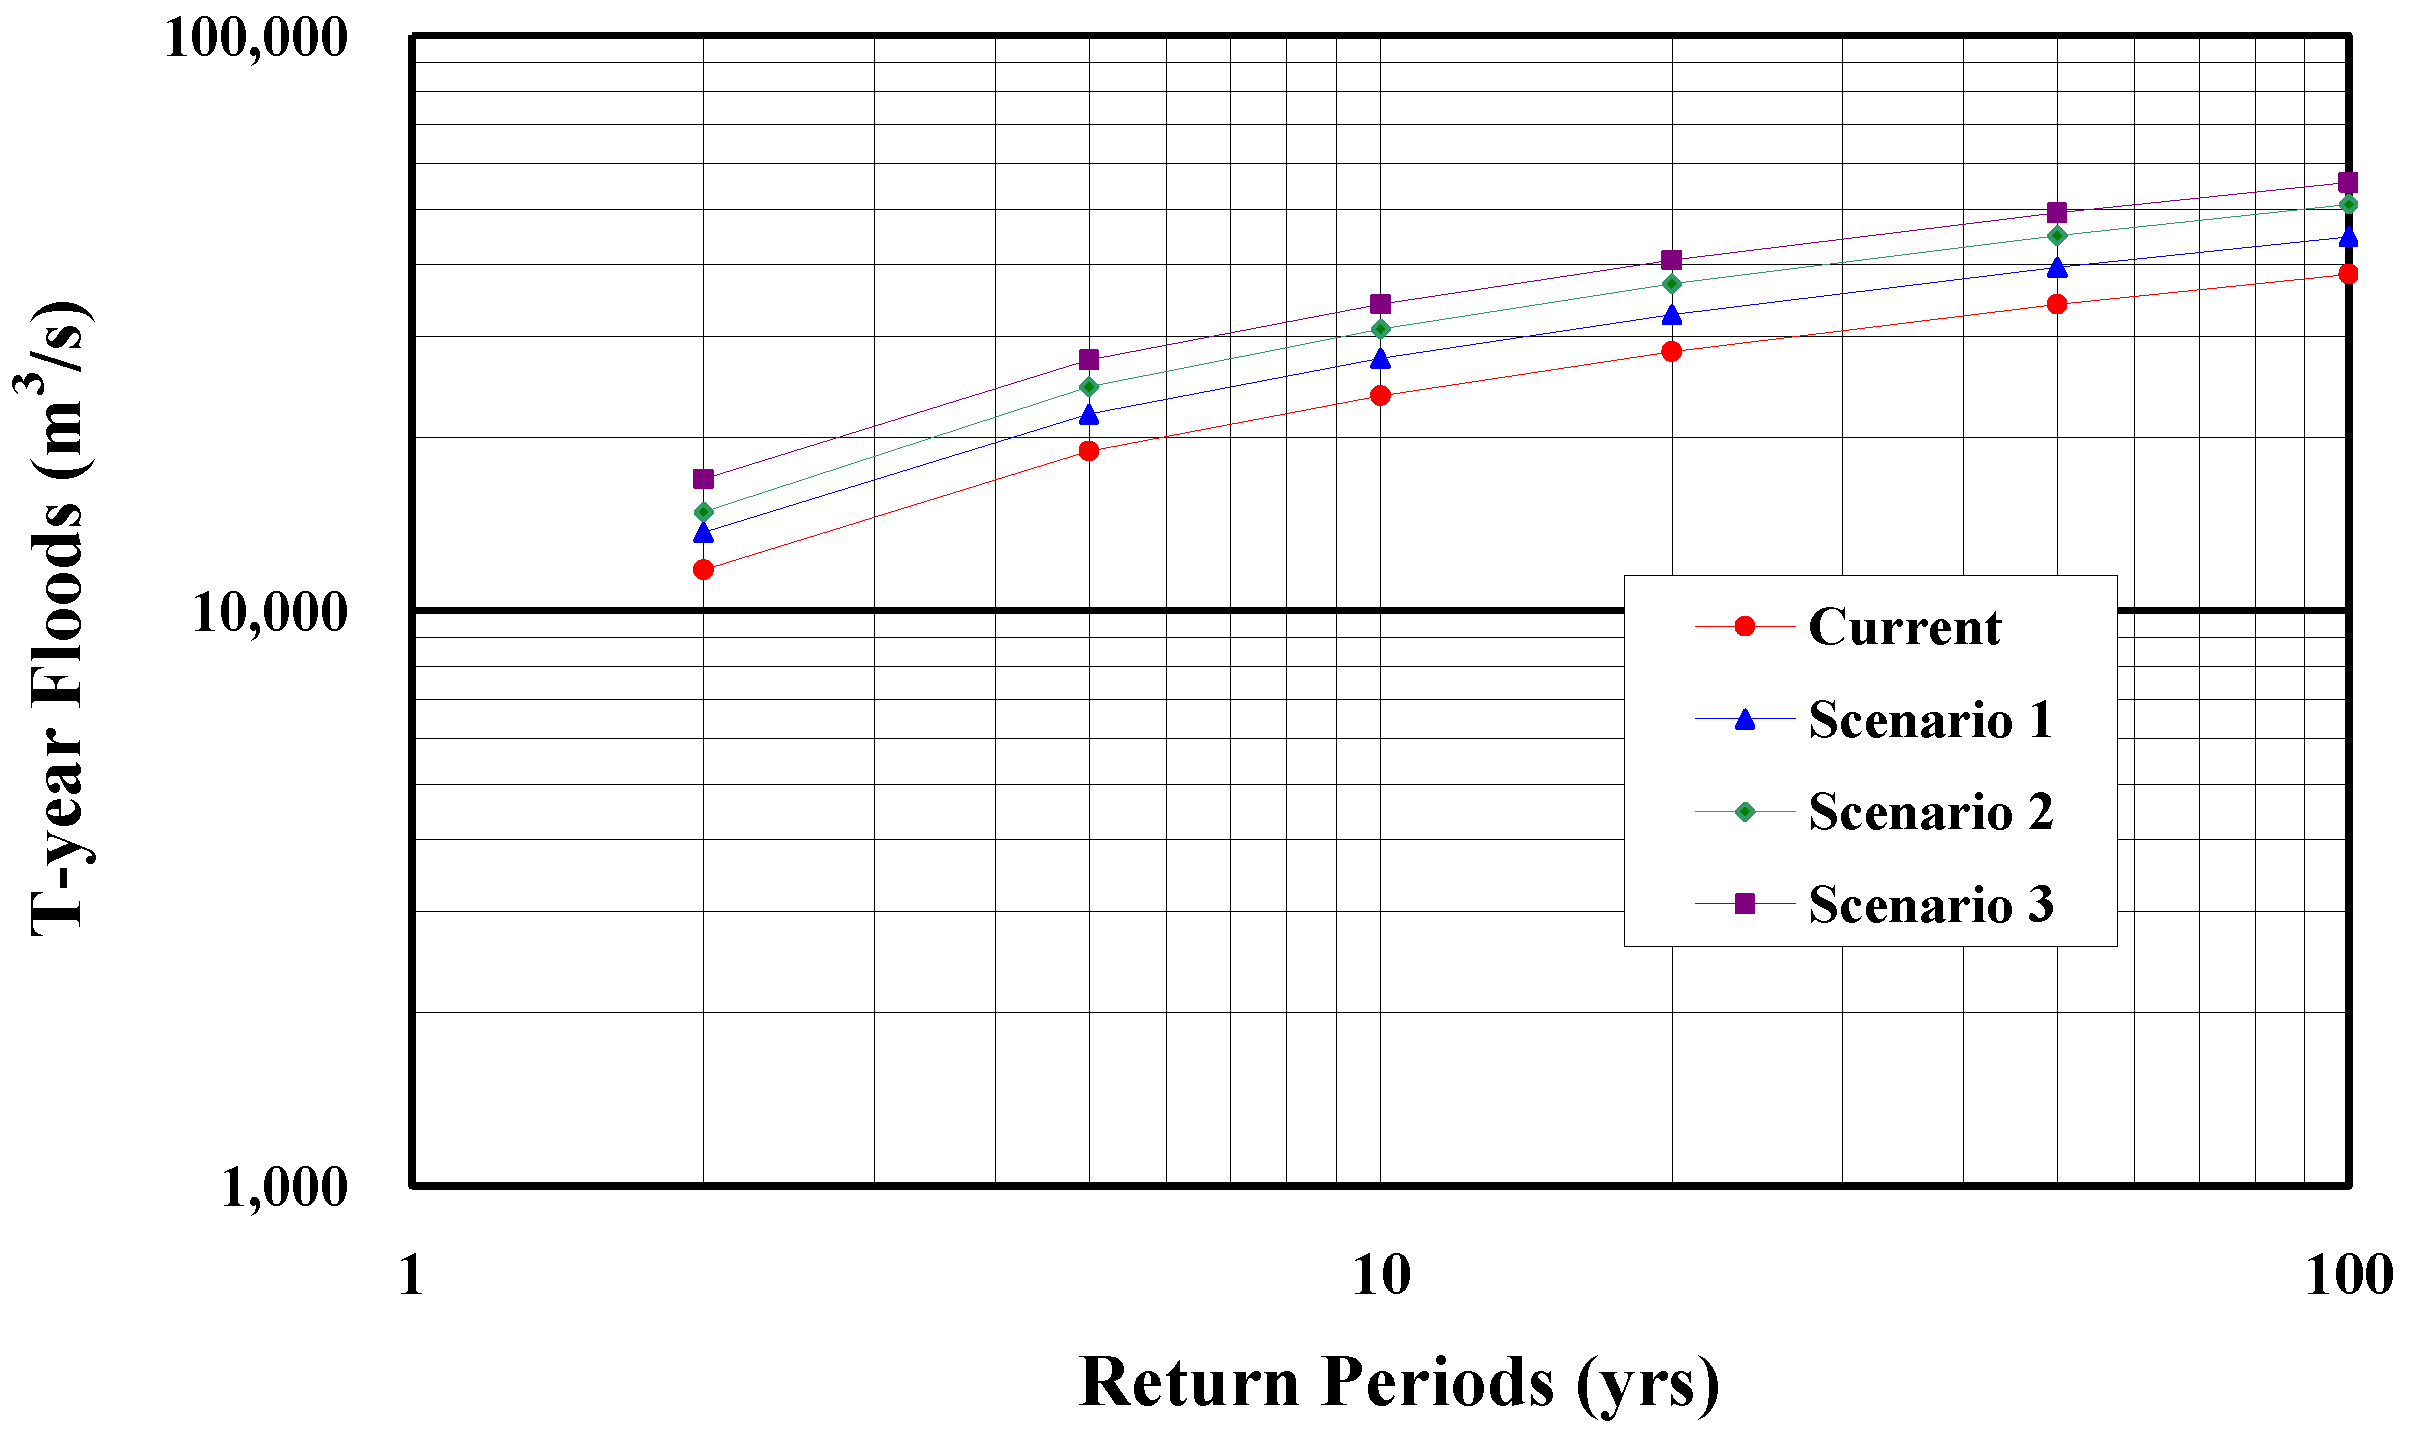
- The effect of the Chungju Dam on the flood frequency at the Paldang Dam was found to be greater that of the Soyanggang Dam during the simulation periods. The removal of the Soyanggang Dam (Scenario 1; regulation by the Chungju Dam only) caused an increase in the daily flood peaks by 15.9%, while the removal of the Chungju Dam (Scenario 2; regulation by the Soyanggang Dam only) increased the daily flood peaks by 28.6%.
- (3)
- The peak flow increment ratio by removing both Soyanggang and Chungju dams (Scenario 3) was slightly lower than the summation of the respective peak flow increment ratios from Scenarios 1 and 2.
- (4)
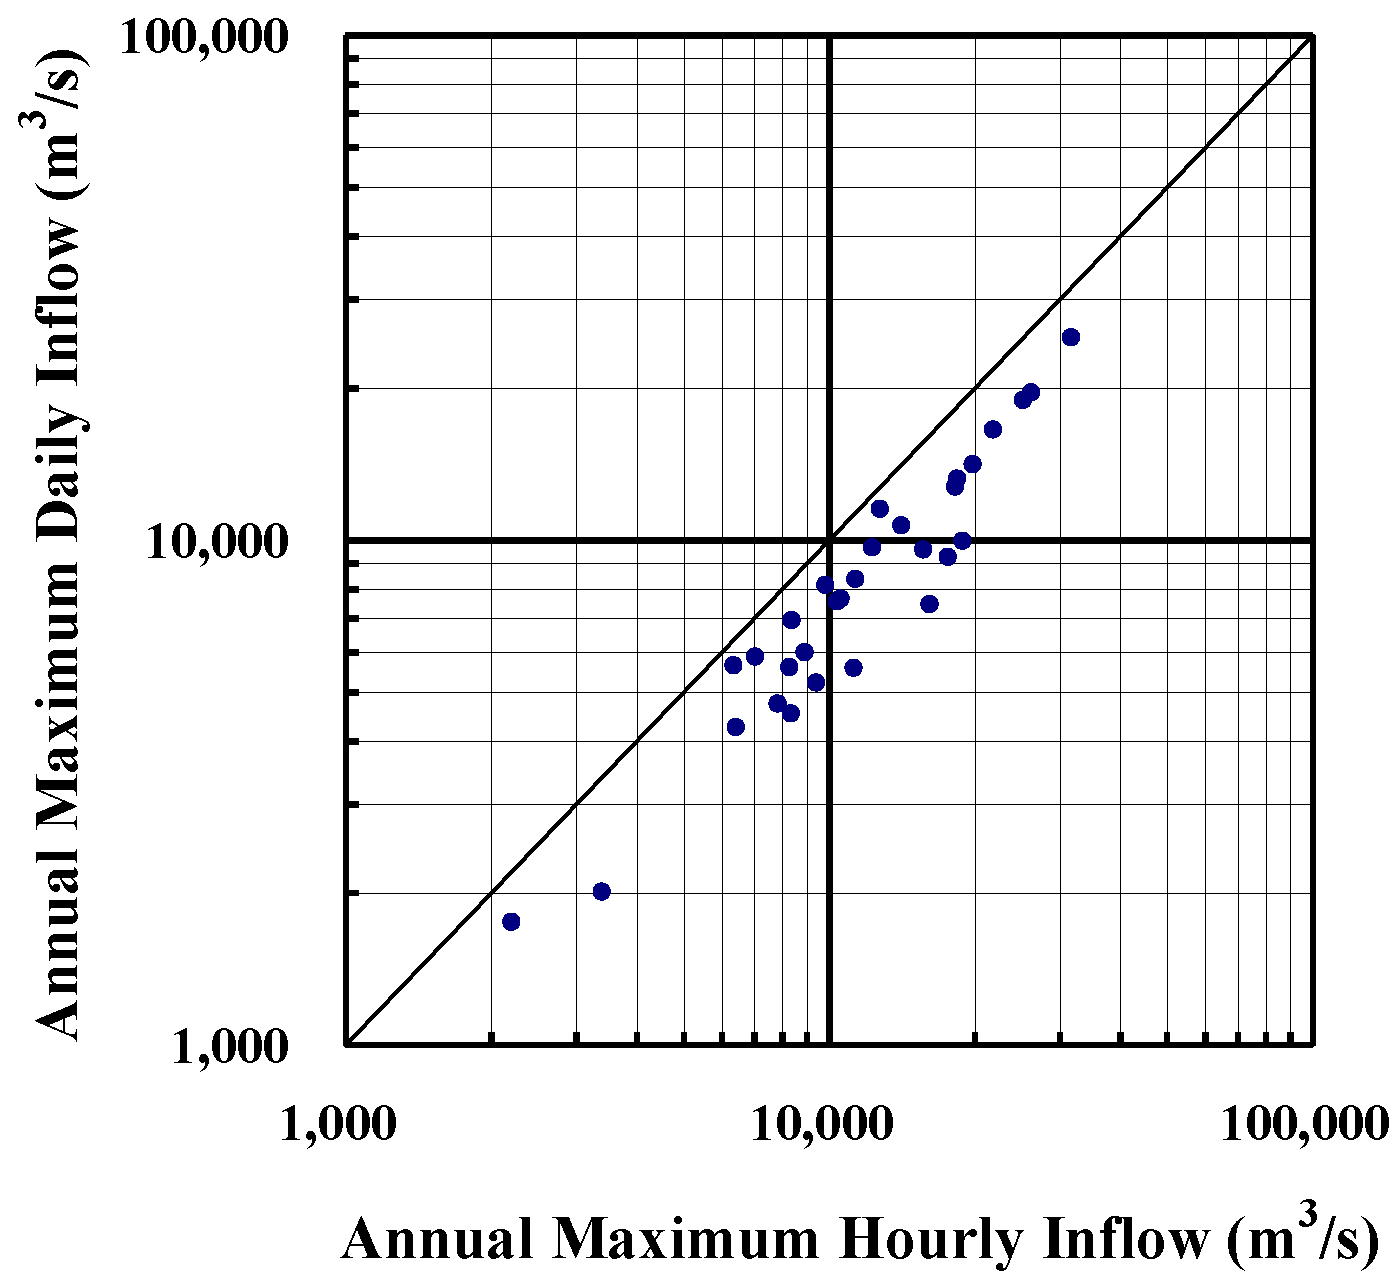
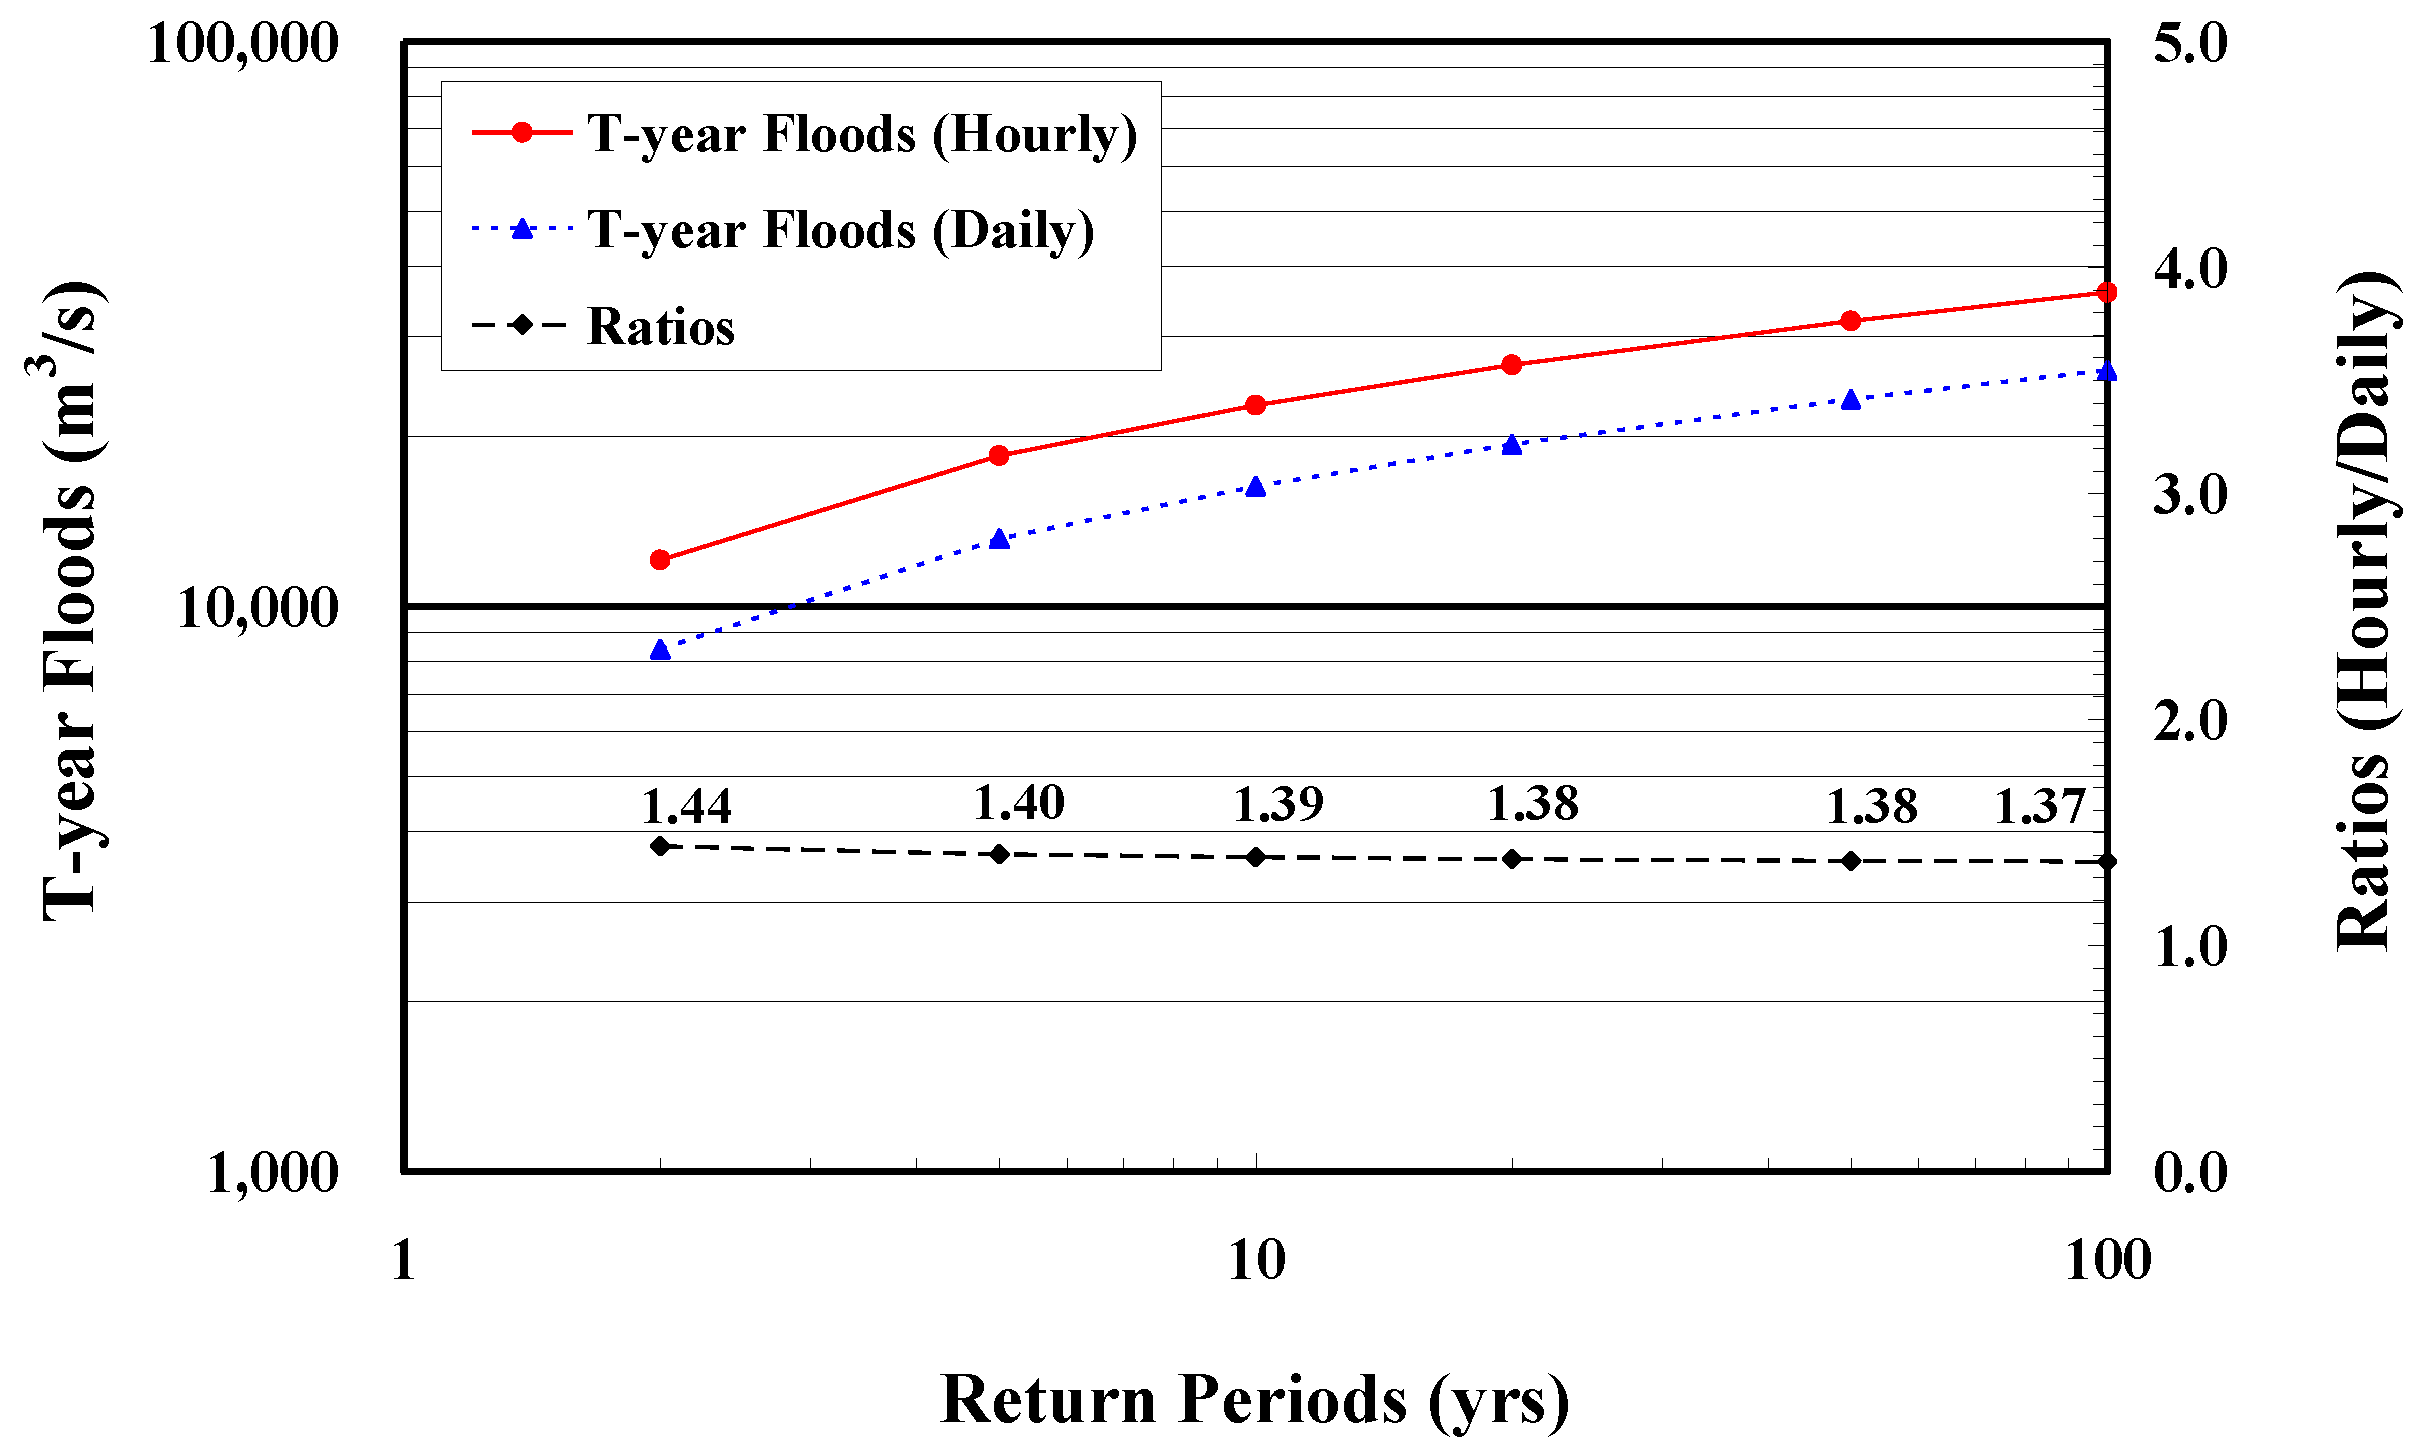
- To overcome the inability of SWAT to reproduce sharp events within hours, a procedure incorporating Sangal’s method for estimating instantaneous peak flow from the daily flow into the SWAT simulation has been proposed in the present work. As a result of the flood frequency analysis on an hourly basis using this procedure, the errors in the flood estimates were less than 8%, which leads to acceptable accuracy.
- (5)
- The increased average percentage of the hourly flood estimates for the three scenarios, relative to the current state, were 16.1%, 30.1%, and 44.1%, for the removals of the Soyanggang, Chungju, and both dams, respectively. These increased percentages were a little higher than those for the estimated daily flood frequencies.
- (6)
- The developed approach allows for a better understanding of flood frequency alterations during the post-dam period, which will improve the applicability of continuous simulation models for the analysis of flood frequency.
Acknowledgments
Author Contributions
Conflicts of Interest
References
- Yang, T.; Zhang, Q.; Chen, Y.D.; Tao, X.; Xu, C.; Chen, X. A spatial assessment of hydrologic alteration caused by dam construction in the middle and lower Yellow River, China. Hydrol. Process. 2008, 22, 3829–3843. [Google Scholar] [CrossRef]
- Poff, N.L.; Allan, J.D.; Bain, M.B.; Karr, J.R.; Prestegaard, K.L.; Richter, B.D.; Sparks, R.E.; Stromberg, J.C. The natural flow regime. A paradigm for river conservation and restoration. BioScience 1997, 47, 769–784. [Google Scholar] [CrossRef]
- Richter, B.D.; Baumgartner, J.V.; Powell, J.; Braun, D.P. A method for assessing hydrologic alteration within ecosystems. Conserv. Biol. 1996, 10, 1163–1174. [Google Scholar] [CrossRef]
- Walker, K.F.; Sheldon, F.; Puckridge, J.T. A perspective on dryland river ecosystems. Regul. Rivers Res. Manag. 1995, 11, 85–104. [Google Scholar] [CrossRef]
- Gregory, K.J.; Park, C. Adjustment of river channel capacity downstream from a reservoir adjustment of river channel capacity downstream from a reservoir. Water Resour. Res. 1974, 10, 870–873. [Google Scholar] [CrossRef]
- Page, K.J. Bankfull Discharge Frequency for the Murrumbidgee River, New South Wales. In Fluvial Geomorphology of Australia; Warner, R.F., Ed.; Academic Press: Sydney, Australia, 1988; pp. 267–281. [Google Scholar]
- Galat, D.L.; Lipkin, R. Restoring ecological integrity of great rivers: Historical hydrographs aid in defining reference conditions for the Missouri River Restoring ecological integrity of great rivers: Historical hydrographs aid in defining reference conditions for the Missouri River. Hydrobiologia 2000, 422/423, 29–48. [Google Scholar]
- Maingi, J.K.; Marsh, S.E. Quantifying hydrologic impacts following dam construction along the Tana River, Kenya. J. Arid Environ. 2002, 50, 53–79. [Google Scholar] [CrossRef]
- Magilligan, F.J.; Nislow, K.H.; Graber, B.E. Scale-independent assessment of discharge reduction and riparian disconnectivity following flow regulation by dams. Geology 2003, 31, 569–572. [Google Scholar] [CrossRef]
- Graf, W.L. Downstream hydrologic and geomorphic effects of large dams on American rivers. Geomorphology 2006, 79, 336–360. [Google Scholar] [CrossRef]
- Pegg, M.A.; Pierce, C.L.; Roy, A. Hydrological alteration along the Missouri River Basin: A time series approach. Aquat. Sci. 2003, 65, 63–72. [Google Scholar] [CrossRef]
- Batalla, R.J.; Gomez, C.M.; Kondolf, G.M. Reservoir-induced hydrological changes in the Ebro River basin, NE Spain. J. Hydrol. 2004, 290, 117–136. [Google Scholar] [CrossRef]
- Magilligan, F.J.; Nislow, K.H. Changes in hydrologic regime by dams. Geomorphology 2005, 71, 61–78. [Google Scholar] [CrossRef]
- Singer, M.B. The influence of major dams on hydrology through the drainage network of the Sacramento River Basin, California. River Res. Appl. 2007, 23, 55–72. [Google Scholar] [CrossRef]
- Romano, S.P.; Baer, S.G.; Zaczek, J.J.; Williard, K.W.J. Site modelling methods for detecting hydrologic alteration of flood frequency and flood duration in the floodplain below the carlyle dam, lower Kaskaskia River, Illinois, USA. River Res. Appl. 2009, 25, 975–984. [Google Scholar] [CrossRef]
- Hess, G.W.; Inman, E.J. Effects of Urban-Detention Reservoirs on Peak Discharges in Gwinnett County, Georgia; Water-Resources Investigations Report 94-4004; U.S. Geological Survey: Atlanta, GA, USA, 1994.
- Hess, G.W.; Inman, E.J. Effects of Urban Flood-Detention Reservoirs on Peak Discharges and Flood Frequencies, and Simulation of Flood-Detention Reservoir Outflow Hydrographs in Two Watersheds in Albany, Georgia; Water-Resources Investigations Report 94-4158; U.S. Geological Survey: Atlanta, GA, USA, 1994.
- Peters, D.L.; Prowse, T.D. Regulation effects on the lower Peace River, Canada. Hydrol. Process. 2001, 15, 3181–3194. [Google Scholar] [CrossRef]
- Montaldo, N.; Mancini, M.; Rosso, R. Flood hydrograph attenuation induced by a reservoir system: Analysis with a distributed rainfall-runoff model. Hydrol. Process. 2004, 18, 545–563. [Google Scholar] [CrossRef]
- Sayama, T.; Tachikawa, Y.; Takara, K. Assessment of dam flood control using a distributed rainfall-runoff prediction system. In Proceedings of the International Conference on Monitoring, Prediction and Mitigation of. Water-Related Disasters (MPMD2005), Kyoto, Japan, 12–15 January 2005; pp. 59–64. [Google Scholar]
- Gross, E.J.; Moglen, G.E. Estimating the Hydrological Influence of Maryland State Dams Using GIS and the HEC-1 Model. J. Hydrol. Eng. 2007, 12, 690–693. [Google Scholar] [CrossRef]
- Cameron, D.S.; Beven, K.J.; Tawn, J.; Blazkova, S.; Naden, P. Flood frequency estimation by continuous simulation for a gauged upland catchment (with uncertainty). J. Hydrol. 1999, 219, 169–187. [Google Scholar] [CrossRef]
- Calver, A.; Lamb, R. Flood frequency estimation using continuous rainfall-runoff modelling. Phys. Chem. Earth 1995, 20, 479–483. [Google Scholar] [CrossRef]
- Blazkova, S.; Beven, K. Flood frequency prediction for data limited catchments in the Czech Republic using a stochastic rainfall model and TOPMODEL. J. Hydrol. 1997, 195, 256–278. [Google Scholar] [CrossRef]
- Smithers, J.; Schulze, R.; Kienzle, S. Design Flood Estimation Using a Modelling Approach: A Case Study Using the ACRU Model; IAHS Publication 240; International Association of Hydrological Sciences: Wallingford, UK, 1997; pp. 365–376. [Google Scholar]
- Cameron, D.S.; Beven, K.J.; Naden, P. Flood frequency estimation by continuous simulation under climate change (with uncertainty). Hydrol. Earth Syst. Sci. 2000, 4, 393–406. [Google Scholar] [CrossRef]
- Cameron, D.S.; Beven, K.J.; Tawn, J.; Naden, P. Flood frequency estimation by continuous simulation (with likelihood based uncertainty estimation). Hydrol. Earth Syst. Sci. 2000, 4, 23–34. [Google Scholar] [CrossRef]
- Blazkova, S.; Beven, K. Flood frequency estimation by continuous simulation of subcatchment rainfalls and discharges with the aim of improving dam safety assessment in a large basin in the Czech Republic. J. Hydrol. 2004, 292, 153–172. [Google Scholar] [CrossRef]
- Soong, D.T.; Straub, T.D.; Murphy, E.A. Continuous Hydrologic Simulation and Flood-Frequency, Hydraulic, and Flood-Hazard Analysis of the Blackberry Creek Watershed, Kane County, Illinois; Scientific Investigations Report 2005-5270; U.S. Geological Survey: Reston, VA, USA, 2005.
- Brath, A.; Montanari, A.; Moretti, G. Assessing the effect on flood frequency of land use change via hydrological simulation (with uncertainty). J. Hydrol. 2006, 324, 141–153. [Google Scholar] [CrossRef]
- Boni, G.; Ferraris, L.; Giannoni, F.; Roth, G.; Rudari, R. Flood probability analysis for un-gauged watersheds by means of a simple distributed hydrologic model. Adv. Water Resour. 2007, 30, 2135–2144. [Google Scholar] [CrossRef]
- Arnold, J.G.; Forher, N. SWAT2000: Current capabilities and research opportunities in applied watershed modeling. Hydrol. Process. 2005, 19, 563–572. [Google Scholar] [CrossRef]
- Gassman, P.W.; Reyes, M.; Green, C.H.; Arnold, J.G. The Soil and Water Assessment Tool: Historical development, applications, and future directions. Trans. ASABE 2007, 50, 1211–1250. [Google Scholar] [CrossRef]
- Neitsch, S.L.; Arnold, J.G.; Kiniry, J.R.; Williams, J.R. Soil and Water Assessment Tool, Theoretical Documentation, version 2009; Texas Water Resources Institute Technical Report No. 406; Texas Water Resources Institute: College Station, TX, USA, 2011. [Google Scholar]
- Ministry of Construction and Transportation. Investigation Report on the Water Supply Capacity of Existing Dams in Han River Basin; Investigation Report DM-97-1; Ministry of Construction and Transportation: Gwacheon, Korea, 1997.
- Sangal, B.P. Practical method of estimating peak flow. J. Hydraul. Eng. 1983, 109, 549–563. [Google Scholar] [CrossRef]
- Kim, N.W.; Lee, J. Temporally weighted average curve number method for daily runoff simulation. Hydrol. Process. 2008, 22, 4936–4948. [Google Scholar] [CrossRef]
- Kim, N.W.; Lee, J. Enhancement of the channel routing module in SWAT. Hydrol. Process. 2010, 24, 96–107. [Google Scholar] [CrossRef]
- Nash, J.E.; Sutcliffe, J.V. River flow forecasting through conceptual models part I—A discussion of principles. J. Hydrol. 1970, 10, 282–290. [Google Scholar] [CrossRef]
- Hosking, J.R.M. L-moments: Analysis and estimation of distributions using linear combinations of order statistics. J. R. Stat. Soc. Ser. B (Methodological) 1990, 52, 105–124. [Google Scholar]







| Scenarios | Soyanggang | Chungju | Hwacheon | Goesan |
|---|---|---|---|---|
| Current state | Outflow | Outflow | Outflow | Outflow |
| Scenario 1 | Inflow | Outflow | Outflow | Outflow |
| Scenario 2 | Outflow | Inflow | Outflow | Outflow |
| Scenario 3 | Inflow | Inflow | Outflow | Outflow |
| Parameter | Description | Calibrated Value |
|---|---|---|
| ESCO | Soil evaporation compensation factor | 0.65 |
| CN2 | CN value with the AMC-II | +20% |
| CH_N | Manning’s n | 0.03 |
| ADJF | Adjustment factor for lateral flow (default = 1) | 2 |
| SLSUBBSN | Average slope length for subbasin (m) | Max (10, default) |
| GW_DELAY | Groundwater delay (days) | 150 |
| Year | Rainfall (mm) | Runoff (mm) | Runoff Ratio (%) | Determination Coefficient (R2) | ||
|---|---|---|---|---|---|---|
| Observed | Simulated | Observed | Simulated | |||
| 1986 | 788.9 | 378.0 | 357.9 | 47.9 | 45.4 | 0.795 |
| 1987 | 1206.4 | 940.1 | 865.5 | 77.9 | 71.7 | 0.867 |
| 1988 | 712.8 | 374.6 | 398.5 | 52.5 | 55.9 | 0.849 |
| 1989 | 850.7 | 334.8 | 372.1 | 39.4 | 43.7 | 0.733 |
| 1990 | 1545.5 | 1128.7 | 1040.7 | 73.0 | 67.3 | 0.856 |
| 1991 | 925.4 | 421.9 | 429.0 | 45.6 | 46.4 | 0.722 |
| 1992 | 719.7 | 249.7 | 277.1 | 34.7 | 38.5 | 0.709 |
| 1993 | 797.8 | 508.1 | 481.1 | 63.7 | 60.3 | 0.745 |
| 1994 | 687.7 | 220.9 | 261.8 | 32.1 | 38.1 | 0.721 |
| 1995 | 1236.1 | 822.6 | 750.4 | 66.5 | 60.7 | 0.904 |
| 1996 | 715.7 | 370.3 | 365.0 | 51.7 | 51.0 | 0.854 |
| 1997 | 730.4 | 458.6 | 386.2 | 62.8 | 52.9 | 0.729 |
| 1998 | 1276.0 | 726.0 | 702.9 | 56.9 | 55.1 | 0.877 |
| 1999 | 1108.3 | 580.2 | 610.5 | 52.4 | 55.1 | 0.854 |
| 2000 | 926.1 | 424.3 | 449.5 | 45.8 | 48.5 | 0.770 |
| 2001 | 753.5 | 285.7 | 311.6 | 37.9 | 41.4 | 0.798 |
| 2002 | 926.0 | 465.0 | 537.0 | 50.2 | 58.0 | 0.934 |
| 2003 | 1277.0 | 724.2 | 717.5 | 56.7 | 56.2 | 0.842 |
| 2004 | 1051.5 | 614.4 | 628.4 | 58.4 | 59.8 | 0.864 |
| 2005 | 1209.1 | 527.0 | 501.0 | 43.6 | 41.4 | 0.749 |
| 2006 | 1242.3 | 732.2 | 756.6 | 58.9 | 60.9 | 0.971 |
| 2007 | 1027.9 | 589.7 | 525.8 | 57.4 | 51.1 | 0.960 |
| 2008 | 909.5 | 374.3 | 373.2 | 41.2 | 41.0 | 0.941 |
| 2009 | 1013.4 | 487.4 | 459.0 | 48.1 | 45.3 | 0.925 |
| 2010 | 1074.0 | 477.4 | 436.2 | 44.4 | 40.6 | 0.914 |
| 2011 | 1568.8 | 919.7 | 903.4 | 58.6 | 57.6 | 0.974 |
| 2012 | 990.0 | 405.9 | 382.6 | 41.0 | 38.6 | 0.870 |
| 2013 | 1050.5 | 548.9 | 496.5 | 52.3 | 47.3 | 0.964 |
| 2014 | 494.9 | 125.7 | 144.0 | 25.4 | 29.1 | 0.914 |
| 2015 | 395.8 | 86.5 | 91.0 | 21.8 | 23.0 | 0.980 |
| Average | 973.7 | 510.1 | 500.4 | 50.0 | 49.4 | 0.828 |
| Scenarios | Return Periods (Years) | ||||||
|---|---|---|---|---|---|---|---|
| 2 | 5 | 10 | 20 | 50 | 100 | Ave. | |
| Scenario 1 | 16.5 | 16.0 | 15.9 | 15.8 | 15.7 | 15.6 | 15.9 |
| Scenario 2 | 28.5 | 28.6 | 28.6 | 28.6 | 28.6 | 28.7 | 28.6 |
| Scenario 3 | 45.4 | 43.3 | 42.6 | 42.1 | 41.7 | 41.5 | 42.7 |
| Scenarios | Return Periods (Years) | ||||||
|---|---|---|---|---|---|---|---|
| 2 | 5 | 10 | 20 | 50 | 100 | Ave. | |
| Scenario 1 | 16.0 | 16.1 | 16.1 | 16.1 | 16.1 | 16.1 | 16.1 |
| Scenario 2 | 26.0 | 29.3 | 30.4 | 31.1 | 31.8 | 32.1 | 30.1 |
| Scenario 3 | 43.6 | 44.0 | 44.2 | 44.3 | 44.3 | 44.4 | 44.1 |
© 2017 by the authors. Licensee MDPI, Basel, Switzerland. This article is an open access article distributed under the terms and conditions of the Creative Commons Attribution (CC BY) license (http://creativecommons.org/licenses/by/4.0/).
Share and Cite
Lee, J.E.; Heo, J.-H.; Lee, J.; Kim, N.W. Assessment of Flood Frequency Alteration by Dam Construction via SWAT Simulation. Water 2017, 9, 264. https://doi.org/10.3390/w9040264
Lee JE, Heo J-H, Lee J, Kim NW. Assessment of Flood Frequency Alteration by Dam Construction via SWAT Simulation. Water. 2017; 9(4):264. https://doi.org/10.3390/w9040264
Chicago/Turabian StyleLee, Jeong Eun, Jun-Haeng Heo, Jeongwoo Lee, and Nam Won Kim. 2017. "Assessment of Flood Frequency Alteration by Dam Construction via SWAT Simulation" Water 9, no. 4: 264. https://doi.org/10.3390/w9040264
APA StyleLee, J. E., Heo, J.-H., Lee, J., & Kim, N. W. (2017). Assessment of Flood Frequency Alteration by Dam Construction via SWAT Simulation. Water, 9(4), 264. https://doi.org/10.3390/w9040264


