1. Introduction
Storm events that result in catastrophic floods are rare but do occur in arid environments, especially in urban centers. With increasing population and urbanization, the public susceptibility and economic impact of flooding in these areas will be increasing [
1]. Since these events do not occur frequently, there may not be enough pressure on decision makers to invest in the development of robust hydrometeorological observing systems or hydrologic/hydraulic flood control structures. The dramatic societal impacts of these events motivate researchers to perform studies aimed at developing science-based recommendations on best approaches to help decision makers address this issue [
2]. Such information can lead to solutions that help save lives and resources and provide opportunities to harness floodwaters and turn them into a resource that can benefit the society. However, conducting hydrological studies of these events in ungauged areas is hampered by lack of adequate rainfall and physiographical data. Understanding the hydrometeorological conditions and processes that lead to destructive flood events is a first step in this process [
3]. Physiographic data that enable the development of hydrologic models at reasonable resolutions over ungauged basins have become available globally in recent years. However, the accuracy of hydrologic model simulations is controlled by the accuracy of the model inputs, especially precipitation. A major challenge is the low quality and spatio-temporal resolutions of precipitation data for regions that do not have adequate ground observation networks.
High-resolution, better-quality satellite precipitation products that are increasingly becoming available can potentially lead to improvements in hydrologic modeling and forecasting, improvements as substantial as those witnessed in the United States in the 1990s when the NEXRAD radar network became operational. The potential of satellite precipitation products for various hydrometeorological applications has been reported in numerous studies [
4,
5,
6,
7]. Weather radars brought about the advantage of better spatial coverage, but satellites have even a better spatial coverage, though at lower temporal and spatial resolutions, and their field of view is not obstructed by topography. A major difference between radar and satellite precipitations products for hydrological applications is that when the NEXRAD network was deployed, the radar retrieval techniques were in place; however, it took many years to develop robust retrieval techniques after the launch of the Tropical Rainfall Measuring Mission (TRMM) satellite in late 1997. Also, systematic and random error of satellite precipitation products are typically higher than those associated with radar products [
8,
9]. Some of the satellite precipitation products that have been widely used in the past two decades include the Precipitation Estimation from Remotely Sensed Information using Artificial Neural Networks (PERSIANN) [
10], the Climate Prediction Center (CPC) MORPHing (CMORPH) [
11], the Tropical Rainfall Measuring Mission (TRMM) Multi-satellite Precipitation Analysis (TMPA) [
12], and Global Satellite Mapping of Precipitation (GSMap) [
13] products. These multi-sensor techniques that merge quality-controlled satellite products with higher resolution data from radars and rain gauges are helping improve the accuracy of satellite-based rainfall products over time [
14]. In hydrological applications, however, satellite rainfall errors may either be amplified on dampened in simulated runoff at the catchment scale depending on the interaction between the spatio-temporal patterns of errors and catchment properties such as size, slope, and initial moisture conditions [
15,
16].
Simulation of flash floods, which are typically triggered by abrupt and intense bursts of rainfall, will benefit most from the fine resolution of the recent satellite rainfall products. For example, Anquetin et al. [
17] reported that a higher resolution precipitation product was able to capture features of the precipitation system that caused the devastating 2002 flash flood in France. These features were missed by low resolution products. Several other studies demonstrated the need of high-resolution rainfall data for flash flood studies [
18,
19,
20]. The number of hydrometeorological and climatological applications of satellite precipitation products will definitely increase with the emergence of the latest satellite product, the Integrated Multi-satellitE Retrievals for Global Precipitation Measurement (IMERG) product, with spatial and temporal resolutions of 0.1 × 0.1° and 30 min, respectively. IMERG is based on the Global Precipitation Mission (GPM), which was deployed in 2014 to consolidate and enhance precipitation measurements from a constellation of research and operational microwave sensors [
21]. GPM is composed of one Core Observatory satellite, deployed by NASA and the Japan Aerospace Exploration Agency (JAXA), and carries a dual frequency radar and a multi-channel microwave imager, and about 10 partner satellites [
22]. IMERG integrates the intermittent precipitation estimates from all GPM microwave sensors (high quality, low temporal resolution) with infra-red-based observations from geosynchronous satellites (lower quality, higher temporal resolution) and precipitation gauge data to produce a uniformly gridded, global, multi-sensor precipitation product. The IMERG product is designed to incorporate strengths and avoid major weaknesses of the previous multi-satellite algorithms supported by NASA: CMORPH-KF, TRMM-TMPA, and PERSIANN. This high-resolution precipitation data will significantly advance hydrological modeling and predictions worldwide, especially in ungauged and poorly gauged basins. The near-real-time IMERG Early and Late products are available within 6 h and 18 h after observations are made, respectively. After the gauge analysis is incorporated, the final satellite-gauge IMERG product becomes available, typically three or more months after the month in which the observations were made.
Since the hydrological response of a basin is very sensitive to the spatio-temporal variability in various physical attributes of soil, land use, and topography, hydrological models that consider the spatial variability are better suited for accurate flood simulation and predictions [
23,
24,
25]. Distributed hydrologic models can also provide a detailed description of the flood hazard areas, especially in urban catchments [
26]. Physically based, distributed models employ a gridded nature, which allows parameters to be constrained within certain ranges that have clear physical meanings. Recent research demonstrated that physically-based, distributed hydrologic models can potentially perform as well as—or outperform—calibrated conceptual, lumped models [
24,
25,
26,
27]. The physically-based Gridded Surface Subsurface Hydrologic Analysis (GSSHA) model is an example of a grid-based fully-distributed hydrologic models [
28]. GSSHA is capable of simulating flow generated from Hortonian runoff, saturated source areas, exfiltration, and ground water discharge to streams [
28]. Sharif et al. [
29] successfully applied the GSSHA model to evaluate the effect of flood control structures on stream discharge in urbanized watersheds. Furl et al. [
23] used the model to describe the flood hydrology of a small urbanized basin in Austin, TX. Chintalapudi et al. [
30] used the GSSHA model to study the effect of land cover changes on peak discharge and runoff volumes with simulations driven by satellite rainfall products. Ogden et al. [
31] compared the GSSHA distributed model to the HEC-HMS (a lumped model). Results showed that HEC-HMS failed to simulate some extreme events using standard parameters, whereas the GSSHA performed fairly well. Elhassan et al. [
32] compared the simulated stream generated by the GSSHA and HEC-HMS models for different storm events. They concluded that the GSSHA simulated streamflow matched the observations much better than HEC-HMS. In addition to these studies, the model has been validated over a densely urbanized catchment in Texas and the results demonstrated the benefit of the use of 30-m model grid over urban areas [
25]. Different satellite products we used as input to GSSHA in simulation of several floods over a 3000 km
2 catchment in Texas [
30] with satellite products of higher spatiotemporal resolutions producing the most reasonable runoff estimates. Another study over the Guadalupe River in Texas demonstrated that GSSHA was more successful in simulating events with multiple rainfall hiatuses than the HEC model [
33]. An experiment using rainfall forecasts over a semi-arid urban catchment in Colorado demonstrated that GSSHA was able to produce reasonable forecasts of inundation and peak discharge for lag times of up to 70 min [
34].
Recent extreme precipitation and flooding events in the Arab Peninsula led to several hydrometeorological studies. Furl et al. [
35] analyzed rainfall in the southwestern region of Saudi Arabia and highlighted the lack of dense rain gauge networks. Almazroui [
36] studied the TRMM rainfall data over Saudi Arabia throughout the period from 1998 to 2009. Although mixed results were obtained regarding accuracy of the TRMM estimates, the study recommended using the product to complement rainfall data from the extremely sparse rain gauge network in the country. A more recent study [
37], evaluated the use of TRMM rainfall estimates for flood warning in urban areas of the country and concluded that TRMM satellite rainfall will provide some helpful information for preparation during extreme events but with low accuracy in terms of the spatiotemporal distribution of the rainfall storms. However, detailed fully-distributed hydrological analysis of runoff generation during these events is lacking, especially for urban areas that are most vulnerable to flash flooding events. A major reason for that was the lack of rainfall data at resolutions suitable for physically-based hydrologic modeling. The main objective of this study is to examine the flooding potential in the arid Wadi Al Batin catchment, Saudi Arabia, with focus on the rapidly urbanizing city of Hafr Al Batin, located near the outlet of the catchment. The city started to witness frequent flooding in the last two decades. A short-lived storm that hit the city in 2009 caused major ephemeral streams in the city to flow overbank, resulting in devastating flooding in the residential areas and significant damage to public and private properties. A flood event that occurred in October 2015 is employed as a case study in this paper. Detailed understanding of the runoff response in the urbanized part of the city of Hafr Al Batin will provide invaluable information that can help city officials to identify appropriate actions for reducing the probability of future flooding as well as to implement mitigation measures for severe storm events. GPM satellite precipitation data was used as input to a physically-based distributed hydrologic model. At model grid resolutions of 30 m to 700 m, computational requirements were reduced by dividing the basin into fully hydrologically interconnected sub-basins. The high-resolution simulations in the urbanized portion of the catchment helped identify the areas most susceptible to flooding. The relative contribution of the three streams that meet the main channel near the urban center was examined through model simulations.
2. Study Area
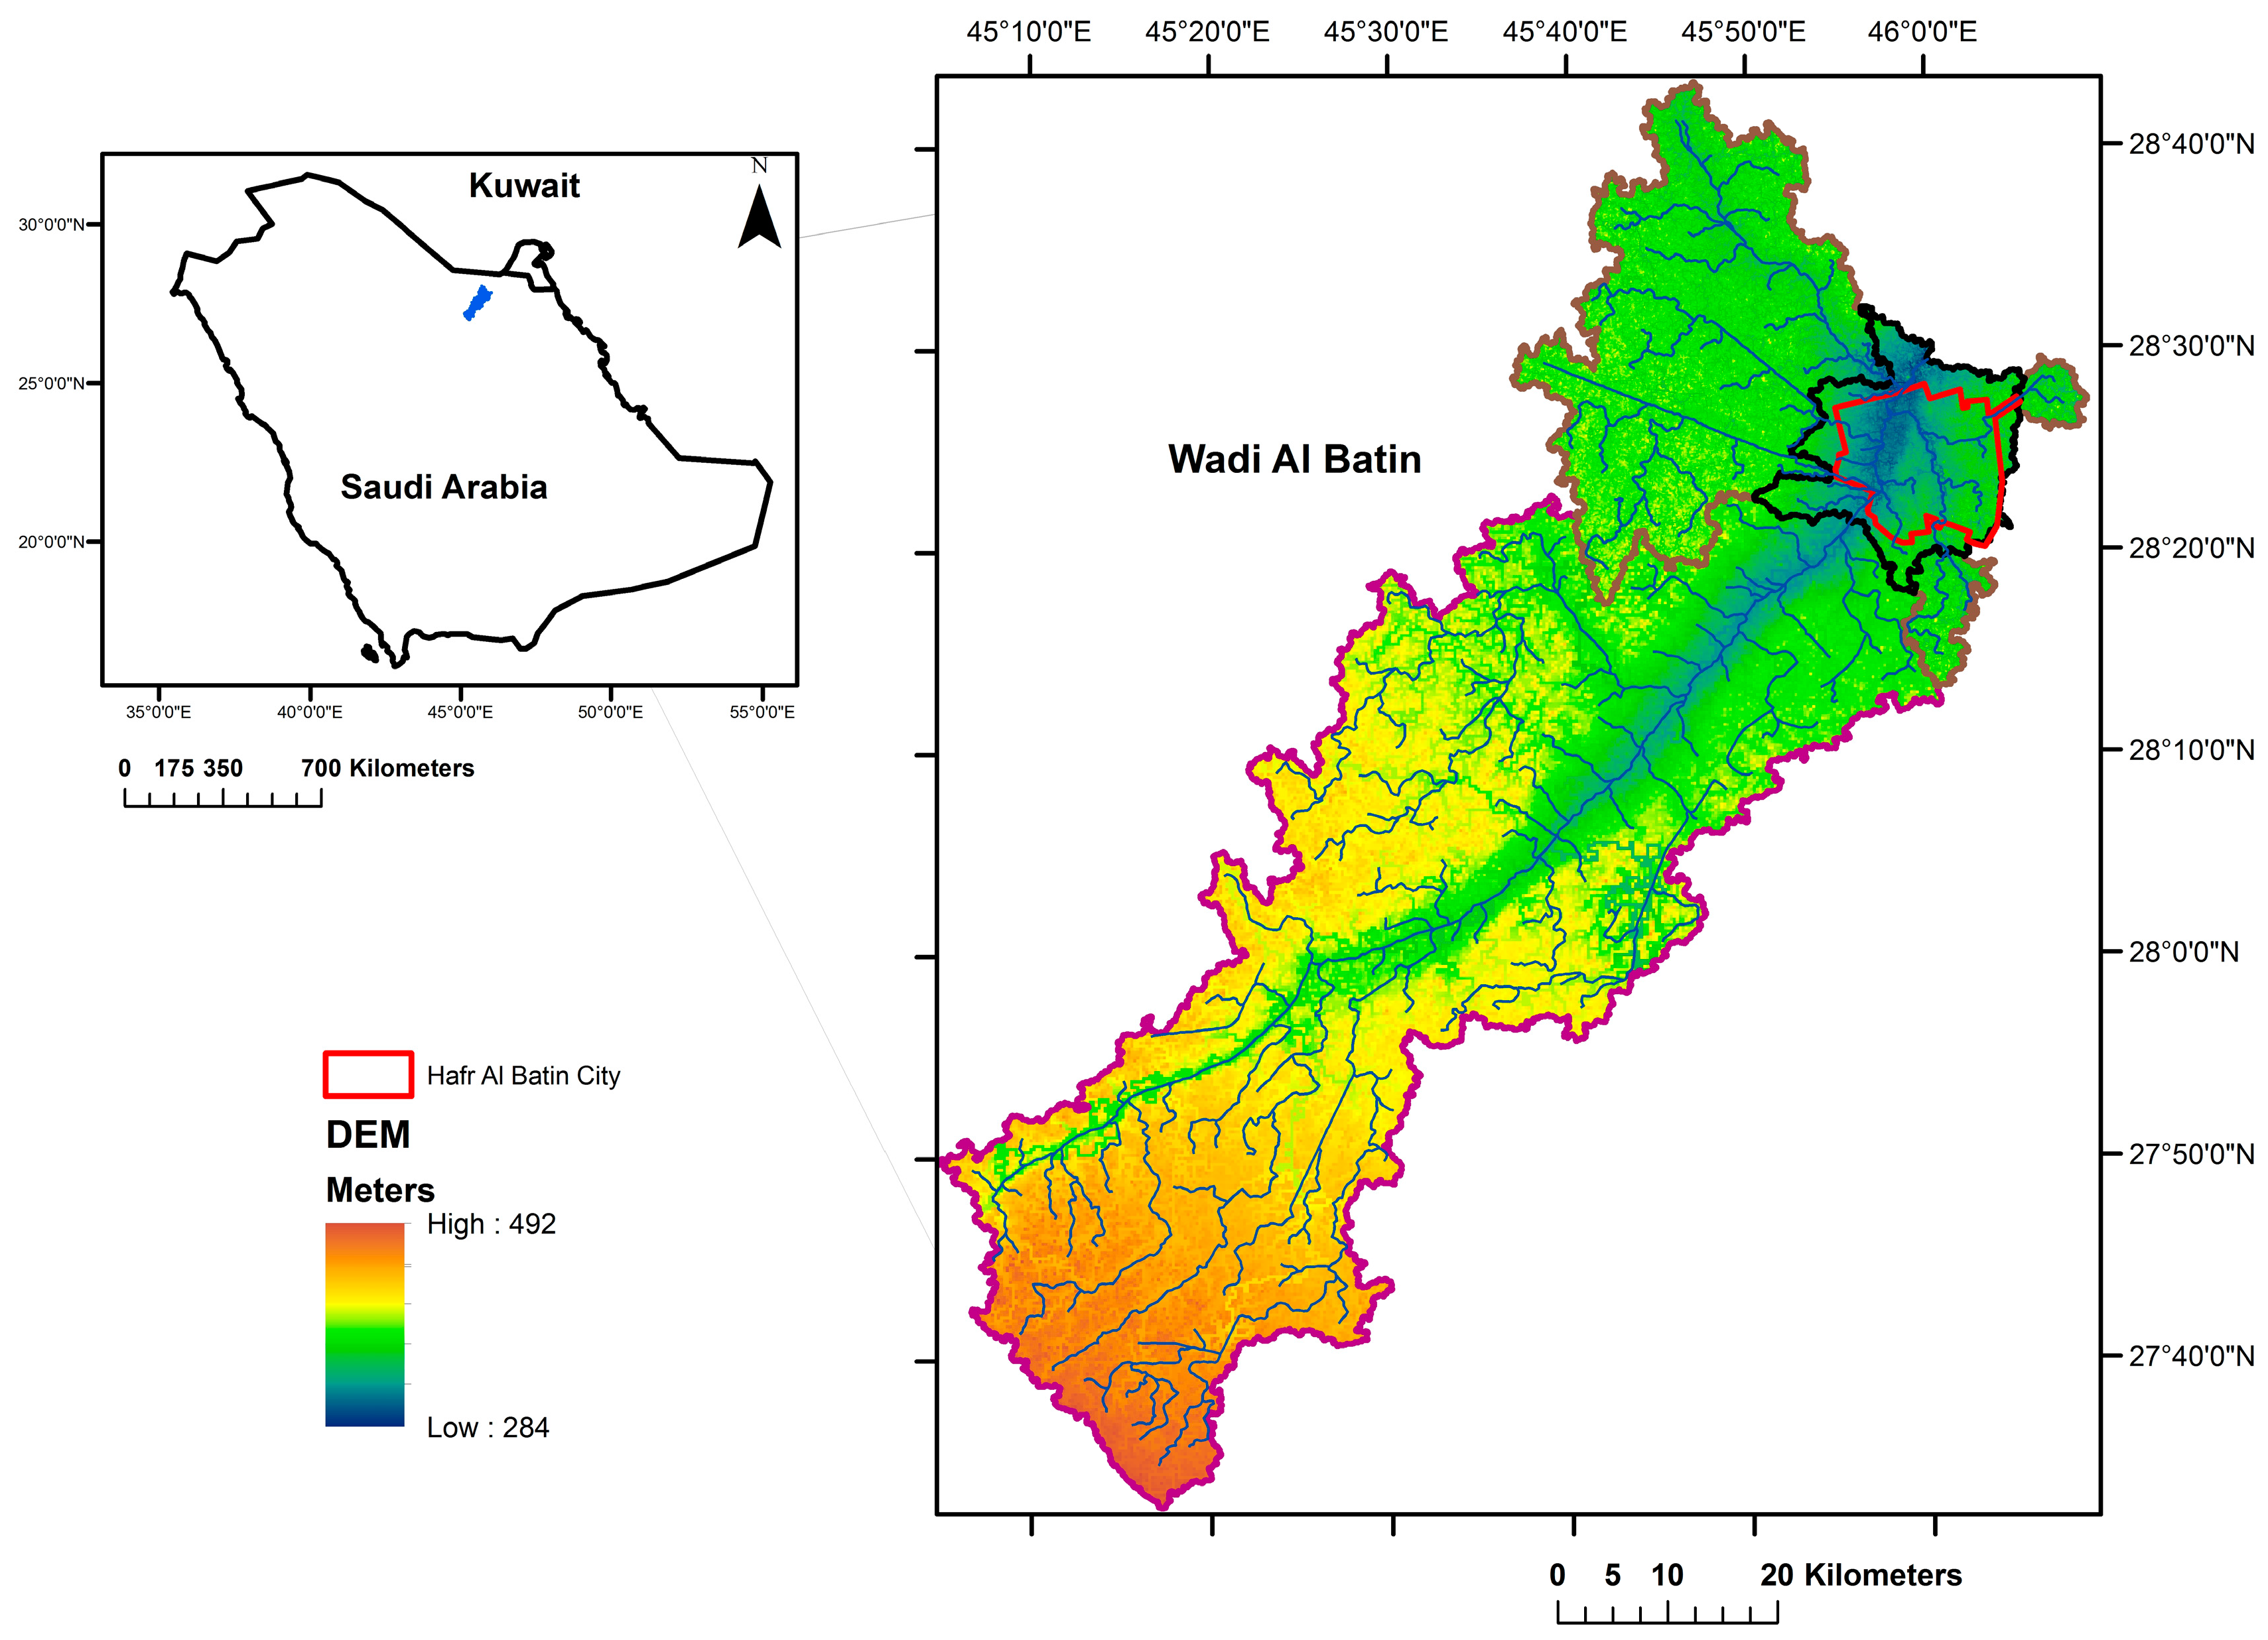
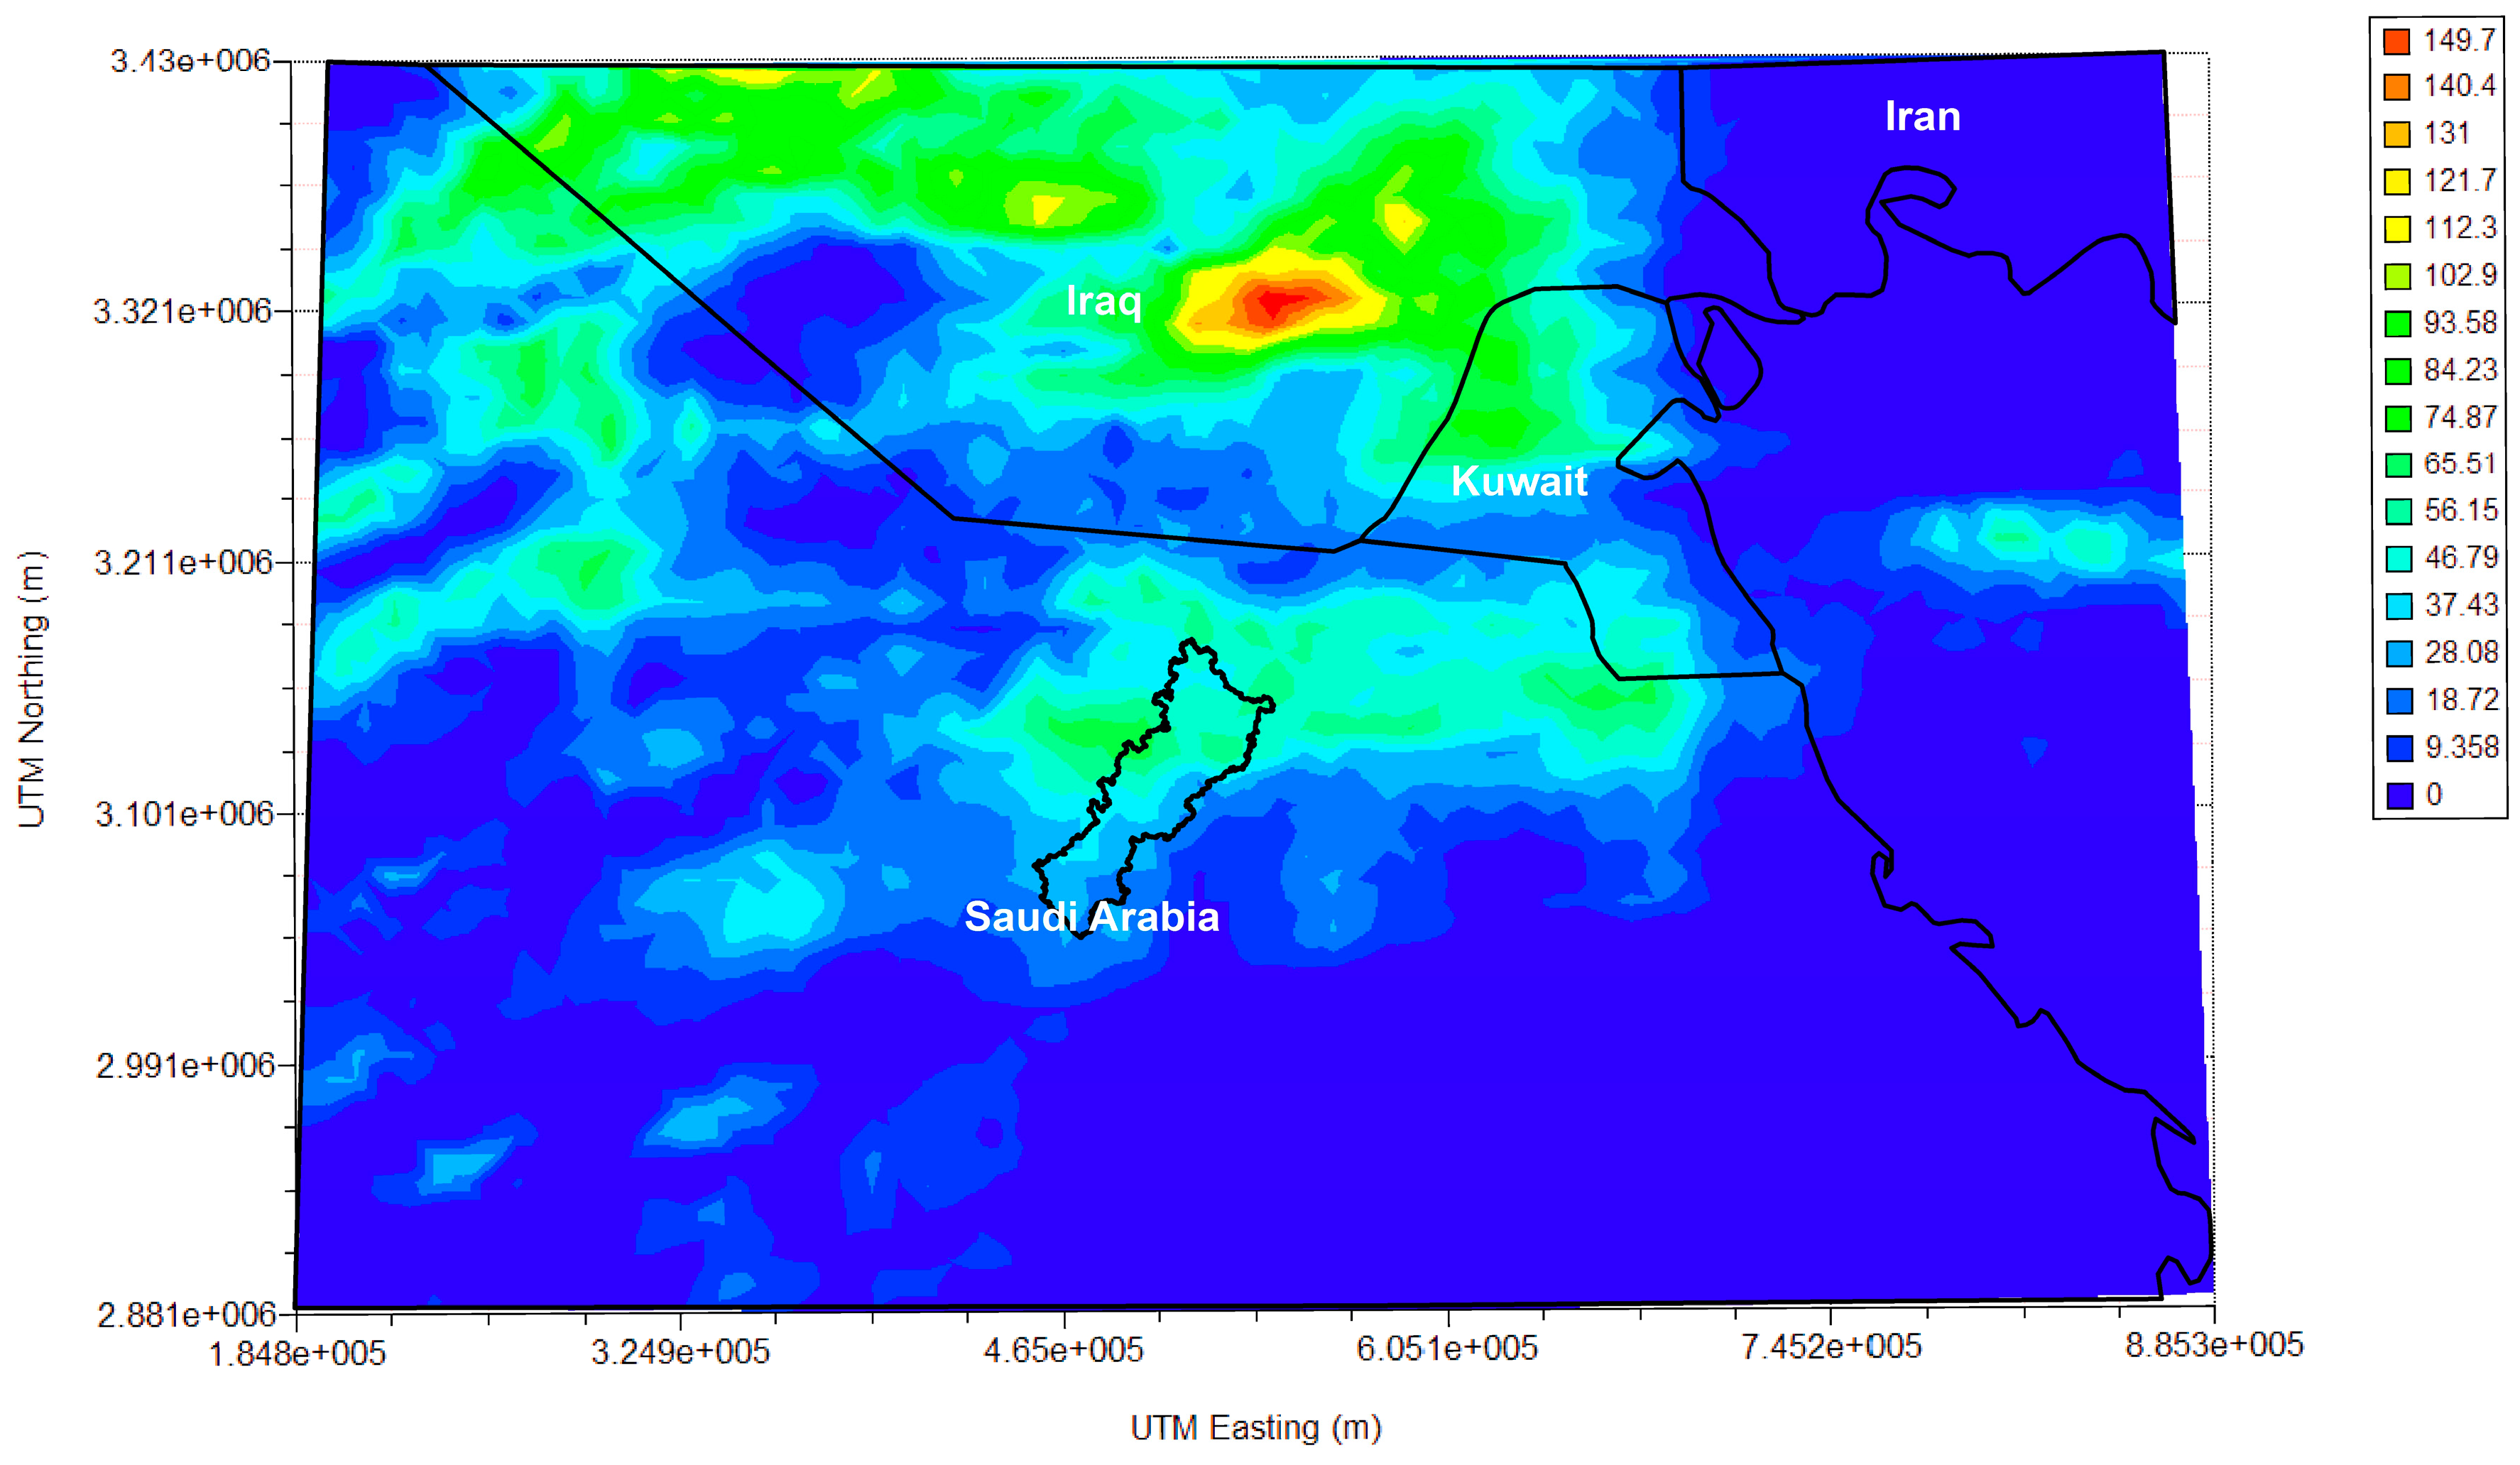
Hafr Al Batin is an old town in northeastern Saudi Arabia not very far from the borders with Kuwait and Iraq. The city has been witnessing a high rate of urbanization in the past few decades with a current population of over 300,000. Hafr Al Batin lies in the valley of the mostly-dry Wadi Al Batin (
Figure 1) from which it takes its name and is the sole source of its groundwater supplies. Wadi Al Batin represents the now-disconnected upstream segment of an ancient large river, Wadi Al Rimmah, originates in western Saudi Arabia and empties in the Arabian Gulf [
38,
39]. The main channel is highly incised, a sign of a history of very frequent deluges [
40], which is probably the reason for the name Hafr (incision in Arabic).
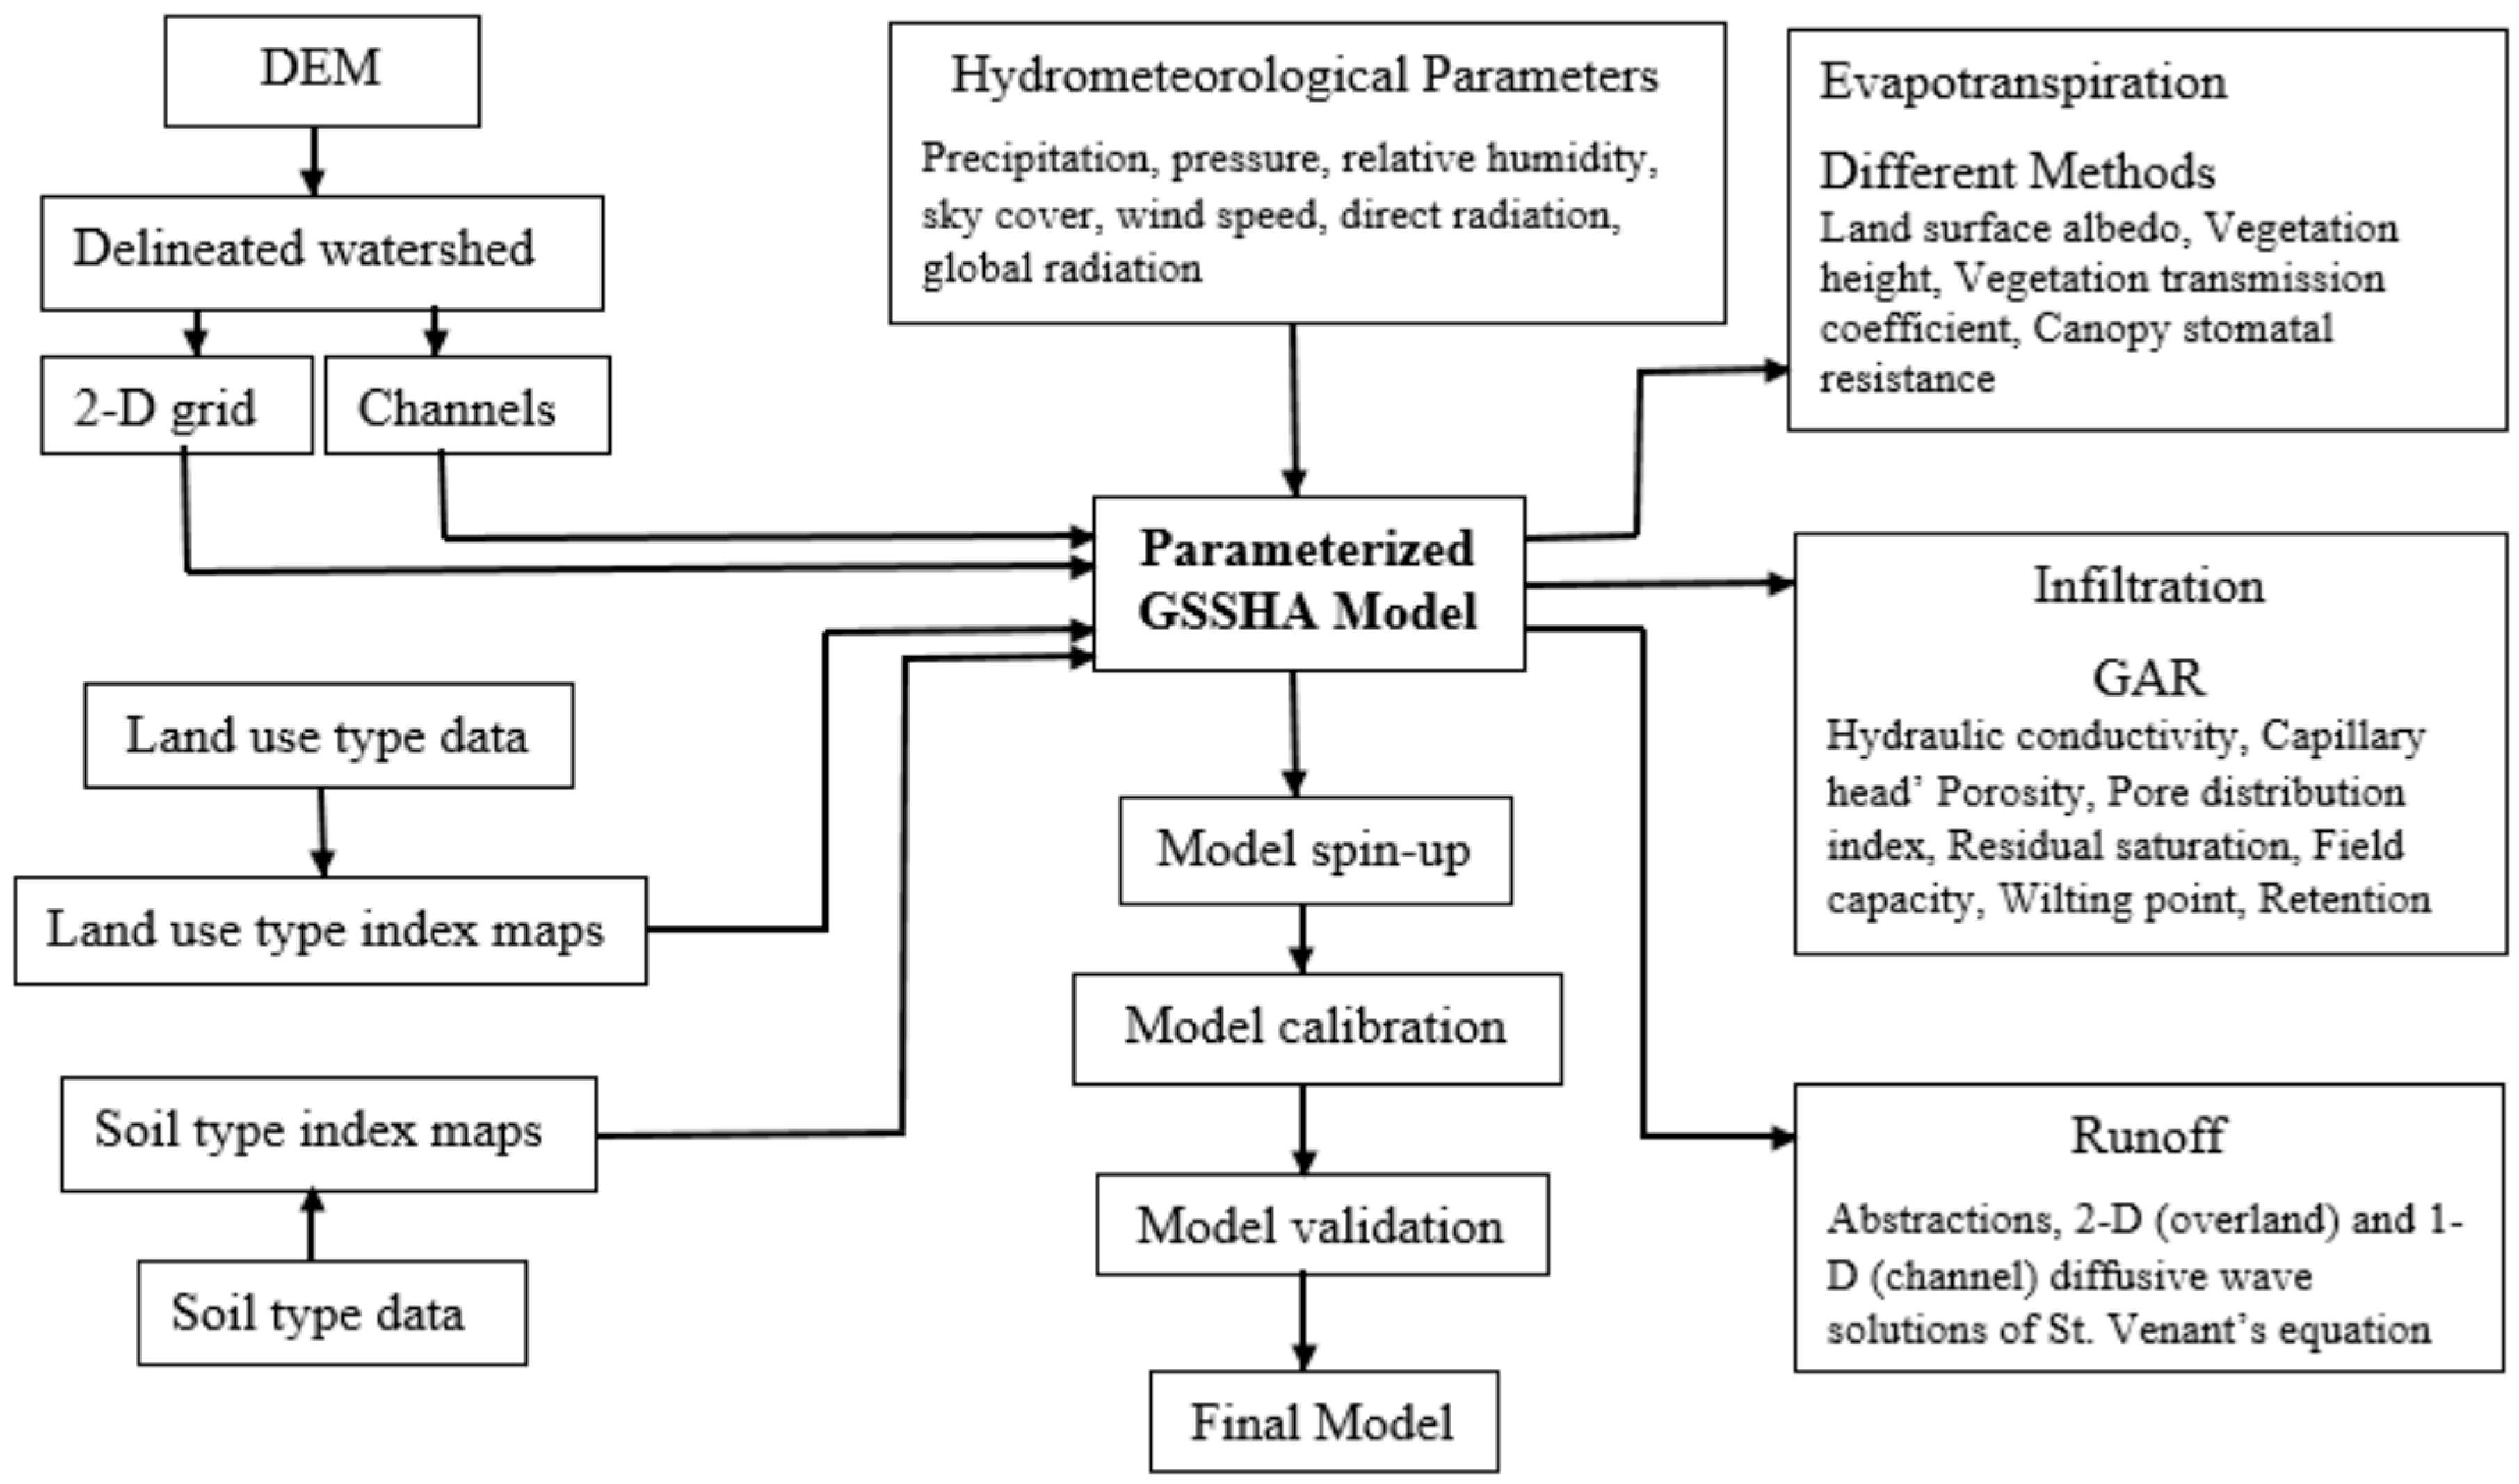
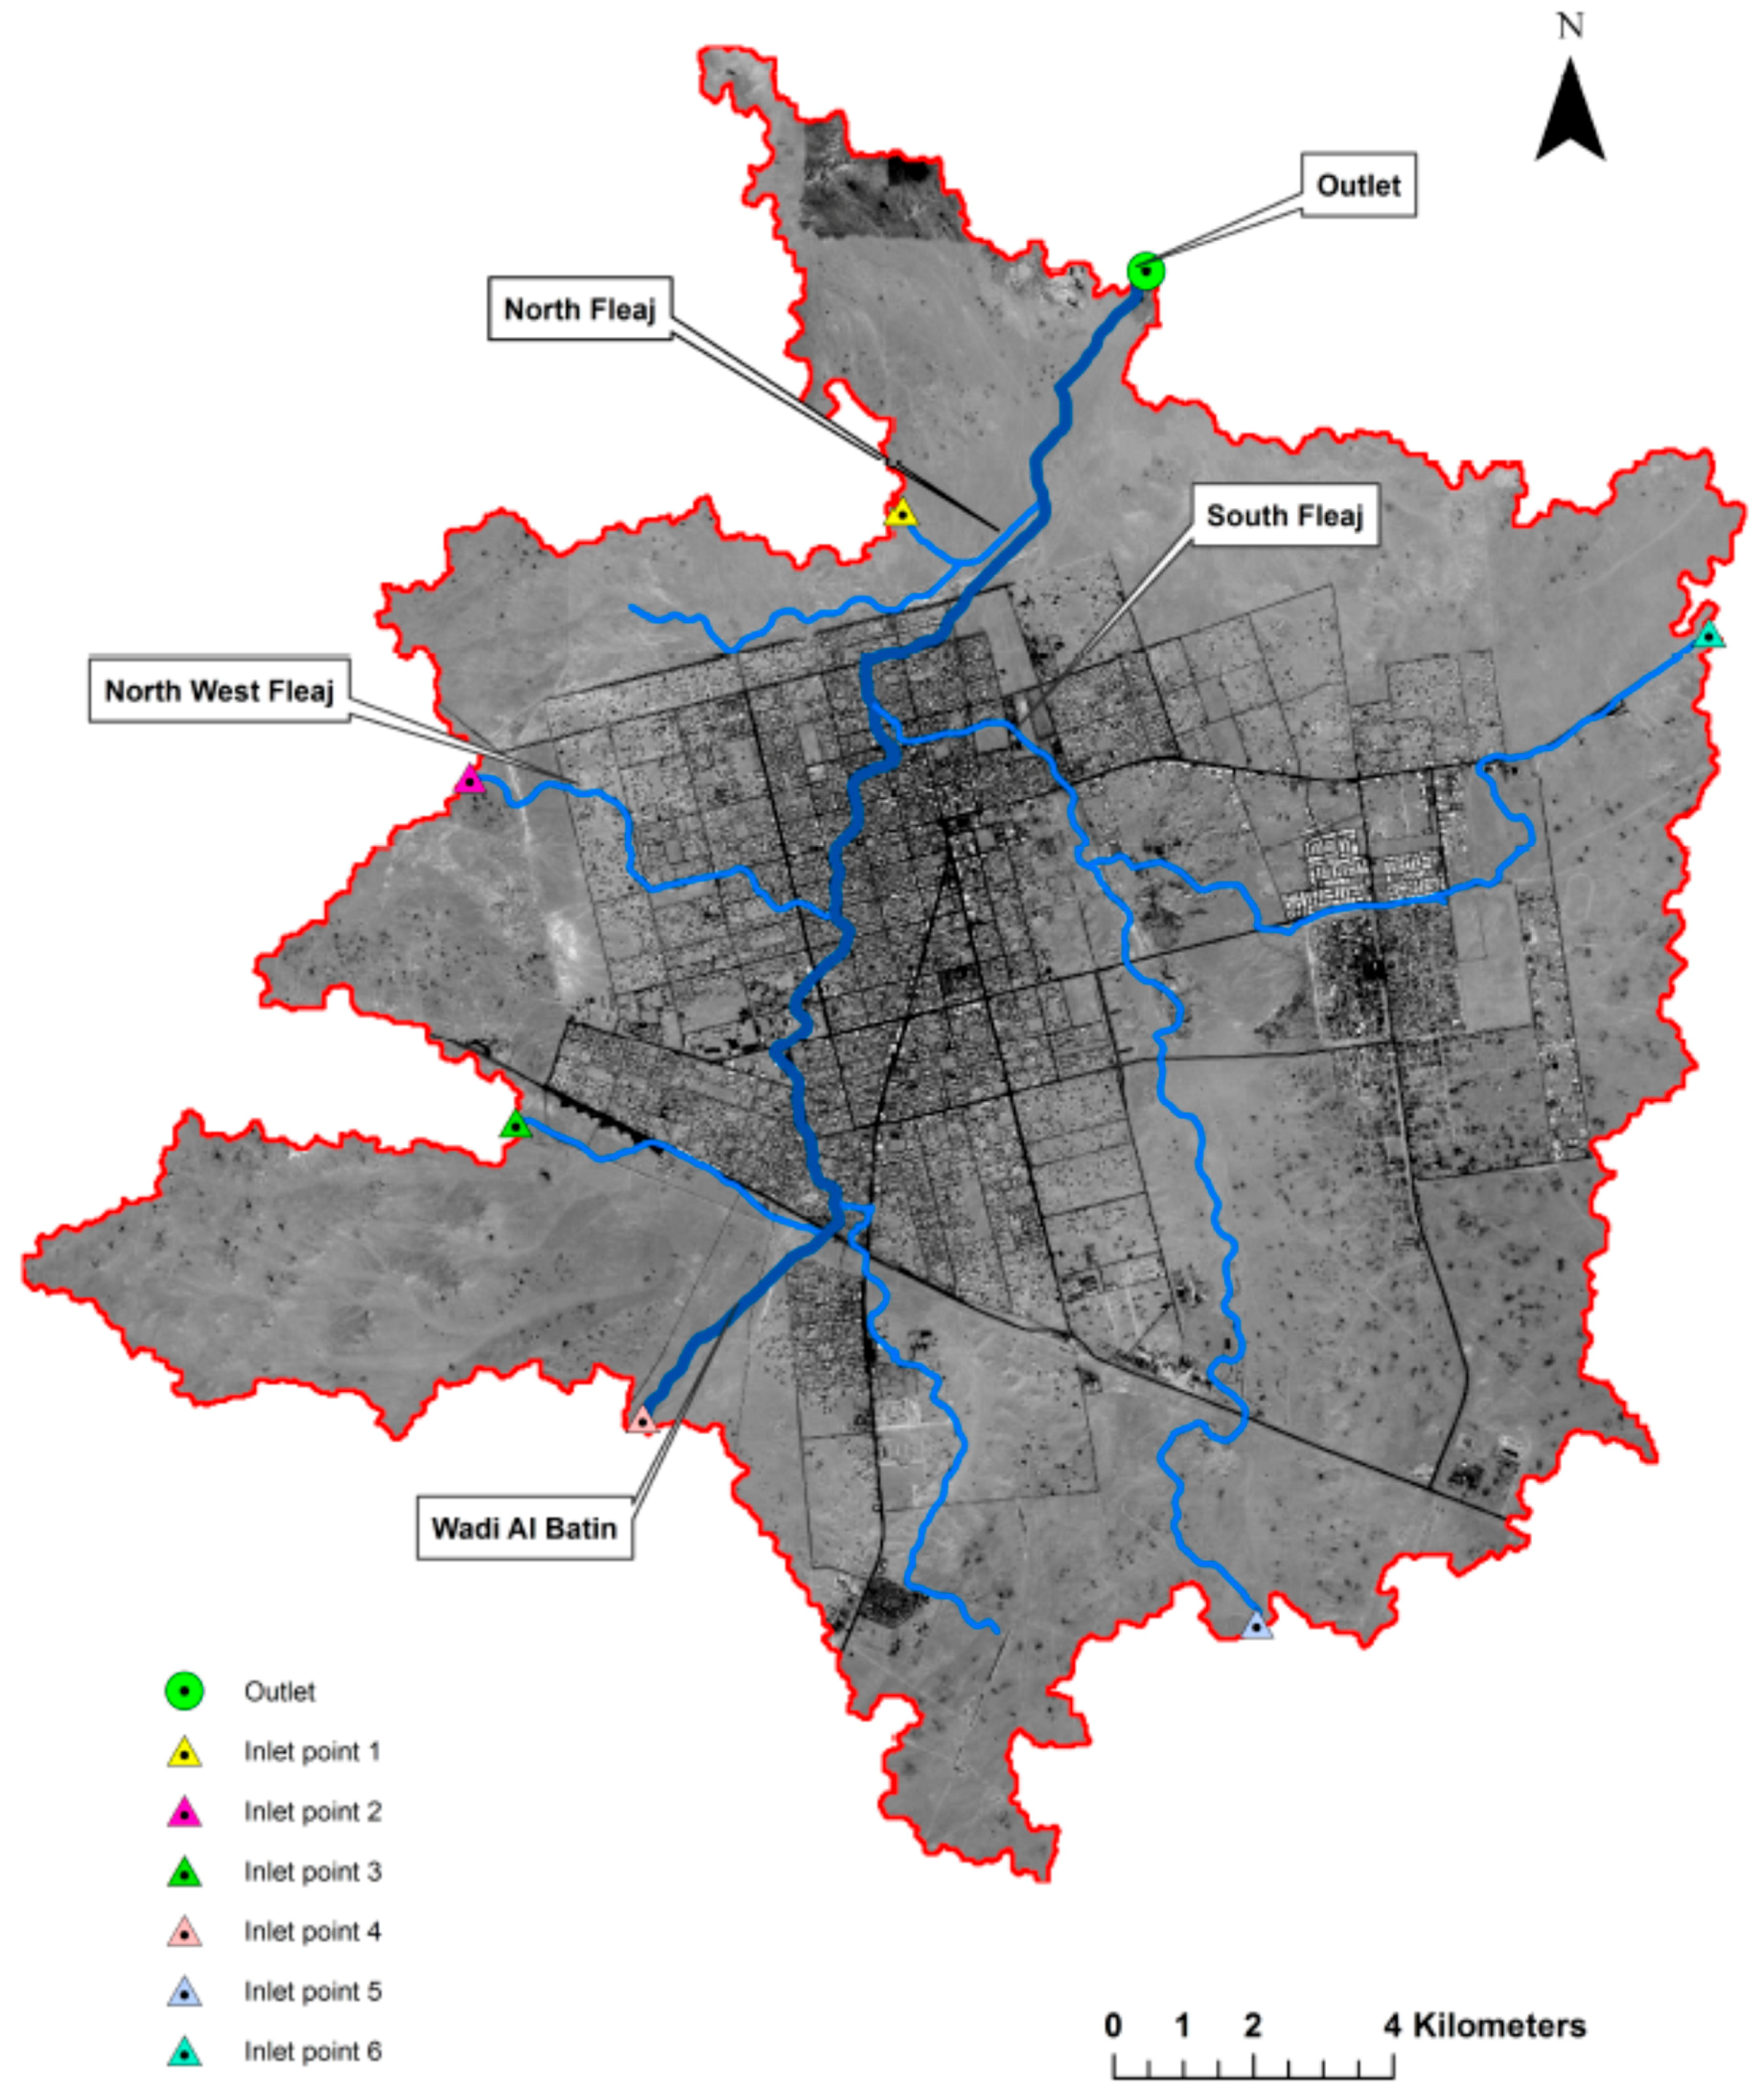
As the purpose of the hydrologic simulations of this study is to quantify the runoff generation and spatial distribution of flooding in the city of Hafr Al Batin (
Figure 2), the catchment outlet was selected just northeast of the city limits such that all of the city is included in the simulation. Digital Elevation Models (DEMs) at 30-m resolution of the catchment were based on the Saudi General Directorate of Military Survey (GDMS) national DEM data. These DEMs were based on photogrammetry and ground control data [
41]. ArcGIS 10.3 software was used for processing and resampling of the data to different resolutions (the grid cell size of the hydrologic model). The Watershed Modeling System (WMS) software [
42] was used to delineate the stream network and sub-catchments based on the DEM at variable resolutions. The stream network based on aerial photography was superimposed on the network generated through WMS-based delineation to make adjustments when necessary.
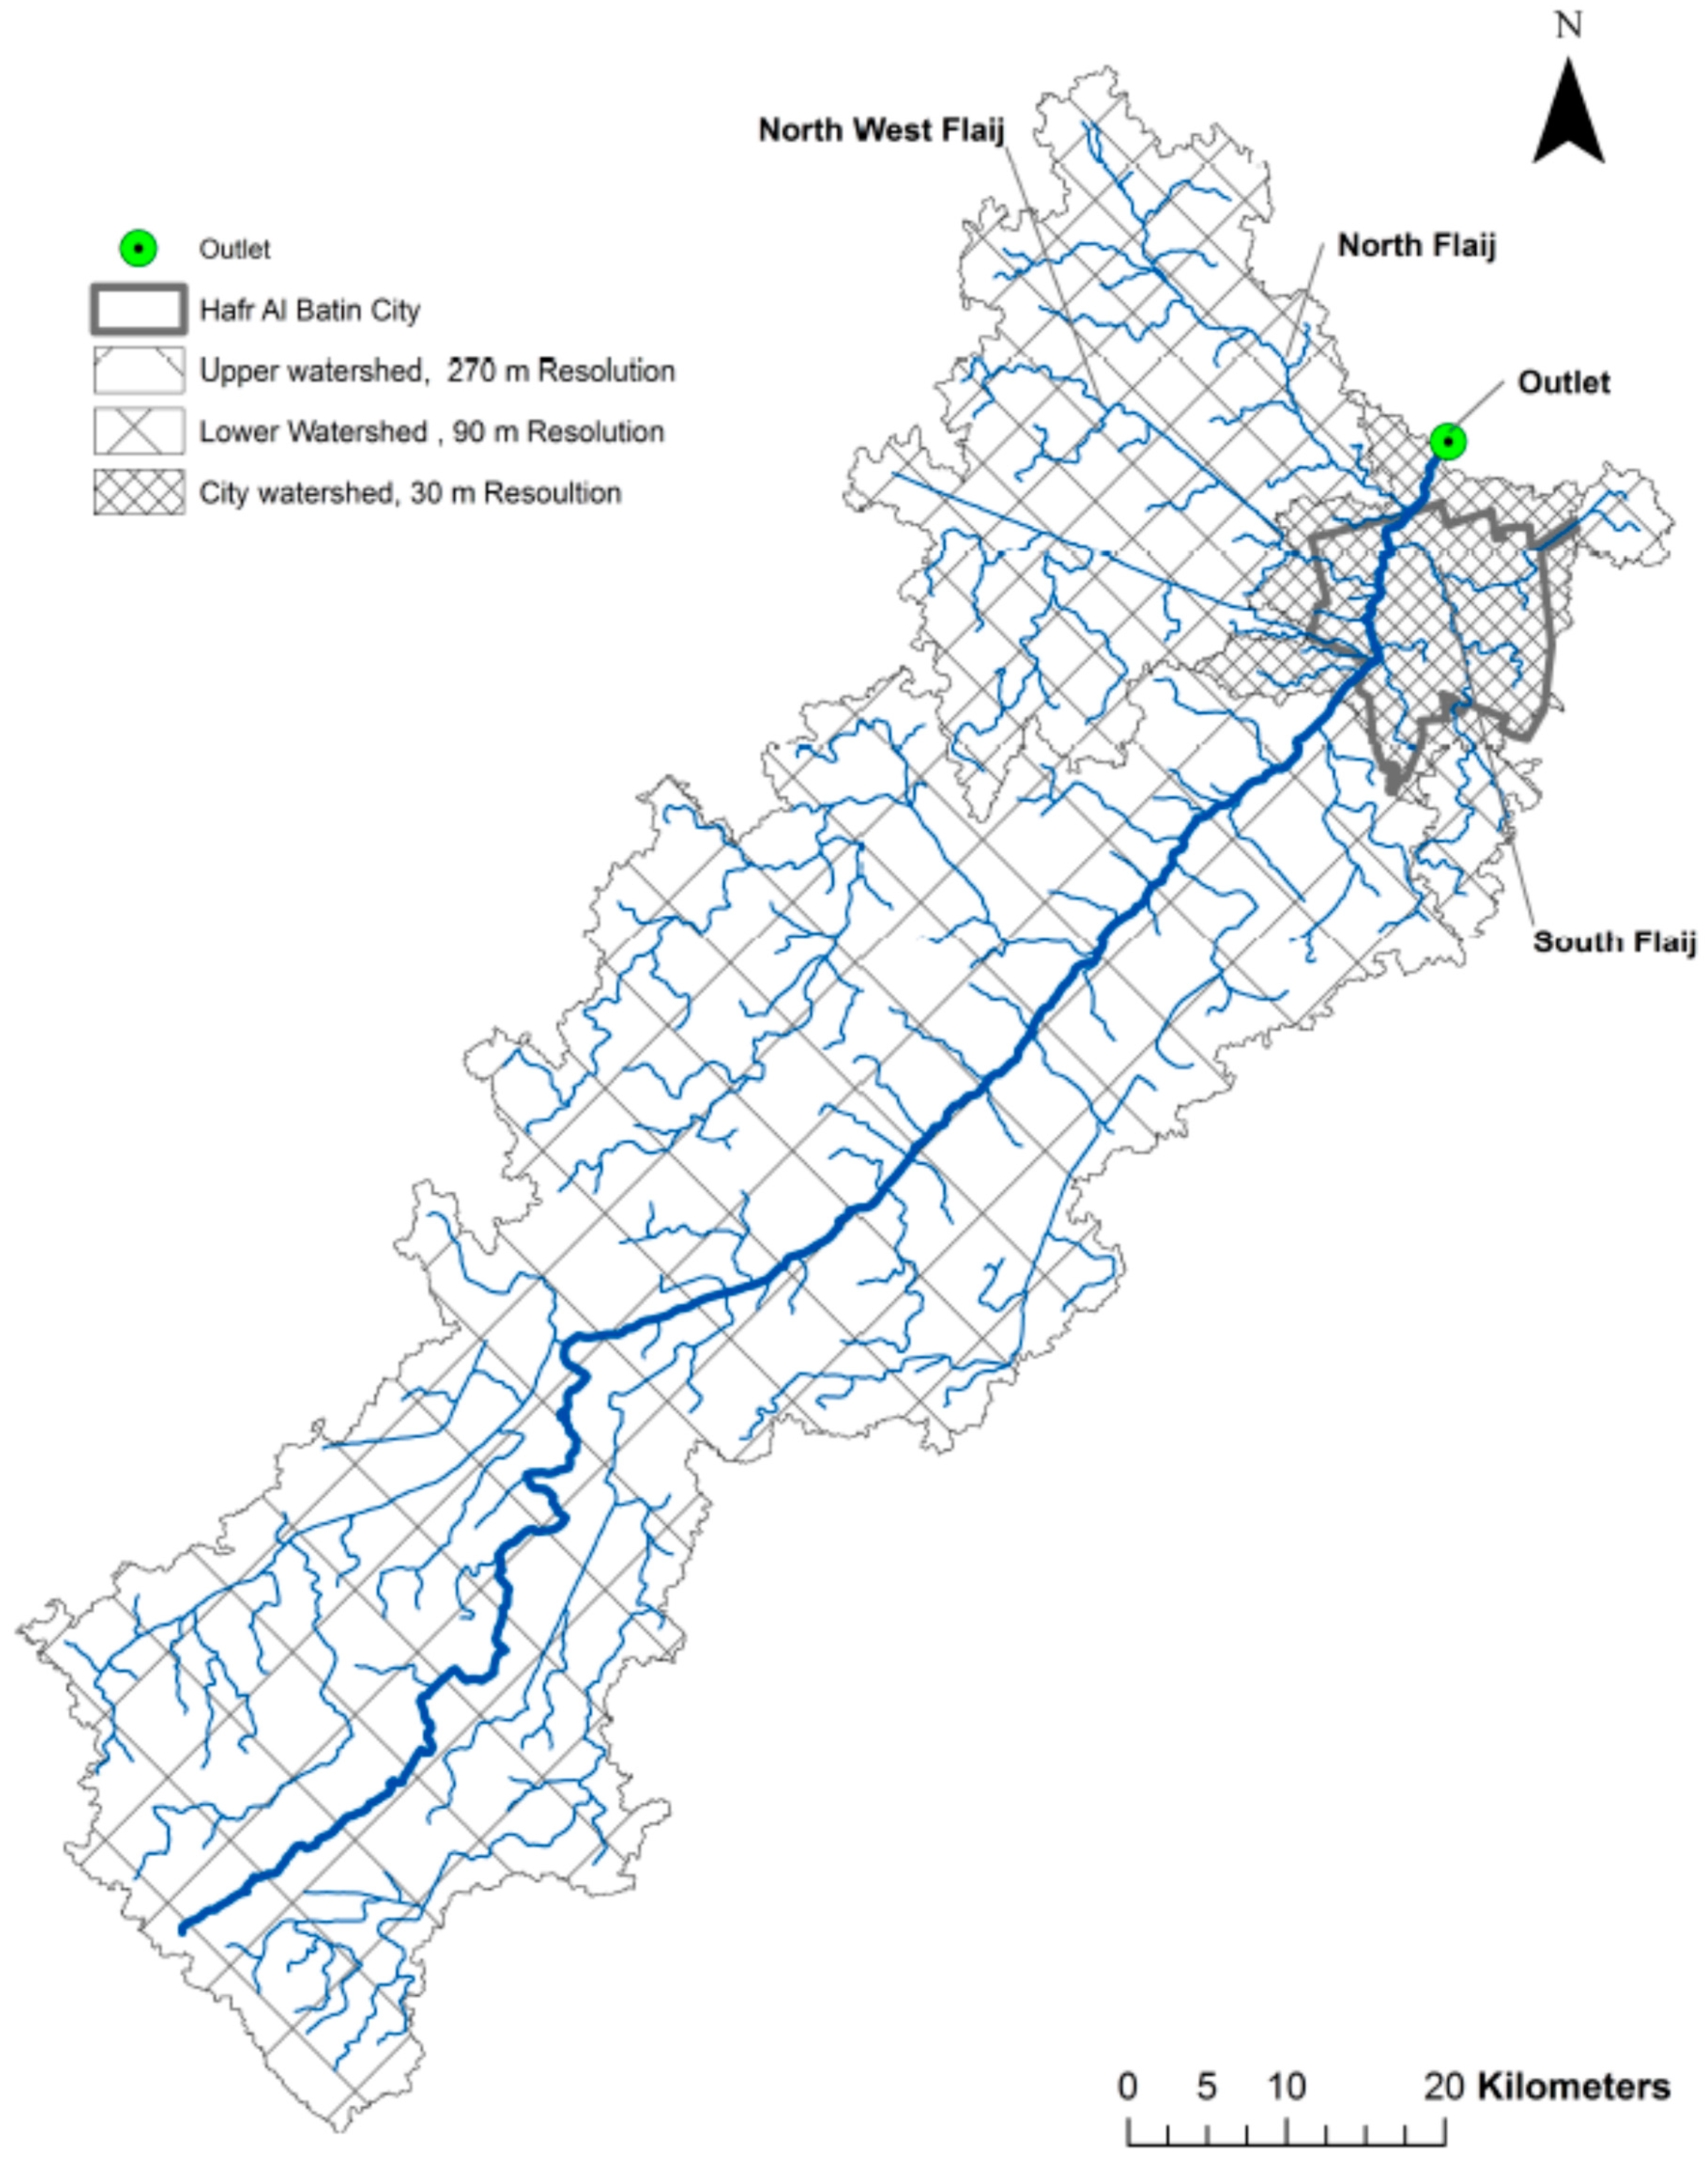
The drainage area of the delineated catchment is 4273 km
2, as seen in
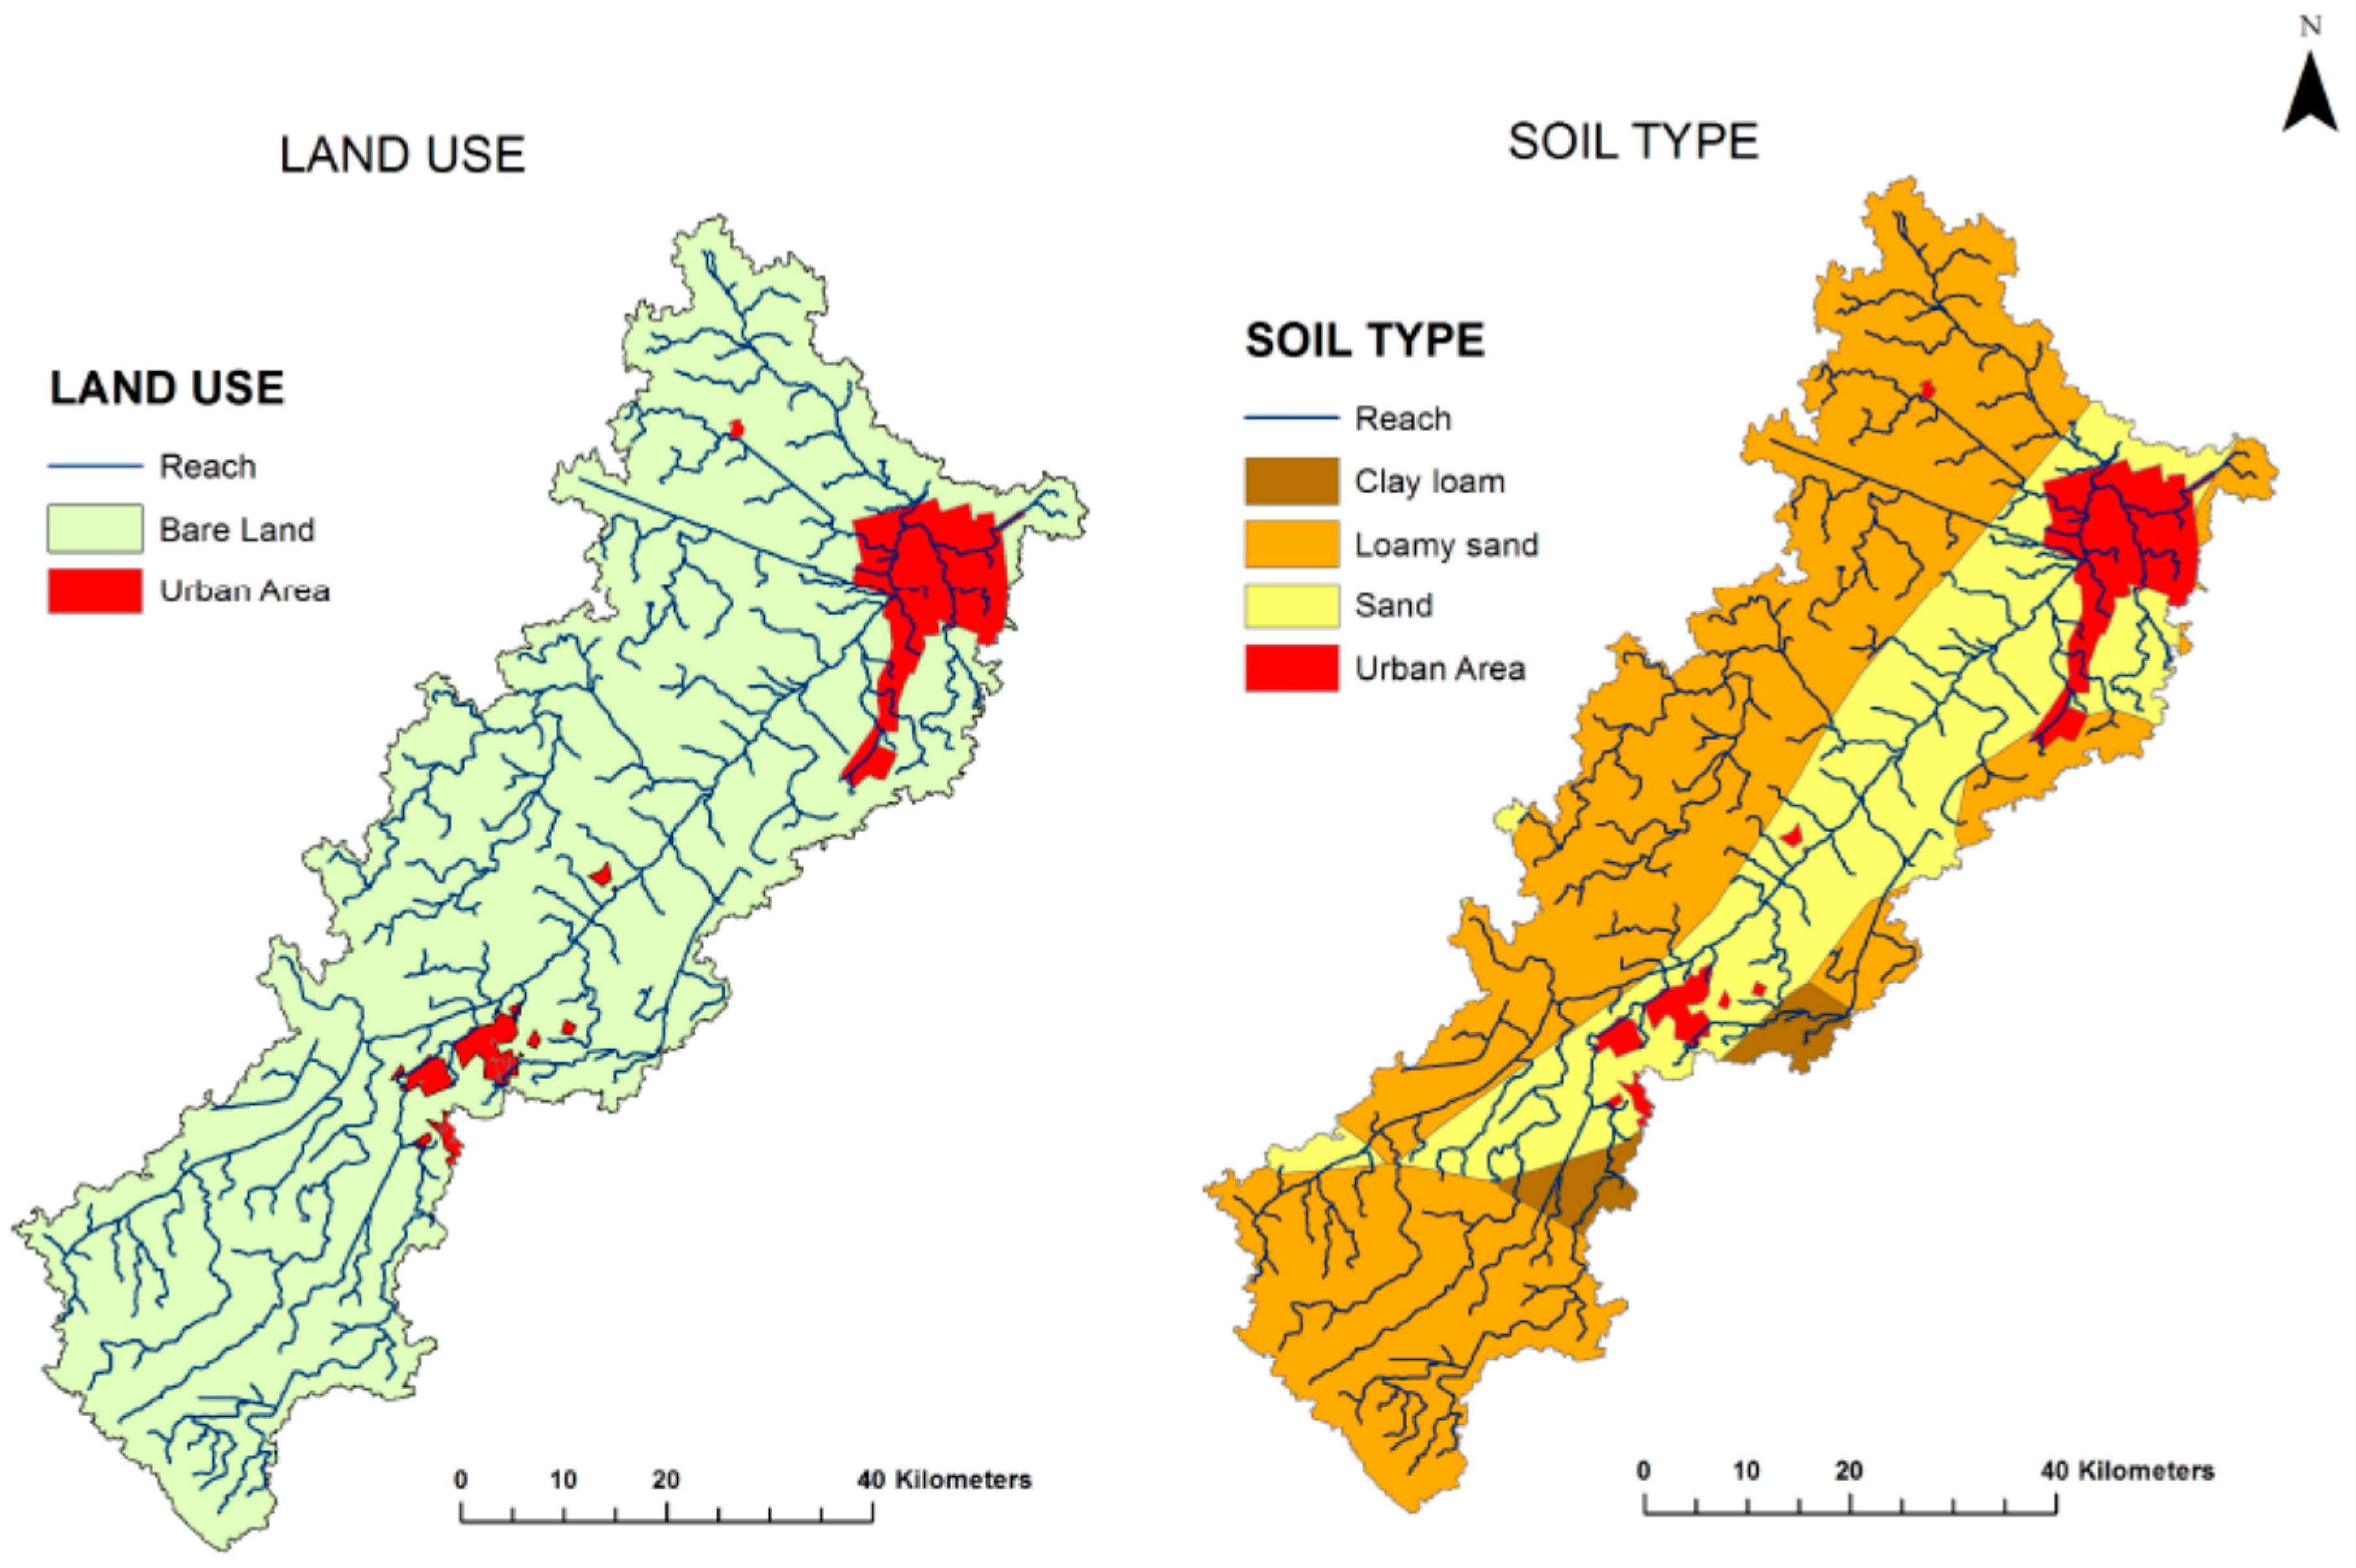
Figure 1, with the city of Hafr Al Batin representing only about 7.2% of the delineated area. The densely urbanized part represents about 4% of the total catchment. The catchment has a generally mild slope with elevation ranging between around 660 m above mean sea level at the western edge and 203 m at the outlet. The catchment is dominated by a combination of sand and gravel soil while the alluvial fans of the ephemeral streams (wadis) consist of weathered and fractured limestone and sandstone and permeable sediments. Soil and land use data over the catchment are shown in
Figure 3. Land use/cover data were obtained from Spot 5 and Landsat remote sensing imagery. Soil and geologic data were obtained from the Saudi Geological Survey maps. Soil properties and parameters were derived from the digital soil map of the world [
43]. These datasets were compiled and then processed in ArcGIS 10.3 to create GSSHA input files that represent the physical characteristics of the watershed.
The delineated catchment includes three other wadis that meet Wadi Al Batin (
Figure 2) in or around the city. The North Fleaj originates northwest of the city and joins the main channel just north of the city. The Northwest Fleaj that joins Wadi Al Batin near the center of the city passes through a heavily urbanized area. The South Fleaj that originates southeast of the city and flows through sparsely urbanized areas except near its confluence with the Wadi Al Batin’s main channel in the northern part of the city.
4. Results
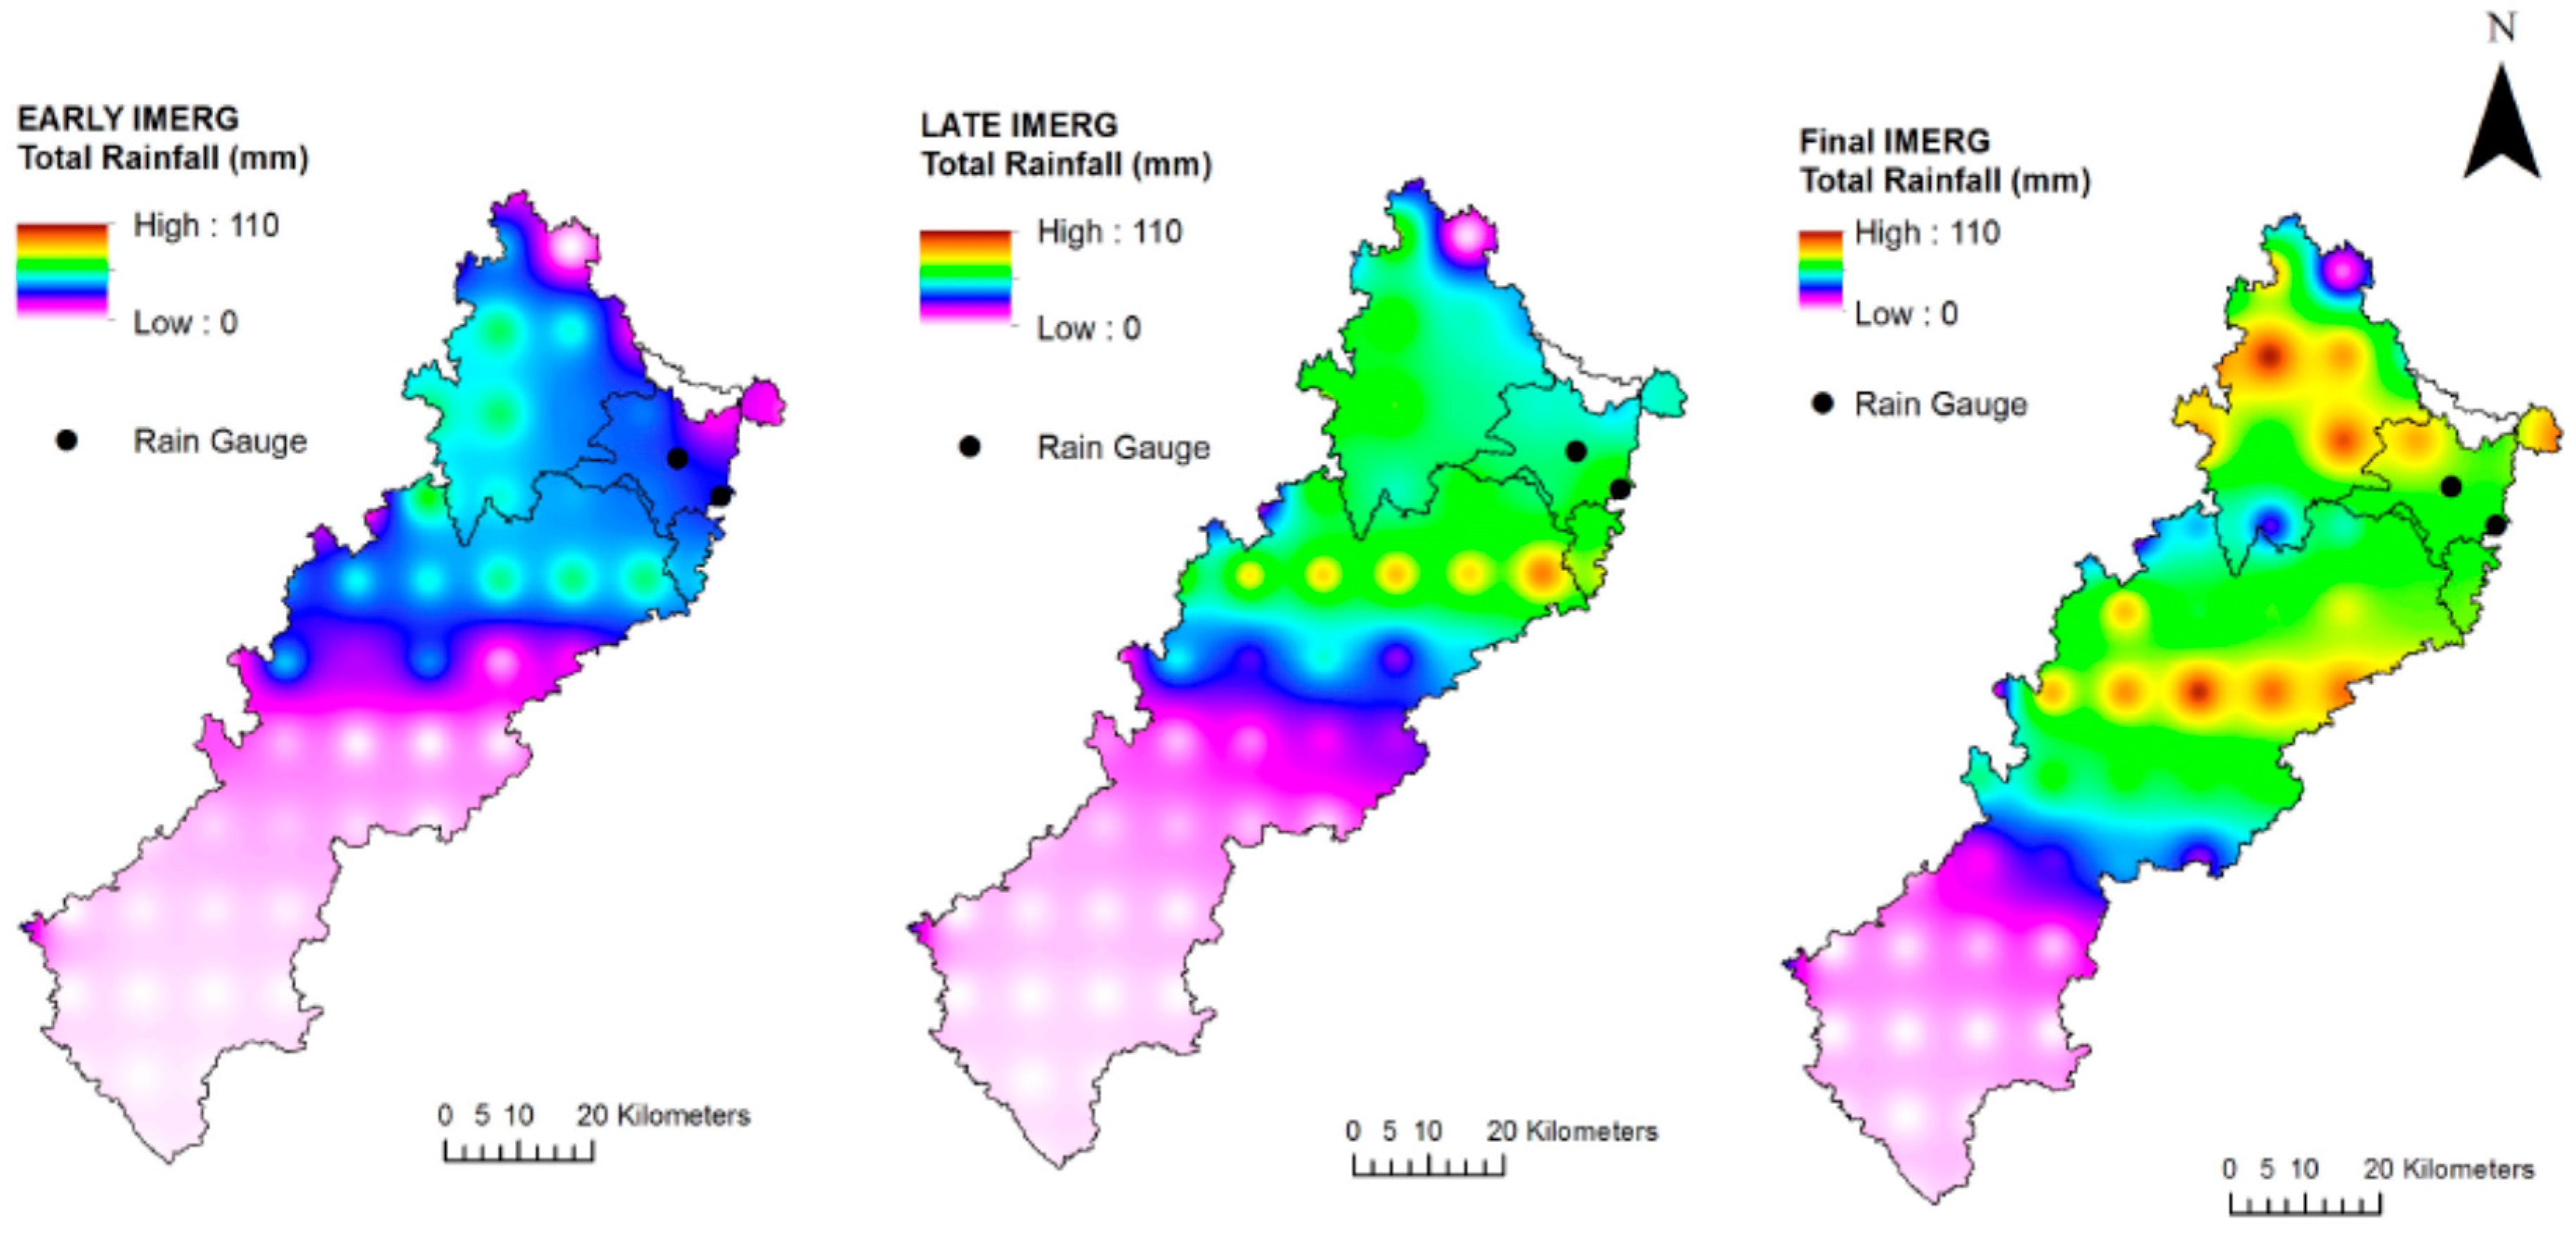
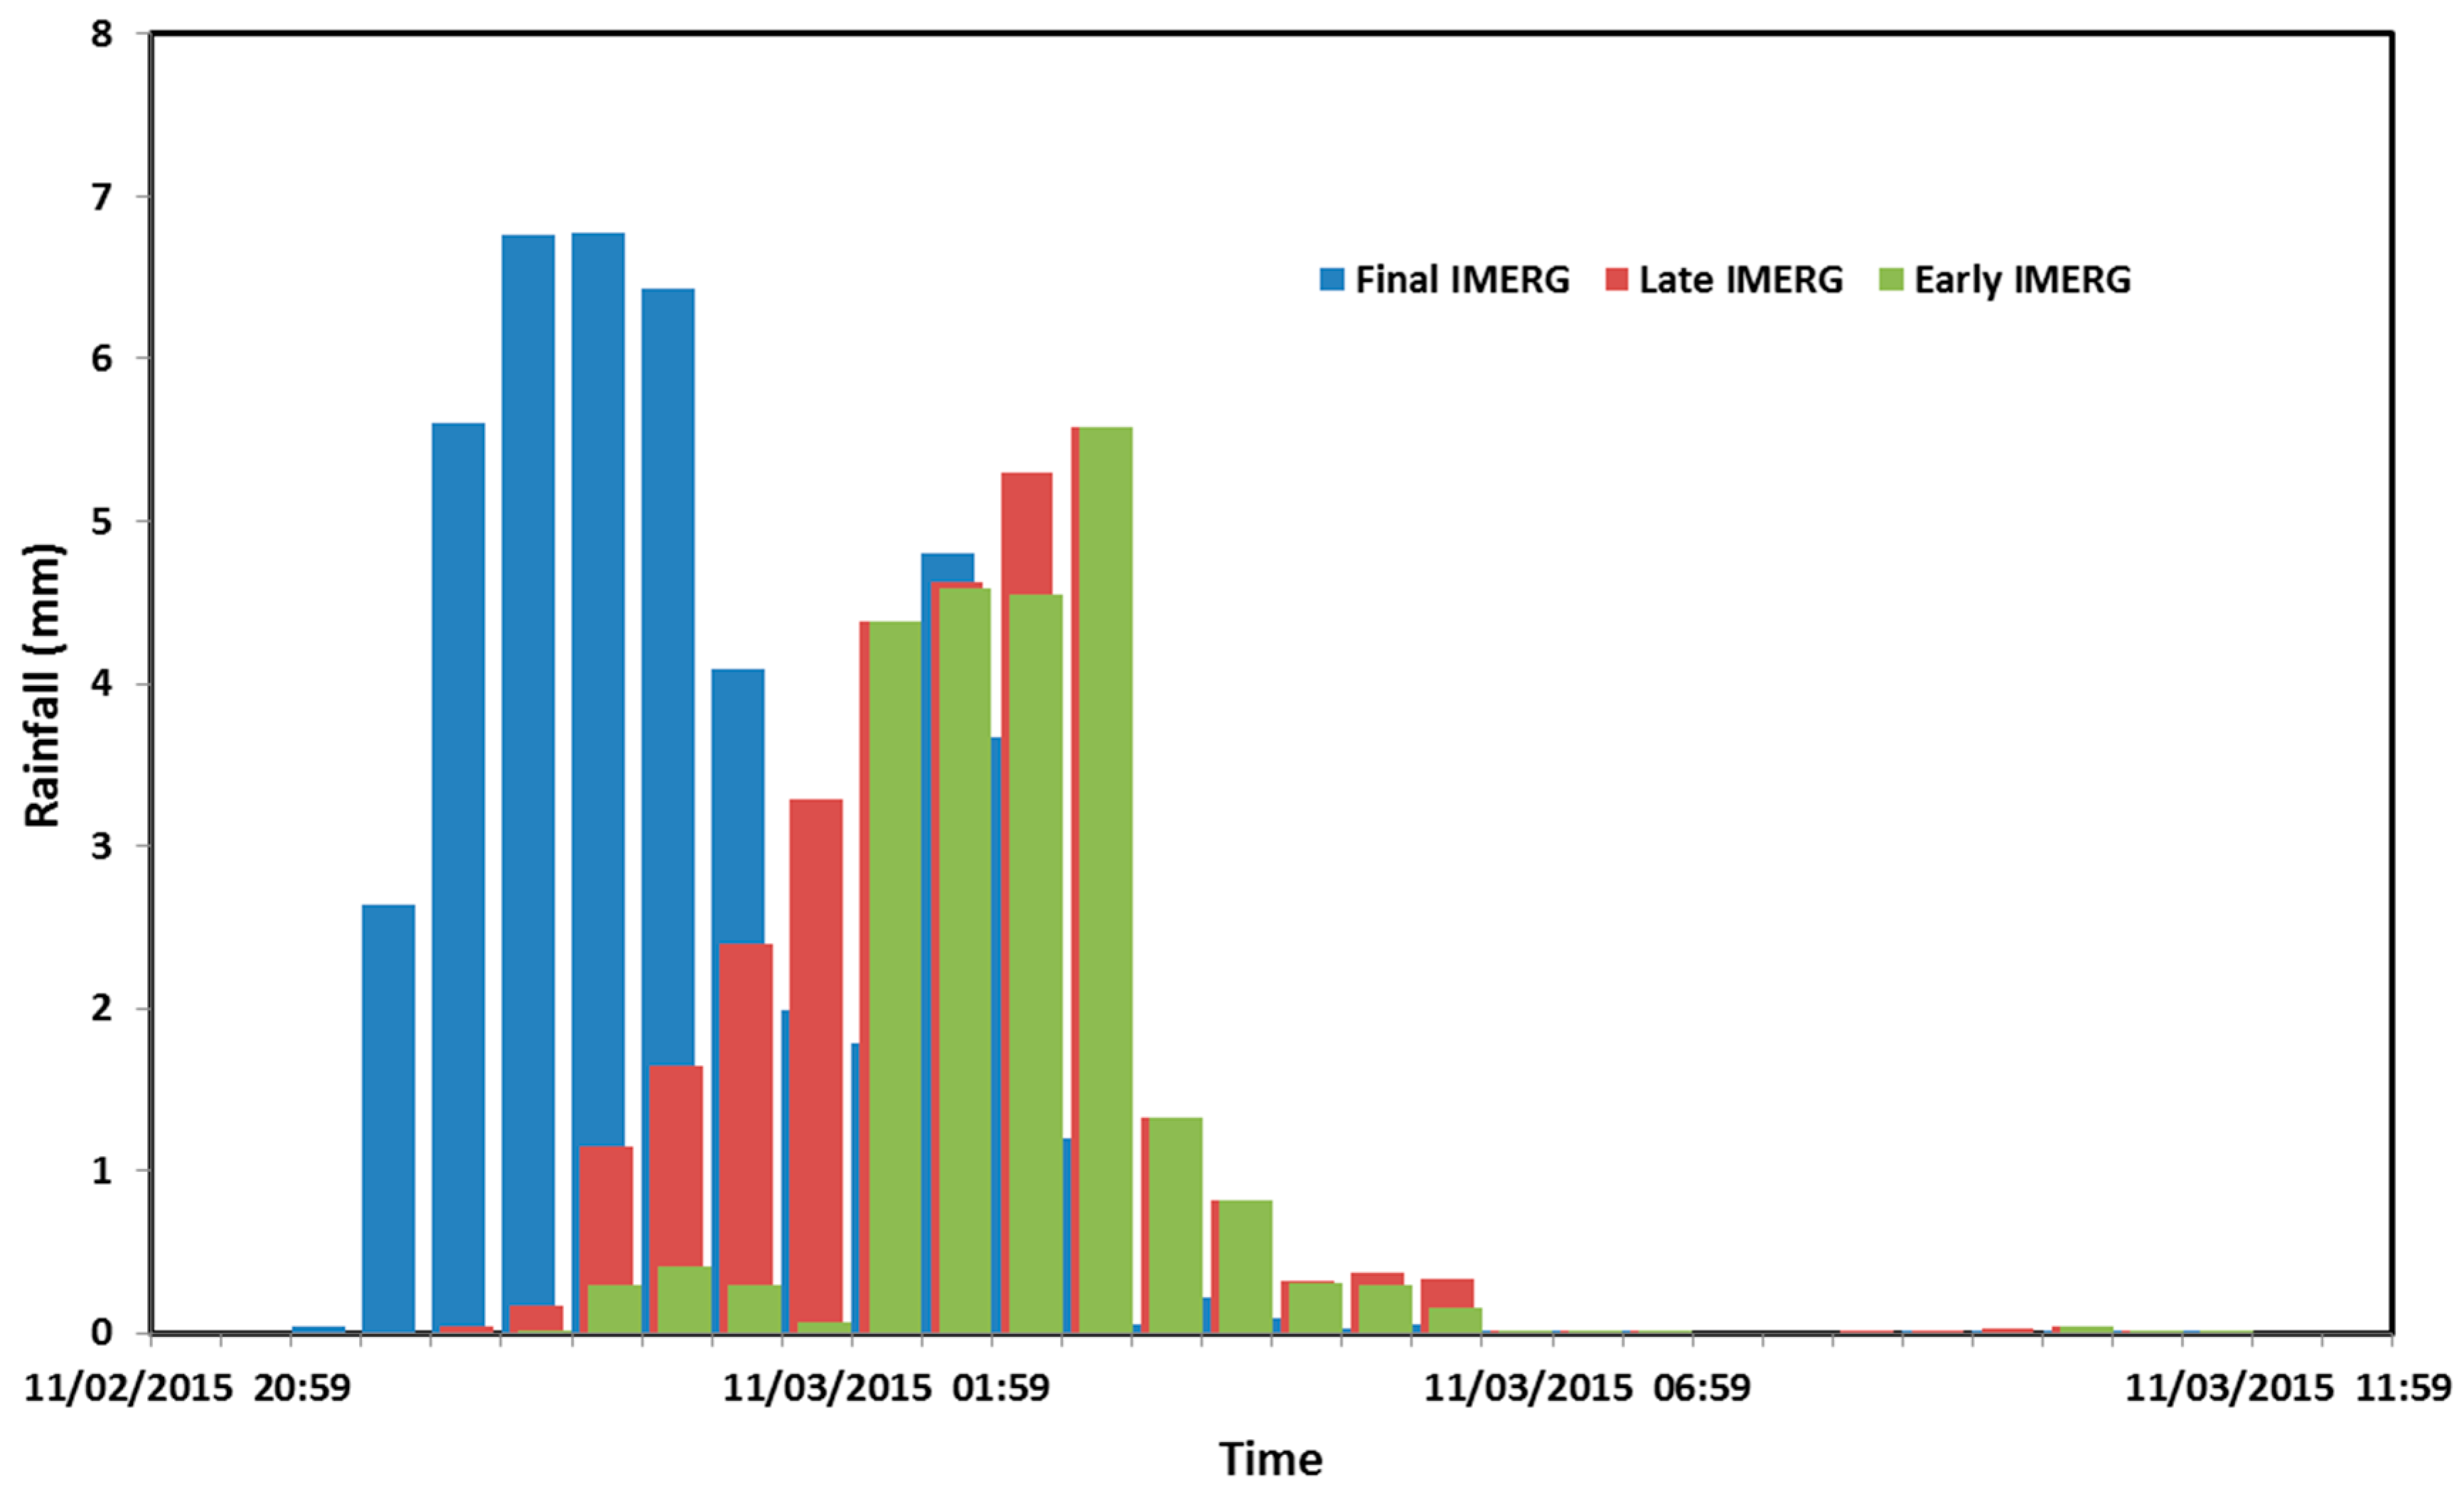
The storm event started on 2 November 2015 at 9: 30 p.m. local time and ended at 11:30 a.m. on 3 November 2015. The spatial distribution of the total rainfall accumulations over the catchment estimated by the three GPM products, using Inverse Distance Weighted (IDW) interpolation, is shown in
Figure 7. For the three products, the high amounts of rainfall fell on the urbanized portions of the catchment and immediately to the west of the city of Hafr Al Batin. Only two rain gauges were operational during the storm and they reported total accumulations (
Figure 7). The Ministry of Environment, Water, and Agriculture rain gauge located inside the city recorded 63 mm while the Presidency of Meteorology and Environment rain gauge at the airport south of the city recorded 32 mm. The satellite grids collocated with the two gauges reported total accumulations of 47 mm and 23 mm for the Early IMERG product, respectively. The total storm precipitation averaged over the entire catchment for this product is 33.6–32 mm, 48 mm, and 47 mm over the upper, middle, and lower sub-catchments, respectively. The other two satellite products estimated slightly higher rainfall with the final IMERG product reporting the highest rainfall and a somewhat different spatial pattern of the storm. The total storm rainfall averaged over the entire catchment for the Late IMERG products are 37.2 (28.5, 44.7, and 43.1 mm for the three sub-catchments, respectively) and 46.2 mm for the final product (36.5, 52.9, and 51.9 mm for the three sub-catchments, respectively). The temporal distributions of rainfall the three IMERG products are shown in
Figure 8.
The GSSHA model was run for the period between 12:00 p.m. local time on 30 September 2015 and 10:30 a.m. on 5 November 2015 for the three catchments. The run was started one month in advance to spin up the model in order to obtain a reasonable estimate of the initial moisture content for each model grid (see Chintalapudi et al. [
30,
47] for details of model spin-up). The three GPM precipitation products were used to force the GSSHA model but the results forced by the final product will be discussed since this product is the one adjusted with climatology data and ground observations. The storm lasted for a period of 14 h which allowed for infiltration of most of the rainfall except in the urbanized areas. The discharge from the upper sub-catchment into the middle sub-catchment was very small due the small amount of rainfall and high infiltration in the barren dominantly sandy soils. The runoff ratio for the event was 1% and most of the water that reached the main channel infiltrated in the channel. The middle sub-catchment generated modest amounts of runoff with a runoff ratio of 5%. Most of the flow from the middle sub-catchment into the lower one occurred through the main channel. The discharge at the watershed was primarily due to runoff generated within the urbanized sub-catchment with inflow form the upstream sub-catchments representing more than 12% of the total discharge. The runoff ratio in the urbanized area was 15% due to higher rainfall, the significant impervious fraction, and efficient drainage by the natural channel network.
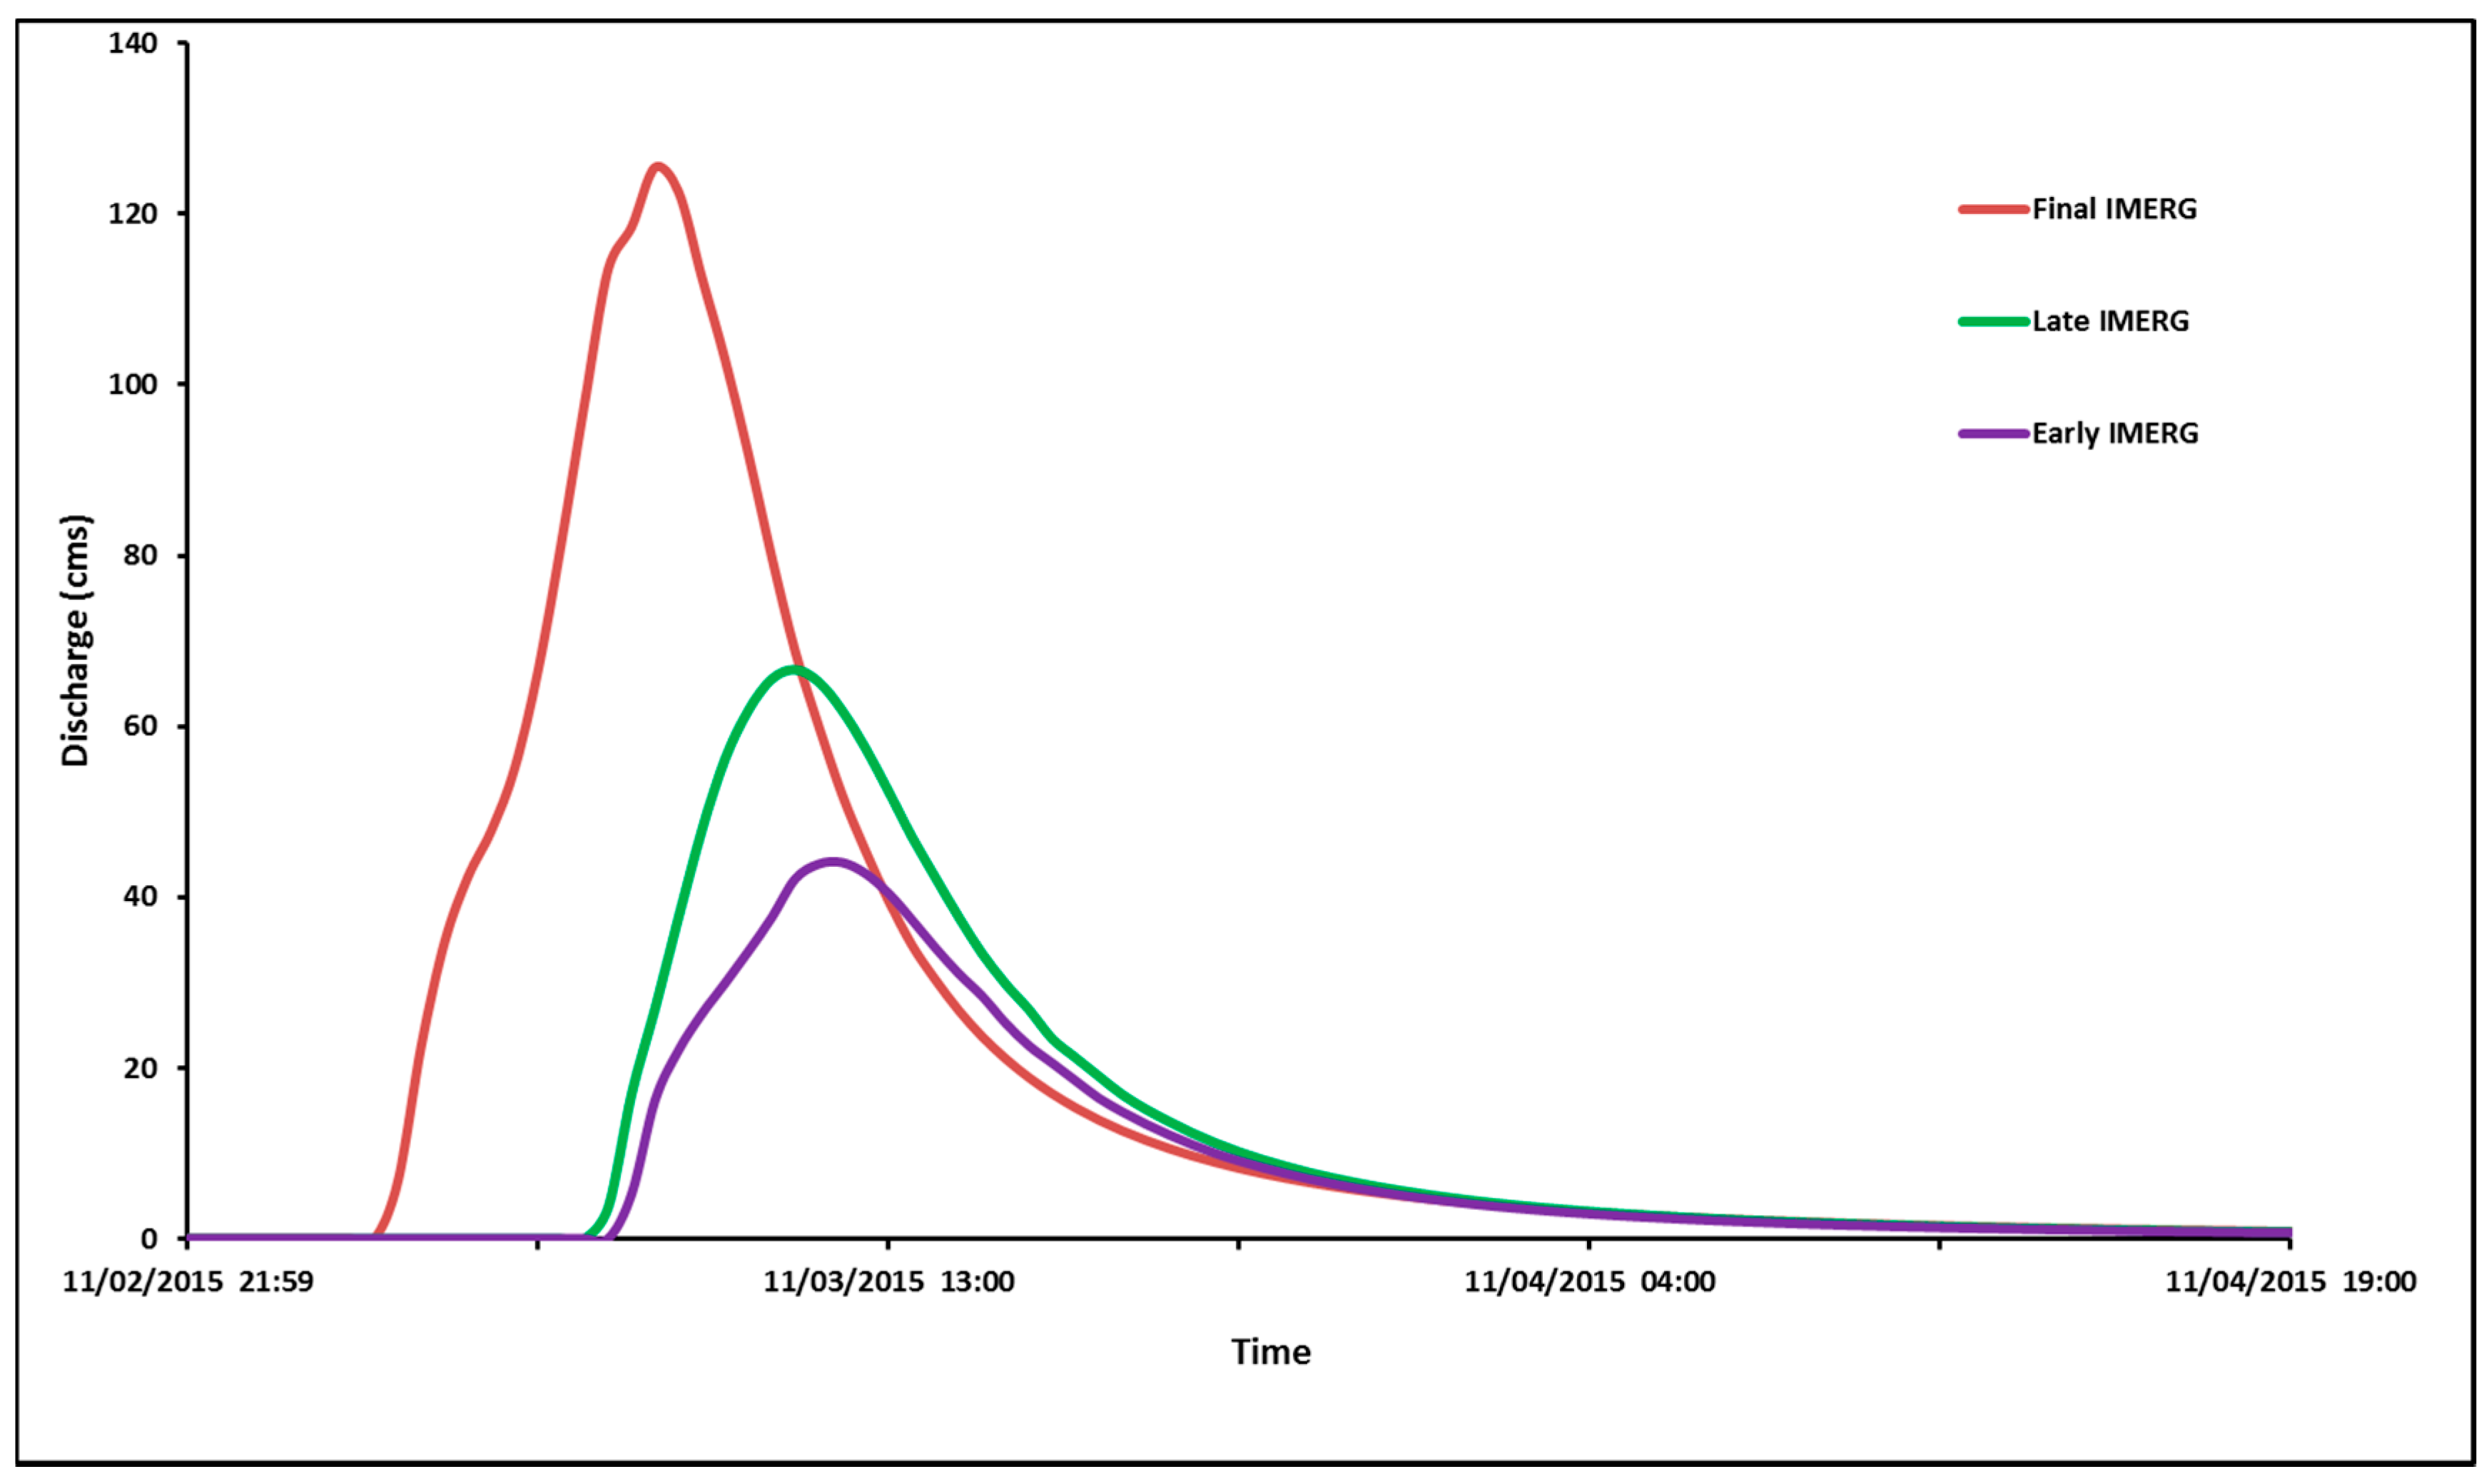
The peak discharge of 127 cms at the outlet occurred at 8:00 a.m. on 3 November 2015. Peak discharges were 10, 50, and 90 min earlier for the North Fleaj, the South Fleaj, and the Northwest Fleaj tributaries, respectively. The South Fleaj contributed most to the total discharge at the outlet (about 46%) and has the highest peak among the tributaries. The contribution from the North Fleaj and North West Fleaj was very small (each contributed just about 5%). Lack of development around the South Fleaj indicates that this tributary witnesses frequent flooding, even more than the main Al Batin Wadi. Underestimation of rainfall by the Early and Late IMERG products was amplified in runoff simulation, producing much smaller outlet peak discharges of 44.2 and 66.7 cms, respectively.
The predicted outlet hydrographs when the model was forced by the three IMERG products are shown in
Figure 9. As described in the introduction section, the final IMERG product is the best rainfall product. There are no streamflow observations for the event, however, GSSHA simulations highlight the fact that rainfall errors will result in higher runoff errors and give an idea about the magnitude of runoff error (in this case, difference between using calibrated and raw satellite rainfall) to be expected when the real-time product is used for flood forecasting.
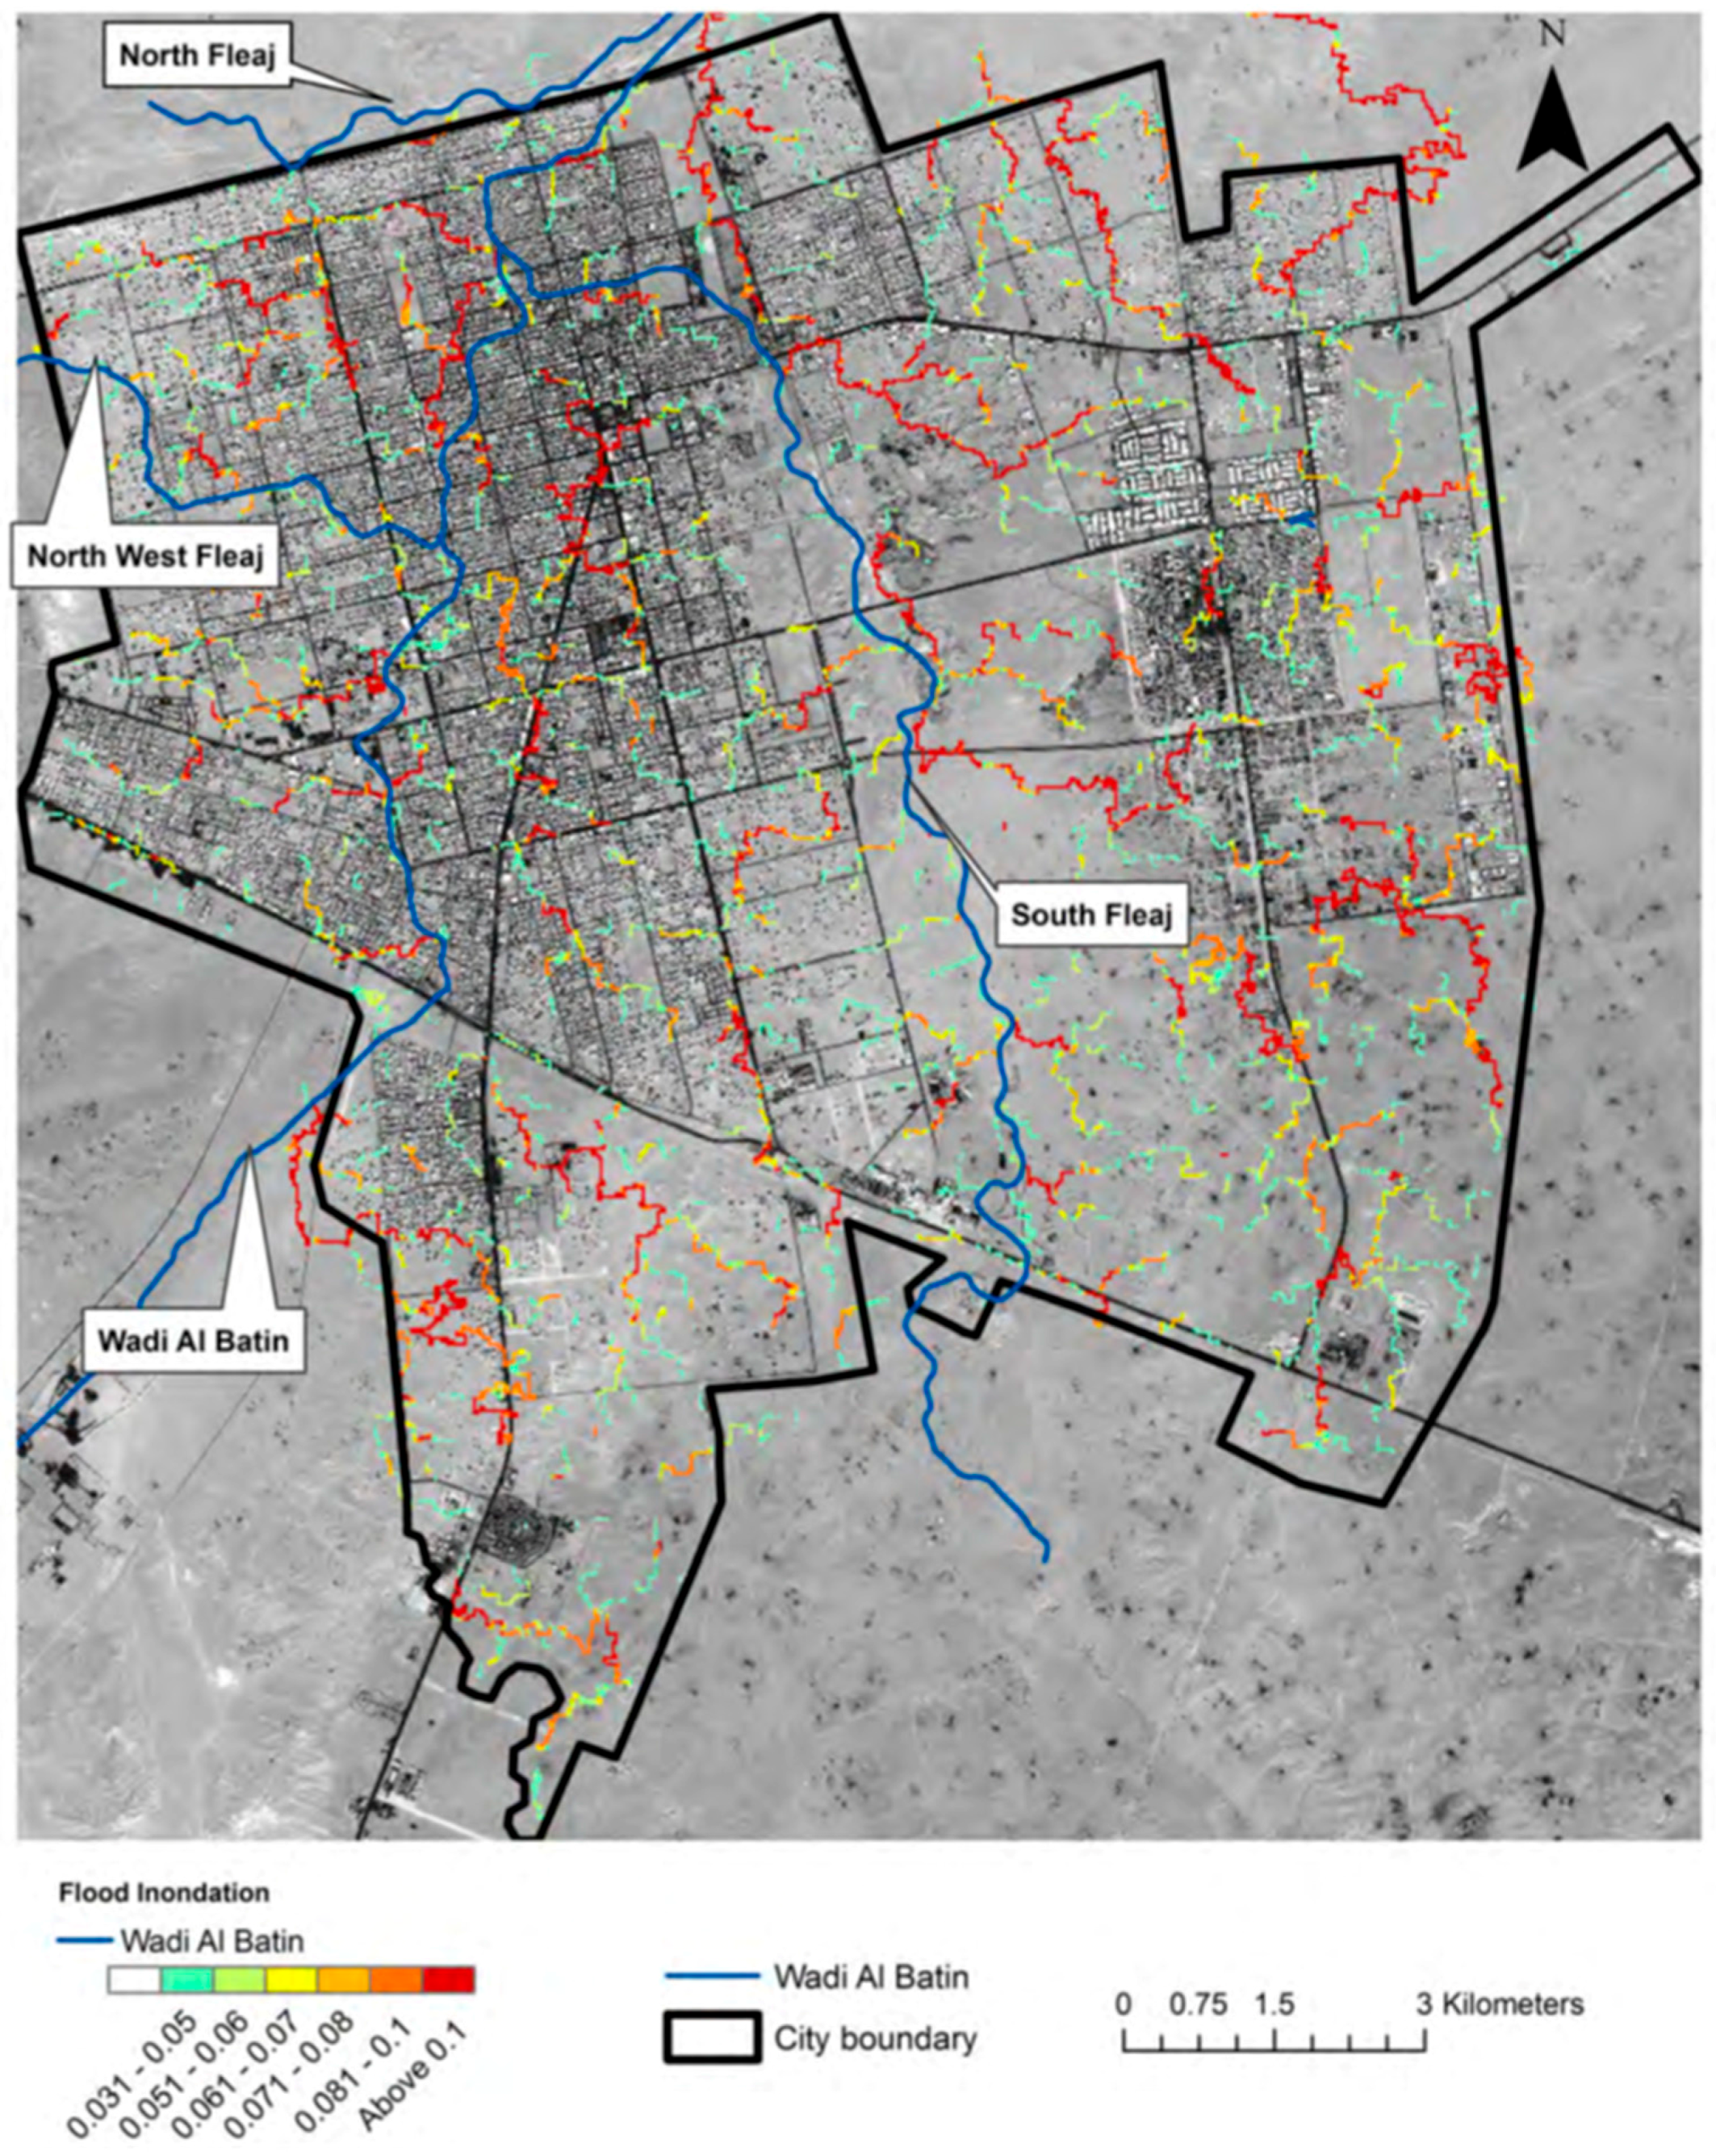
GSSHA outputs also include the overland and channel flow depths at every time step. The map shown in
Figure 10 illustrates the maximum inundation over the city area as a result of the storm—only depth values above 3 cm are shown. The water depth values for each grid were estimated by GSSHA forced by the final IMERG product. The map indicates that most of the flooding occurred in the highly urbanized areas and near the center of the city. The map also shows significant flooding over some major streets. There is significant flooding also over the undeveloped areas adjacent to the South Fleaj. The storm did not result in any flooding at the confluences of the North West Fleaj and South Fleaj with Wad Al Batin. It is clear that the inundation is caused by topography and neither the Wadi Al Batin nor the South Fleaj witnessed overbank flooding. These results agree with media reports and photographs released after the event that described significant street flooding without a mention of channel overflow. The map shows that there is hardly any flooding outside the urban area, reinforcing the fact that the city was built over the ancient flood plain of Wadi Al Batin, which might be the reason for the city name, and the role of urbanization in increasing the flood hazard. When GSSHA was forced by the Early and Late GPM products, the inundation maps illustrate smaller flooding depths and extent.
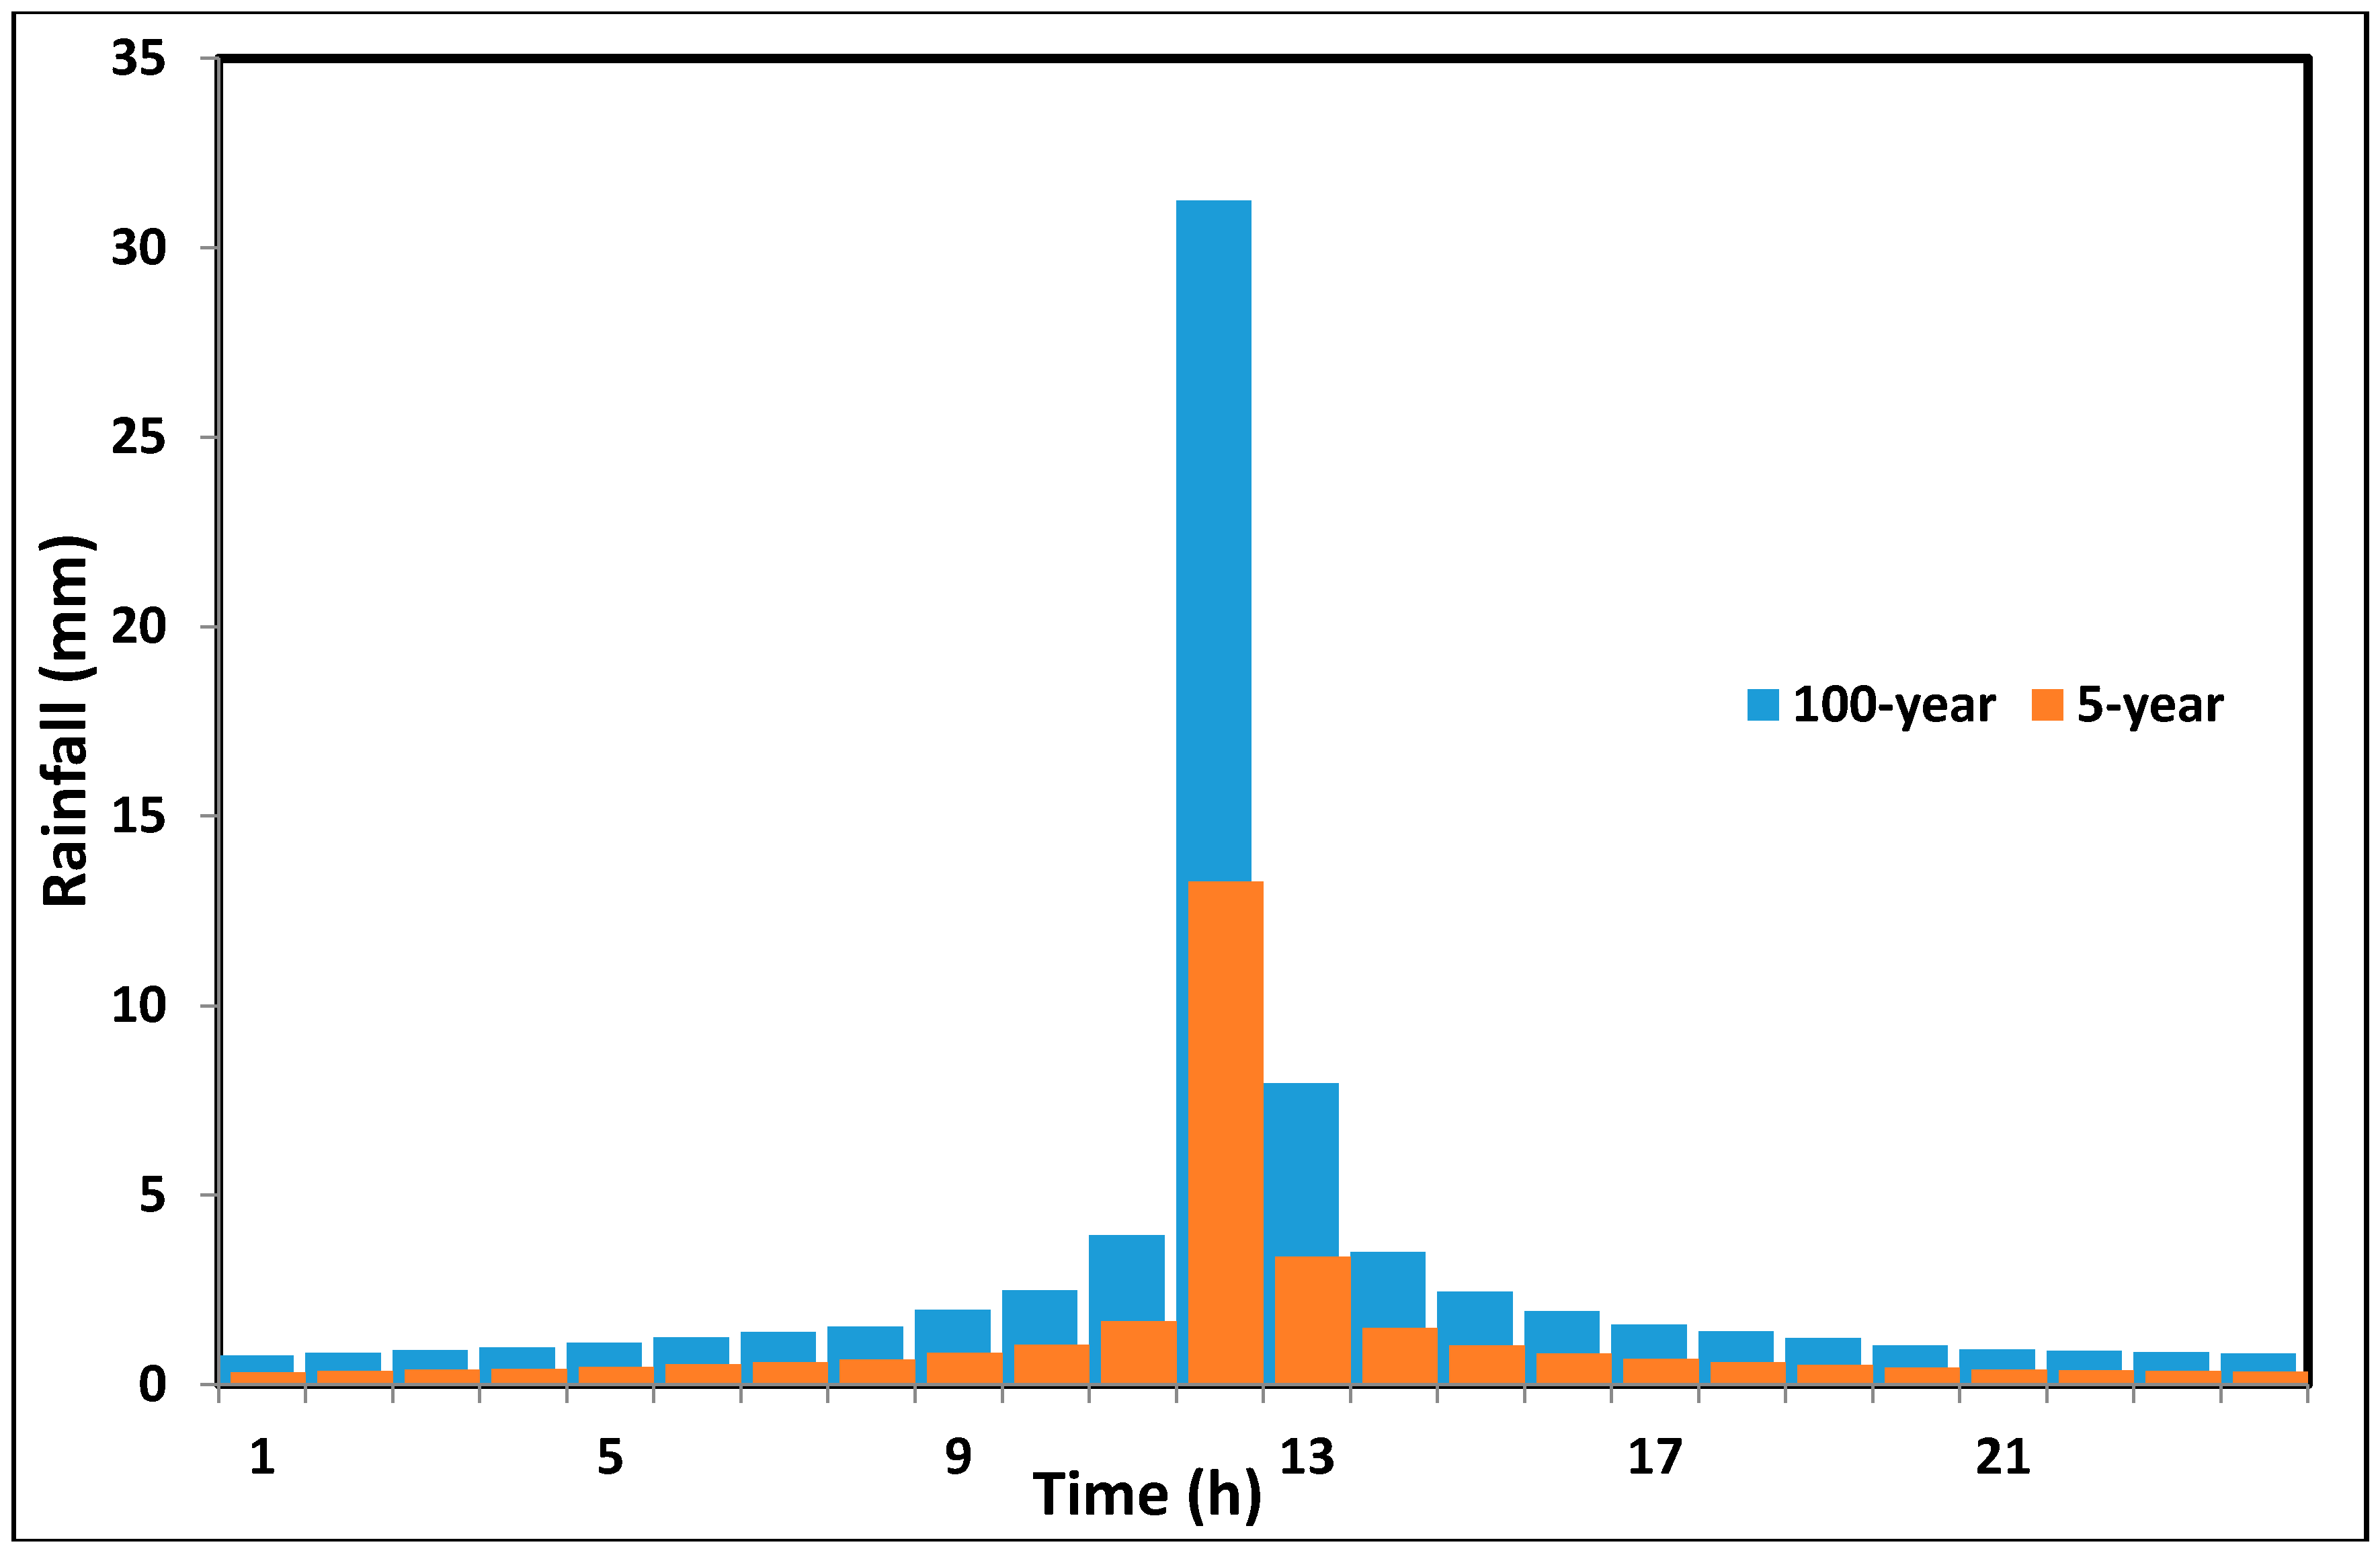
To understand the role of tributaries and inflow from the upper portions of the catchment in the city of Hafr Al Batin flooding, two more GSSHA simulations were performed: a simulation representing the frequent flood events in the city and another simulation representing extreme events. GSSHA was run with the 5-year, 24-h, and 100-year, 24-h storms, which are considered spatially uniform. The two storms were based on statistical analysis of the historical rainfall data from the Ministry of Environment, Water, and Agriculture rain gauge with a record starting from 1979. The 24-h rainfall accumulations for the 5-year and 100-year, 24-h storms were found to be 31 mm and 73 mm, respectively, using Log-Pearson Type III distribution (LPT III) [
48]. Due to the size of the catchment, an area-reduction factor of 0.8. Was used (see [
49,
50]). The temporal distributions of the designed storms, which are based on Type II storms [
51], are shown in
Figure 11. GSSHA simulation results indicate that the upper sub-catchment contributes less than 1% of the total discharge flooding in the city for the 5-year storm. Contribution from the middle sub-catchment is also small, about 7%, for this event. The 5-year event does not generate much discharge at the outlet. The South Fleaj, Northwest Fleaj, and North Fleaj tributaries contribute about 52.2, 13.6, and 6.9% of that discharge, respectively. For the 100-year event, the contributions from the middle sub-catchment is significant. The peak discharge at the outlet of the upper sub-catchment is 5.5 cms and it contributes less than 3% of the total discharge at the outlet. The middle sub-catchment contributes 21% of the total discharge with a peak of 50 cms at the main channel. Again, South Fleaj contributed most to the total discharge of the lower sub-catchment (53%) and has the highest peak among the tributaries while the other two tributaries contributed smaller amounts −6% from the Northwest Fleaj and 5% from the North Fleaj.
5. Summary and Conclusions
In this study, the physically-based, distributed-parameter hydrologic model GSSHA, forced by Integrated Multi-satellite Retrievals for Global Precipitation Measurement Mission (IMERG) rainfall product, was used to study a recent flood event in the city of Hafr Al Batin, Saudi Arabia. Due to the large size of the catchment that encompasses the city, it was divided into three hydrologically connected sub-catchments: a lower sub-catchment that represents the urban area, an upper sub-catchment dominated by barren desert land, and a middle sub-catchment. A variable model grid size of 270 × 270 m2, 90 × 90 m2, and 30 × 30 m2 was adopted for the upper, middle, and lower sub-catchments.
The semi-real time IMERG products underestimated the event rainfall with much more pronounced underestimation of the event runoff. The IMERG product is relatively news and is currently undergoing continuous enhancement. The references cited in the introduction section of this paper provide early assessments and discussions of the validity of the product. These products are expected to improve as the IMERG algorithms get refined through more ground validations. Nonetheless, they provide valuable information that can help improve flood prediction in ungauged basins. The authors are not aware of published hydrologic applications of the IMERG products. There was no streamflow data to validate the hydrographs predicted by the hydrologic. However, the model has been validated over similar environments in many previous studies as described in the introduction section. Notwithstanding, the GSSHA model simulations forced by the final IMERG product enabled quantifying the relative contribution of the sub-catchments and the major tributaries in the urbanized area to flooding of the city. For this event, the distributed model simulations demonstrated that most of the flooding (approximately 85%) was generated in the urbanized portion of the catchments (6.8% of the total area of the simulated catchment). The contribution of the upper portion of the catchment (68% of the area) was insignificant due to it sandy soils and the limited amounts of rainfall it received. The middle sub-catchment contributed about 13% of the discharge at the outlet.
One of the tributaries, the Northwest Fleaj, that meets the main channel inside the city, does not play an important role in flooding of the city center due to the size of its drainage area and its physiographic feature. For the same reasons, the North Fleaj, which meets the main channel just north of the city, does not contribute significant discharge. However, the South Fleaj that meets the main channel just north of the city center contributes significantly to the total discharge in the main channel and therefore has to be considered in any future flood control projects and urban development in the eastern part of the city. As this tributary originates well outside the city, different types of flood control measures can be applied to reduce the discharge it contributes. Distributed model simulations demonstrate that flooding in the city is driven primarily by topography rather that overbank flow in the main channel. A well designed urban drainage network might be needed to prevent flooding of residential areas and streets. This information is important if the city officials want to implement flood mitigation measures. For example, the presence of North Fleaj will limit expansion of the urban area to the north because of increasing flood hazards unless its flow is diverted before entering the urban area. Large detention basins outside the city on the main channel and Northwest Fleaj and South Fleaj can help mitigate flooding caused by extreme event. Also, diversion of the Northwest Fleaj and South Fleaj flow outside the city can be helpful.
Additional simulations were performed to understand the roles of the unique channel network in flooding in the city of Hafr Al Batin. The barren desert upper portions of the catchment contribute to flooding in the city only when it receives significant amounts of rainfall. It contributes about 3% of the total discharge when the 100-year storm covers the entire catchment, which should have a probability of much less than 1%. No significant discharge results from the 5-year storm. The middle sub-catchment contributes 7% of the total runoff for the 5-year storm and 23% for the 100-year storm. The results demonstrate that the upper portions of the catchment do not pose a significant flood threat unless they receive exceptional amounts of rainfall. In that case, the early or even the late satellite rainfall products can be invaluable since the flood peak will arrive many hours after the precipitation peak for such a large catchment. The best approach to control flooding in the city of Hafr Al Batin is to improve storm drainage to control runoff generated within and around the urbanized area as described above and use quantitative precipitation estimates, such as IMERG, and/forecast to prepare in the case of exceptional rainfall events in the upper portions of Wadi Al Batin catchment.
The use of variable grid size resulted in significant saving of computing time. It is necessary to use a 30 × 30 m2 grid size in the urbanized portion of the catchment (about 300 km2) to make full use of the topographic resolution and include the major land surface in the simulations. However, there is no need to use such a resolution of the dominantly barren desert portion of the catchment. Employing this gridding scheme, the simulation run takes about 5% of what it would have taken had the 30 × 30 m2 grid been used for the entire catchment (more than 4000 km2). We did not perform a synchronized run of the three simulations in parallel. The computing time for such a run is effectively not more than the time to run the model on the urbanized catchment alone. In addition to significant saving of computing time, the same approach used in this study will allow merging observed discharge from upstream portions of a catchment with the simulated runoff downstream.
Using this approach, physically-based, fully-distributed models like the GSSHA can be run on large basins that include urban centers that need to be modeled at very high resolutions. Previous studies demonstrated the validity of model predictions in urban settings, including semi-arid catchments. We believe that using high-resolution calibrated satellite products and land features would result in reasonable estimates of the flood inundation. However, several issues need to be taken into account. For example, the division of sub-catchments needs special treatment to make sure that no significant over land flow is lost. Also, the inflow into a sub-catchment must have the same time step of the model simulations (typically minutes or seconds). Disaggregation of observed discharge data represents a challenge as it may introduce significant errors. In addition, inclusion of sub-surface flow from one sub-catchment to the next, if needed, would add more complexity to the hydrological connectivity.
The main limitations of the study are that the IMERG product is relatively new and has not been validated extensively and there was no streamflow data to validate the hydrographs. Yet, the authors are confident that the main conclusions regarding the spatial distribution of the flood inundation and the relative contributions of different parts of the catchment to the flood generation will hold unless the hydrological model and IMERG are of very poor quality, which they do not believe to be the case.


