Article

Nitrates in Groundwater Discharges from the Azores Archipelago: Occurrence and Fluxes to Coastal Waters

1
IVAR—Department of Geosciences, University of the Azores, 9500-321 Ponta Delgada, Portugal
2
Directorate-Regional for the Environment, 9500-160 Ponta Delgada, Portugal
*
Author to whom correspondence should be addressed.
Water 2017, 9(2), 125; https://doi.org/10.3390/w9020125
Submission received: 7 November 2016 / Revised: 26 January 2017 / Accepted: 13 February 2017 / Published: 15 February 2017

Abstract

:
Groundwater discharge is an important vector of chemical fluxes to the ocean environment, and as the concentration of nutrients is often higher in discharging groundwater, the deterioration of water quality in the receiving environment can be the result. The main objective of the present paper is to estimate the total NO3 flux to coastal water bodies due to groundwater discharge in the volcanic Azores archipelago (Portugal). Therefore, 78 springs discharging from perched-water bodies have been monitored since 2003, corresponding to cold (mean = 14.9 °C) and low mineralized (47.2–583 µS/cm) groundwater from the sodium-bicarbonate to sodium-chloride water types. A set of 36 wells was also monitored, presenting groundwater with a higher mineralization. The nitrate content in springs range between 0.02 and 37.4 mg/L, and the most enriched samples are associated to the impact of agricultural activities. The total groundwater NO3 flux to the ocean is estimated in the range of 5.23 × 10³ to 190.6 × 10³ mol/km2/a (∑ = ~523 × 103 mol/km2/a), exceeding the total flux associated to surface runoff (∑ = ~281 × 103 mol/km2/a). In the majority of the islands, the estimated fluxes are higher than runoff fluxes, with the exception of Pico (47.2%), Corvo (46%) and Faial (7.2%). The total N-NO3 flux estimated in the Azores (~118.9 × 10³ mol/km2/a) is in the lower range of estimates made in other volcanic islands.

1. Introduction

Submarine groundwater discharge is a major vector of chemical fluxes to the ocean environment [1,2], and in the upper entire Atlantic Ocean it can be estimated as approximately 80% to 160% of the river discharge [3]. The concentration of nutrients from discharging groundwater is often higher than in coastal receiving waters [4], as shown for nitrates which present levels that are two to three orders of magnitude higher than typical coastal waters [5]. Therefore, transport of nutrients toward coastal waters through groundwater discharge can be a driver to the deterioration of water quality in these receiving environments, leading to ecosystem changes [6,7,8,9]. Besides agriculture-derived nutrient loads, sewage fluxes resulting from the increasing average population density in the near coastal-area, which nowadays is three times higher than the global average [10], also results in higher nutrient discharges to the coastal environment, leading toward the widespread eutrophication of coastal waters [11,12,13,14,15], as well as pointing out the need to reduce pollutant fluxes [16,17].
Several cases studies have been approached using geochemical tools to quantify nutrient fluxes from groundwater discharge both in continental areas [4,9,18,19] or in islands [20,21,22,23,24]. These contributions showed that the nutrient load due to groundwater coastal discharge can be higher than the one associated to surface runoff [19,25,26]. Therefore, nutrient-derived groundwater contribution can be higher than expected when considering only the overall water budget in a specific area in particular [27,28], resulting from the fact that groundwater bodies are often enriched in nutrients relative to surface waters [29], often due to agriculture impact. In the European Union (EU), a study has shown that the nitrogen leaching to groundwater derived from agricultural activities results in a general surplus in EU-27 member-states [30]. Groundwater pollution due to agriculture-derived pollutant loads has been studied around the world [31,32,33,34], and high nitrogen loads may result both from the application of fertilizers and from the leaching of grazed pasturelands [35,36].
The archipelago of the Azores (2322 km2) is an autonomous region of Portugal, with nine volcanic islands spread along a WNW-ESE-trending strip in the North Atlantic Ocean (Figure 1). The Azores are located between latitudes 37° to 40° N and longitudes 25° to 31° W, and have a total of 246,353 inhabitants (2014). In the year 2013, agriculture explained about 9.4% of the gross value added to the Azores regional product, with livestock being the main agricultural activity, with 267,000 bovines identified (year 2014). A recent study using LANDSAT 7 imagery has shown that about 56% of the land use corresponds to agriculture, which far exceeds the land use by forests and natural vegetation, that corresponds respectively to about 22% and 13% of the land surface [37]. Pasture lands are also by far the main agricultural land use.
Studies conducted in the Azores archipelago have shown that surface water and groundwater pollution due to agriculture may be a major concern to water authorities. In fact, through both the application of synthetic and organic fertilizers and the leaching of pasture lands, nutrient enrichment in waters occurred, sometimes associated to microbiology pollution, which led to the failure to comply with EU and national water quality regulations [38,39,40,41,42,43]. Due to the hydrogeological setting and nitrogen pollution loads, groundwater pollution risk was also considered a major concern in some areas along the archipelago [44]. Nevertheless, from the 59 bathing waters that have been analyzed in Azores through 2015, 13.6% are good bathing water quality and 86.4% are excellent according to EU criteria [11,12]. Accordingly, the 2015–2021 Azores River Basin Management Plan showed that from the 30 coastal water bodies delimited, 89% have an excellent status and 11% have a good status according the EU Water-Framework Directive requirements [45]. The physical setting of the Azores favors the dispersion of pollutants due to the absence of a continental shelf, which explained why the coastal zone was considered as less sensitive according the EU urban wastewater directive.
The objectives of this paper are (1) to characterize the content of nitrates in a set of spring discharges spread all over the nine islands of the Azores archipelago; (2) to estimate the total NO3 flux to coastal water bodies due to groundwater discharge; and (3) to compare groundwater derived fluxes to NO3 and total N fluxes in surface runoff. The NO3 fluxes to coastal water bodies are the first estimates in the Azores archipelago, and to the best of our knowledge the first in the biogeographic area of Macaronesia.

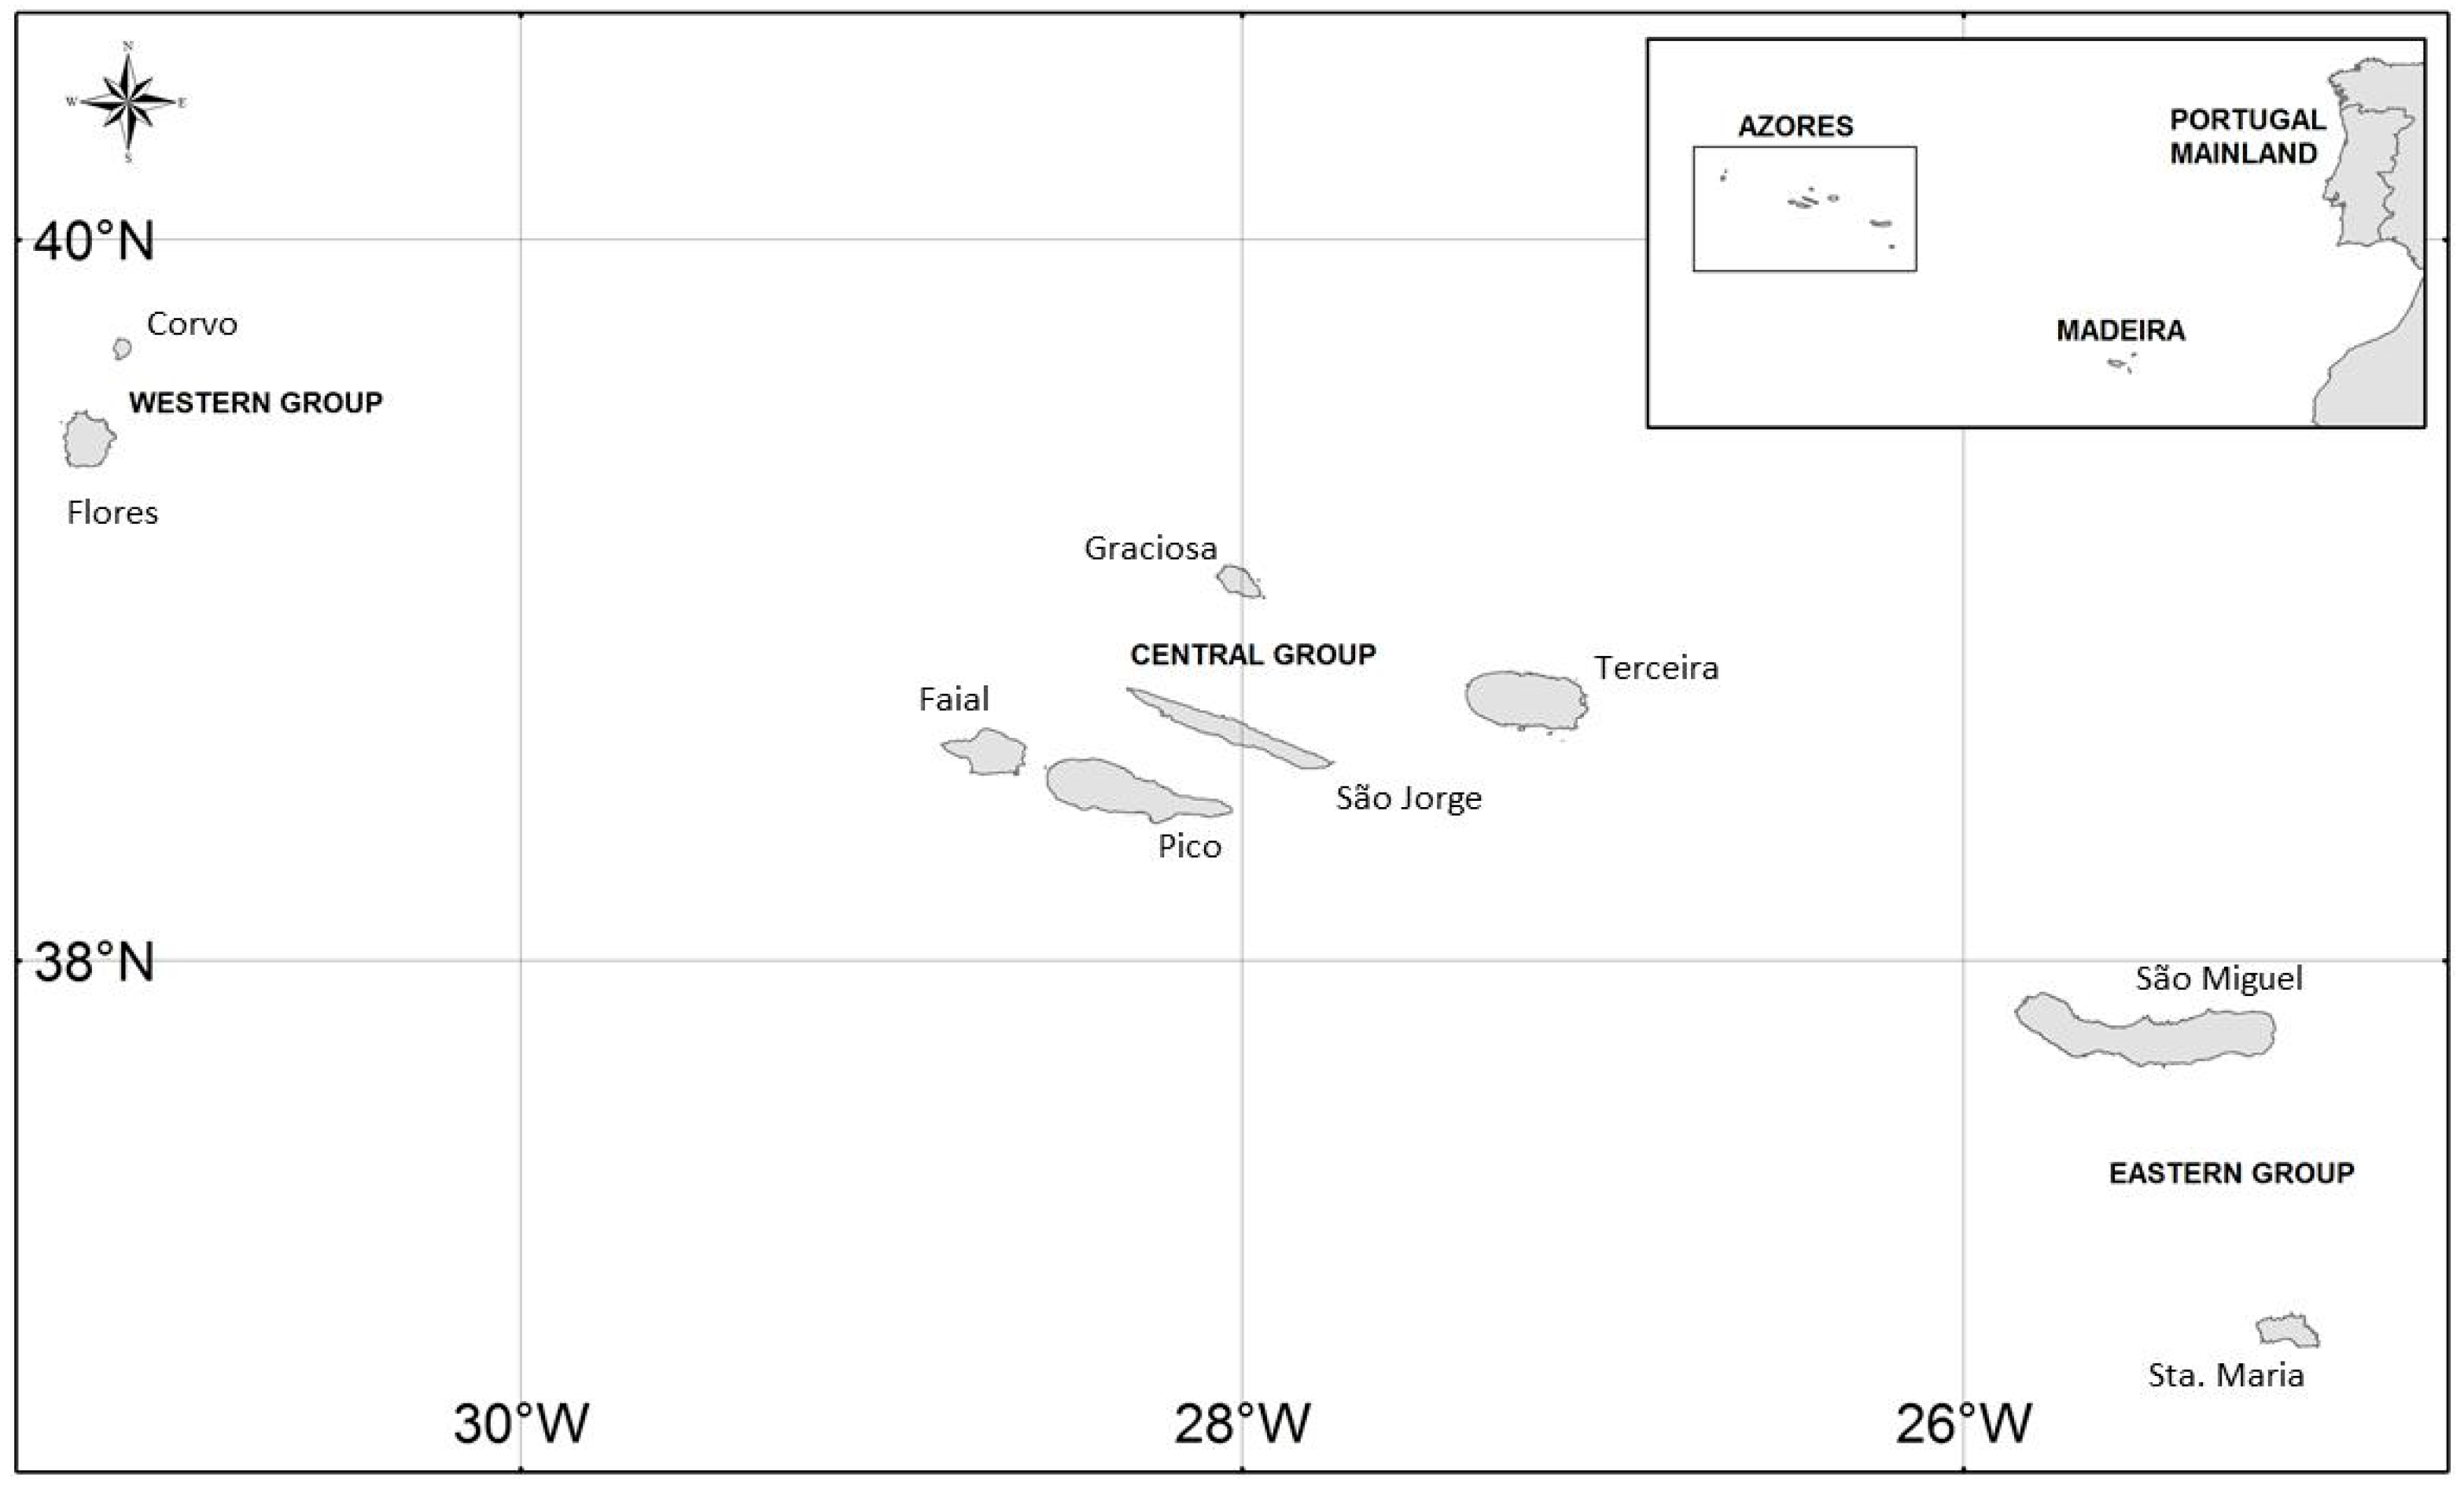
2. Hydrogeological Setting

2.1. Geology Outline

The Azores archipelago is located near the triple junction between the American, African, and Eurasian plates [46,47]. The islands are all of volcanic origin, and at least 28 eruptions have taken place since the settlement of the archipelago in the late 15th century [48], the last episode corresponding to a submarine eruption in 1998–2000 [49].
The volcanic history of the Azores depicts numerous events with different eruptive styles and magnitudes, from predominantly effusive to highly explosive eruptions. As a result, a large array of volcanic forms and deposits are found in the Azores, such as basaltic to trachyte lava flows, fall and flow pyroclastic deposits and trachytic domes [46].
Santa Maria is the oldest island of the archipelago, being aged from about 8.12 Ma [49], and besides being made from lava flows and pyroclastic deposits of basaltic nature, it is the only one that has sedimentary formations found interbedded in the volcanic sequence. Islands such as Pico (~240,000 a) and São Jorge (~550,000 a) are also mainly made by basaltic rocks from Hawaiian and Strombolian eruptions. The remaining islands show more evolved volcanic rocks, ranging from basalts to trachytes lava flows, fall and flow pyroclastic deposits, such as pumice fall deposits, ignimbrites and other types of flow deposits, and trachytic domes. This latter group of islands is made up of São Miguel (~4.01 Ma), Flores (~2.16 Ma), Faial (~730,000 a), Corvo (>~710,000 a), Graciosa (~620,000 a) and Terceira (>300,000 a) [46].

2.2. Hydrogeology Outline

The total groundwater appropriation in the Azores is about 47 × 106 m3/a, comparing to a total surface water abstraction of about 793 × 103 m3/a [45]. Therefore, groundwater is a strategic natural resource, which accounts for about 98% of the water supply in the Azores archipelago [43], and several islands are totally dependent on aquifers for water supply.
Two major aquifer systems can be found in the Azores archipelago, namely the basal aquifer system and perched-water bodies [50,51]. The former corresponds to coastal aquifers presenting a very low hydraulic gradient, and the latter corresponds to confined or leaky aquifers at altitude, explaining the numerous springs in the volcano slopes [50,51]. Specific well capacity is in the range of 1.40 × 10⁻² to 266.67 L/s.m (median = 32.29 L/s.m). The higher values are observed in drilled wells located in islands such as Pico and Graciosa, which abstract groundwater from thin fresh and fractured young basaltic lava flows, frequently interbedded with clincker levels [51].
The average precipitation at the Azores is 1930 mm/a, with values showing a high variability along the archipelago, ranging between 966 (Graciosa island) and 2647 mm/a (Flores). Nevertheless, the average precipitation exceeds by far the average actual evapotranspiration (581 mm/a), the latter with a much lower variability in the archipelago (502 mm/a in São Jorge to 632 mm/a in Graciosa island) [52].
Recharge rates range from 8.5% to 62.1% of the average precipitation, the higher values being observed in areas characterized by a sparse soil cover over young basaltic lava flows that are frequently fractured [45,51]. Groundwater resources are about 1580 × 106 m3/a, ranging from 8.3 × 10⁶ (Corvo island) to 582 × 106 m3/a (Pico island; [51]), and values above the median (101.3 × 10⁶ m3/a) are computed for islands such as São Miguel, São Jorge, Terceira and Flores.

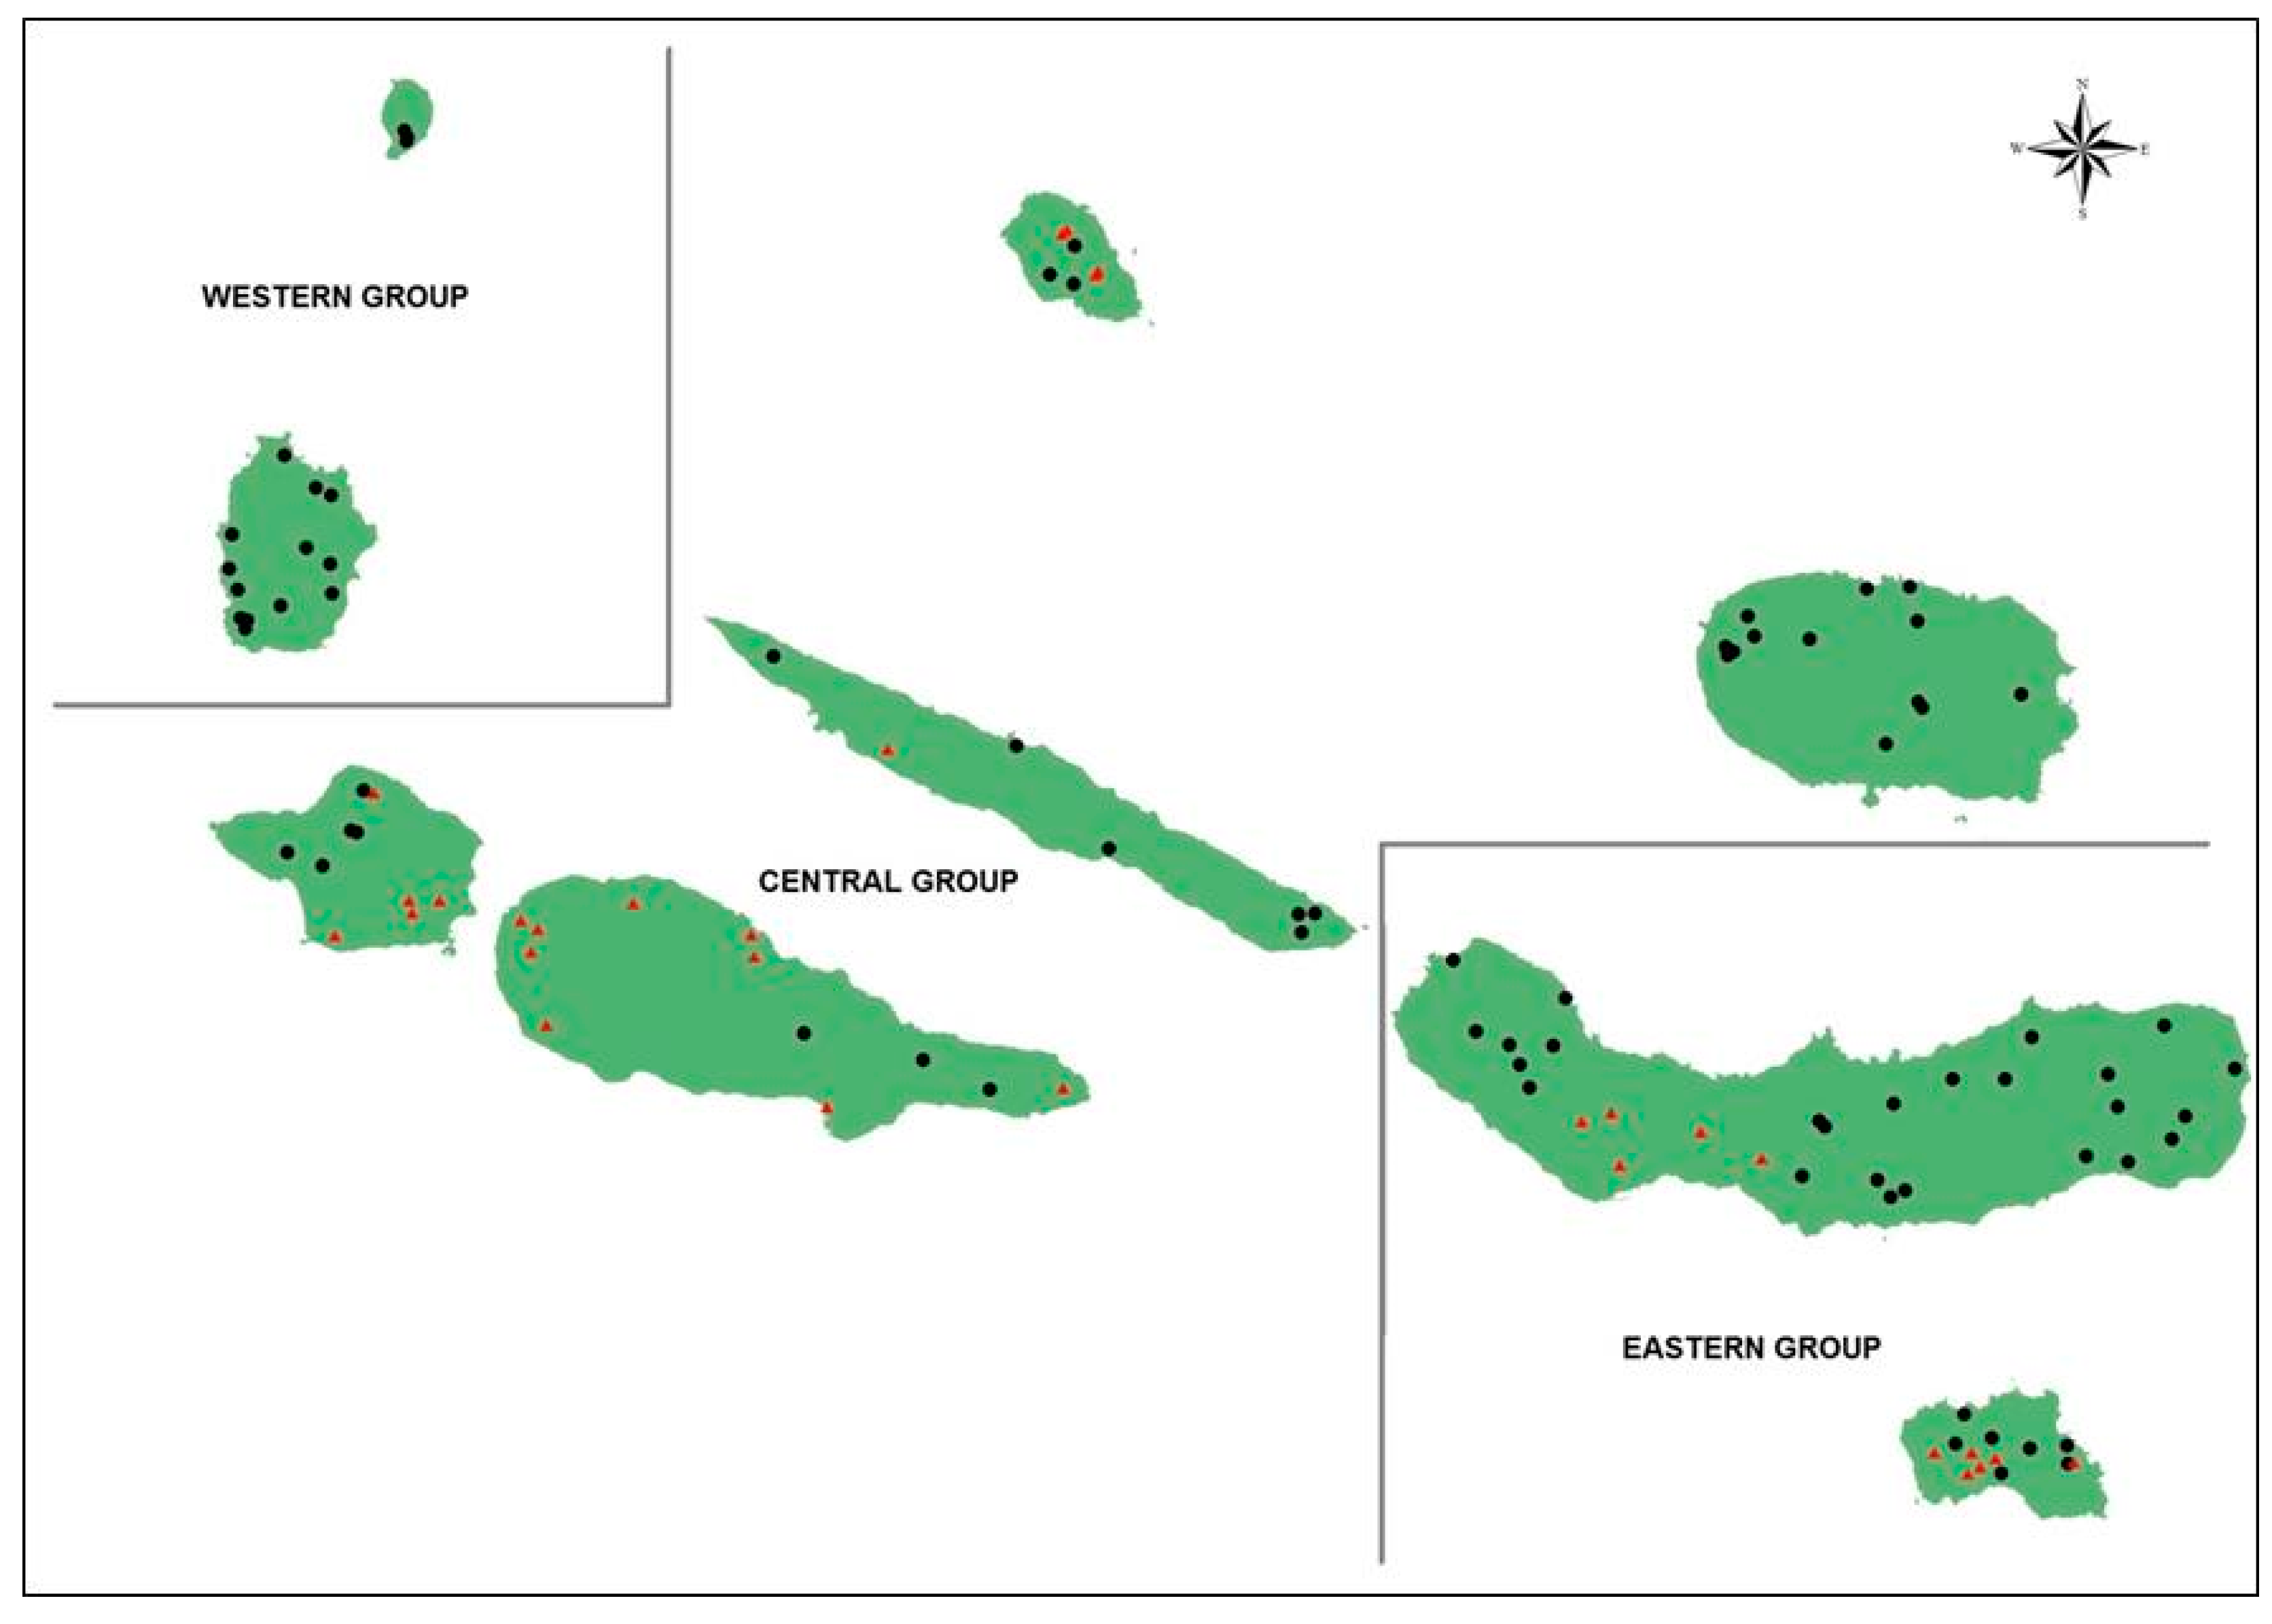
3. Material and Methods

A set of 78 springs and 36 wells spread along the nine islands of the Azores archipelago were sampled since 2003 in order to comply with the monitoring requirements derived from the EU Water-Framework Directive (Figure 2). The springs discharge from perched-water bodies while wells are all drilled in the coastal basal water bodies. Surface water and groundwater bodies monitoring is coordinated by the Directorate-Regional for the Environment (Azores Regional Government). The development of the monitoring network was made according to a phased approach, and the criteria for the selection of springs and wells, as well as an insight into the constraints and major achievements, are described in [41,45]. The development of the monitoring programme, as well as a full description of the field and analytical procedures, is presented in [41].
The studied springs are mainly located between 201 and 400 m above sea level (asl) (51.2%), but are spread along a wider altitudinal range (Figure 3A): 6.4% of the springs discharge below 100 m asl, while 7.7% are located at an altitude higher than 700 m asl. As a result of spring capture infrastructures, discharge was measured in only 89.7% of the 78 springs. For these springs, the average discharge value is usually not higher than 1.6 × 10⁻² m3/s (1000 m3/day; 95.7% of the springs), and only 2.9% and 1.4% corresponds, respectively, to values in the range between 3.47 × 10⁻² and 5.79 × 10⁻² m3/s (3000–5000 m3/day) and higher than 6.94 × 10⁻² m3/s (7000 m3/day; Figure 3B). However, a total of 54 springs have discharges lower than 1.34 × 10⁻³ m3/s (120 m3/day), from which 50% present a discharge lower than 2.31 × 10⁻⁴ m3/s (20 m3/day; Figure 3C), and 16.7% in the range 7.06 × 10⁻⁴–9.26 × 10⁻⁴ m3/s (61–80 m3/day).
The drilled wells are mainly located near the coast, at an altitude between 33 and 263.5 m (mean = 138.7 m) and presenting depths between 41 and 284 m (mean = 143.2 m). The volume of water abstraction ranges between 48 and 1807 m3/day (mean = 604 m3/day).

4. Results and Discussion

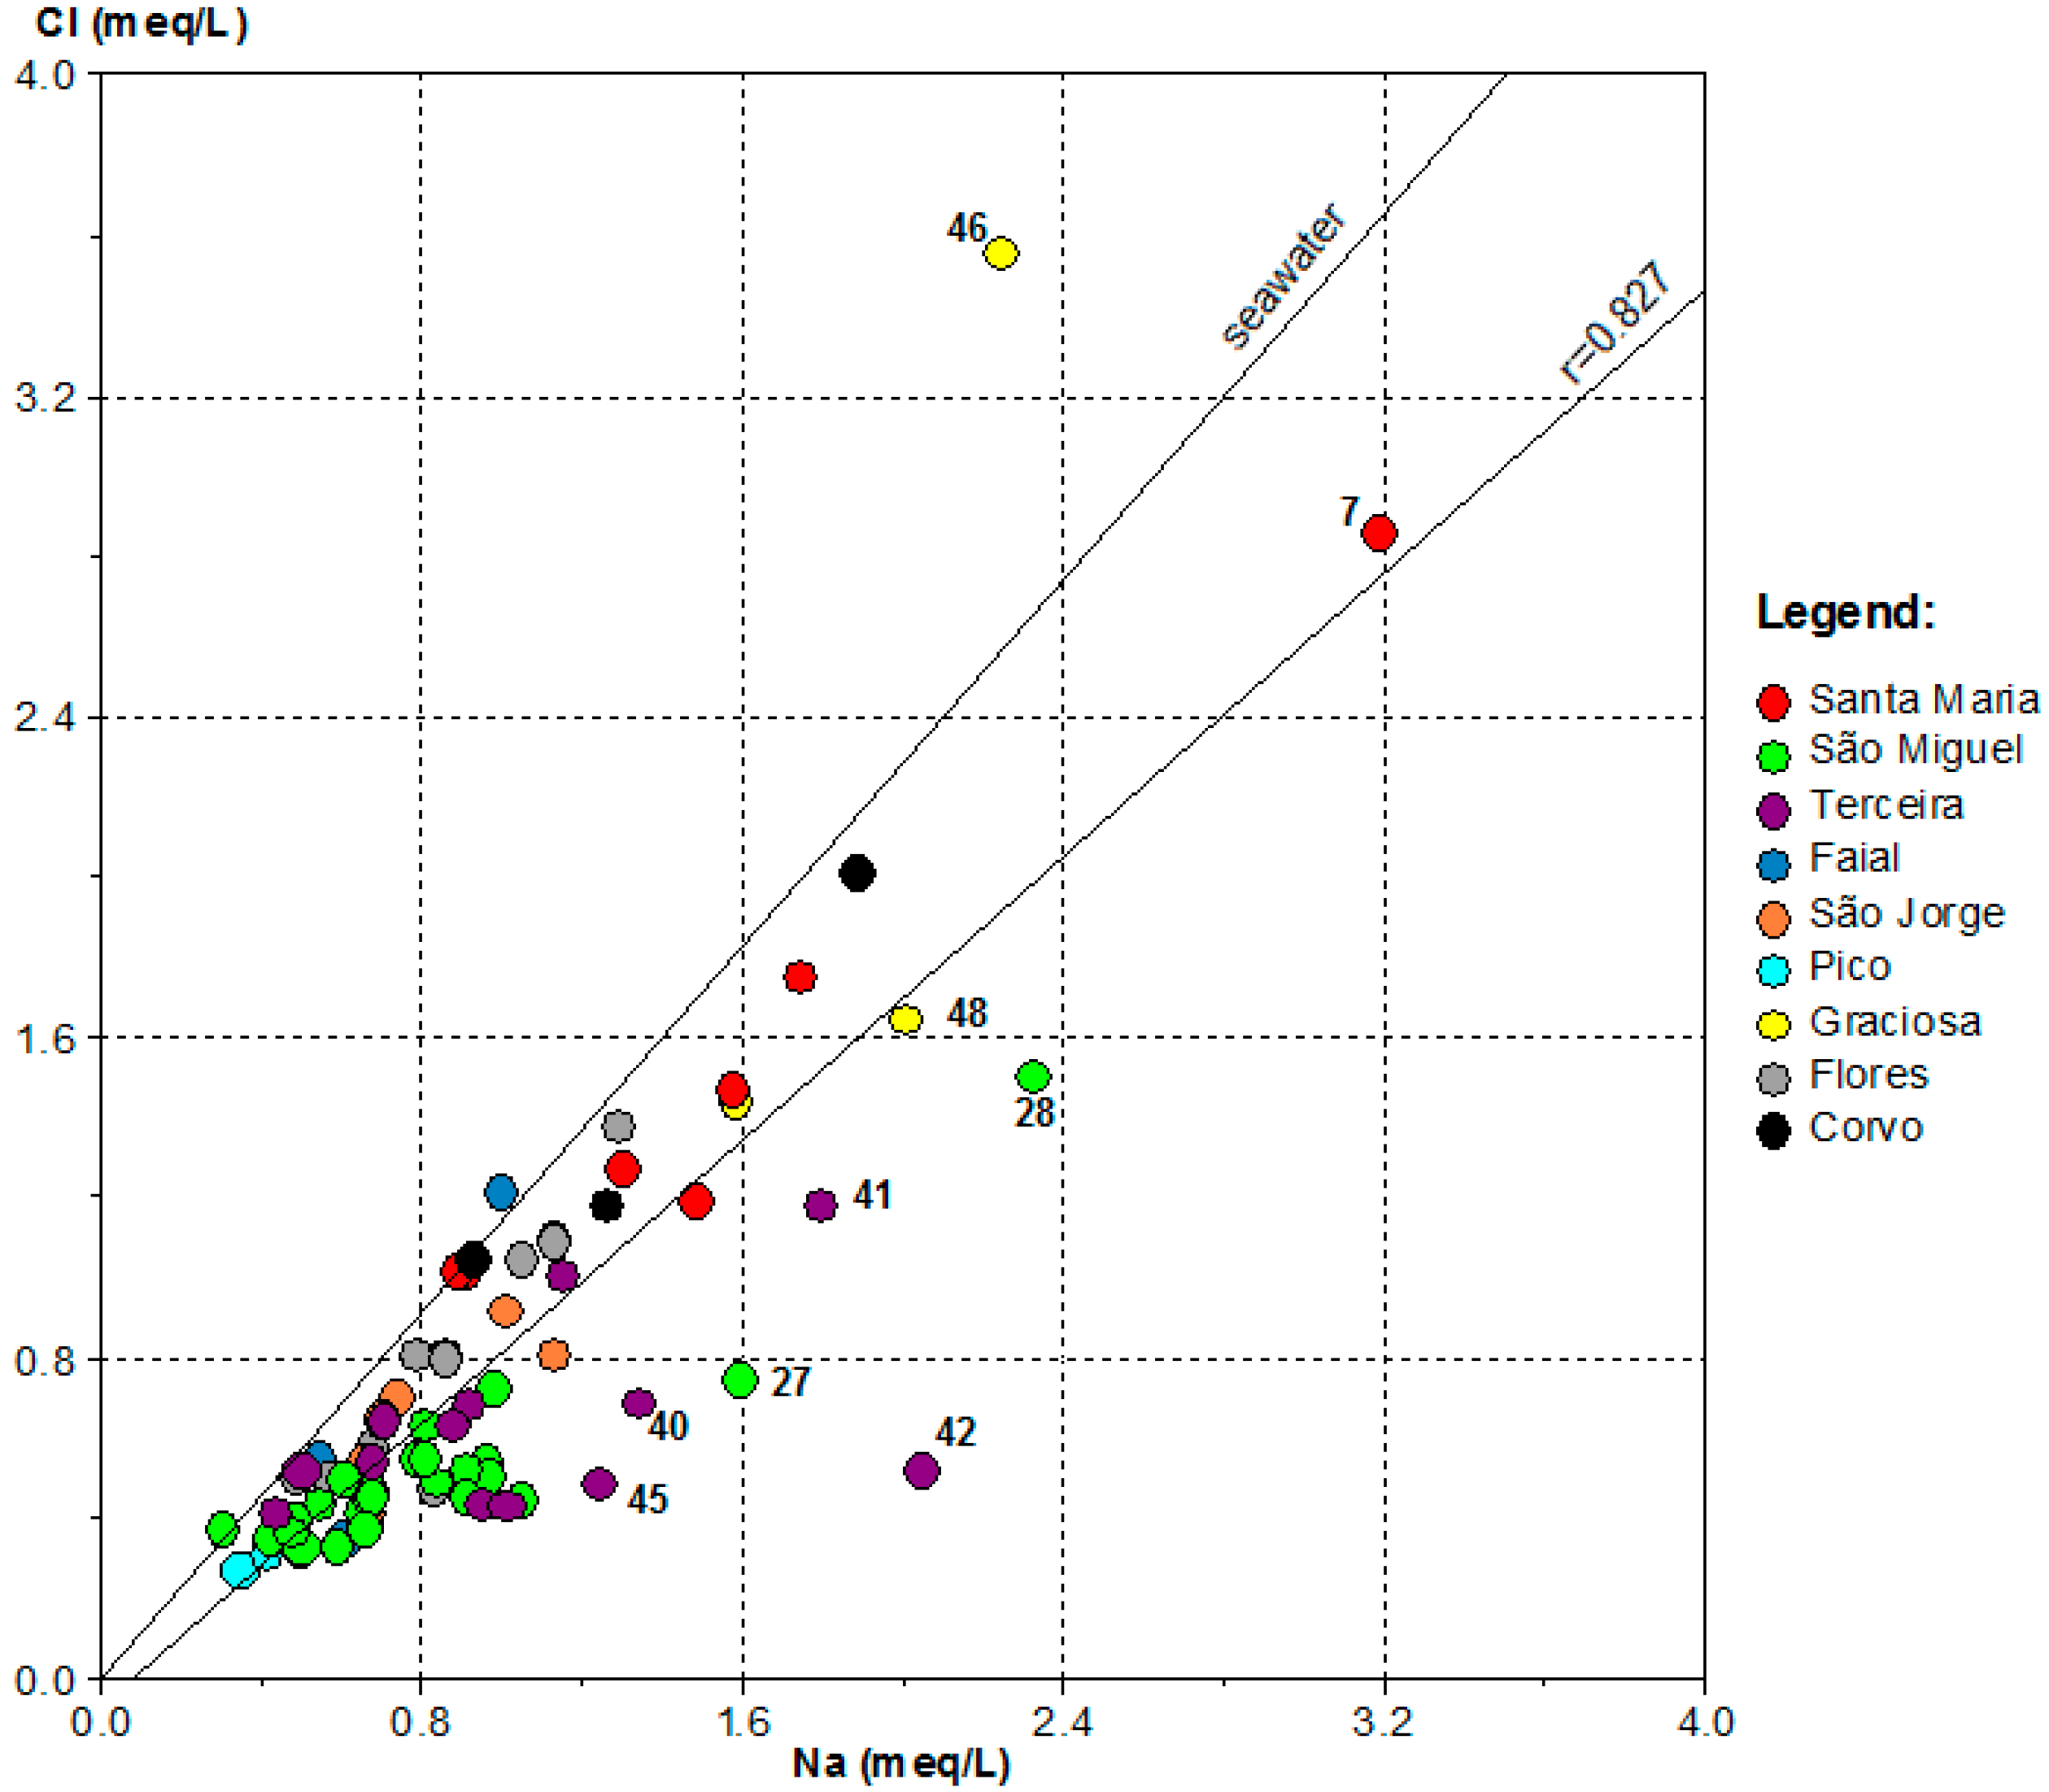
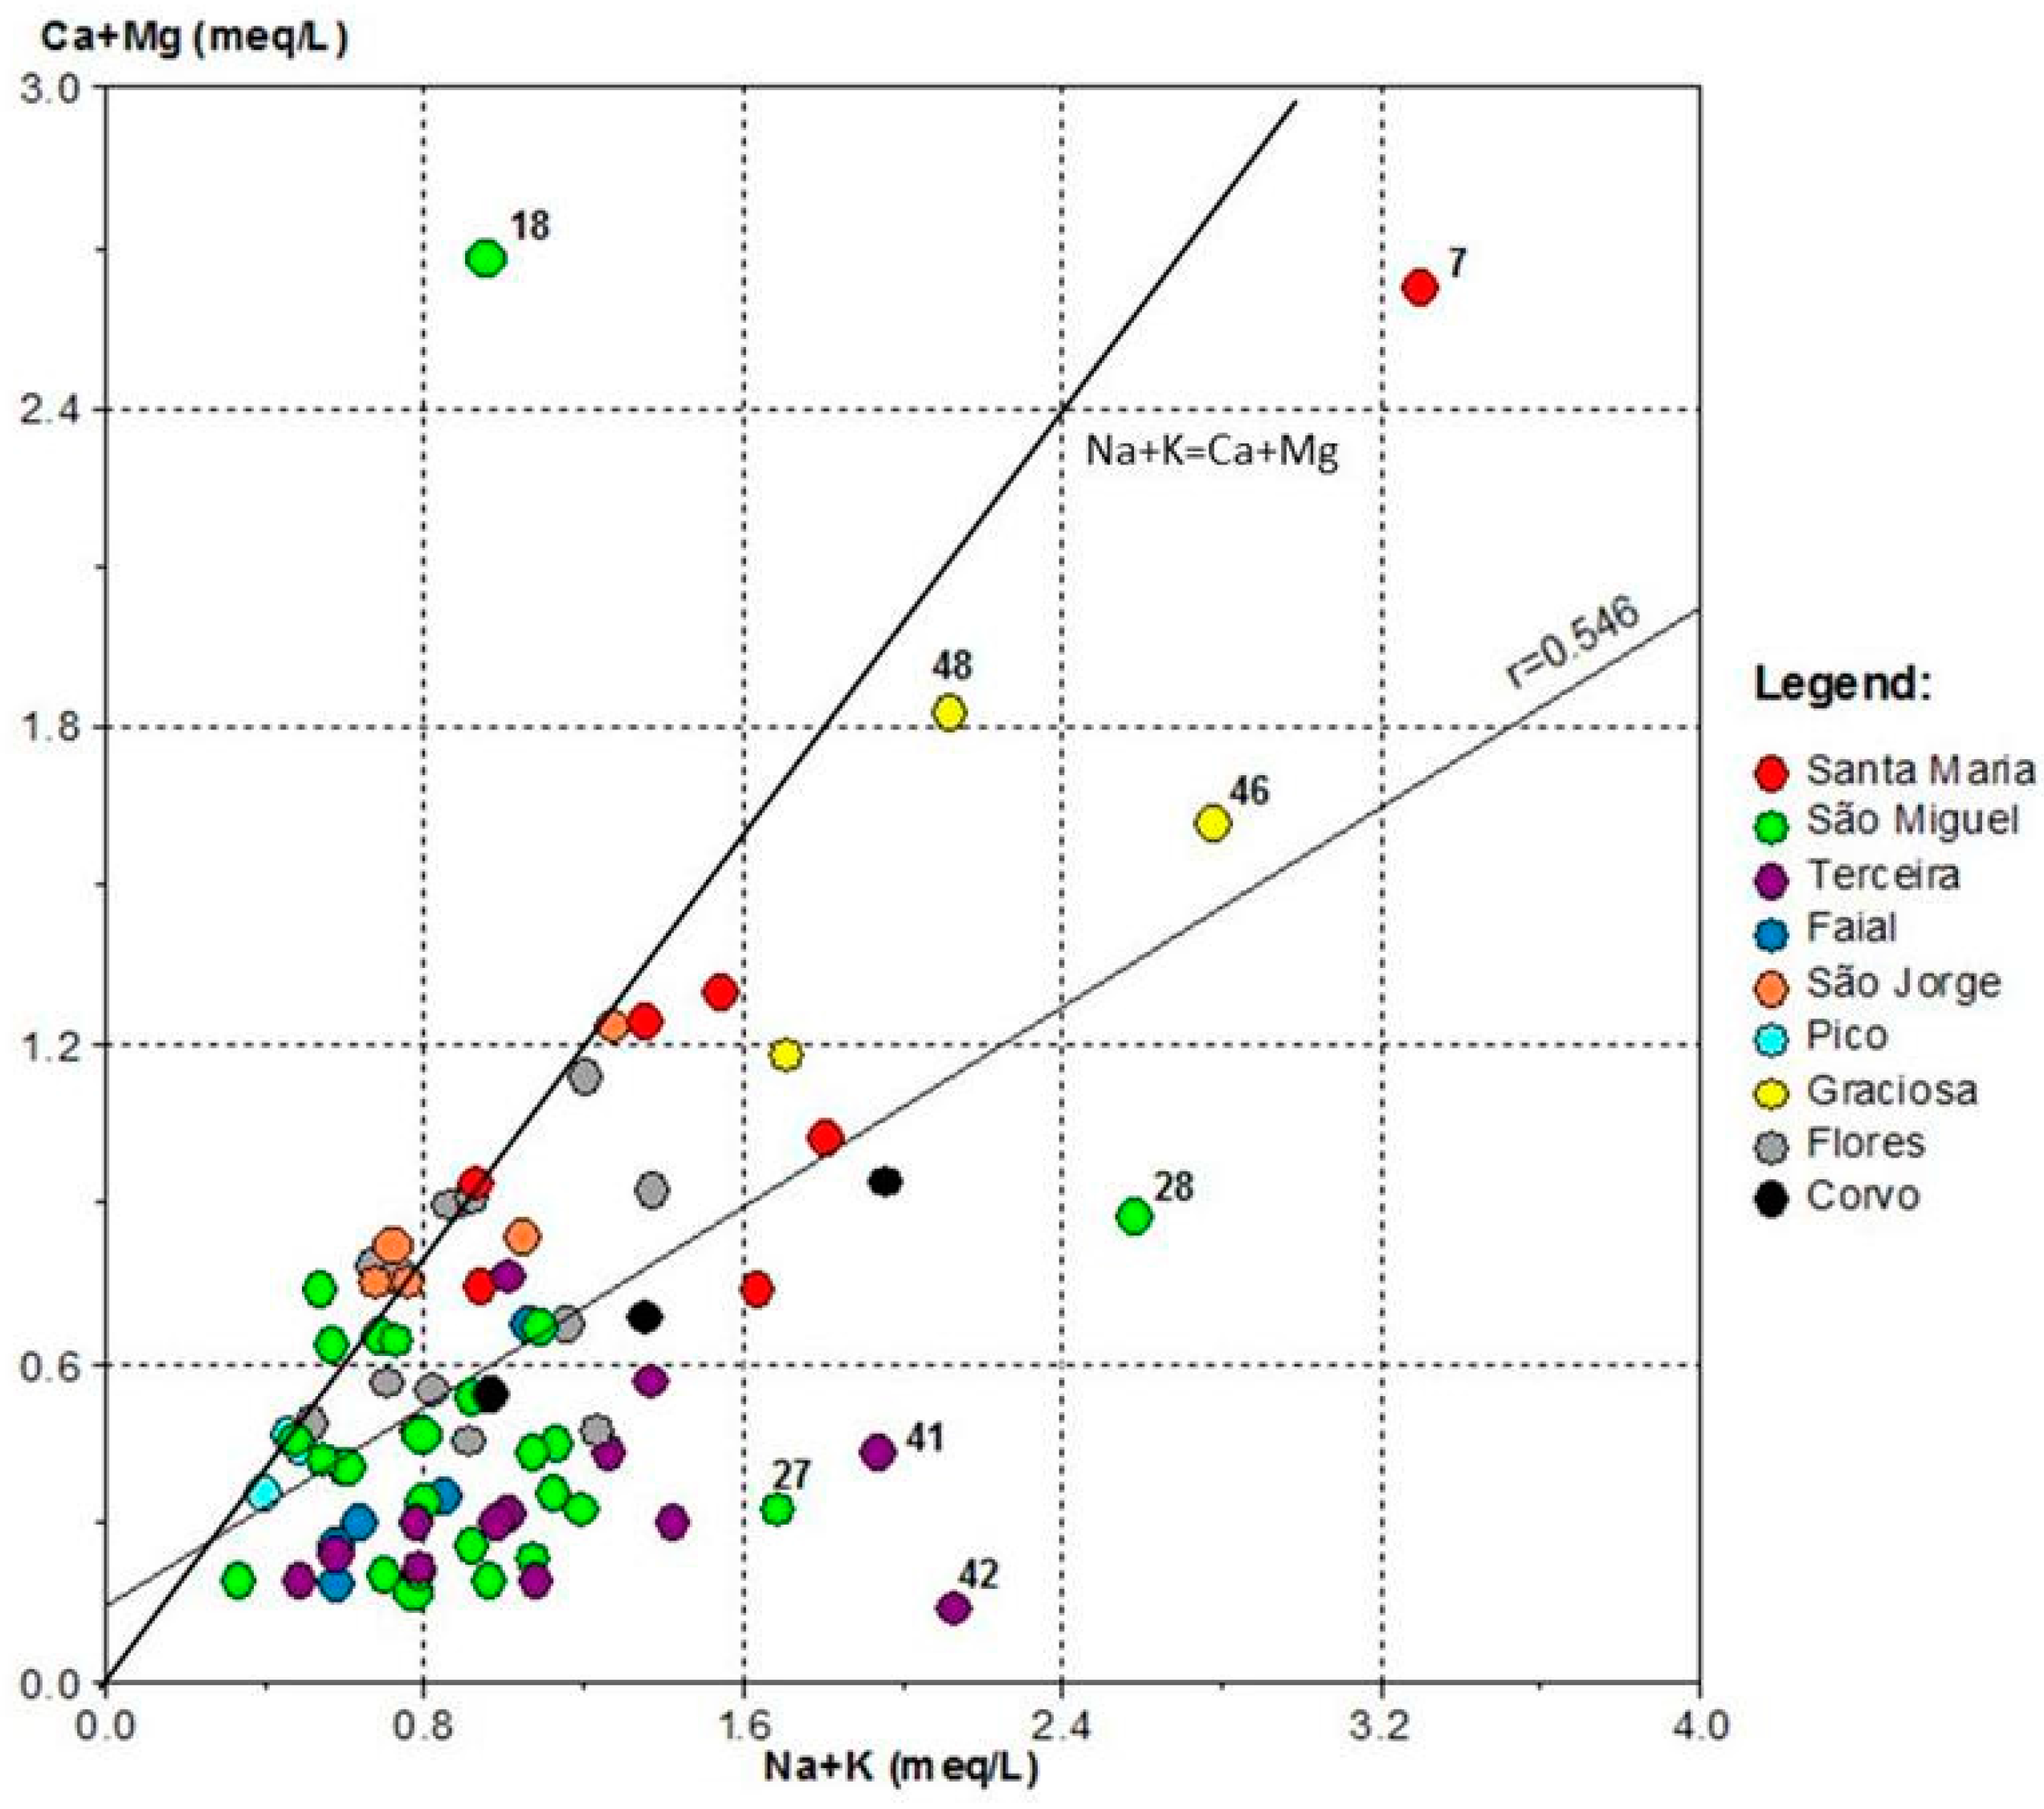
4.1. Data Presentation

Groundwater composition is reported in Table S1 (mean value for temperature, pH, electrical conductivity, dissolved CO2, major-ion and NO3 content).
Spring waters have temperatures in the range between 12.2 and 18 °C (mean = 14.9 °C). Water temperature depicts an inverse relationship regarding spring elevation (r = −0.751), suggesting the influence of the colder air temperature observed at higher altitude in the islands (Figure 4A). A similar pattern is observed in other volcanoes worldwide [53] as well as in detailed studies carried out in specific central volcanoes in the Azores [54]. The mean pH values range between 6.1 and 8 (mean = 7.1), showing that waters range from slightly acid to slightly basic.
Electrical conductivity (EC) ranges between 47 and 583 µS/cm, and waters can be considered as poorly mineralized, with 47% of the samples being in the range between 101 and 200 µS/cm and about 91% of the samples presenting EC values as high as 300 µS/cm (Figure 3D). This low overall mineralization is common in springs located in perched-water aquifers in the archipelago [54,55]; an inverse relationship is presented by water conductivity and spring elevation (r = −0.566) which points out that discharges located at higher altitudes correspond to groundwater with a low residence time (Figure 4B).
Groundwater sampled in wells depicts a higher mineralization comparing to spring discharges, as shown by the EC values (128–2775 µS/cm; mean = 856 µS/cm). Wells with EC measurements higher than the median value (644 µS/cm) are mainly from Graciosa and Pico islands, where several groundwater bodies were classified as having poor status according to the EU Water Framework Directive criteria.
Groundwater is mainly from the sodium-bicarbonate to sodium-chloride water types (Figure 5). Drilled wells are mainly from the sodium-chloride water type, while spring water types present a wider range. The highest correlation coefficients between EC and major-ion in water are depicted by Cl (r = 0.977; Figure 6E), Mg (r = 0.950; Figure 6C), SO4 (r = 0.921; Figure 6F) and Na (r = 0.918; Figure 6A). Instead, a low correlation coefficient is computed for HCO3 (r = 0.502; Figure 6G). Presented data points to the main drivers of the groundwater chemistry in the Azores already identified in previous studies [43,54,56], namely: (1) a marine source, through seawater spraying in springs and seawater intrusion in a few wells; and (2) silicate dissolution.
The former explains the higher EC observed in drilled well waters, and is depicted in the several plots (Figure 6). The influence of the seawater composition is also shown by the high correlation coefficient between Na and Cl (r = 0.827; Figure 7), however samples reveal a Na-enrichment besides a marine source-derived signature as depicted by the deviation from the seawater line in the plot. This enrichment can be due to silicate dissolution, as well as to cation exchange with Ca. The latter process also explains that the majority of the samples define an alkali metals enrichment trend regarding the alkali-earth metals content, as shown by the deviation from the Na + K = Ca + Mg line (r = 0.546; Figure 8). Nevertheless, through Figure 8, it is possible to show that springs from islands such as Santa Maria, Graciosa, Pico and São Jorge—where it is expected that the volcanic sequence is dominated by basaltic rocks—show higher alkali-earth metals content comparing to samples from São Miguel, Terceira and Faial, where springs discharge mainly from more evolved volcanic rocks.

4.2. Nitrates Occurrence and Fluxes

The content of nitrates in springs ranges between 0.02 and 37.4 mg/L (mean = 7.1 mg/L) and also contributes to the overall groundwater chemistry (r = 0.497; Figure 6H). From this plot, it is possible to show a group of samples that present a NO3-enrichment (springs 3, 15, 26, 28, 41, 43, 48, 53). The higher mean values are observed in Graciosa (16.77 mg NO3/L), São Jorge (13.15 mg NO3/L), Santa Maria (11.84 mg NO3/L) and Terceira islands (10.72 mg NO3/L), while the lower mean values are computed for Faial (0.57 mg NO3/L) and Pico (1.30 mg NO3/L). Through the computation of a nitrate enrichment factor (EF), as suggested by [57] and [58], and taking in account a natural background level equal to 8.46 mg NO3/L [59], the set of springs with a higher content of nitrates present an enrichment factor in the range of 2.15 to 4.42.
The majority of springs comply with the maximum recommended content (25 mg NO3/L) according to the Portuguese water quality regulatory framework, all being under the 50 mg NO3/L admissible value (Figure 9). Previous studies have shown that the NO3 enrichment is closely associated with agriculture-derived pollution [43]. Agriculture non-point pollution sources also explain that, in some springs, total and faecal coliform microbial content exceeds EU and Portuguese water quality regulations [41].
Nitrate content in wells ranges between 1.4 and 66.2 mg/L (mean = 11.99 mg NO3/L), and in not computing wells it ranges between 38 and 41—values which exceed the admissible values—the mean is equal to 9.67 mg NO3/L. Nevertheless, the majority of the waters present low nitrate content as shown by the median value (6.7 mg NO3/L). The EF ranges from 0.2 to 7.8 (mean = 1.4), but excluding wells 38 and 41 the maximum value is equal to 3.1, being in the same order of magnitude as the spring data. Therefore, the nitrate content measured in springs can be considered as representative of the groundwater chemistry for the purpose of computation of the NO3 fluxes in the several islands.
The flux of NO3 in groundwater was estimated using an approach similar to that proposed by [60], and already applied in the Azores archipelago in order to estimate other solutes fluxes [56,61]. This approach requires data on the average precipitation and recharge rate for each island, compiled from [52], the latter value being computed as the weighted average of the recharge rate of aquifer systems in each island and their surface area. The total recharge value is estimated based on the area of each island times the net recharge, the latter resulting from the average precipitation times the recharge rate. The nitrate content times the spring discharge, determined with the current set of data, is computed for each spring, allowing the determination of a mean NO3 discharge as well as the standard deviation for each island, and after the computation of the overall NO3 flux.
Results are shown in Table 1, pointing to an overall NO3 flux of about ~523 × 103 mol/km2/a (143 × 106 mol NO3/a), and values for each island range between ~5.20 × 10³ ± 5.7 × 10³ mol/km2/a (0.9 × 10⁶ mol NO3/a; Faial) and 190.6 × 10³ ± 162.9 × 10³ mol/km2/a (46.4 × 10⁶ mol NO3/a; São Jorge). Nitrogen fluxes resulting from NO2 and NH4 are negligible as these species are usually under detection limits. Non-conservative concentration changes were not taken into consideration, which may imply overestimation of the chemical flux [62], nevertheless, in the Azores, coastal aquifers are often made of highly permeable recent basaltic lava flows, as shown by the low thickness of the fresh water lens in the coastal area [63], reducing the effects of those changes.
Results in São Jorge are consistent with the impact of agriculture over groundwater quality in this island, where the chemical status of groundwater bodies is poor due to dissolved NO3, and the non-point pollution risk areas are much larger comparing to the other islands [44].
Previous research on river water chemistry in the archipelago has shown that the higher NO3 contents are associated to areas where pasture lands are dominant [54], and despite the contribution of urban wastewater point sources, agriculture non-point sources are also critical for surface water pollution [42].
In order to compare the groundwater results, the NO3 surface water flux to the coastal water bodies was also estimated from the total runoff computed for the several islands [45] times the mean river water composition data described in [42]. In islands such as Santa Maria, São Miguel, Faial and Flores, the mean nitrate content for each watershed delimited as surface water bodies according the EU Water Framework Directive corresponds to the monitoring data in the river mouth, while the content for the entire island corresponds to the mean value that is determined with measurements made in the several watersheds. For the remaining islands where no river water bodies were delimited, the nitrate content corresponds to the mean value for river water in the Azores. As NO2 and NH4 are also monitored in the river water, it is possible to estimate these fluxes, thus allowing the computation of the overall total N flux (NO3 + NO2 + NH4).
Total NO3 flux for the coastal waters due to surface runoff is equal to 281 × 103 mol/km2/a, with values in the range between 7.6 × 10³ mol/km2/a (Graciosa Island) and 67.5 × 10³ mol/km2/a (Faial island), with a mean value of 31.2 × 10³ mol/km2/a (median = 30.6 × 10³ mol/km2/a) (Table 2). From the nitrogen species data in Table 2, it is possible to conclude that total NO3-N fluxes are much higher than fluxes of other nitrogen species, as expected from the higher nitrate content. In fact, NO3-N fluxes account for between 79.2% (Santa Maria) and 95.8% (Faial) of the total N fluxes.
The NO3 groundwater flux in the Azores archipelago is about 65% of the total flux estimated (groundwater plus surface water). In the majority of the islands, groundwater derived fluxes are higher than surface runoff fluxes, corresponding to 53.2% of the total in Flores Island, 55% in Santa Maria, 67.9% in São Miguel, 75.7% in Terceira, 85.6% in São Jorge and 89.7% in Graciosa. Instead, in islands such as Corvo and Pico, groundwater fluxes correspond respectively to about 46% and 47.2% of the total. In Faial, groundwater flux is only 7.2% of the total due to the lower nitrate content in the springs on this island, as discharges are mainly located in the highland area where natural vegetation and forest are dominant. Nevertheless, in Faial, the mean NO3 value in wells located in the lowland areas is equal to 3.53 mg/L, thus similar to the spring content.
The total NO3 groundwater flux estimated in the Azores (~118.9 × 10³ mol/km2/a; Table 1) is similar to the dissolved inorganic nitrogen (DIN) flux estimated for the Hawaii archipelago (~130.7 × 10³ mol/km2/a) [21], but about 10 times lower than the estimate for Jeju island (~1.15 × 10⁶ mol/km2/a) [21]. The variability considering all the islands from the Azores archipelago—as N-NO3 fluxes are in the range of 1.2 × 10³ to 43.1 × 10³ mol/km2/a—shows the need to consider spatial variation as pointed out in [23]. Factors should be considered in further studies in the Azores, such as the seasonal variability of fluxes, and research on chemical gradients in the coastal area should also be carried out.

5. Conclusions

The NO3 groundwater flux in the Azores is about ~523 × 103 mol/km2/a, higher than the estimated flux from river waters (~340 × 103 mol NO3/km2/a) and corresponding to 65% of the total value computed for the archipelago. Results from the present paper, as well as studies made worldwide [21], point to a high nitrogen flux to the ocean environment from volcanic islands.
From data gathered in the present study, it is possible to conclude that despite coastal water bodies being considered to have good to excellent status according to the EU Water Framework Directive requirements, an effort should be made in order to develop environmental-based agricultural policies that may lead to the reduction of nutrient loading in the Azores, thus preventing the pollution of inland water bodies and further fluxes to the nearshore environment.

Supplementary Materials

The following are available online at www.mdpi.com/2073-4441/9/2/125/s1, Table S1: Groundwater chemical data (mean values for the monitored springs (spr) and drilled wells (wll)), discharge (Q) and nitrates enrichment factor (EF) (SMA—Santa Maria island; SMG—São Miguel; TER—Terceira; GRA—Graciosa; SJZ—São Jorge; PIC—Pico; FAI—Faial; FLO—Flores; COR—Corvo; n.d. —not determined).

Acknowledgments

Authors are grateful to the Azores Directorate-Regional for Environment for the permission to handle the data for this paper. César Andrade is supported by a Ph.D. grant from Fundação para a Ciência e Tecnologia (grant SFRH/BD/101962/2014).

Author Contributions

All authors contributed to the design and development of this manuscript. J. Virgílio Cruz conceived the research, carried out the data analysis, and wrote the first draft of the manuscript. César Andrade provided helped to carrying on the data analysis. Dina Pacheco, Sandra Mendes and Raquel Cymbron provided the groundwater chemical data and defined the monitoring scheme.

Conflicts of Interest

The authors declare no conflict of interest.

References

  1. Moore, W.S. Large groundwater inputs to coastal waters revealed by 226Ra enrichments. Nature 1996, 380, 612–614. [Google Scholar] [CrossRef]
  2. Burnett, W.C.; Bokuniewicz, H.; Huettel, M.; Moore, W.S.; Taniguchi, M. Groundwater and pore water inputs to the coastal zone. Biogeochemistry 2003, 66, 3–33. [Google Scholar] [CrossRef]
  3. Moore, W.S.; Sarmiento, J.L.; Key, R.M. Submarine groundwater discharge revealed by 228Ra distribution in the upper Atlantic Ocean. Nat. Geosci. 2008, 1, 309–311. [Google Scholar] [CrossRef]
  4. Kroeger, K.D.; Swarzenski, P.W.; Greenwood, W.J.; Reich, C. Submarine groundwater discharge to Tampa Bay: Nutrient fluxes and biogeochemistry of the coastal aquifer. Mar. Chem. 2007, 104, 85–97. [Google Scholar] [CrossRef]
  5. Johannes, R.E. The ecological significance of the submarine discharge of groundwater. Mar. Ecol. Prog. Ser. 1980, 3, 365–373. [Google Scholar] [CrossRef]
  6. Lee, Y.W.; Kim, G. Linking groundwater-borne nutrients and dinoflagellate red-tide outbreaks in the southern sea of Korea using a Ra tracer. Estuar. Coast. Shelf Sci. 2007, 71, 309–317. [Google Scholar] [CrossRef]
  7. Lee, Y.W.; Kim, G.; Lim, W.A.; Hwang, D.W. A relationship between submarine groundwater-borne nutrients traced by Ra isotopes and the intensity of dinoflagellate redtides occurring in the southern sea of Korea. Limnol. Oceanogr. 2010, 21, 1–10. [Google Scholar] [CrossRef]
  8. Garcés, E.; Basterretxea, G.; Tovar-Sánchez, A. Changes in microbial communities in response to submarine groundwater input. Mar. Ecol. Prog. Ser. 2011, 438, 47–58. [Google Scholar] [CrossRef]
  9. Null, K.A.; Dimova, N.T.; Knee, K.L.; Esser, B.K.; Swarzenski, P.W.; Singleton, M.J.; Stacey, M.; Paytan, A. Submarine groundwater discharge-derived nutrient loads to San Francisco Bay: Implications to future ecosystem changes. Estuar. Coast. 2012, 35, 1299–1315. [Google Scholar] [CrossRef]
  10. Small, C.; Nicholls, R. A global analysis of human settlement in coastal zones. J. Coast. Res. 2003, 19, 584–599. [Google Scholar]
  11. European Environment Agency (EEA). European Bathing Water Quality in 2015; European Environmental Report 9; EEA: Copenhagen, Denmark, 2016. [Google Scholar]
  12. European Environment Agency (EEA). Portuguese Bathing Water Quality in 2015; European Environmental Report, Portugal Country Report; EEA: Copenhagen, Denmark, 2016. [Google Scholar]
  13. Committee on Environment and Natural Resources (CENR). An Assessment of Coastal Hypoxia and Eutrophication in U.S. Waters; National Science and Technology Council Committee on Environment and Natural Resources: Washington, DC, USA, 2003. [Google Scholar]
  14. World Resources Institute (WRI). Eutrophication and Hypoxia in Coastal Areas: A Global Assessment of the State of Knowledge; WRI Policy Note 1; WRI: Washington, DC, USA, 2008. [Google Scholar]
  15. Rabalais, N.N.; Turner, R.E.; Díaz, R.J.; Justic, D. Global change and eutrophication of coastal waters. ICES J. Mar. Sci. 2009, 66, 1528–1537. [Google Scholar] [CrossRef]
  16. Prepas, E.E.; Charette, T. Worldwide Eutrophication of Water Bodies: Causes, Concerns, Controls. In Environmental Geochemistry, Treatise of Geochemistry; Lollar, B.S., Ed.; Elsevier: Amsterdam, The Netherlands, 2005; pp. 311–331. [Google Scholar]
  17. Paerl, H.W. Controlling eutrophication along the freshwater-marine continuum: Dual nutrient (N and P) reductions are essential. Estuar. Coast. 2009, 32, 593–601. [Google Scholar] [CrossRef]
  18. Burnett, W.C.; Wattayakorn, G.; Taniguchi, M.; Dulaiova, H.; Sojisuporn, P.; Rungsupa, S.; Ishitobi, T. Groundwater-derived nutrient inputs to the Upper Gulf of Thailand. Cont. Shelf Res. 2007, 27, 176–190. [Google Scholar] [CrossRef]
  19. Swarzenski, P.W.; Reich, C.; Kroeger, K.; Baskaran, M. Ra and Rn istotopes as natural tracers of submarine groundwater discharge in Tampa Bay, Florida. Mar. Chem. 2007, 104, 69–84. [Google Scholar] [CrossRef]
  20. Street, J.H.; Knee, K.L.; Grossman, E.E.; Paytan, A. Submarine groundwater discharge and nutrient addition to the coastal zone and coral reefs of leeward Hawaii. Mar. Chem. 2008, 109, 355–376. [Google Scholar] [CrossRef]
  21. Kim, G.; Kim, J.S.; Hwang, D.W. Submarine groundwater discharge from oceanic islands standing in oligotrophic oceans: Implications for global biological production and organic carbon fluxes. Limnol. Oceanogr. 2011, 56, 673–682. [Google Scholar] [CrossRef]
  22. Bishop, J.M.; Glenn, C.R.; Amato, D.W.; Dulai, H. Effect of land use and groundwater discharge nutrient flux. J. Hydrol. Reg. Stud. 2015, in press. [Google Scholar]
  23. Knee, K.L.; Crook, E.D.; Hench, J.L.; Leichter, J.J.; Paytan, A. Assessment of Submarine Groundwater Discharge (SGD) as a Source of Dissolved Radium and Nutrients to Moorea (French Polynesia) Coastal Waters. Estuar. Coast. 2016, 39, 1651–1668. [Google Scholar] [CrossRef]
  24. Prouty, N.G.; Swarzenski, P.W.; Fackrell, J.K.; Johannesson, K.; Palmore, C.D. Groundwater-derived nutrient and trace element transport to a nearshore Kona coral ecosystems: Experimental mixing model results. J. Hydrol. Reg. Stud. 2016, in press. [Google Scholar] [CrossRef]
  25. Hwang, D.; Kim, G.; Lee, Y.; Yang, H. Estimating submarine inputs of groundwater and nutrients to a coastal bay using radium isotopes. Mar. Chem. 2005, 96, 61–71. [Google Scholar] [CrossRef]
  26. Knee, K.L.; Layton, B.A.; Street, J.H.; Boehm, A.B.; Paytan, A. Sources of nutrients and fecal indicator bacteria to nearshore waters on the North Shore of Kaua’i (Hawai’i, USA). Estuar. Coast. 2008, 31, 607–622. [Google Scholar] [CrossRef]
  27. Slomp, C.P.; Van Cappellen, P. Nutrient inputs to the coastal ocean through submarine groundwater discharge: Controls and potential impact. J. Hydrol. 2004, 295, 64–86. [Google Scholar] [CrossRef]
  28. Breier, J.A.; Nidzieko, N.; Monismith, S.; Moore, W.; Paytan, A. Tidally regulated chemical fluxes across the sediment-water interface in Elkhorn Slough, California: Evidence from a coupled geochemical and hydrodynamic approach. Limnol. Oceanogr. 2009, 54, 1964–1980. [Google Scholar] [CrossRef]
  29. Null, K.A.; Corbett, D.R.; DeMaster, D.J.; Burkholder, J.M.; Thomas, C.J.; Reed, R.E. Porewater advection of ammonium into the Neuse River Estuary, North Carolina, USA. Estuar. Coast. Shelf Sci. 2011, 95, 314–325. [Google Scholar] [CrossRef]
  30. Velthof, G.; Oudendag, D.; Witzke, H.; Asman, W.; Klimont, Z.; Oenema, O. Integrated assessment of Nitrogen Losses from Agriculture in EU-27 using MITERRA-EUROPE. J. Environ. Qual. 2009, 38, 402–417. [Google Scholar] [CrossRef] [PubMed]
  31. Stamatis, G.; Parpodis, K.; Filintas, A.; Zagana, E. Groundwater quality, nitrate pollution and irrigation environmental management in the Neogene sediments of an agricultural region in central Thessaly (Greece). Environ. Earth. Sci. 2001, 64, 1081–1105. [Google Scholar] [CrossRef]
  32. Menció, A.; Boy, M.; Mas-Pla, J. Analysis of vulnerability factors that control nitrate occurrence in natural springs (Osona Region, NE Spain). Sci. Total Environ. 2011, 409, 3049–3058. [Google Scholar] [CrossRef] [PubMed]
  33. Jayasingha, P.; Pitawala, A.; Dharmagunawardhane, H. Vulnerability of Coastal Aquifers Due to Nutrient Pollution from Agriculture: Kalpitiya, Sri Lanka. Water Air Soil Pollut. 2011, 219, 563–577. [Google Scholar] [CrossRef]
  34. Heaton, T.; Stuart, M.; Sapiano, M.; Sultana, M. An isotope study of the sources of nitrate in Malta’s groundwater. J. Hydrol. 2012, 414–415, 244–254. [Google Scholar] [CrossRef]
  35. Olson, B.; Bennett, R.; McKenzie, R.; Ormann, T.; Atkins, R. Nitrate leaching in two irrigated soils with different rates of cattle manure. J. Environ. Qual. 2009, 38, 2218–2228. [Google Scholar] [CrossRef] [PubMed]
  36. Infascelli, R.; Pelorosso, R.; Boccia, L. Spatial assessment of animal manure spreading and groundwater nitrate pollution. Geospatial Health 2009, 4, 27–38. [Google Scholar] [CrossRef] [PubMed]
  37. Direção Regional do Ordenamento do Território e dos Recursos Hídricos (DROTRH). Carta de Ocupação do Solo da Região Autónoma dos Açores; DROTRH: Ponta Delgada, Portugal, 2007. (In Portuguese) [Google Scholar]
  38. Santos, M.C.; Pacheco, D.; Santana, A.F.; Muelle, H. Cyanobacteria blooms in Sete Cidades lake (São Miguel Island–Azores). Algol. Stud. 2005, 117, 393–406. [Google Scholar] [CrossRef]
  39. Ribeiro, D.C.; Martins, G.; Nogueira, R.; Cruz, J.V.; Brito, A.G. Phosphorus fractionation in volcanic lake sediments (Azores–Portugal). Chemosphere 2008, 70, 1256–1263. [Google Scholar] [CrossRef] [PubMed] [Green Version]
  40. Martins, G.; Ribeiro, D.; Pacheco, D.; Cruz, J.V.; Cunha, R.; Gonçalves, V.; Nogueira, R.; Brito, A.G. Prospective scenarios for water quality and ecological status in Lake Sete Cidades (Portugal): The integration of mathematical modelling in decision processes. Appl. Geochem. 2008, 23, 2171–2181. [Google Scholar] [CrossRef] [Green Version]
  41. Cruz, J.V.; Pacheco, D.; Cymbron, R.; Mendes, S. Monitoring of the groundwater chemical status in the Azores archipelago (Portugal) in the context of the EU Water Framework Directive. Environ. Earth Sci. 2009, 61, 173–186. [Google Scholar] [CrossRef]
  42. Cruz, J.V.; Pacheco, D.; Coutinho, R.; Cymbron, R.; Mendes, S.; Antunes, P.; Fontiela, J.; Freire, P. Chemical monitoring of river water bodies in an EU outermost region: Examples from the Azores archipelago (Portugal). J. Environ. Monit. 2010, 12, 2216–2225. [Google Scholar] [CrossRef] [PubMed]
  43. Cruz, J.V.; Silva, M.O.; Dias, M.I.; Prudêncio, M.I. Groundwater composition and pollution due to agricultural practices at Sete Cidades volcano (Azores, Portugal). Appl. Geochem. 2013, 29, 162–173. [Google Scholar] [CrossRef]
  44. Cruz, J.V.; Fontiela, J.; Prada, S.; Andrade, C. The chemical status of groundwater and pollution risk in the Azores archipelago (Portugal). Environ. Earth Sci. 2015, 73, 2763–2777. [Google Scholar] [CrossRef]
  45. Administração Hidrográfica dos Açores-Direção Regional do Ambiente (AHA-DRA). Plano de Gestão da Região Hidrográfica dos Açores—RH9; Versão para Consulta Pública; Secretaria Regional do Ambiente e do Mar: Ponta Delgada, Portugal, 2015. (In Portuguese)
  46. Pacheco, J.M.; Ferreira, T.; Queiroz, G.; Wallenstein, N.; Coutinho, R.; Cruz, J.V.; Pimentel, A.; Silva, R.; Gaspar, J.L.; Goulart, C. Notas sobre a geologia do arquipélago dos Açores. In Geologia de Portugal; Dias, R., Araújo, A., Terrinha, P., Kullberg, J.C., Eds.; Escolar Editora: Lisboa, Portugal, 2013; pp. 595–690. (In Portuguese) [Google Scholar]
  47. Gaspar, J.L.; Queiroz, G.; Ferreira, T.; Medeiros, A.R.; Goulart, C.; Medeiros, J. Earthquakes and Volcanic Eruptions in the Azores Region: Geodynamic Implications from Major Historical Events and Instrumental Seismicity. In Volcanic Geology of São Miguel Island (Azores Archipelago), Geological Society Memoirs 44; Gaspar, J.L., Guest, J.E., Duncan, A.M., Barriga, F.J.A.S., Chester, D.K., Eds.; Geological Society of London: London, UK, 2015; pp. 33–49. (In Portuguese) [Google Scholar]
  48. Gaspar, J.L.; Queiroz, G.; Pacheco, J.M.; Ferreira, T.; Wallenstein, N.; Almeida, M.H.; Coutinho, R. Basaltic lava balloons produced during the 1998–2001 Serreta submarine ridge eruption (Azores). In Explosive Subaqueous Volcanism, Geophysical Monograph 140; White, J.D.L., Smellie, J.L., Clague, D.A., Eds.; American Geophysical Union: Washington, DC, USA, 2003; pp. 205–212. [Google Scholar]
  49. Abdel-Monen, A.; Fernandez, L.; Boone, G. K/Ar ages from the eastern Azores group (Santa Maria, São Miguel and the Formigas Islands). Lithos 1975, 4, 247–254. [Google Scholar] [CrossRef]
  50. Cruz, J.V. Groundwater and volcanoes: Examples from the Azores archipelago. Environ. Geol. 2003, 44, 343–355. [Google Scholar] [CrossRef]
  51. Cruz, J.V. Ensaio Sobre a Água Subterrânea nos Açores. História, Ocorrência e Qualidade; Secretaria Regional do Ambiente: Ponta Delgada, Portugal, 2004. (In Portuguese)
  52. Direção Regional do Ordenamento do Território e dos Recursos Hídricos—Instituto da Água (DROTRH/INAG). Plano Regional da Água. Relatório Técnico; DROTRH-INAG: Ponta Delgada, Portugal, 2001. (In Portuguese) [Google Scholar]
  53. Yamamoto, S. Volcano Body Springs in Japan; Kokon-Shoin: Tokyo, Japan, 1995. [Google Scholar]
  54. Cabral, L.; Andrade, C.; Coutinho, R.; Cruz, J.V. Groundwater composition in perched-waer bodies in the north flank of Fogo volcano (São Miguel, Azores): Main causes and comparison with river water chemistry. Environ. Earth Sci. 2015, 73, 2779–2792. [Google Scholar] [CrossRef]
  55. Cruz, J.V.; Amaral, C. Major Ion chemistry of groundwaters from perched-water bodies at Azores (Portugal) volcanic archipelago. Appl. Geochem. 2004, 19, 445–459. [Google Scholar] [CrossRef]
  56. Freire, P.; Andrade, C.; Coutinho, R.; Cruz, J.V. Spring geochemistry in an active volcanic environment (São Miguel, Azores): Source and fluxes of inorganic solutes. Sci. Total Environ. 2014, 466–467, 475–489. [Google Scholar] [CrossRef] [PubMed]
  57. Vystavna, Y.; Huneau, F.; Schäfer, J.; Motelica-Heino, M.; Blanc, G.; Larrose, A.; Vergeles, Y.; Diadin, D.; Le Coustumer, P. Distribution of trace elements in waters and sediments of the Seversky Donets transboundary watershed (Kharkiv region, Eastern Ukraine. Appl. Geochem. 2012, 27, 2077–2087. [Google Scholar] [CrossRef] [Green Version]
  58. Yakovlev, V.; Vystavna, Y.; Diadin, D.; Vergeles, Y. Nitrates in springs and rivers of East Ukraine: Distribution, contamination and fluxes. Appl. Geochem. 2013, 53, 71–78. [Google Scholar] [CrossRef]
  59. Cruz, J.V.; Andrade, C. Natural background groundwater composition in the Azores archipelago (Portugal): A hydrogeochemical study and threshold value determination. Sci. Total Environ. 2015, 520, 127–135. [Google Scholar] [CrossRef] [PubMed]
  60. Rad, S.D.; Allègre, C.J.; Louvat, P. Hidden erosion on volcanic islands. Earth Planet. Sci. Lett. 2007, 262, 109–124. [Google Scholar] [CrossRef]
  61. Freire, P.; Andrade, C.; Coutinho, R.; Cruz, J.V. Fluvial geochemistry in São Miguel Island (Azores, Portugal): Source and fluxes of inorganic solutes in an active volcanic environment. Sci. Total Environ. 2013, 454–455, 154–169. [Google Scholar] [CrossRef] [PubMed]
  62. Beck, A.J.; Tsukamoto, Y.; Tovar-Sanchez, A.; Huerta-Diaz, M.; Bokuniewicz, H.J.; Sañudo-Wilhelmy, S.A. Importance of geochemical transformations in determining submarine groundwater discharge-derived trace metal and nutrient fluxes. Appl. Geochem. 2007, 22, 477–490. [Google Scholar] [CrossRef]
  63. Cruz, J.V.; Coutinho, R.; Pacheco, D.; Cymbron, R.; Antunes, P.; Freire, P.; Mendes, S. Groundwater salinization in the Azores archipelago (Portugal). Environ. Earth Sci. 2011, 62, 1273–1285. [Google Scholar] [CrossRef]
Figure 1. Geographical location of the Azores archipelago in the North Atlantic Ocean. The three main groups of islands are also shown: Western (islands Corvo and Flores), Central (islands Terceira, Pico, Faial, São Jorge and Graciosa) and Eastern (islands São Miguel and Santa Maria) groups.
Water 09 00125 g001
Figure 2. Location of the several springs and wells that have been monitored in the Azores archipelago (springs—black dots; drilled wells—red triangles) (map not to scale).
Water 09 00125 g002
Figure 3. Attributes of the sampled springs according to: (A) altitude range; (B) discharge—all springs; (C) discharge—springs with values lower than 120 m3/day; (D) water electrical conductivity.
Water 09 00125 g003
Figure 4. Bivariate plots between (A) spring elevation and water temperature (best fit line: y = − 0.0058 + 17.039); and (B) spring elevation and water electrical conductivity (best fit line: y = − 0.2849 + 277.3).
Water 09 00125 g004
Figure 5. Durov-type diagram depicting major-ion relative composition in studied springs (spr) and wells.
Water 09 00125 g005
Figure 6. Bivariate plots between electrical conductivity (in µS/cm) and major-ion in groundwater (values in meq/L; best fit lines are shown). Spring and well references according to Table S1.
Water 09 00125 g006
Figure 7. Bivariate plot between Na and Cl content in spring waters (values in meq/L).
Water 09 00125 g007
Figure 8. Bivariate plot between alkali and alkali-earth metals content in spring waters (values in meq/L).
Water 09 00125 g008
Figure 9. Cumulative frequency plot depicting the distribution of NO3 content in spring discharges. Vertical line corresponds to the 25 mg NO3/L maximum recommended value in the Portuguese water quality standards for groundwater (Decree-Law n° 236/98; 50 mg NO3/L is the maximum admissible value).
Water 09 00125 g009
Table 1. NO3 flux calculated for each island in the Azores archipelago (annual precipitation (P) and weighted average recharge rate (R) from [52]; Rt is the total recharge estimated for each island).
IslandArea (km2)P (mm)R (%)Rt (m3/a)Mean NO3 (mol/m3)NO3 Flux (103 mol/km2/a)N-NO3 Flux (103 mol/km2/a)
Santa Maria96.9120021.62.5 × 1071.9 × 10−1 ± 8.9 × 10−249.5 ± 22.911.2 ± 5.2
São Miguel744.5172229.73.8 × 1089.9 × 10−2 ± 1.1 × 10−150.8 ± 56.711.5 ± 12.8
Terceira400.3158530.71.9 × 1081.7 × 10−1 ± 1.2 × 10−184.1 ± 59.619.0 ± 13.5
Graciosa60.796625.31.5 × 1072.7 × 10−1 ± 1.7 × 10−166.1 ± 40.614.9 ± 9.2
São Jorge243.3241637.22.2 × 1082.1 × 10−1 ± 1.8 × 10−1190.6 ± 162.943.1 ± 36.8
Pico444.8251751.75.8 × 1082.1 × 10−2 ± 1.6 × 10−227.3 ± 20.36.2 ± 4.6
Faial173.1163327.87.9 × 1071.1 × 10−2 ± 1.3 × 10−25.2 ± 5.71.2 ± 1.3
Flores141.0264726.19.7 × 1073.0 × 10−2 ± 1.4 × 10−221.0 ± 9.84.8 ± 2.2
Corvo17.1190125.58.3 × 1065,8 × 10−2 ± 2.0 × 10−228.3 ± 9.86.4 ± 2.2
Total2321.7----522.9118.3
Table 2. NO3 and total N fluxes in rivers (discharge values and chemical data from [45]).
IslandRiverDischarge
(106 m3/a)
NO3
(mg/L)
NO2
(µg/L)
NH4
(µg/L)
Total NO3 Flux
(103 mol/km2/a)
Total N Flux
(103 mol/km2/a)
Santa MariaSão Francisco2.347.7196.7140.727.27.7
Island31.67.7196.7140.740.511.6
São MiguelGrande10.662.613.0102.524.18.1
Caldeirões6.078.515.720.070.516.4
Quente4.653.331.999.19.52.9
Faial Terra5.455.47.522.030.77.3
Guilherme8.480.62.520.06.01.9
Povoação5.045.811.521.316.23.8
Pelâmes0.658.122.320.023.75.5
Praia3.132.23.315.019.54.8
Salga5.036.37.87.857.013.1
Seca5.712.487.0111.814.35.2
Island245.944.520.243.924.06.1
FaialFlamengos5.8513.194.734.078.018.4
Island55.1313.194.734.067.515.9
FloresBadanela10.343.77.825.046.111.3
Grande11.650.83.620.09.62,8
Fazenda2.933.242.025.012.63.2
Seca12.01.32.620.025.36.8
Island71.52.314.022.518.54.7
TerceiraIsland142.944.728.944.027.06.8
São JorgeIsland103.414.728.944.032.18.1
GraciosaIsland6.134.728.944.07.61.9
PicoIsland180.084.728.944.030.67.7
CorvoIsland7.514.728.944.033.28.4
Total-----281.071.2

