Applying SHETRAN in a Tropical West African Catchment (Dano, Burkina Faso)—Calibration, Validation, Uncertainty Assessment
Abstract
:1. Introduction
- (1)
- assess the uncertainty of measured discharge and SSL used to calibrate and validate the hydrological and erosion components of SHETRAN;
- (2)
- perform a detailed sensitivity analysis to define parameter ranges and to reduce the number of calibration parameters;
- (3)
- use a Latin Hypercube Sampling approach to calibrate the model and to define uncertainty bounds of simulated discharge and SSL;
- (4)
- evaluate model performance considering the uncertainty of measured data used to compare the model output and parameter uncertainty.
2. Materials and Methods
2.1. Study Area
2.2. Data Sources
2.3. Model Description
- Fully 3D subsurface flow simulation based on Richards’ equation.
- Infiltration is calculated using Richards’ equation.
- Overland and channel flow is calculated using the diffusive wave approximations of the full Saint-Venant equation.
- Potential evapotranspiration (ETp): Potential plant transpiration, evaporation from intercepting surfaces and from bare soil as well as water bodies was calculated externally based on the Penman-Monteith equation [58] and added as input into SHETRAN.
- Actual evapotranspiration (ETa) is estimated based on the approach introduced by Feddes et al. [59] where the ratio ETa/ETp is a function of soil moisture tension. The ratio ETa/ETp at field capacity is the input parameter and the reduction of ETa with decreasing soil moisture tension is calculated based on this parameter.
2.4. Model Sensitivity, Calibration, and Validation
2.5. Uncertainty Analyses
2.5.1. Measurement Uncertainty
2.5.2. Parameter Uncertainty
2.5.3. Uncertainty Based Modification of the NSE
3. Results and Discussion
3.1. Measurement Uncertainty
3.2. Model Sensitivity
3.3. Calibration and Validation
3.3.1. Hydrological Modelling
3.3.2. Erosion Modelling
Simulated Erosion Sources
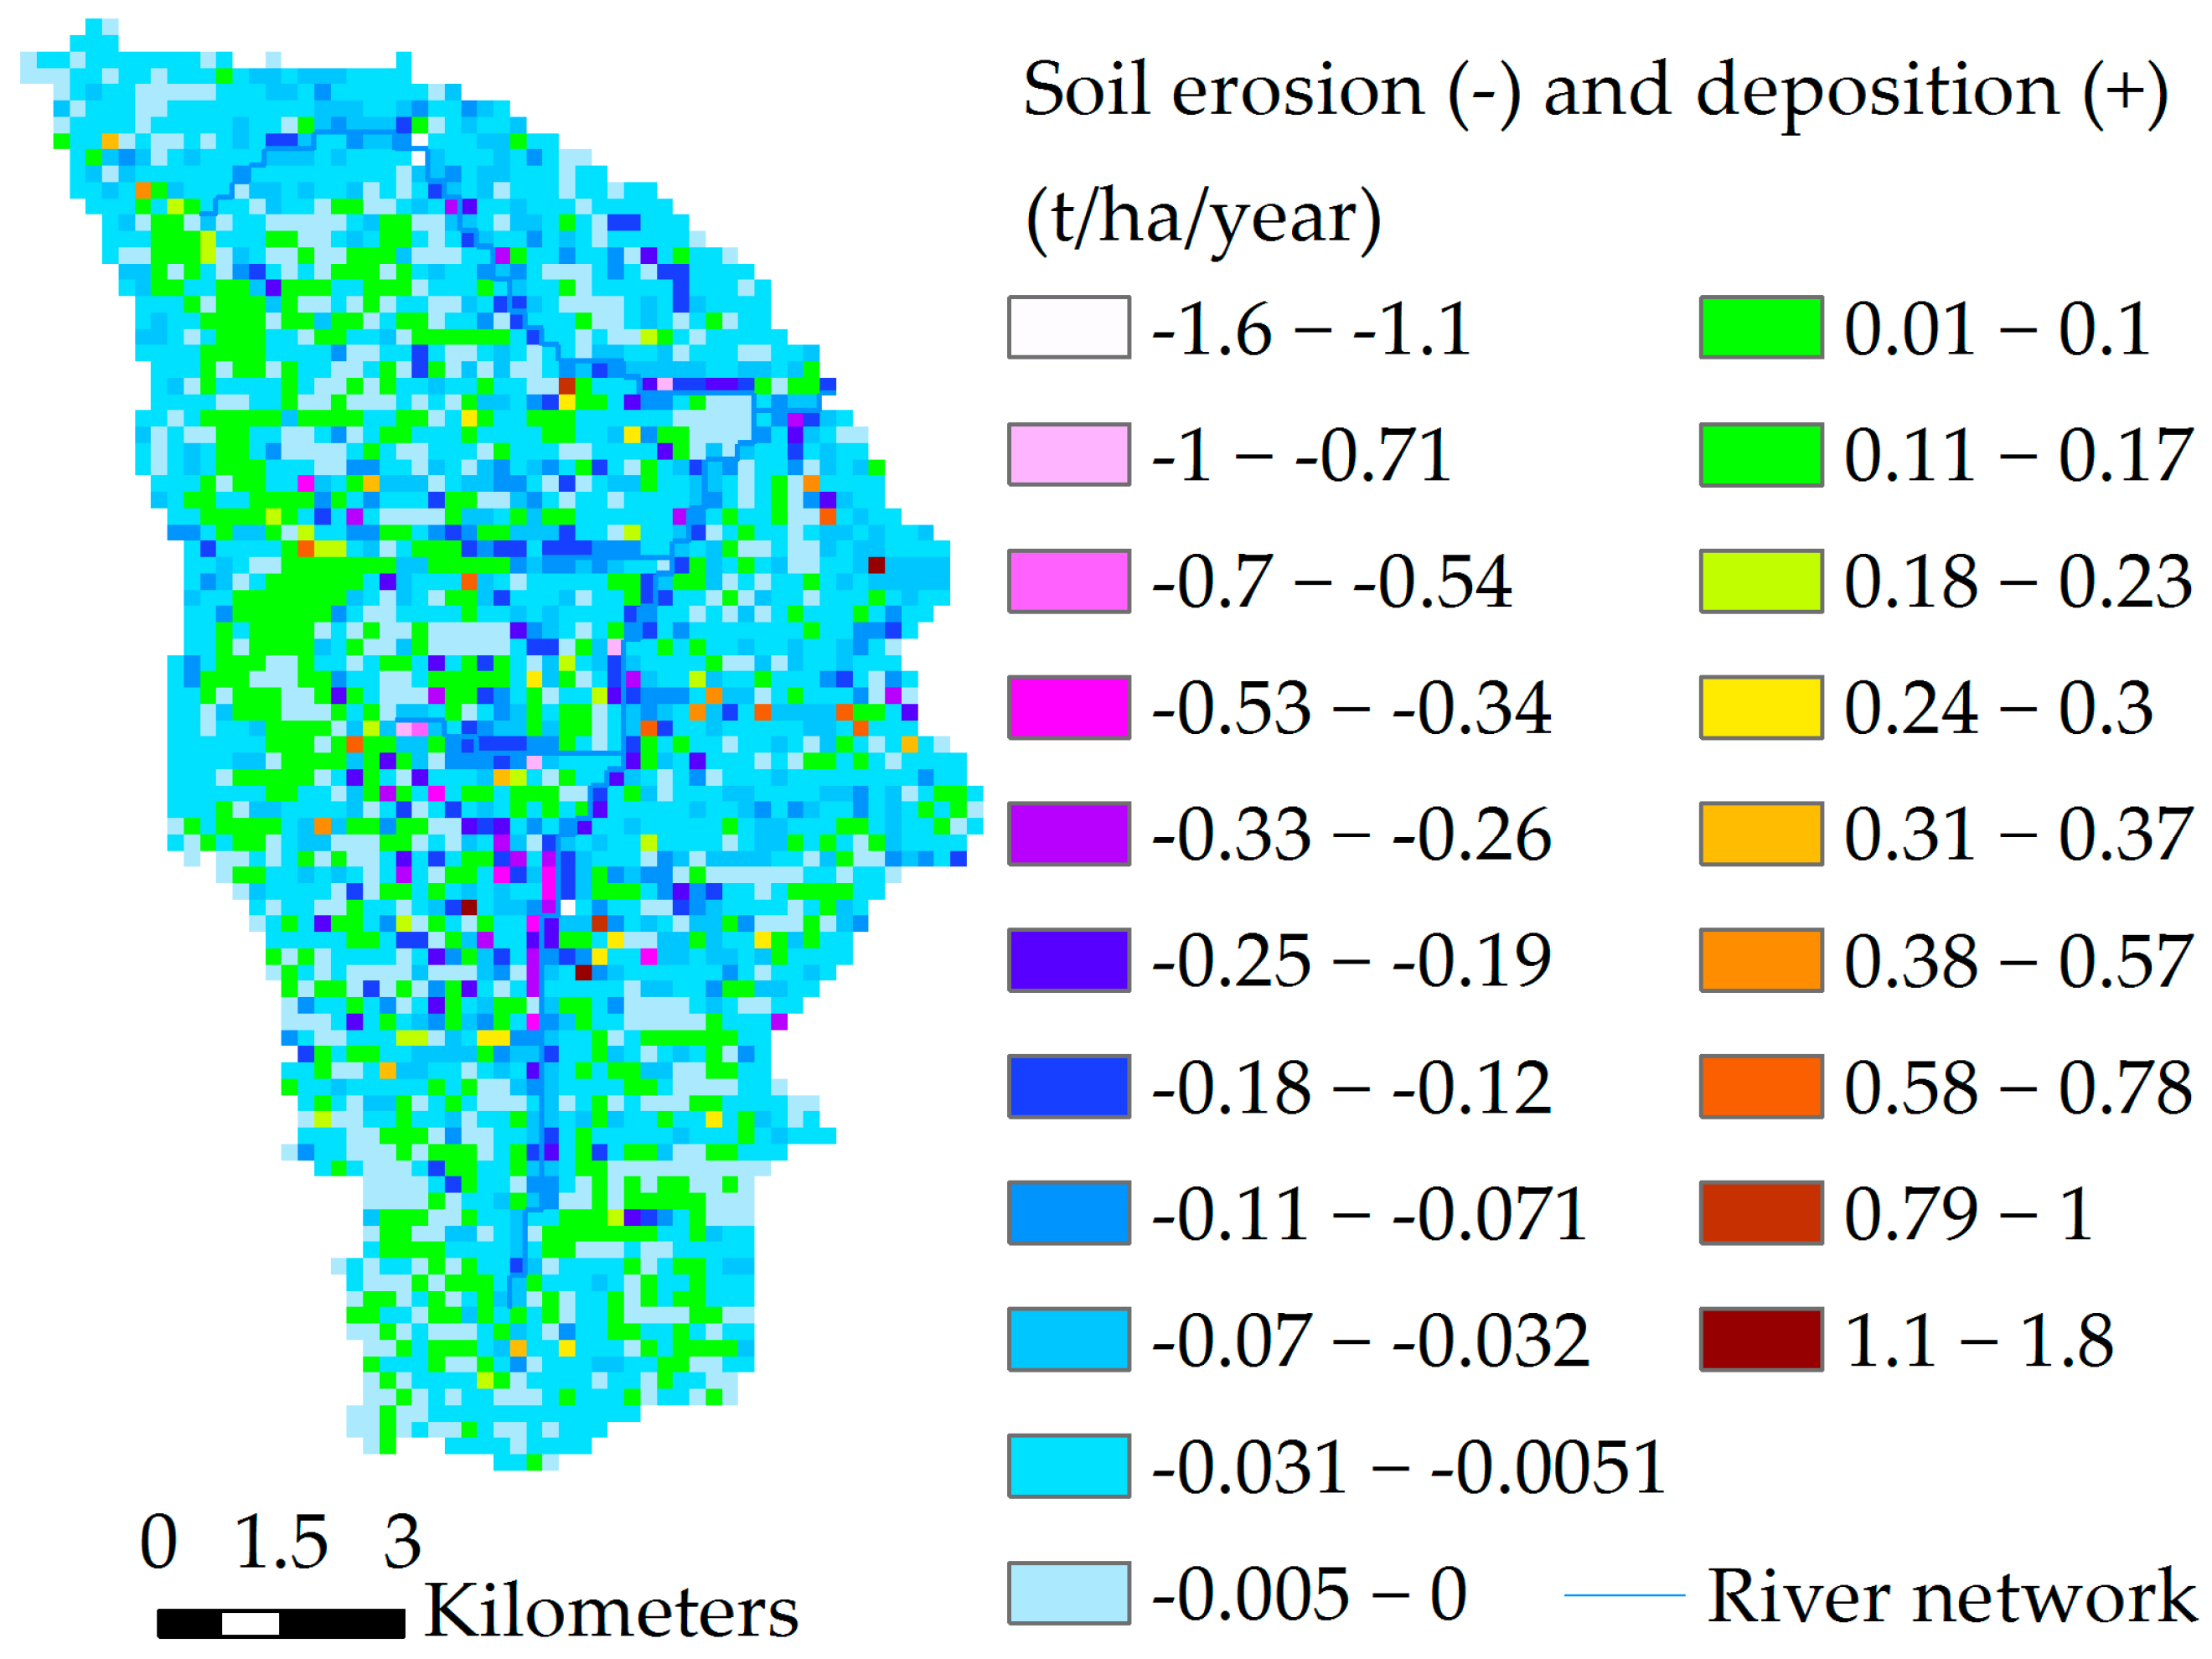
Catchment Distributed Erosion
4. Conclusions
- (1)
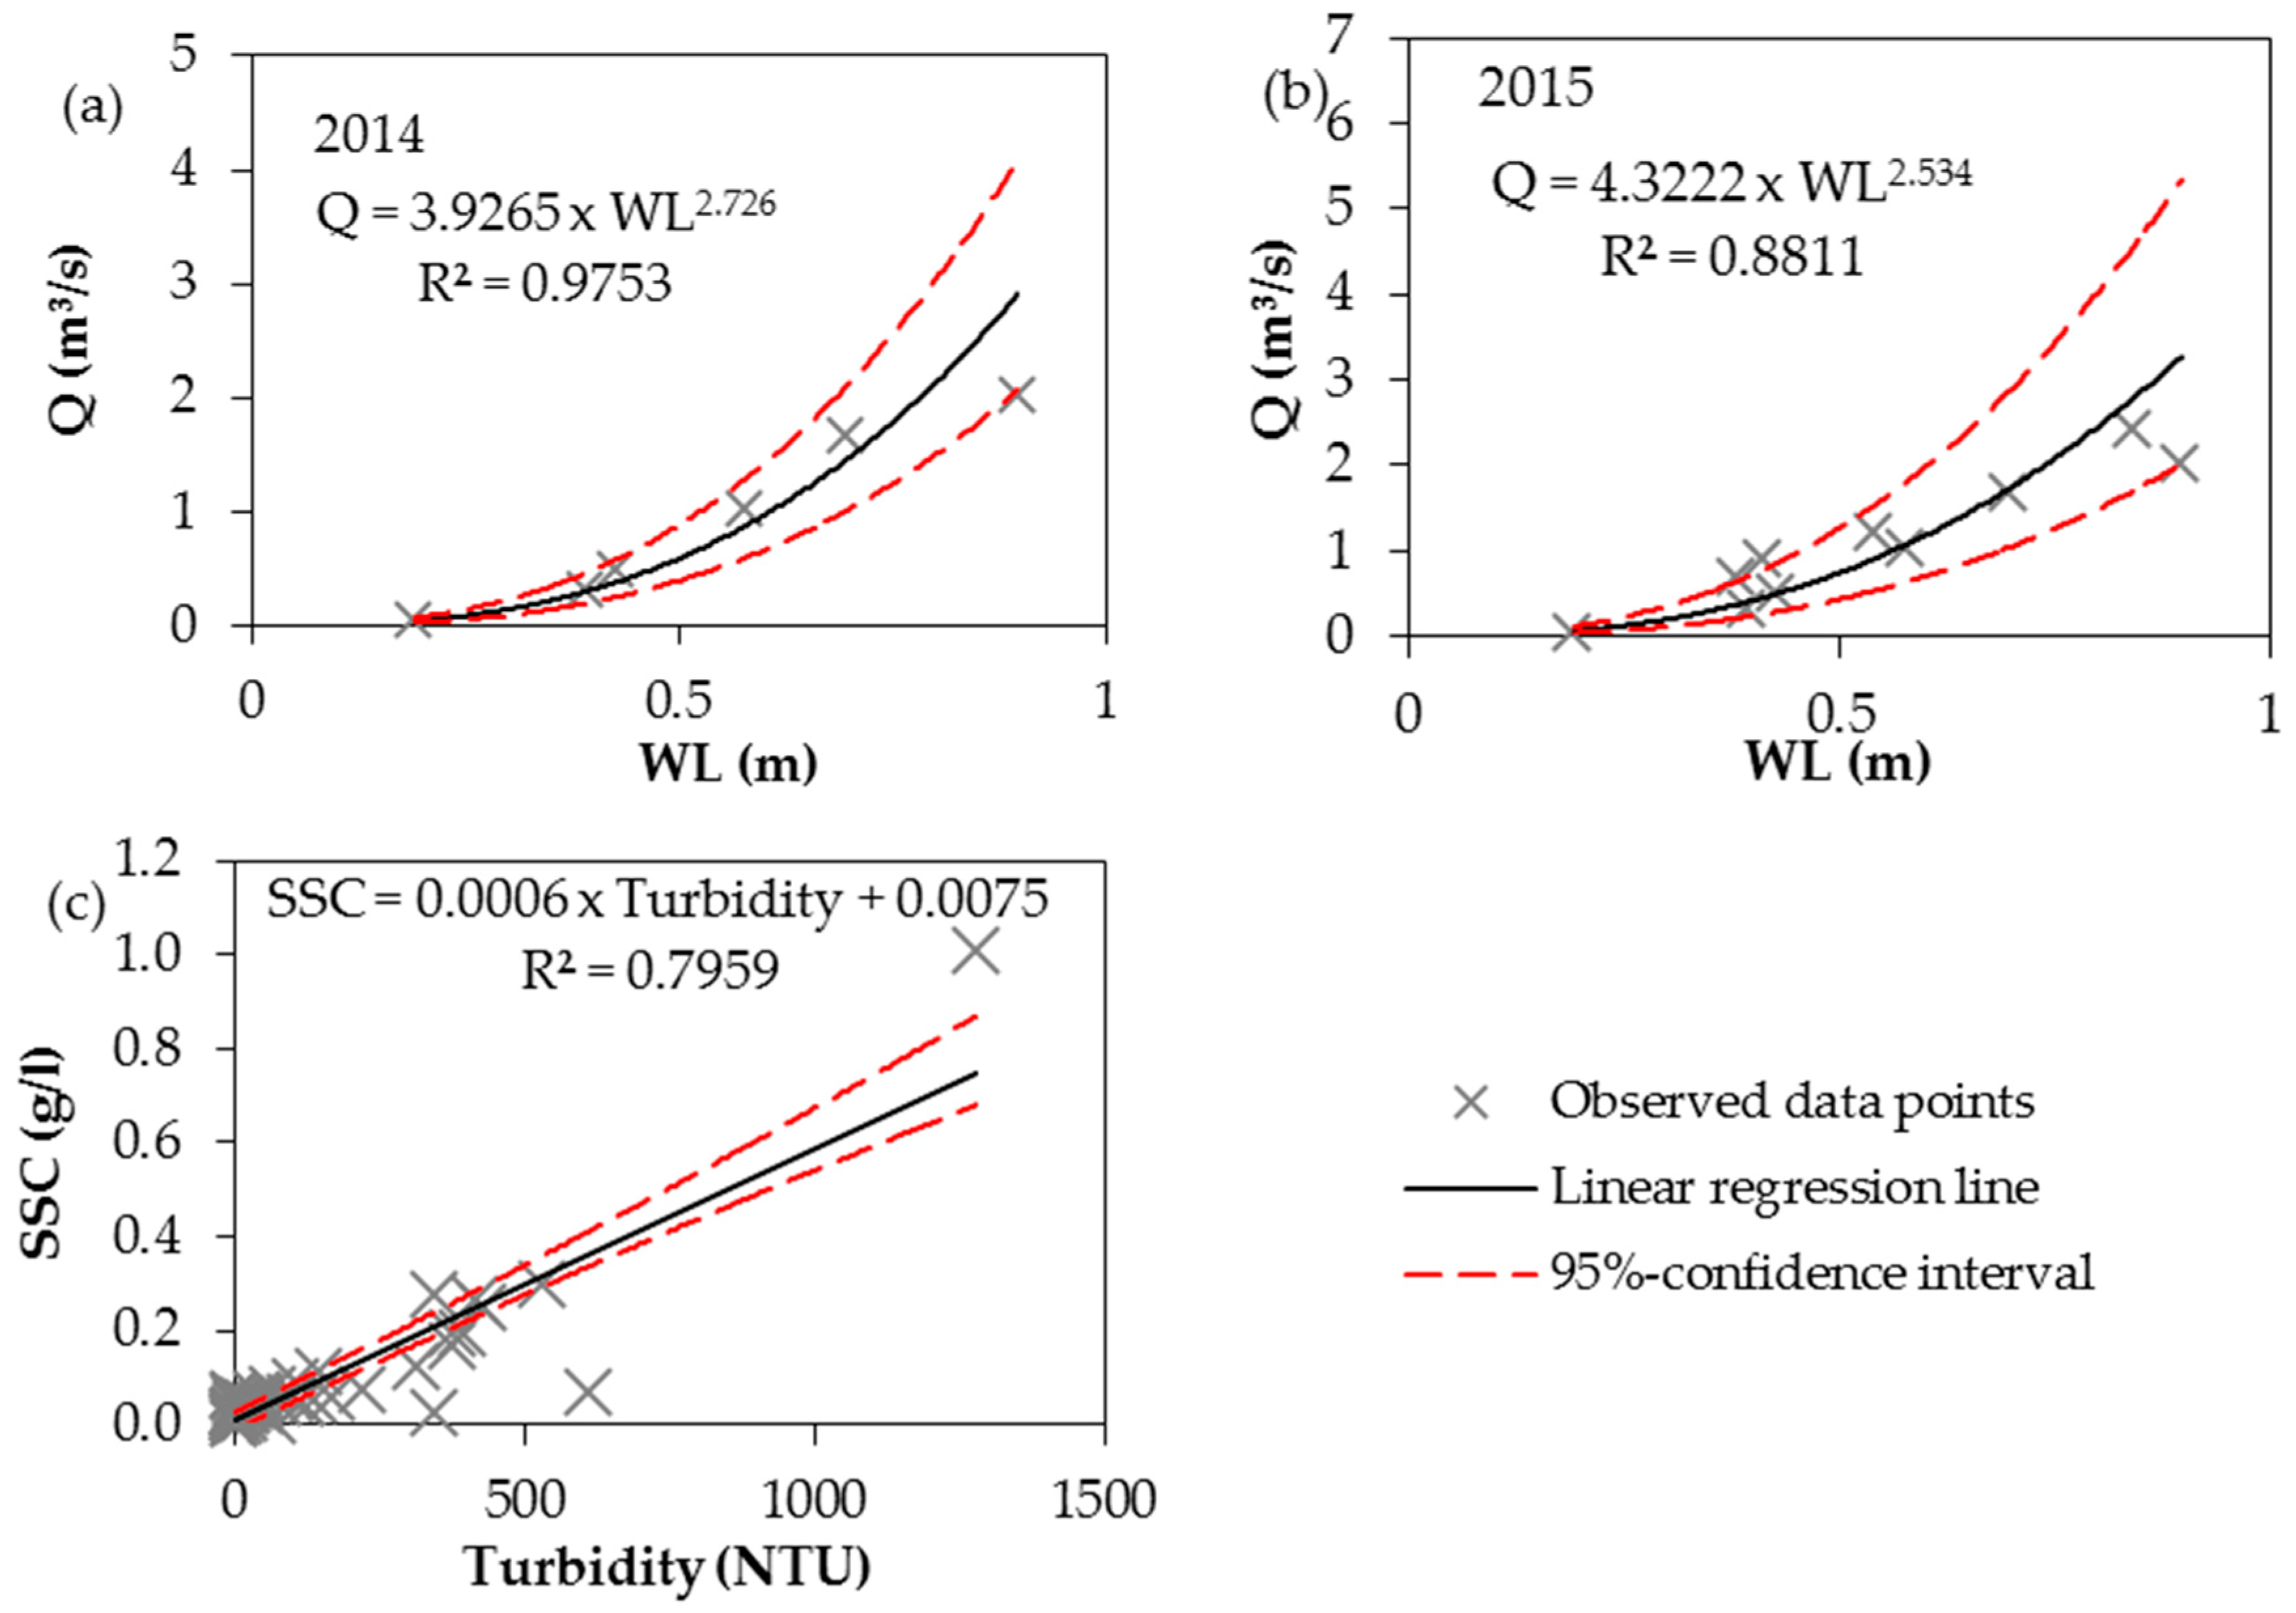
- The performed uncertainty analyses of observed discharge reveals large uncertainty bands especially during peak flows (max. uncertainty from 17.3 (−34.1% of measured value) to 40.3 m3/s (+53.1% of measured value)) which was attributed on the one hand to the power law chosen for the rating curves and on the other hand to the sample properties. As a result of the intrinsic measurement errors and the error propagation the combined uncertainty of SSL is quite large (max. uncertainty from 2.8 to 8 kg/s).
- (2)
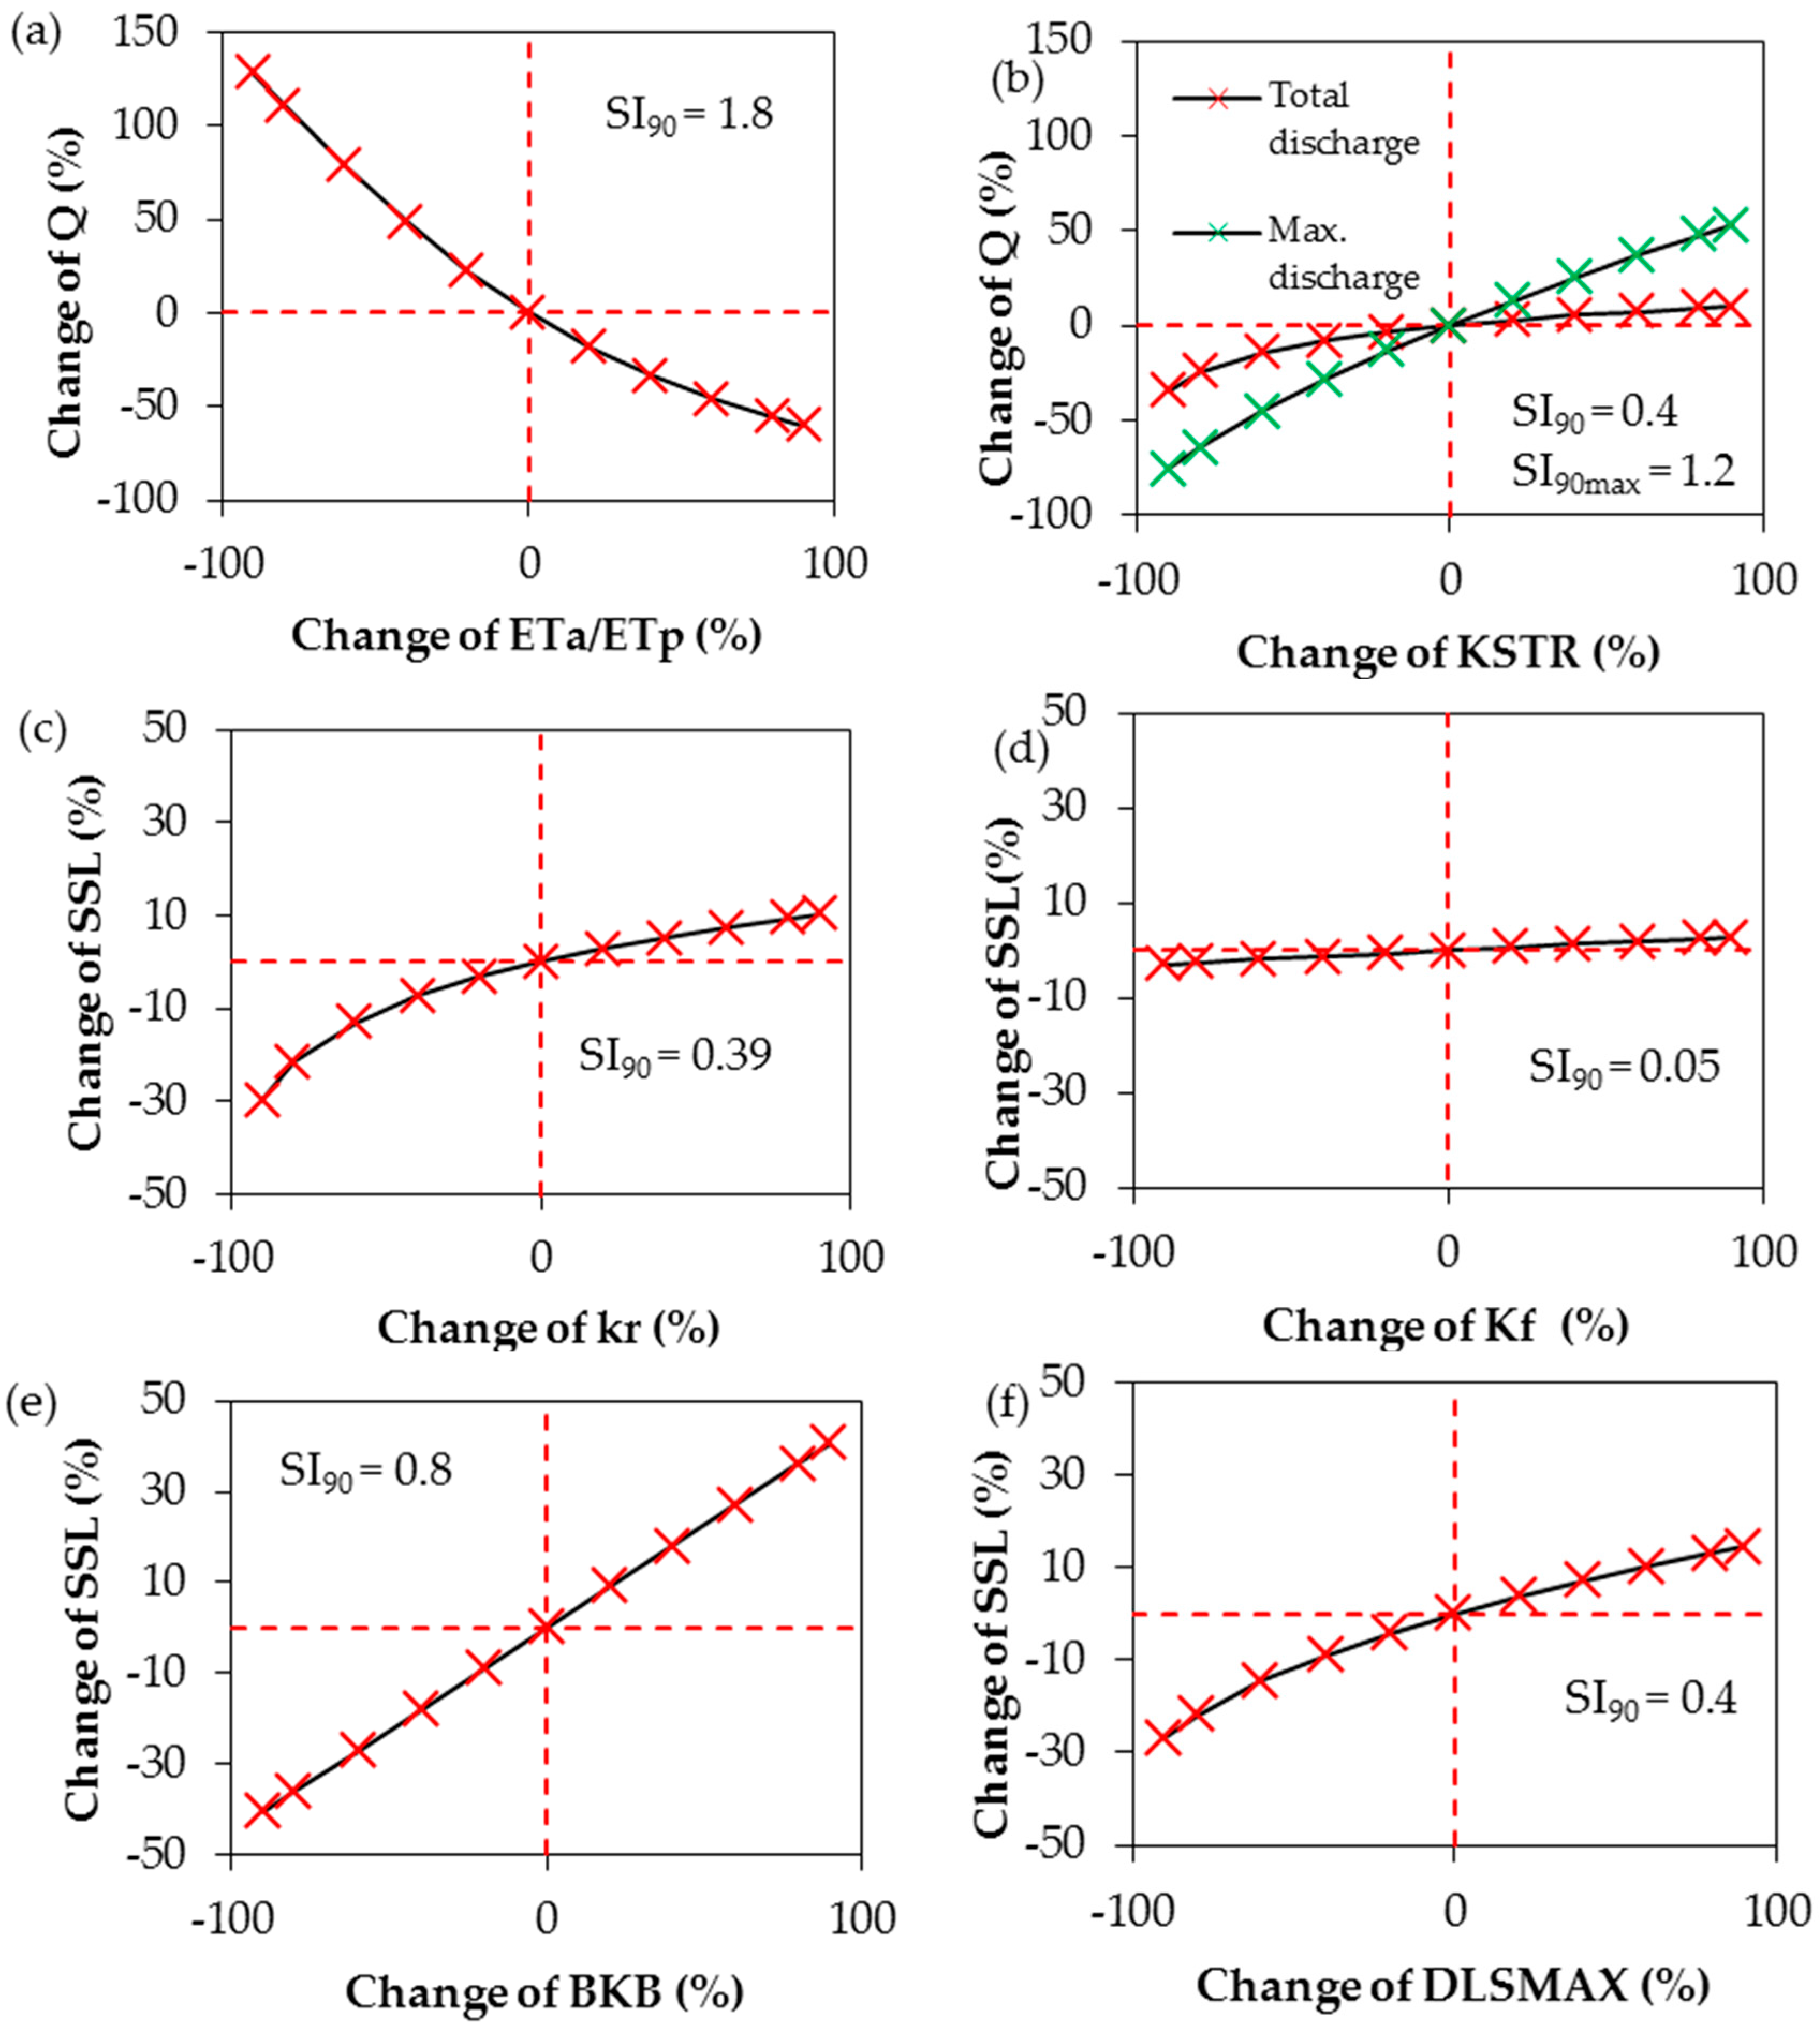
- Two hydrological parameters were tested regarding the sensitivity of the model response. Whereas the ratio ETa/ETp affects total catchment runoff, the roughness coefficient KSTR has greater effect on the maximum runoff. Among the four tested erosion related model parameters the river bank erodibility coefficient BKR had the largest impact on the model response. Parameter ranges of the overland flow erodibility coefficient kf and DLSMAX were quite low which was explained by the higher soil erodibility of the soils found in the study area.
- (3)
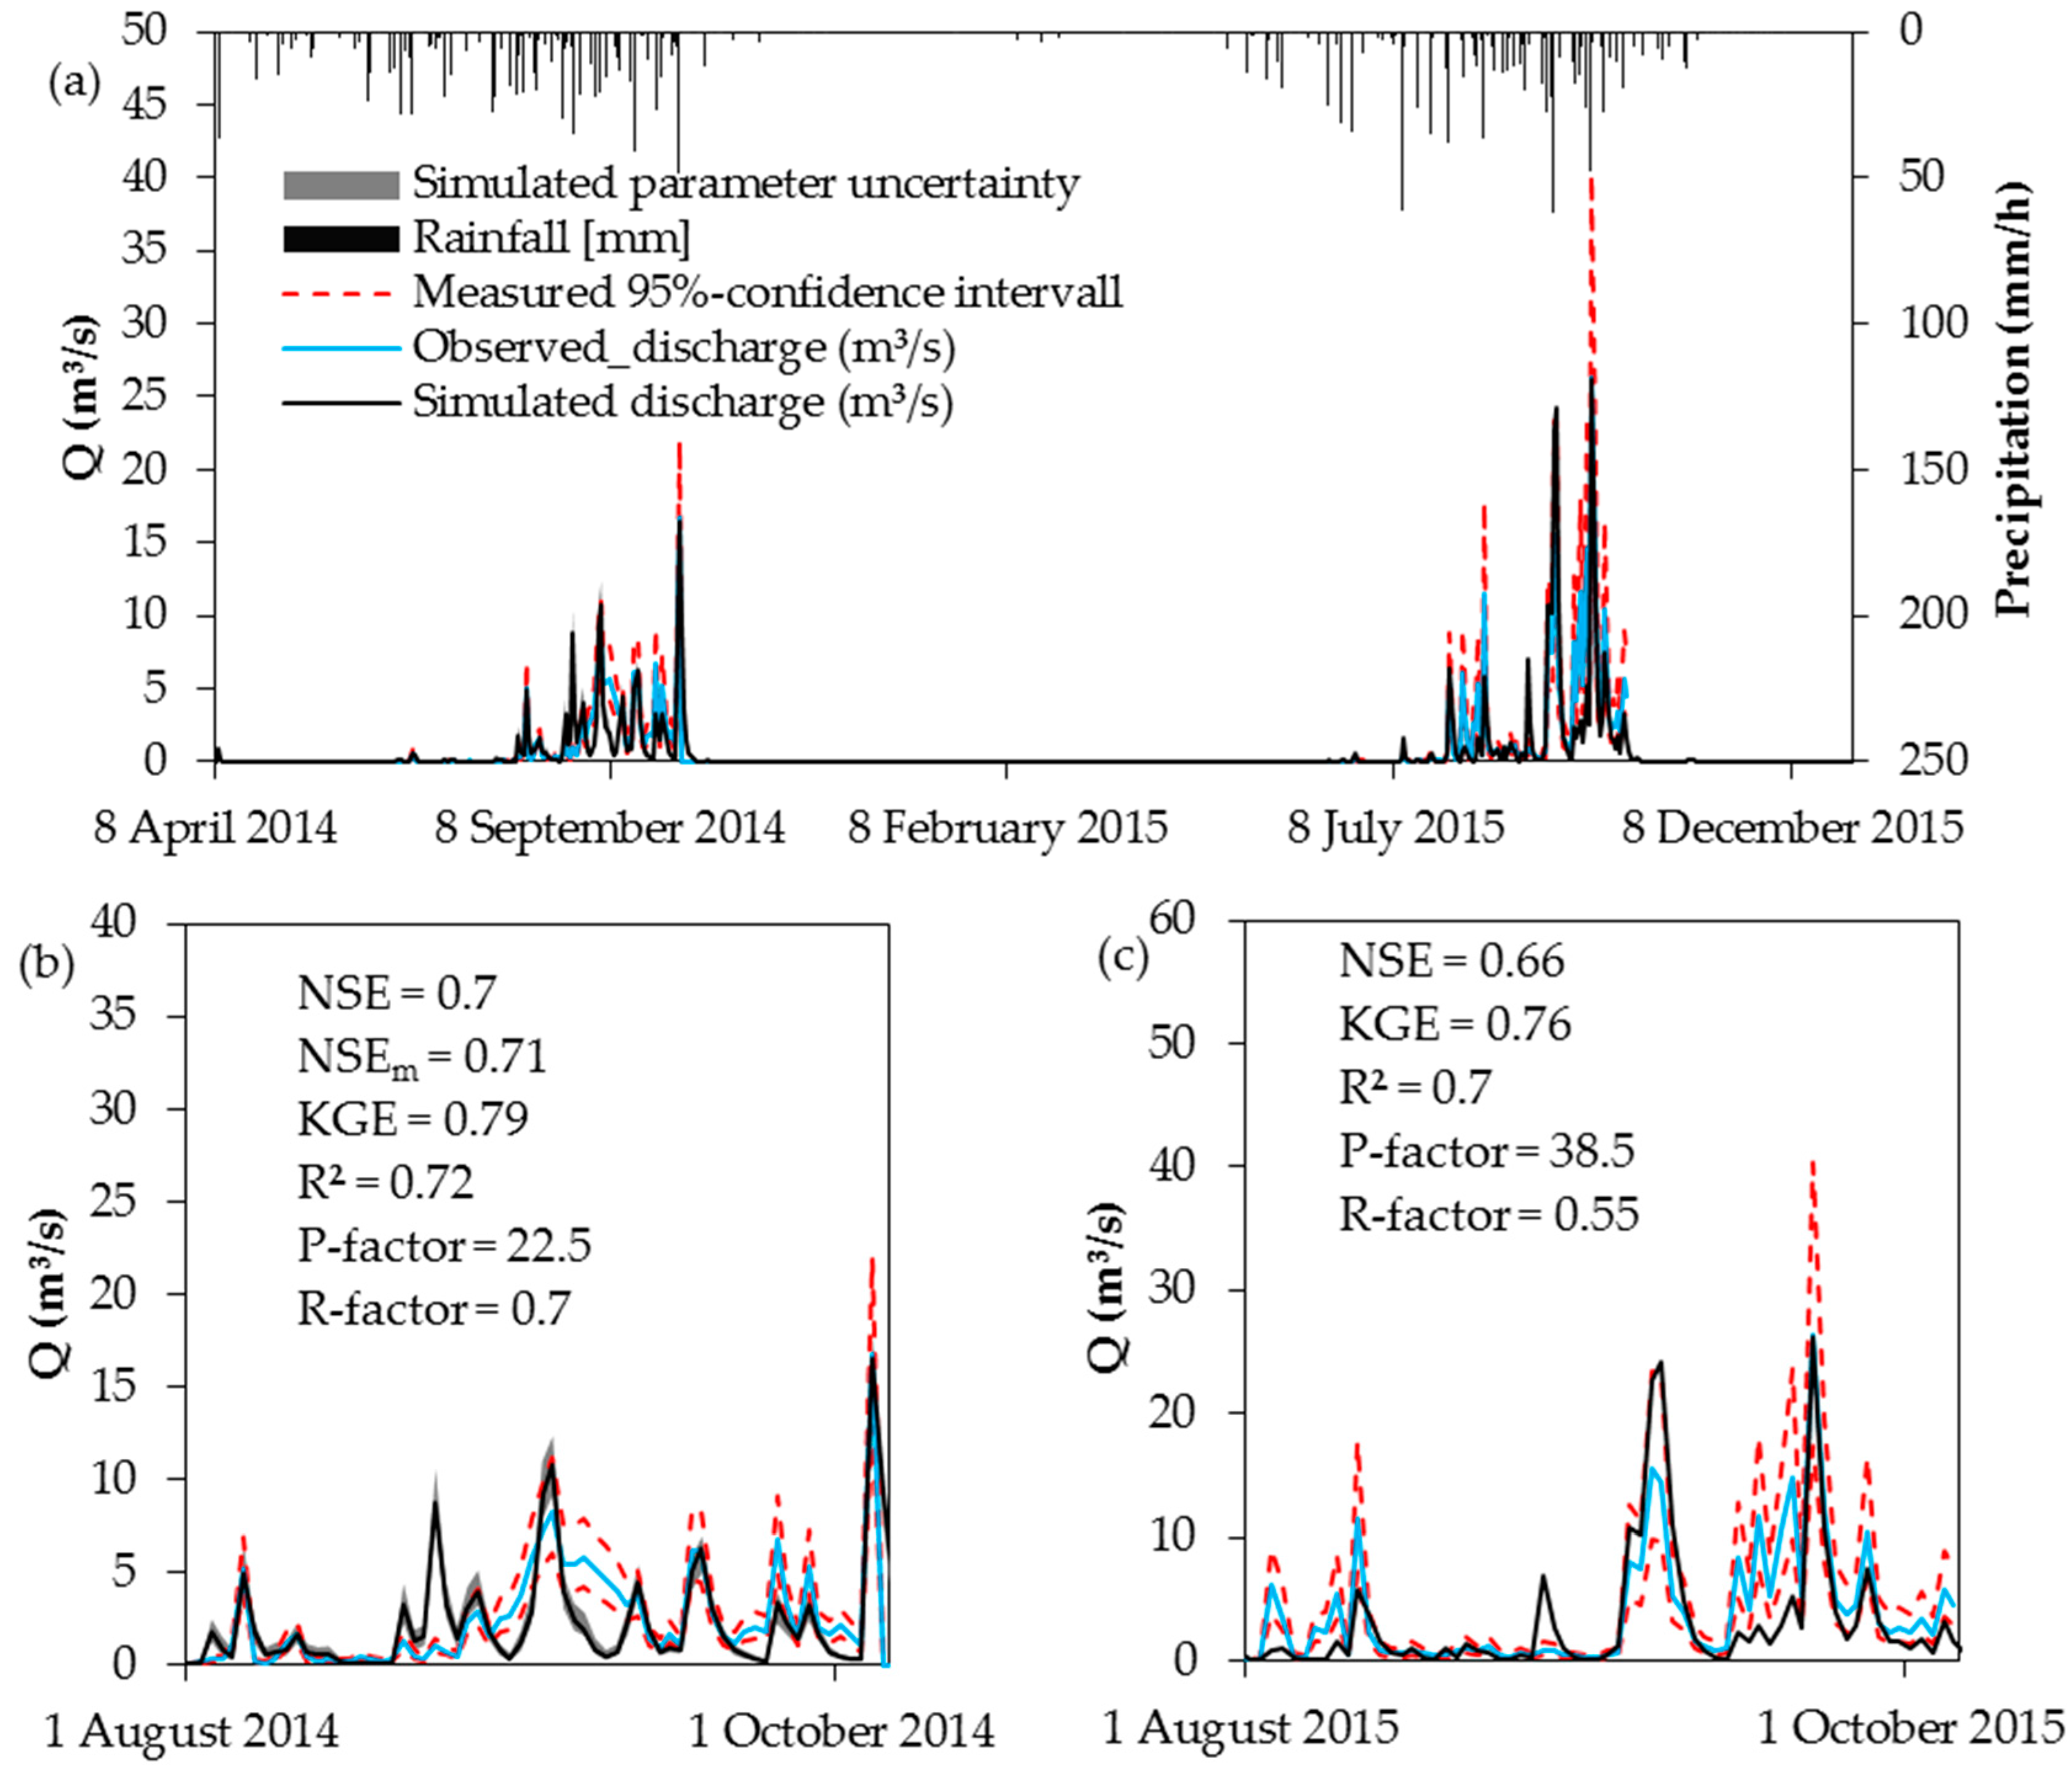
- The performance indices of simulated discharge are good (≥0.66) and comparable with other studies that used SHETRAN. Among these studies R2 and NSE values above 0.5 are frequently reported. However, SHETRAN often underestimates base flow which could be explained by the missing calibration of hydrological subsurface parameters. Some peaks were not well represented due to the differences between real and model spatial representation of rainfall. The performance indices of the simulated SSL are comparable with the few studies that used SHETRAN to simulate soil erosion and that indicated model performance. As the calculation of SSC is based on the relation between turbidity and sediment concentration, input of organic material into the river following the burning of crop residues and grassland may lead to high turbidity readings although the measured weight is low [91,92]. Thus, the mismatch between observed and simulated SSL at the start of the rainy season may also be explained by the method used to obtain the sedigraph.
- (4)
- The combined uncertainty assessment of measured and simulated discharge showed that SHETRAN frequently underestimates base flow despite large measured uncertainty bounds. The modified NSEm used to include both uncertainties in the quality assessment showed that the overlapping areas of distributions are rarely observed and small. As a result of the large uncertainty of observed SSL the model uncertainty is almost always within the range of measured uncertainty bounds. This is also reflected by a slightly higher NSEm in comparison with the traditional NSE. The erosion sources simulated by SHETRAN do not correspond with the sources reported in the literature. The contribution of river bank and bed erosion may be too high and the erosion on hillslopes too low. However, knowledge on this point is limited. Results from fingerprint analyses may help to validate the simulated output.
Acknowledgments
Author Contributions
Conflicts of Interest
References
- Bationo, A.; Kihara, J.; Vanlauwe, B.; Waswa, B.; Kimetu, J. Soil organic carbon dynamics, functions and management in West African agro-ecosystems. Agric. Syst. 2007, 94, 13–25. [Google Scholar] [CrossRef]
- Lal, R. Soil degradation by erosion. Land Degrad. Dev. 2001, 12, 519–539. [Google Scholar] [CrossRef]
- Toy, T.J.; Foster, G.R.; Renard, K.G. Soil Erosion: Processes, Prediction, Measurement, and Control; John Wiley & Sons: Hoboken, NJ, USA, 2002. [Google Scholar]
- United Nations Environmental Programme. Global Environment Outlook 4; UNEP: Valletta, Malta, 2012; p. 551. [Google Scholar]
- Morgan, R.P.C. Soil Erosion and Conservation; Blackwell Publishing: Oxford, UK, 2005. [Google Scholar]
- Okou, F.A.Y.; Tente, B.; Bachmann, Y.; Sinsin, B. Regional erosion risk mapping for decision support: A case study from West Africa. Land Use Policy 2016, 56, 27–37. [Google Scholar] [CrossRef]
- Smith, P.; House, J.I.; Bustamante, M.; Sobocká, J.; Harper, R.; Pan, G.; West, P.C.; Clark, J.M.; Adhya, T.; Rumpel, C.; et al. Global change pressures on soils from land use and management. Glob. Chang. Biol. 2016, 22, 1008–1028. [Google Scholar] [CrossRef] [PubMed]
- De Vente, J.; Poesen, J.; Verstraeten, G.; Govers, G.; Vanmaercke, M.; Van Rompaey, A.; Arabkhedri, M.; Boix-Fayos, C. Predicting soil erosion and sediment yield at regional scales: Where do we stand? Earth Sci. Rev. 2013, 127, 16–29. [Google Scholar] [CrossRef]
- Pandey, A.; Himanshu, S.K.; Mishra, S.K.; Singh, V.P. Physically based soil erosion and sediment yield models revisited. Catena 2016, 147, 595–620. [Google Scholar] [CrossRef]
- Lal, R. Soil Erosion Research Methods; CRC Press: Boca Raton, FL, USA, 1994. [Google Scholar]
- Ewen, J.; Parkin, G.; O’Connell, P.E. SHETRAN: Distributed river basin flow and transport modeling system. J. Hydrol. Eng. 2000, 5, 250–258. [Google Scholar] [CrossRef]
- Wicks, J.M.; Bathurst, J.C. SHESED: A physically based, distributed erosion and sediment yield component for the SHE hydrological modelling system. J. Hydrol. 1996, 175, 213–238. [Google Scholar] [CrossRef]
- Birkinshaw, S.J.; Bathurst, J.C. Model study of the relationship between sediment yield and river basin area. Earth Surf. Process. Landf. 2006, 31, 750–761. [Google Scholar] [CrossRef]
- Đukić, V.; Radić, Z. Sensitivity Analysis of a Physically Based Distributed Model. Water Resour. Manag. 2016, 30, 1669–1684. [Google Scholar] [CrossRef]
- Ewen, J.; O’Donnell, G.; Burton, A.; O’Connell, E. Errors and uncertainty in physically-based rainfall-runoff modelling of catchment change effects. J. Hydrol. 2006, 330, 641–650. [Google Scholar] [CrossRef]
- Beven, K.; Freer, J. Equifinality, data assimilation, and uncertainty estimation in mechanistic modelling of complex environmental systems using the GLUE methodology. J. Hydrol. 2001, 249, 11–29. [Google Scholar] [CrossRef]
- Rompaey, A.J.; Govers, G. Data quality and model complexity for regional scale soil erosion prediction. Int. J. Geogr. Inf. Sci. 2002, 16, 663–680. [Google Scholar] [CrossRef]
- Harmel, R.D.; Smith, P.K. Consideration of measurement uncertainty in the evaluation of goodness-of-fit in hydrologic and water quality modeling. J. Hydrol. 2007, 337, 326–336. [Google Scholar] [CrossRef]
- Navratil, O.; Esteves, M.; Legout, C.; Gratiot, N.; Nemery, J.; Willmore, S.; Grangeon, T. Global uncertainty analysis of suspended sediment monitoring using turbidimeter in a small mountainous river catchment. J. Hydrol. 2011, 398, 246–259. [Google Scholar] [CrossRef]
- Rasmussen, P.P.; Gray, J.R.; Glysson, G.D.; Ziegler, A.C. Guidelines and Procedures for Computing Time-Series Suspended-Sediment Concentrations and Loads from In-Stream Turbidity-Sensor and Streamflow Data; U.S. Geological Survey: Reston, VA, USA, 2009.
- Rode, M.; Suhr, U. Uncertainties in selected river water quality data. Hydrol. Earth Syst. Sci. 2007, 11, 863–874. [Google Scholar] [CrossRef]
- Kusimi, J.M.; Yiran, G.A.; Attua, E.M. Soil Erosion and Sediment Yield Modelling in the Pra River Basin of Ghana using the Revised Universal Soil Loss Equation (RUSLE). Ghana J. Geogr. 2016, 7, 38–57. [Google Scholar]
- Bossa, A.; Diekkrüger, B.; Agbossou, E. Scenario-Based Impacts of Land Use and Climate Change on Land and Water Degradation from the Meso to Regional Scale. Water 2014, 6, 3152–3181. [Google Scholar] [CrossRef]
- Obeta, I.N.; Adewumi, J.K. Soil Loss in Samaru Zaria Nigeria: A comparison of WEPP and EUROSEM Models. Niger. J. Technol. 2013, 32, 197–202. [Google Scholar]
- Schmengler, A.C. Modeling Soil Erosion and Reservoir Sedimentation at Hillslope and Catchment Scale in Semi-Arid Burkina Faso. Ph.D. Thesis, Rheinische Friedrich-Wilhelms-Universität, Bonn, Germany, 2010. [Google Scholar]
- Hiepe, C. Soil Degradation by Water Erosion in a Sub-Humid West-African Catchment—A Modelling Approach Considering Land Use and Climate Change in Benin. Ph.D. Thesis, Rheinische Friedrich-Wilhelms-Universität, Bonn, Germany, 2008. [Google Scholar]
- Visser, S.M.; Sterk, G.; Karssenberg, D. Modelling water erosion in the Sahel: Application of a physically based soil erosion model in a gentle sloping environment. Earth Surf. Process. Landf. 2005, 30, 1547–1566. [Google Scholar] [CrossRef]
- Karambiri, H.; Ribolzi, O. Identification of sediment sources in a small grazed Sahelian catchment, Burkina Faso. In Sediment Budgets 1; Walling, D.E., Horowitz, A., Eds.; IAHS Press: Wallingford, UK, 2005; p. 291. [Google Scholar]
- Mati, B.M.; Veihe, A. Application of the USLE in a Savannah Environment: Comparative Experiences from East and West Africa. Singap. J. Trop. Geogr. 2001, 22, 138–155. [Google Scholar] [CrossRef]
- Igwe, C.A.; Mbagwu, J.S.C. Application of SLEMSA and USLE models for potential erosion hazard mapping in South-Eastern Nigeria. Int. Agrophys. 1999, 13, 41–48. [Google Scholar]
- Roose, E.J. Use of the Universal Soil Loss Equation to Predict Erosion in West Africa; Soil Conservation Society of America: Ankeny, IA, USA, 1977; pp. 60–74. [Google Scholar]
- Đukić, V.; Radić, Z. GIS Based Estimation of Sediment Discharge and Areas of Soil Erosion and Deposition for the Torrential Lukovska River Catchment in Serbia. Water Resour. Manag. 2014, 28, 4567–4581. [Google Scholar] [CrossRef]
- Zhang, R. Integrated Modelling for Evaluation of Climate Change Impacts on Agricultural Dominated Basin. Ph.D. Thesis, University Evora, Evora, Portugal, 2015. [Google Scholar]
- Mourato, S.; Moreira, M.; Corte-Real, J. Water Resources Impact Assessment under Climate Change Scenarios in Mediterranean Watersheds. Water Resour. Manag. 2015, 29, 2377–2391. [Google Scholar] [CrossRef]
- Naseela, E.K.; Dodamani, B.M.; Chandran, C. Estimation of Runoff Using NRCS-CN Method and SHETRAN Model. Int. Adv. Res. J. Sci. Eng. Technol. 2015, 2, 23–28. [Google Scholar]
- Birkinshaw, S.J.; Bathurst, J.C.; Robinson, M. 45 years of non-stationary hydrology over a forest plantation growth cycle, Coalburn catchment, Northern England. J. Hydrol. 2014, 519, 559–573. [Google Scholar] [CrossRef]
- Tripkovic, V. Quantifying and Upscaling Surface and Subsurface Runoff and Nutrient Flows under Climate Variability. Ph.D. Thesis, Newcastle University, Newcastle upon Tyne, UK, 2014. [Google Scholar]
- Elliott, A.H.; Oehler, F.; Schmidt, J.; Ekanayake, J.C. Sediment modelling with fine temporal and spatial resolution for a hilly catchment. Hydrol. Process. 2011, 26, 3645–3660. [Google Scholar] [CrossRef]
- Bathurst, J.C.; Birkinshaw, S.J.; Cisneros, F.; Fallas, J.; Iroumé, A.; Iturraspe, R.; Novillo, M.G.; Urciuolo, A.; Alvarado, A.; Coello, C.; et al. Forest impact on floods due to extreme rainfall and snowmelt in four Latin American environments 2: Model analysis. J. Hydrol. 2011, 400, 292–304. [Google Scholar] [CrossRef]
- Birkinshaw, S.J.; Bathurst, J.C.; Iroumé, A.; Palacios, H. The effect of forest cover on peak flow and sediment discharge—An integrated field and modelling study in central-southern Chile. Hydrol. Process. 2010, 25, 1284–1297. [Google Scholar] [CrossRef]
- De Figueiredo, E.E.; Bathurst, J.C. Runoff and sediment yield predictions in a semiarid region of Brazil using SHETRAN. In Proceedings of the PUB Kick-Off Meeting, Brasilia, Brazil, 20–22 November 2002; International Association of Hydrological Sciences (IAHS) Publications: Wallingford, UK, 2007; Volume 309. [Google Scholar]
- Adams, R.; Parkin, G.; Elliott, S.; Rutherford, K. Modelling of hillslope erosion from New Zealand pasture using a rainfall simulator. In Proceedings of the British Hydrological Society International Conference, London, UK, 2004; pp. 415–420.
- Norouzi Banis, Y.; Bathurst, J.C.; Walling, D.E. Use of caesium-137 data to evaluate SHETRAN simulated long-term erosion patterns in arable lands. Hydrol. Process. 2004, 18, 1795–1809. [Google Scholar] [CrossRef]
- Anderton, S.P.; Latron, J.; White, S.M.; Llorens, P.; Gallart, F.; Salvany, C.; O’Connell, P.E. Internal evaluation of a physically-based distributed model using data from a Mediterranean mountain catchment. Hydrol. Earth Syst. Sci. Discuss. 2002, 6, 67–84. [Google Scholar] [CrossRef]
- Lukey, B.; Sheffield, J.; Bathurst, J.; Hiley, R.; Mathys, N. Test of the SHETRAN technology for modelling the impact of reforestation on badlands runoff and sediment yield at Draix, France. J. Hydrol. 2000, 235, 44–62. [Google Scholar] [CrossRef]
- Callo-Concha, D.; Gaiser, T.; Ewert, F. Farming and Cropping Systems in the West African Sudanian Savanna. WASCAL Research Area: Northern Ghana, Southwest Burkina Faso and Northern Benin; ZEF Working Paper Series; Center for Development Research: Bonn, Germany, 2012. [Google Scholar]
- Comité Inter-États de Lutte Contre la Sécheresse Dans le Sahel. Landscapes of West Africa—A Window on a Changing World; U.S. Geological Survey EROS: Garretson, SD, USA, 2016.
- Gleisberg-Gerber, K. Livelihoods and Land Management in the Ioba Province in South-Western Burkina Faso; ZEF Working Paper Series; Center for Development Research: Bonn, Germany, 2012. [Google Scholar]
- Yira, Y.; Diekkrüger, B.; Steup, G.; Bossa, A.Y. Modeling land use change impacts on water resources in a tropical West African catchment (Dano, Burkina Faso). J. Hydrol. 2016, 537, 187–199. [Google Scholar] [CrossRef]
- Schmengler, A.C.; Vlek, P.L. Assessment of accumulation rates in small reservoirs by core analysis, 137Cs measurements and bathymetric mapping in Burkina Faso. Earth Surf. Process. Landf. 2015, 40, 1951–1963. [Google Scholar] [CrossRef]
- International Union of Soil Sciences (IUSS) Working Group. World Reference Base for Soil Resources 2006, 2nd ed.; World Soil Resources Reports; Food and Agriculture Organization: Rome, Italy, 2006; Volume 103. [Google Scholar]
- Jarvis, A.; Reuter, H.I.; Nelson, A.; Guevara, E. Hole-Filled SRTM for the Globe Version. 2008. Available online: http://srtm.csi.cgiar.org (accessed on 1 August 2014).
- Forkuor, G. Agricultural Land Use Mapping in West Africa Using Multi-Sensor Satellite Imagery. Ph.D. Thesis, Julius-Maximilians-Universität, Würzburg, Germany, 2014. [Google Scholar]
- Abbott, M.B.; Bathurst, J.C.; Cunge, J.A.; O’Connell, P.E.; Rasmussen, J. An introduction to the European Hydrological System—Systeme Hydrologique Europeen, “SHE”, 1: History and philosophy of a physically-based, distributed modelling system. J. Hydrol. 1986, 87, 45–59. [Google Scholar] [CrossRef]
- Wicks, J.M. Physically-Based Mathematical Modelling of Catchment Sediment Yield. Ph.D. Thesis, Newcastle University, Newcastle upon Tyne, UK, 1988. [Google Scholar]
- Parkin, G. A three-Dimensional Variably-Saturated Subsurface Modelling System for River Basins. Ph.D. Thesis, Newcastle University, Newcastle upon Tyne, UK, 1996. [Google Scholar]
- Bathurst, J.C. Predicting Impacts of Land Use and Climate Change on Erosion and Sediment Yield in River Basins Using SHETRAN. In Handbook of Erosion Modelling; John Wiley & Sons, Ltd.: Hoboken, NJ, USA, 2010; pp. 263–288. [Google Scholar]
- Monteith, J.L. Vegetation and the Atmosphere, Vol. 1: Principles, Vol. 2: Case Studies; Academic Press: New York, NY, USA, 1975. [Google Scholar]
- Feddes, R.A.; Kowalik, P.; Neuman, S.P.; Bresler, E. Finite Difference and Finite Element Simulation of Field Water Uptake by Plants. Hydrol. Sci. J. 1976, 21, 81–98. [Google Scholar]
- Rutter, A.J.; Morton, A.J.; Robins, P.C. A Predictive Model of Rainfall Interception in Forests. II. Generalization of the Model and Comparison with Observations in Some Coniferous and Hardwood Stands. J. Appl. Ecol. 1975, 12, 367–380. [Google Scholar] [CrossRef]
- Rutter, A.J.; Kershaw, K.A.; Robins, P.C.; Morton, A.J. A predictive model of rainfall interception in forests, 1. Derivation of the model from observations in a plantation of Corsican pine. Agric. Meteorol. 1972, 9, 367–384. [Google Scholar] [CrossRef]
- Van Genuchten, M.T. A closed-form equation for predicting the hydraulic conductivity of unsaturated soils. Soil Sci. Soc. Am. J. 1980, 44, 892–898. [Google Scholar] [CrossRef]
- Rawls, W.J.; Brakensiek, D.L. Prediction of soil water properties for hydrologic modeling. In Watershed Management in the Eighties; Amer Society of Civil Engineers (ASCE): Reston, VA, USA, 1985; pp. 293–299. [Google Scholar]
- Brakensiek, D.L.; Rawls, W.J. Soil containing rock fragments: Effects on infiltration. Catena 1994, 23, 99–110. [Google Scholar] [CrossRef]
- Birkinshaw, S.J. Technical Note: Automatic river network generation for a physically-based river catchment model. Hydrol. Earth Syst. Sci. 2010, 14, 1767–1771. [Google Scholar] [CrossRef]
- Wicks, J.M.; Bathurst, J.C.; Johnson, C.W.; Ward, T.J. Application of two physically-based sediment yield models at plot and field scales. In Sediment Budgets (Proceedings of the Porto-Alegre Symposium); IASH Press: Wallingford, UK, 1988; pp. 583–591. [Google Scholar]
- Ariathurai, R.; Arulanandan, K. Erosion rates of cohesive soils. J. Hydraul. Div. 1978, 104, 279–283. [Google Scholar]
- Osman, A.M.; Thorne, C.R. Riverbank stability analysis. I: Theory. J. Hydraul. Eng. 1988, 114, 134–150. [Google Scholar] [CrossRef]
- Engelund, F.; Hansen, E. A Monograph on Sediment Transport in Alluvial Streams; Polyteknisk Forlag: Copenhagen, Denmark, 1967. [Google Scholar]
- Ackers, P.; White, W.R. Sediment transport: New approach and analysis. J. Hydraul. Div. 1973, 99, 2041–2060. [Google Scholar]
- Morgan, R.P.C.; Nearing, M.A. Handbook of Erosion Modelling; Wiley Online Library: Oxford, UK, 2011. [Google Scholar]
- De Roo, A.P.J. Modelling Surface Runoff and Soil Erosion in Catchments Using Geographical Information Systems: Validity and Applicability of the “answers” Model in Two Catchments in the Loess Area of South Limburg (The Netherlands) and one in Devon (UK). Ph.D. Thesis, Rijksuniversiteit Utrecht, The Netherlands, 1993. [Google Scholar]
- McKay, M.D.; Beckman, R.J.; Conover, W.J. A Comparison of Three Methods for Selecting Values of Input Variables in the Analysis of Output from a Computer Code. Technometrics 1979, 21, 239–245. [Google Scholar] [CrossRef]
- Nash, J.E.; Sutcliffe, J.V. River flow forecasting through conceptual models part I—A discussion of principles. J. Hydrol. 1970, 10, 282–290. [Google Scholar] [CrossRef]
- Gupta, H.V.; Kling, H.; Yilmaz, K.K.; Martinez, G.F. Decomposition of the mean squared error and NSE performance criteria: Implications for improving hydrological modelling. J. Hydrol. 2009, 377, 80–91. [Google Scholar] [CrossRef]
- Kling, H.; Fuchs, M.; Paulin, M. Runoff conditions in the upper Danube basin under an ensemble of climate change scenarios. J. Hydrol. 2012, 424, 264–277. [Google Scholar] [CrossRef]
- Shuttleworth, W.J. Evaporation. In Handbook of Hydrology; Maidment, D.R., Ed.; McGraw-Hill: New York, NY, USA, 1993. [Google Scholar]
- Mohamoud, Y.M. Evaluating Manning’s roughness coefficients for tilled soils. J. Hydrol. 1992, 135, 143–156. [Google Scholar] [CrossRef]
- Shen, H.W.; Julien, P.Y. Erosion and sediment transport. In Handbook of Hydrology; Maidment, D.R., Ed.; McGraw-Hill: New York, NY, USA, 1993. [Google Scholar]
- Adams, R.; Elliott, S. Physically based modelling of sediment generation and transport under a large rainfall simulator. Hydro. Process. 2006, 20, 2253–2270. [Google Scholar] [CrossRef]
- Lukey, B.T.; Sheffield, J.; Bathurst, J.C.; Lavabre, J.; Mathys, N.; Martin, C. Simulating the effect of vegetation cover on the sediment yield of mediterranean catchments using SHETRAN. Phys. Chem. Earth 1995, 20, 427–432. [Google Scholar] [CrossRef]
- Helsel, D.R.; Hirsch, R.M. Statistical methods in water resources. In Hydrologic Analysis and Interpretation; U.S. Geological Survey: Reston, VA, USA, 2002. [Google Scholar]
- Abbaspour, K.C.; Faramarzi, M.; Ghasemi, S.S.; Yang, H. Assessing the impact of climate change on water resources in Iran. Water Resour. Res. 2009, 45. [Google Scholar] [CrossRef]
- Harmel, R.D.; Smith, P.K.; Migliaccio, K.W. Modifying goodness-of-fit indicators to incorporate both measurement and model uncertainty in model calibration and validation. Trans. ASABE 2010, 53, 55–63. [Google Scholar] [CrossRef]
- Bathurst, J.C.; Ewen, J.; Parkin, G.; O’Connell, P.E.; Cooper, J.D. Validation of catchment models for predicting land-use and climate change impacts. 3. Blind validation for internal and outlet responses. J. Hydrol. 2004, 287, 74–94. [Google Scholar] [CrossRef]
- Parkin, G.; O’donnell, G.; Ewen, J.; Bathurst, J.C.; O’Connell, P.E.; Lavabre, J. Validation of catchment models for predicting land-use and climate change impacts. 2. Case study for a Mediterranean catchment. J. Hydrol. 1996, 175, 595–613. [Google Scholar] [CrossRef]
- Minella, J.P.G.; Merten, G.H.; Reichert, J.M.; Clarke, R.T. Estimating suspended sediment concentrations from turbidity measurements and the calibration problem. Hydrol. Process. 2008, 22, 1819–1830. [Google Scholar] [CrossRef]
- Nearing, M.A. Why soil erosion models over-predict small soil losses and under-predict large soil losses. Catena 1998, 32, 15–22. [Google Scholar] [CrossRef]
- Walling, D.E.; Collins, A.L.; Sichingabula, H.M.; Leeks, G.J.L. Integrated assessment of catchment suspended sediment budgets: A Zambian example. Land Degrad. Dev. 2001, 12, 387–415. [Google Scholar] [CrossRef]
- Hoffmann, T. Sediment residence time and connectivity in non-equilibrium and transient geomorphic systems. Earth Sci. Rev. 2015, 150, 609–627. [Google Scholar] [CrossRef]
- Gippel, C. The use of turbidimeters in suspended sediment research. Hydrobiologia 1989, 176, 465–480. [Google Scholar] [CrossRef]
- Gippel, C.J. Potential of turbidity monitoring for measuring the transport of suspended solids in streams. Hydrol. Process. 1995, 9, 83–97. [Google Scholar] [CrossRef]
- Panagos, P.; Borrelli, P.; Poesen, J.; Meusburger, K.; Ballabio, C.; Lugato, E.; Montanarella, L.; Alewell, C. Reply to the comment on “The new assessment of soil loss by water erosion in Europe” by Fiener & Auerswald. Environ. Sci. Policy 2016, 57, 143–150. [Google Scholar]

| Study | Model | Location | Spatial/Temporal Resolution | Catchment/Plot Size | Performance | |
|---|---|---|---|---|---|---|
| Discharge | Sediment Yield | |||||
| Kusimi et al. [22] | RUSLE | Ghana | 30 m/annual | 23,188 km2 | - | - |
| Bossa et al. [23] | SWAT | Benin | 90 m, 250 m/daily (continuous) | 6980 km2 | 0.6 ≤ NSE ≤ 0.9 | 0.6 ≤ NSE ≤ 0.64 |
| Obeta and Adewumi [24] | WEPP/EUROSEM | Nigeria | - | 24 m2 | - | - |
| Schmengler [25] | WEPP | Burkina Faso | - | - | - | - |
| Schmengler [25] | WATEM | Burkina Faso | 20 m/annual | 7.9–23.6 km2 | - | - |
| Hiepe [26] | SWAT | Benin | 90 m/daily, weekly (continuous) | 586–2324 km2 | 0.81 ≤ NSE ≤ 0.85 | 0.68 ≤ NSE ≤ 0.7 |
| Visser et al. [27] | EUROSEM | Burkina Faso | - | 1 m2, 20 m2 | 0.7 ≤ R2 ≤ 0.9 | - |
| Karambiri and Ribolzi [28] | KINEROS2 | Burkina Faso | - | 0.014 km2 | - | - |
| Mati and Veihe [29] | USLE | Ghana | - | 900 km2 | - | - |
| Igwe and Mbagwu [30] | SLEMSA | Nigeria | 13 km2 | 17,500 km2 | - | - |
| Roose [31] | USLE | West Africa | - | 100–500 m2 | - | - |
| Study | Location | Spatial/Temporal Resolution | Catchment/Plot Size | Performance | |
|---|---|---|---|---|---|
| Discharge | Sediment Yield | ||||
| Present study | Burkina Faso | 200 m/h (continuous) | 126 km2 | 0.65 ≤ NSE ≤ 0.7 | 0.2 ≤ NSE ≤ 0.4 |
| Ðukic and Radic [14,32] | Serbia | 25 m/h (event) | 114 km2 | 0.8 ≤ R2 ≤ 0.9 | |
| Zhang [33] | Portugal | 2 km/h (event) | 705 km2 | 0.7 ≤ NSE ≤ 0.8 | NSE = 0.56 |
| Mourato et al. [34] | Portugal | -/daily (continuous) | 61–834 km2 | 0.5 ≤ NSE ≤0.7 | - |
| Naseela et al. [35] | India | -/daily (continuous) | 69,425 km2 | 0.8 ≤ R2 ≤0.9 | - |
| Birkinshaw [36] | UK | 50 m/h (continuous) | 1.5 km2 | 0.8 ≤ NSE ≤ 0.9 | - |
| Tripkovic [37] | UK | 10 m,100 m/h (continuous, event) | 0.09 km2, 9.2 km2 | 0.5 ≤ NSE ≤ 0.9 | - |
| Elliott et al. [38] | New Zealand | 20 m/15 min (event) | 1.46–167 km2 | 0.6 ≤ NSE ≤ 0.9 | −2.1 ≥ NSE ≤ 0.8 |
| Bathurst et al. [39] | Middle/South America | 50–500 m/h, daily (continuous) | 0.35–131 km2 | 0.8 ≤ NSE ≤ 0.9 | - |
| Birkinshaw et al. [40] | Chile | 50 m/h (continuous) | 0.35 km2 | 0.8 ≤ NSE ≤ 0.9 | |
| de Figueiredo and Bathurst [41] | Brazil | 5 m–2 km/daily–monthly (continuous) | 100 m2–137 km2 | 0.3 ≤ R² ≤ 0.9 | 0.34 ≤ R2 ≤ 0.98 |
| Adams et al. [42] | New Zealand | 0.5 m/min (event) | 970 m2 | 0.9 | - |
| Norouzi Banis et al. [43] | UK | 20 m/5 min (continuous) | 0.03, 0.05 km2 | - | - |
| Anderton et al. [44] | Spain | 100 m/20 min (continuous) | 0.56 km2, 4.17 km2 | 0.5 ≤ NSE ≤ 0.9 | - |
| Lukey et al. [45] | France | 50 m/daily (continuous) | 0.86 km2 | 0.03 ≤ R² ≤ 0.4 | - |
| Parameter | Station Number | Measured Range | |
|---|---|---|---|
| 2014 | 2015 | ||
| Rainfall (mm/h) | 1 | 0–25 | 0–48.6 |
| 2 | 0–40.4 | 0–51.5 | |
| 3 | 0–60.1 | 0–46 | |
| 4 | 0–42.8 | 0–37.7 | |
| 5 | 0–43.1 | 0–35.2 | |
| Average daily discharge (m3/s) | 0–16.8 | 0–26.2 | |
| Average daily SSC (kg/m3) | 0.01–0.3 | 0.009–0.47 | |
| Average daily SSL (kg/s) | 0.001–1.9 | 0.001–4.7 | |
| Data Set | Resolution/Time Scale | Source | Required Parameters |
|---|---|---|---|
| Topography | 90 m | SRTM [52] | |
| Soil | 1:25 000 | Soil survey | Soil hydrological parameters (α, n 1, Ksat 2, θsat 3, θres 4) texture etc. |
| Land use map | 5 to 250 m | Forkuor [53] | Land use type distribution |
| Land use characteristic | Literature | LAI 5, Strickler coefficient, ETa/ETp ratio 6 | |
| Climate | Hourly, Daily | Instrumentation WASCAL | Rainfall, temperature, humidity, solar radiation, wind speed |
| Discharge | Hourly | Instrumentation WASCAL | Discharge |
| Erosion | Hourly, Event | Instrumentation WASCAL | Suspended sediment load, soil erosion rate |
| Parameter | Description | Unit | Parameter Range | Source |
|---|---|---|---|---|
| Hydrology | ||||
| ETa/ETp at field capacity (varies with land use type) | Ratio of actual evapotranspiration to potential evapotranspiration at field capacity | - | 0.01–1.99 | Shuttleworth [77] |
| KSTR (varies with land use type) | Strickler roughness coefficient | m1/3·s−1 | 0.3–9.9 | Mohamoud [78], Shen and Julien [79] |
| Soil erosion | ||||
| kf (soil invariant) | Overland flow soil erodibility | kg·m−2·s−1 | 2.54 × 10⁻¹¹–4.68 × 10⁻¹⁰ | Calibration |
| kr (varies with texture) | Raindrop soil erodibility coefficient | J−1 | 0.19–7.9 | Adams and Elliott [80], Birkinshaw et al. [40], de Figueiredo and Bathurst [41], Elliott et al. [38], Lukey et al. [45,81], Norouzi Banis et al. [43], Wicks and Bathurst [12] |
| BKB (soil invariant) | Channel bank erodibility coefficient | kg·m−2·s−1 | 1 × 10⁻⁶–3 × 10⁻⁶ | Calibration |
| DLSMAX | Threshold depth of loose sediment | mm | 1 × 10⁻⁶–9.9 × 10⁻⁶ | Calibration |
| Erosion Source | Relative Contribution (%) | Specific Sediment Yield (t/ha/Year) | ||
|---|---|---|---|---|
| 2014 (Min.–Max.) | 2015 | 2014 (Min.–Max.) | 2015 | |
| Catchment | 100 | 100 | 0.056 (0.008–0.081) | 0.08 |
| Hillslope | 32 (11–32) | 27 | 0.018 (0.005–0.022) | 0.023 |
| Cropland | 15 (3–15) | 12 | 0.023 (0.003–0.025) | 0.03 |
| Settlement | 14 (2–14) | 11 | 0.155 (0.015–0.155) | 0.004 |
| Savanna | 2 (2–12) | 3 | 0.002 (0.002–0.016) | 0.181 |
| Water | 1 (0–1) | 1 | 0.14 (0.012–0.14) | 0.196 |
| River | 68 (68–89) | 73 | 0.038 (0.034–0.065) 1 | 0.063 |
© 2017 by the authors. Licensee MDPI, Basel, Switzerland. This article is an open access article distributed under the terms and conditions of the Creative Commons Attribution (CC BY) license ( http://creativecommons.org/licenses/by/4.0/).
Share and Cite
Op de Hipt, F.; Diekkrüger, B.; Steup, G.; Yira, Y.; Hoffmann, T.; Rode, M. Applying SHETRAN in a Tropical West African Catchment (Dano, Burkina Faso)—Calibration, Validation, Uncertainty Assessment. Water 2017, 9, 101. https://doi.org/10.3390/w9020101
Op de Hipt F, Diekkrüger B, Steup G, Yira Y, Hoffmann T, Rode M. Applying SHETRAN in a Tropical West African Catchment (Dano, Burkina Faso)—Calibration, Validation, Uncertainty Assessment. Water. 2017; 9(2):101. https://doi.org/10.3390/w9020101
Chicago/Turabian StyleOp de Hipt, Felix, Bernd Diekkrüger, Gero Steup, Yacouba Yira, Thomas Hoffmann, and Michael Rode. 2017. "Applying SHETRAN in a Tropical West African Catchment (Dano, Burkina Faso)—Calibration, Validation, Uncertainty Assessment" Water 9, no. 2: 101. https://doi.org/10.3390/w9020101
APA StyleOp de Hipt, F., Diekkrüger, B., Steup, G., Yira, Y., Hoffmann, T., & Rode, M. (2017). Applying SHETRAN in a Tropical West African Catchment (Dano, Burkina Faso)—Calibration, Validation, Uncertainty Assessment. Water, 9(2), 101. https://doi.org/10.3390/w9020101


