1. Introduction
The spillway is designed to prevent the overtopping of a dam and provide a diversion channel for the discharging flows. Spillway flow is a benchmark issue in hydraulic dam engineering and has gained considerable attention over the decades. Previous studies heavily focused on the laboratory experiments, field observations and mostly were based on the semi-empirical relationships which constitute the basis of spillway hydraulics. Spillway flows are usually related to the energy dissipations since quite a few hydraulic processes that occur over the spillway, such as the friction along the chute, consume a significant part of the flow energy through flow interactions and turbulences [
1].
In the last two decades, significant progresses have been made in the field of experimental spillway hydraulics. For example, Boes and Hager [
2] carried out a benchmark experimental study in a large flume using the fiber-optical instruments for the onset of skimming flows and they discussed the energy dissipation features of the stepped spillways and the design of training walls. The study aimed to develop a practical design principle that therefore lessens the needs of each individual physical model test. Chanson and Toombes [
3] investigated the turbulent features of a spillway flow in a large-size experimental facility, where the flow was characterized by very energetic turbulence and free-surface aeration. State-of-the-art velocity and turbulence intensity measurements were taken in the study. They also explored the scales of the interfacial aeration and entrained bubble with relation to the entrained particles. In a more recent work, Bung [
4] studied the air-water surface roughness in a self-aerated stepped chute flow and compared with the smooth invert model by using a high-speed camera and ultrasonic sensor. It was found that the surface wave height was lower on the smooth invert chute than on the stepped one, where with a decrease in the step height the entrapped air became more relevant.
The Smoothed Particle Hydrodynamics (SPH) method is a mesh-free numerical modelling approach exclusively using the free-moving particles. Therefore, it is equipped with unique advantages of tracking various free surfaces with large deformation and it provides a very promising technique to study the spillway hydraulics. Since its early application in free surface flows [
5], SPH has been widely used in the coastal hydraulics [
6,
7], fluid-structure interactions [
8,
9,
10], multi-phase flows [
11,
12], dam-break flows [
13,
14,
15], porous flows [
16,
17,
18], and river ice dynamics [
19,
20,
21]. It was found that the SPH method meets with some limitations for the flow with high Reynolds numbers in dam break application but there is no information available on the threshold Re value. By using an appropriate turbulence model, it is expected that SPH should be able to provide reasonably accurate results in such a field. In comparison, the SPH applications in hydraulic engineering, such as spillway flow, are generally under-reported and the reasons could be attributed to the unaffordable computational expenses arising from the domain size and simulation time. Besides, it is much more challenging to develop a two-phase SPH model that could accurately address the water-air interactions commonly found in the spillway flow. Different from the coastal wave breaking or dam-break in which the flow behaviour is transient, the hydraulic simulations involving the open channel or weir flows require gradual establishment of the stable flow conditions, which adds additional challenges to the particle nature of the SPH.
The pioneering study of mesh-free numerical modelling on the hydraulics could be attributed to Gotoh et al. [
22], who used the Moving Particle Semi-implicit (MPS) method to compute a turbulent jet. Although the model was not quantitatively validated by the experimental data, the proposed sub-particle scale (SPS) turbulence model and the soluble inflow wall boundary laid a milestone foundation for the numerous follow-on works in SPH turbulence [
23,
24] and SPH open channel flows [
25,
26]. Another category of SPH models commonly used in the flooding hydraulics is based on the solution of Shallow Water Equations (SWEs), i.e., SWE-SPH, which solves the nonlinear SWEs by using the SPH interpolation principles and benchmark works in this field were documented by [
27,
28].
The SPH simulations in spillway hydraulics, although being under-reported as compared with its popularity in other application fields, are gaining increasing attention due to their robustness in providing the accurate free surface variations and associated velocity and pressure information inside the complex flows. The modelling results could provide invaluable flow and spillway parameters to the engineering design practice. For example, Chem and Syamsuri [
29] studied a hydraulic jump over the complex beds by using SPH and they also discussed the energy dissipations between the corrugated and smooth bed. Jonsson et al. [
30] used the SPH to study hydraulic jumps in a rectangular channel for a wide range of Froude numbers with an improved periodical open boundary, in which they found that the jump toes oscillated with a frequency in good agreement with the experimental findings and the oscillation amplitudes increased with the Froude number. Husain et al. [
31] used the 2D open source code SPHysics to investigate the pressure variations in the non-aerated flow region of a stepped spillway under skimming flow condition. Their simulations clearly disclosed the positive and negative pressure distributions on different parts of the vertical step face. In contrast, the present work quantifies the accuracy of pressure calculations by using the measured laboratory data and also the practical energy dissipation issues are explored. For more practical SPH applications, Lee et al. [
32] used a parallel WCSPH code for 3D spillway flows for a site dam of Goulours Valley in Ariége, Midi-Pyrénées (France). Although the validations were only carried out at a qualitative level and the spillway surface was assumed to be smooth, the initiatives showed that SPH can handle the real-life scenarios. Their SPH simulations used about 1 M particles for a 16-s physical time and this cost 5 days of CPU time with 1024 processors on BlueGene/L. Saunders et al. [
33] also applied the 3D SPH to a physical model experiment constructed from the Pala Tiloth dam, which was designed for flood control and reservoir management. For the highest particle resolution used, the simulations took 28 days to reach the steady state when running in parallel using a dual Xeon 8-core E5-2650 machine (PassMark Software, Surry Hills, Australia), while 17 h was needed for the three-time lower particle resolution. In their study, the water surface variations within the reservoir area close to the spillway were compared with both the experimental data and SPH results and the spillway surface was assumed to be smooth without any step configurations.
In this paper, we use the 2D parallelSPHysics code (
http://www.sphysics.org) for a laboratory spillway experiment carried out at Qinghai University, China. The physical model was built from a 1:40 ratio of the prototype engineering project, i.e., Dahua Hydraulic Dam located on Lara River of Qinghai Province. The reservoir has a catchment area of 83 km
2 and storage capacity of 426 million m
3. It mainly serves the domestic water supply and agricultural irrigation for the downstream regions and the total project cost nearly 0.2 billion CNY. We plan to use the parallelSPH model to investigate the water surface, and velocity and pressure variations over the stepped spillway aiming to achieve the following purposes: (i) to show how SPH could be used as a practical engineering tool in real industry; (ii) to provide energy dissipation indicators for the different spillway geometries. One distinct feature of the present work is the use of mesh-free numerical model in the spillway hydraulics. This study field has been extensively explored by the pioneering researchers such as Chanson [
34,
35] due to its practical engineering interest. The paper is structured as follows.
Section 2 presents a brief review of the SPH fundamentals and parallelSPHysics [
36].
Section 3 presents the engineering background of Dahua Hydraulic Dam and the designs of spillway experiment.
Section 4 is dedicated to the validation of the numerical model by using a documented benchmark spillway skimming flow.
Section 5 is the SPH modelling of our laboratory experiment with detailed discussions on the simulation results. Finally,
Section 6 concludes the whole work.
3. Engineering Background and Laboratory Experiment
Dahua Reservoir is located along the Lara River of Qinghai Province, China and it is 69 km away from the provincial capital Xining city. The reservoir has a total storage capacity of 4.26 million m
3 with a flood storage of 0.53 million m
3. The reservoir operates at a normal water level of
3138.8 m and a designed flood level of
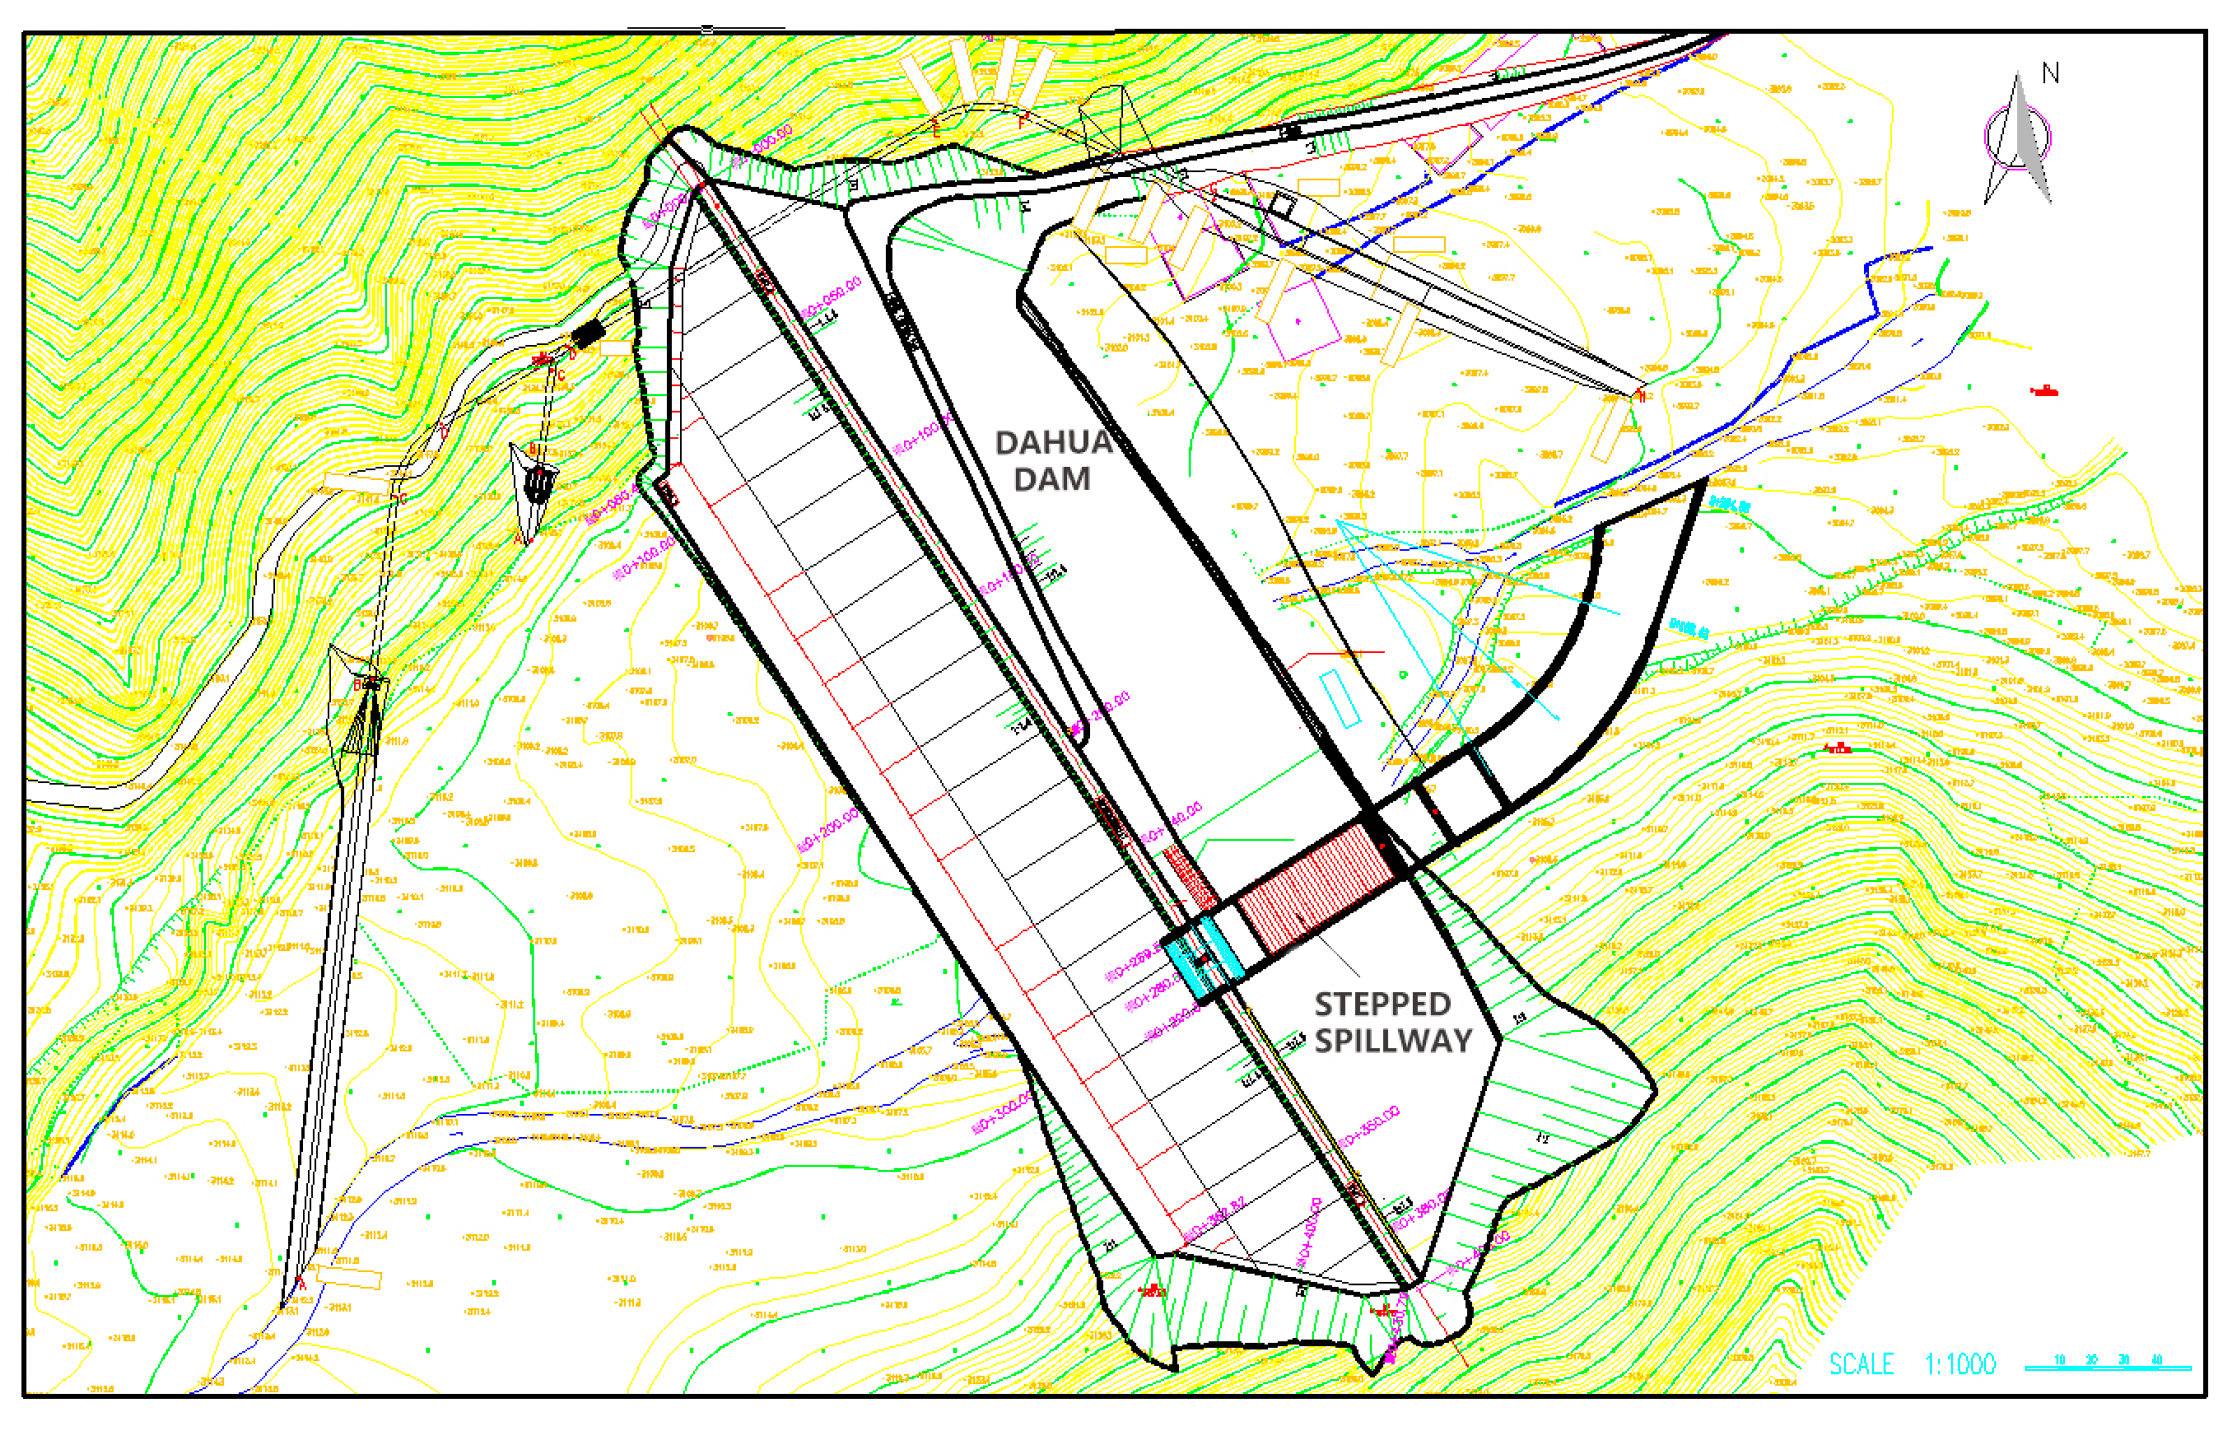
3141.0 m, respectively. To discharge the redundant flood water during the rainy seasons, stepped spillways are used on the downstream side of the dam to dissipate flow energy. In order to fully evaluate the complex flow conditions over the step surface as well as to provide useful information for design purposes, a thorough understanding of the spillway hydraulics is required. For such a purpose, a physical laboratory model is thus built. A schematic layout of prototype Dahua Dam and location of the spillway is shown in
Figure 1. As shown in the figure, the spillway includes the flow entrance, discharge flume, energy dissipater and outflow channel, with a total length of 216.97 m. The crest elevation of the weir is the same as that of the hydraulic dam at
3138.8 m. The spillway takes an ogee shape which has a smoothed streamlined connection with the main dam. The designed flood discharge of the spillway is 48.43 m
3. This is equivalent to a flood recurrence of 50 years. The effective breadth of the spillway is 21 m and the operating water head above the weir crest is 2.2 m. On the safety side, our study considers a 1000-year recurrence flood with a flow discharge of 120.21 m
3/s.
A physical laboratory experiment is carried out at School of Water Resources and Electric Power, Qinghai University, to study the spillway flow characteristics, and meanwhile, provide useful data to validate the numerical SPH model. The length dimension ratio of model to prototype dams is selected to be 1/40 to satisfy the similarity laws of gravity also by considering the lab space restrictions and capacity of the water supply facilities. An experimental site photo is shown in
Figure 2a,b for a global view of the facility and enlarged view of the spillway with pressure measurement, respectively.
The experimental spillway flows follow a 1000-year recurrence of prototype flood as mentioned before. By using the length ratio of 40, this corresponds to an equivalence of experimental flow rate of 0.01188 m3/s. A kinematic similarity law, i.e., Froude together with Manning’s similarity, has been observed. The water head above the model weir in the experiment is 5.5 cm. The model spillway has a breadth of 0.525 m and the total length is 159.83 cm with an averaged bed slope angle of 33.69°. Different sizes of the spillway steps are used in the experiment, leading to the number of steps at 31, 45 and 62, respectively. The dimension of the steps is provided by their width a multiplied with height h, as 4.5 cm × 3.0 cm, 3.1 cm × 2.07 cm and 2.25 cm × 1.5 cm, for the above different step numbers. All types of the flow are observed in the range of skimming flows.
In the laboratory measurement, detailed flow depth, velocity and pressure profiles along the spillway steps have been recorded for validation purposes. The flow depth was measured by a depth ruler and the velocity was measured by a portable LS300-velocimetry (Motorola Solutions, Chicago, IL, USA) with a range of 0.01–4.0 m/s. All the measurements were taken after several minutes when the water level in the reservoir became stable. The flow depth and velocity were recorded at the centerline of the spillway as well as two other points near the lateral wall at a distance of 5 cm. These are located along the spillway at a number of locations, and the velocity was recorded at a distance of 8 mm from the step corner in the normal direction to the pseudo bottom (as shown in Figure 9a). The flow depth and velocity data were sampled for 20–30 s and then time-averaged to eliminate the fluctuations (the depth data were read 3–4 times during this period to take the average). With regard to the pressure measurement, the standard manometers as shown in
Figure 2b were used to record the pressures at the centerline of the spillway, on both the horizontal and vertical step faces.
4. Model Validations through Benchmark Spillway Flow
For the SPH simulation of spillway flow with an open free surface, an accurate treatment of the inflow and outflow boundary is of great importance. Some useful techniques such as the periodic boundary model [
32] are not applicable to the situation where the flow depth is different on the upstream and downstream side, while a more advanced real inflow model [
26] could have complex programming. Some researchers adopted a large water tank approach [
31] so the domain is large enough and the outflow process is not significantly constrained by the storage of water, but this could cause excessive CPU load. In this work, we propose a simple but effective push-paddle approach to realize an accurate inflow process.
The model is based on the principle that a vertical solid paddle is placed on the upstream boundary with a constant horizontal moving speed. By giving a prescribed unilateral motion to the paddle, an inflow process can be generated. As long as the speed of the paddle is carefully set to match the desired discharge, a continuous and stable inflow can be achieved. The feasibility of using such a push-paddle approach has been demonstrated in a validation work carried out for the weir flow in [
40]. Here we use this inflow technique to reproduce the numerical simulation of [
31] and experimental study [
41] by using the open source code parallelSPHysics.
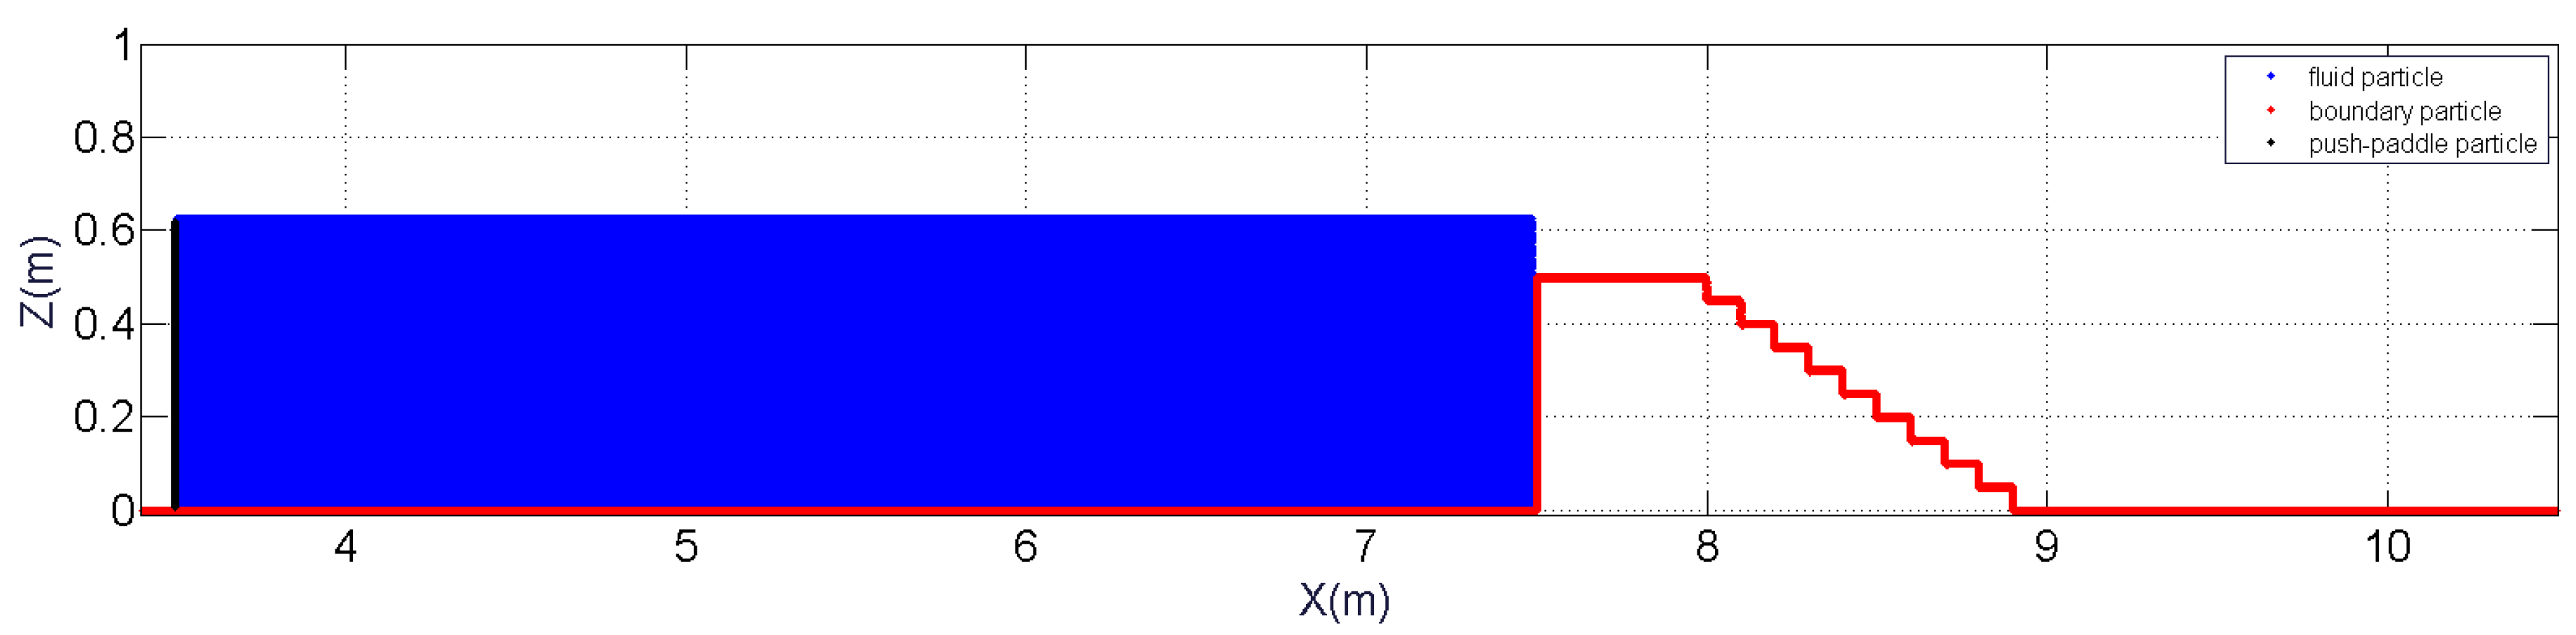
Meireles and Matos [
41] conducted experimental studies on a stepped spillway that was 0.5 m high with 1V:2H slope. The base weir is broad-crested with a length of 0.5 m. It has 10 steps, each with 0.05 m in height and 0.1 m in width. Husain et al. [
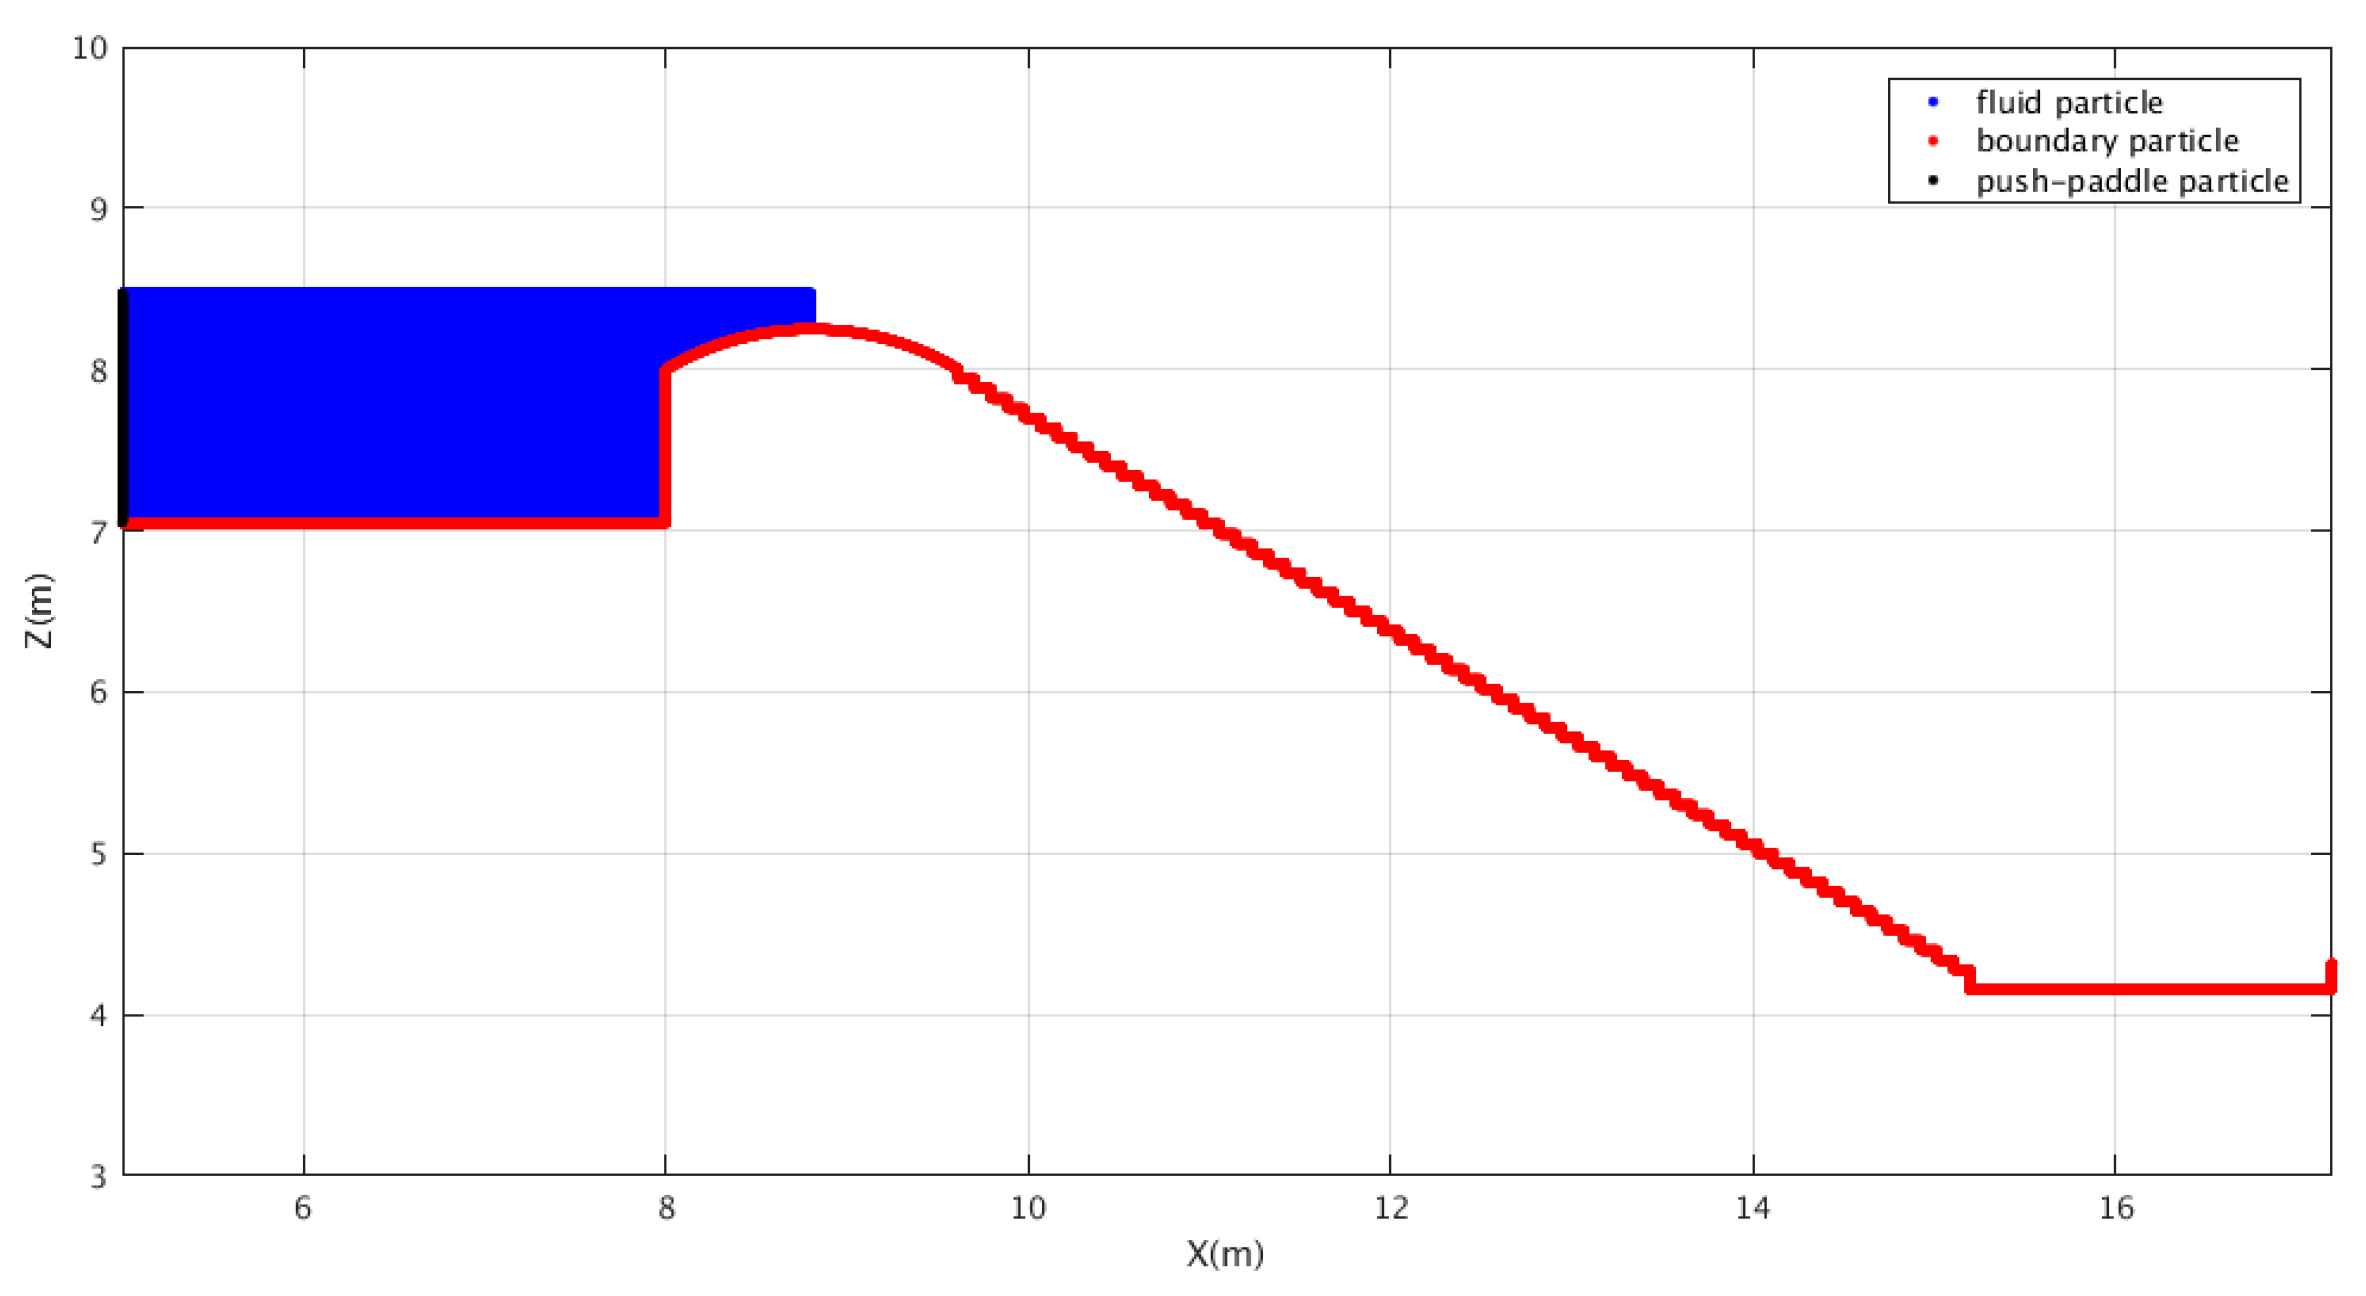
31] first reproduced this experiment by using a series version of SPHysics open source code. In their numerical model, a large water tank that was 7.5 m long was used in front of the weir to achieve a stable inflow process throughout the simulation time of interest. Due to the use of proposed push-paddle inflow model, the present computational domain can be efficiently reduced. A schematic setup of the computational domain is shown in
Figure 3. As shown in the figure, the upstream water area is filled with the fluid particles only between
x = 3.5 m and 7.0 m with a vertical solid paddle being located at
x = 3.5 m. This leads to a significant reduction of the particle numbers by four times assuming the same particle resolution with [
31]. In the present parallelSPHysics simulations, a particle spacing
dx = 0.004 m is used. This leads to roughly a total number of 162,098 particles in the computational domain. Detailed sensitivity study on the particle resolution has been discussed by Husain et al. [
31] and therefore their recommended value is simply used in the present computation. The whole simulation time of spillway flow is 12 s. The computational time step was initially chosen to be 10
−5 s and then dynamically adjusted in the computations to fulfill the CFL condition. The program is run on a 16-core computer cluster (CPU 2 GHz and RAM 32 Gb) (School of Water Resources and Electric Power, Qinghai University, China) and it cost approximately four days of CPU time.
In the SPH study of [
31], the flow depths, velocity profiles and coordinates of the inception point on the steps located in the non-aerated flow regions are examined for a wide range of critical depth within the skimming flow condition.
hc is the critical flow depth on the critical section over the weir crest where the Froude number equals one. In the current parallelSPHysics simulations, the test condition of
hc = 0.07935 m, 0.0716 m and 0.0635 m as shown in
Table 1 in [
31] is used. Based on the simulation results,
Table 1 presents the experimental [
31,
41] and parallelSPHysics values of the discharge per unit width (
q) for the different critical flow depths (
hc) over the weir crest. It seems a good agreement has been reached.
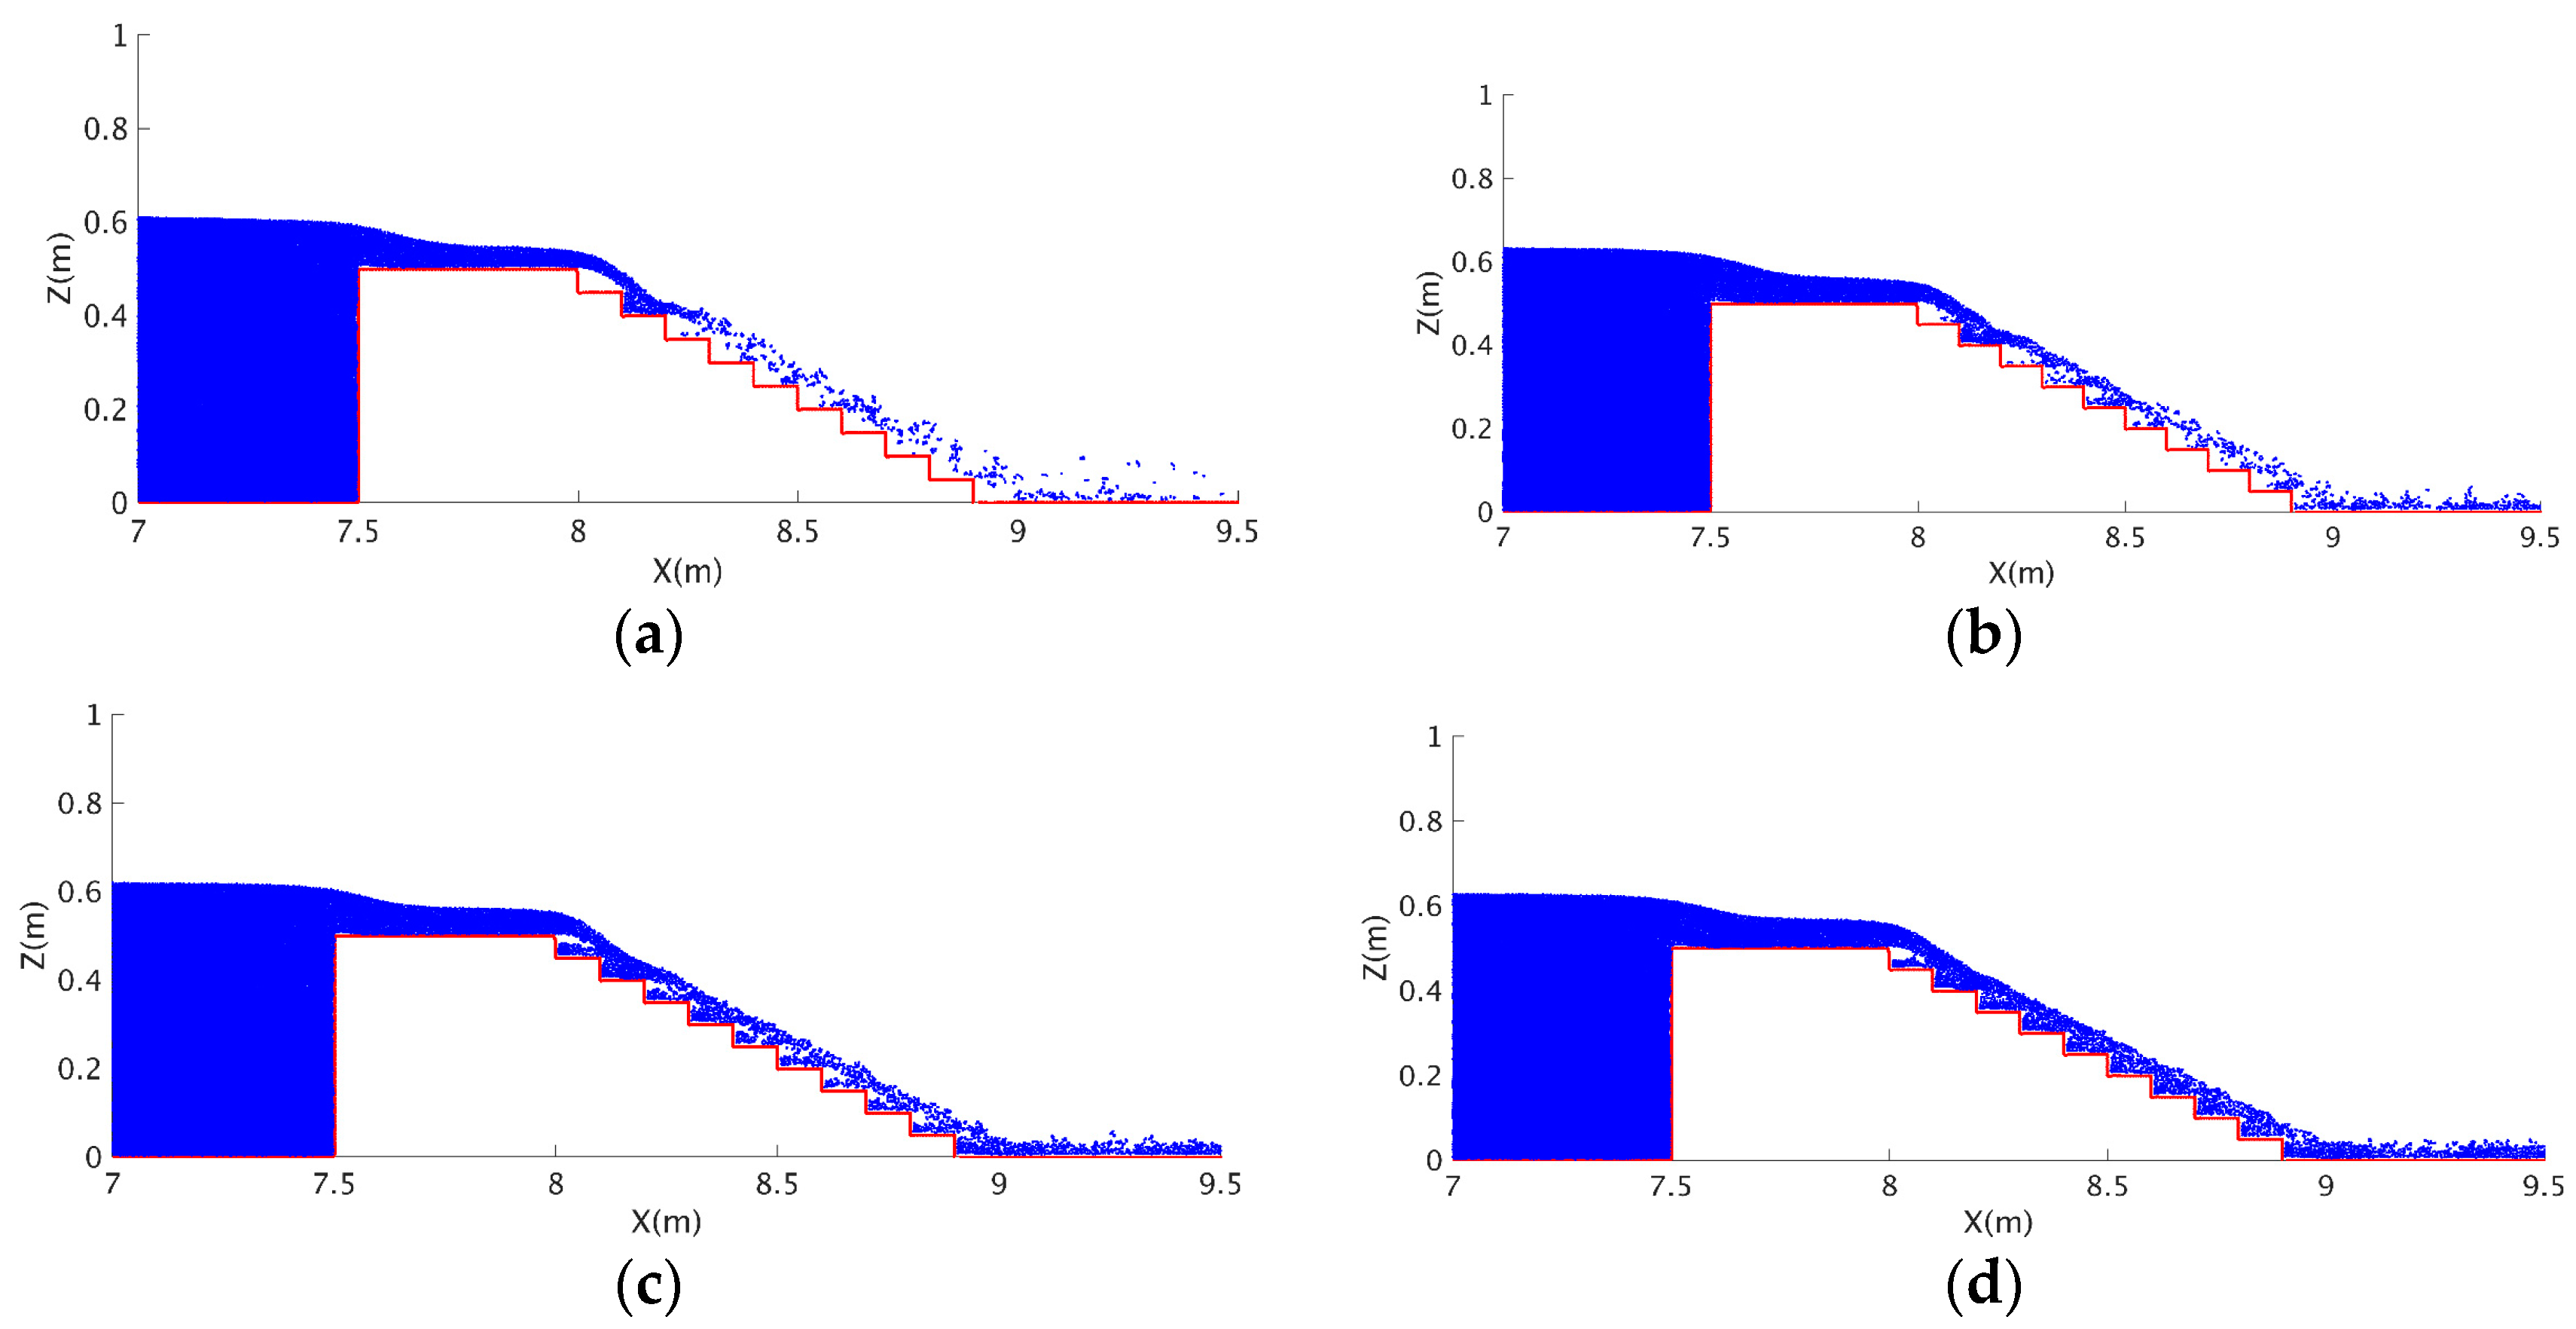
For the case of critical depth
hc = 0.0716 m, the computed particle snapshots over the stepped spillway are shown in
Figure 4a–d, for the different time instants. It shows that under such a skimming flow condition, the flow passes over the weir crest like a jet and hits the horizontal face of all the downstream steps. One major part of the flow coherently skims over the pseudo bottom formed by the step outer edges. Another minor part is entrapped in the recirculation zone under the main stream and inside the step cavity delimited by the step faces. In this area there exists an extensive exchange with the main flows and the water particles move around a triangular path. These simulation patterns are very similar to those observed in [
31]. However, as the computations proceed to a relatively longer time at
t = 12 s as shown in
Figure 4d, the boundary of two different flows becomes unclear.
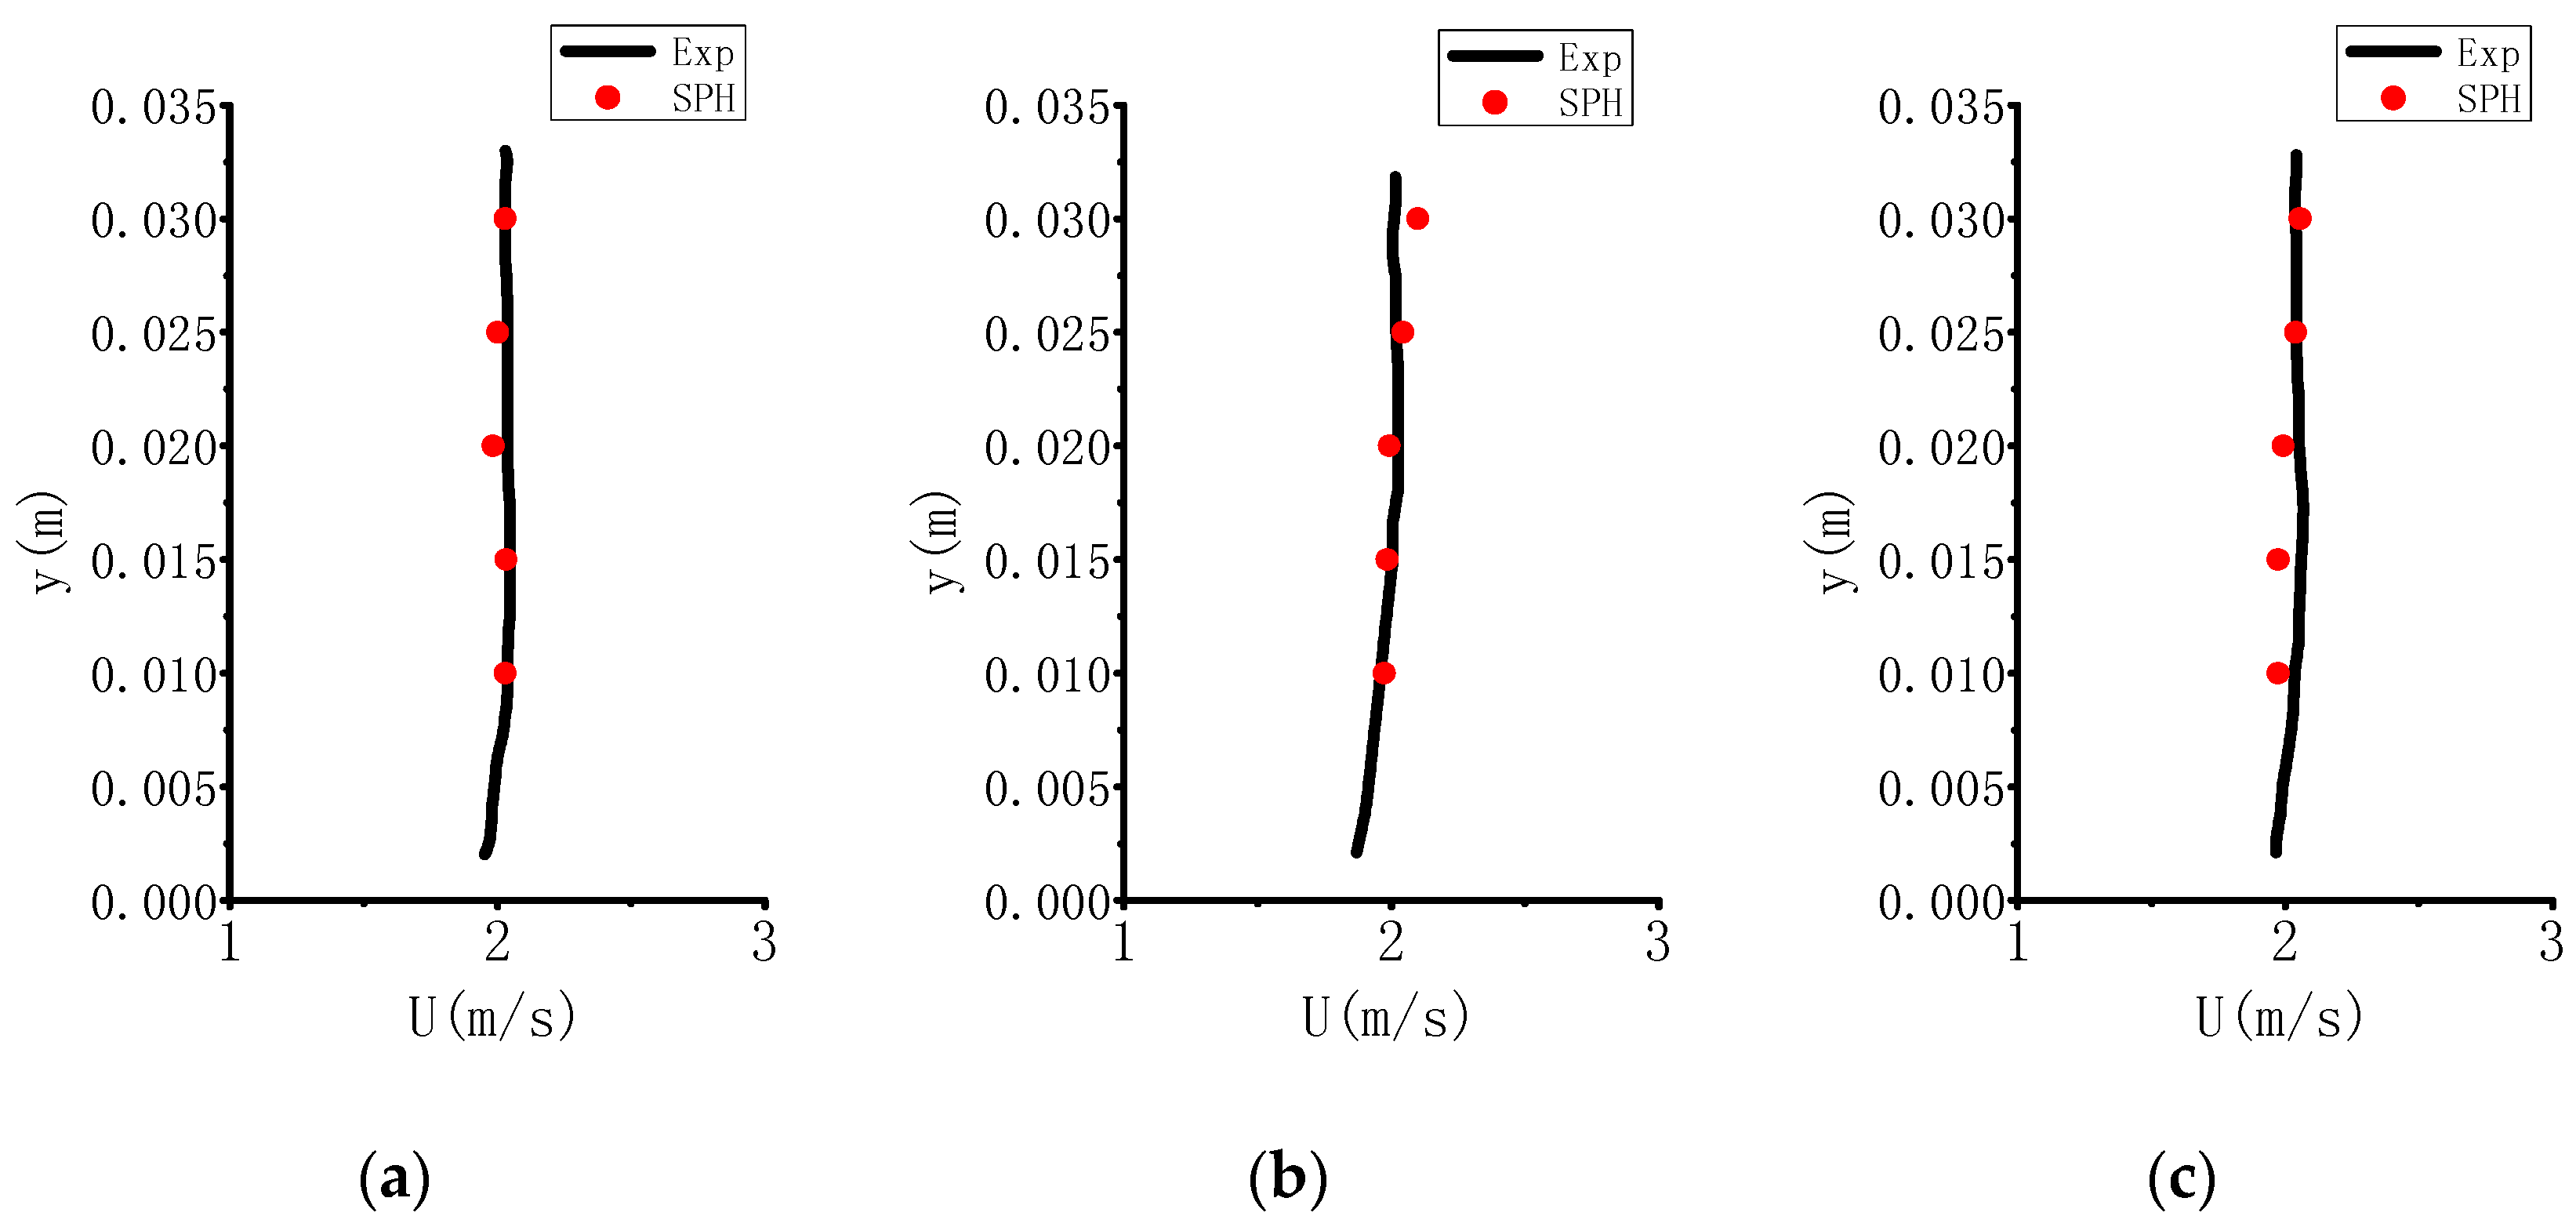
In their experiment, Meireles and Matos [
41] also measured the streamwise flow velocity parallel to the chute slope at different sections under various flow discharges. To quantify the accuracy of parallelSPHysics as well as the proposed push-paddle inflow model,
Figure 5a–c shows the numerical and experimental velocity profiles at section
x = 8.1 m, which is downstream of the weir, for the three different critical flow depths
hc as shown in
Table 1. The details of velocity measurement and the instruments used could be found in the original work of [
41]. As seen from the figure, in spite of some slight deviations between the numerical and experimental velocities, the general agreement between the two is quite satisfactory. It is shown that the velocity values do not change too much along the flow depth. According to [
31,
41], this is the region close to the weir crest, where the velocity is relatively low and also nearly constant over the entire flow depth due to the fact that the thickness of boundary layer is quite small. However, as the flow velocity increases towards the downstream of the spillway, the boundary layer will fully develop and then it would be expected to have a more varied velocity profile such as that follows the power law.
5. Model Applications through Experimental Spillway Flow
In this section, the parallelSPHysics model is used to reproduce the previous laboratory experiment of prototype Dahua Hydraulic Dam spillway project. As mentioned before, the experiment was carried out by a 1:40 ratio model. In the numerical simulations, it was very difficult to reproduce the experimental conditions due to the very shallow water head above the spillway weir crest. Therefore, a relatively larger numerical model, which is based on a similarity ratio of 1:10 between the model and prototype spillways, is built. For a better interpretation of the SPH simulation results, the numerical and experimental values are both converted to the prototype ones for their comparisons.
5.1. Computational Settings
Three different spillway conditions, represented by the step numbers as shown in
Section 3, are simulated, i.e., the step number being 62, 45 and 31. These values have been proposed from the feasibility study of the real spillway design. A schematic diagram of the computational domain is shown in
Figure 6. It includes an upstream water tank, a push-paddle for inflow generation, an ogee weir connected with the stepped spillways and a downstream energy dissipation tank. An inflow discharge per unit width of 0.181 m
2/s is generated, and the water head above the weir crest is 0.22 m. The stepped spillway is 6.4 m long. The water head looks relatively large compared to the length of the spillway, since a more safety design was considered in the study based on a 1000-year recurrence of prototype flood as mentioned in
Section 3.
In SPH simulations, a particle spacing of
dx = 0.004 m is used and this leads to a total number of nearly 300,000 particles. The initial time step was chosen as 10
−5 s and later automatically changed in the computation following the CFL condition. The simulation time was 20 s and it cost roughly 20–26 days CPU time for the different step numbers on the same computer cluster (but with 48-core) as used in the model validation test in
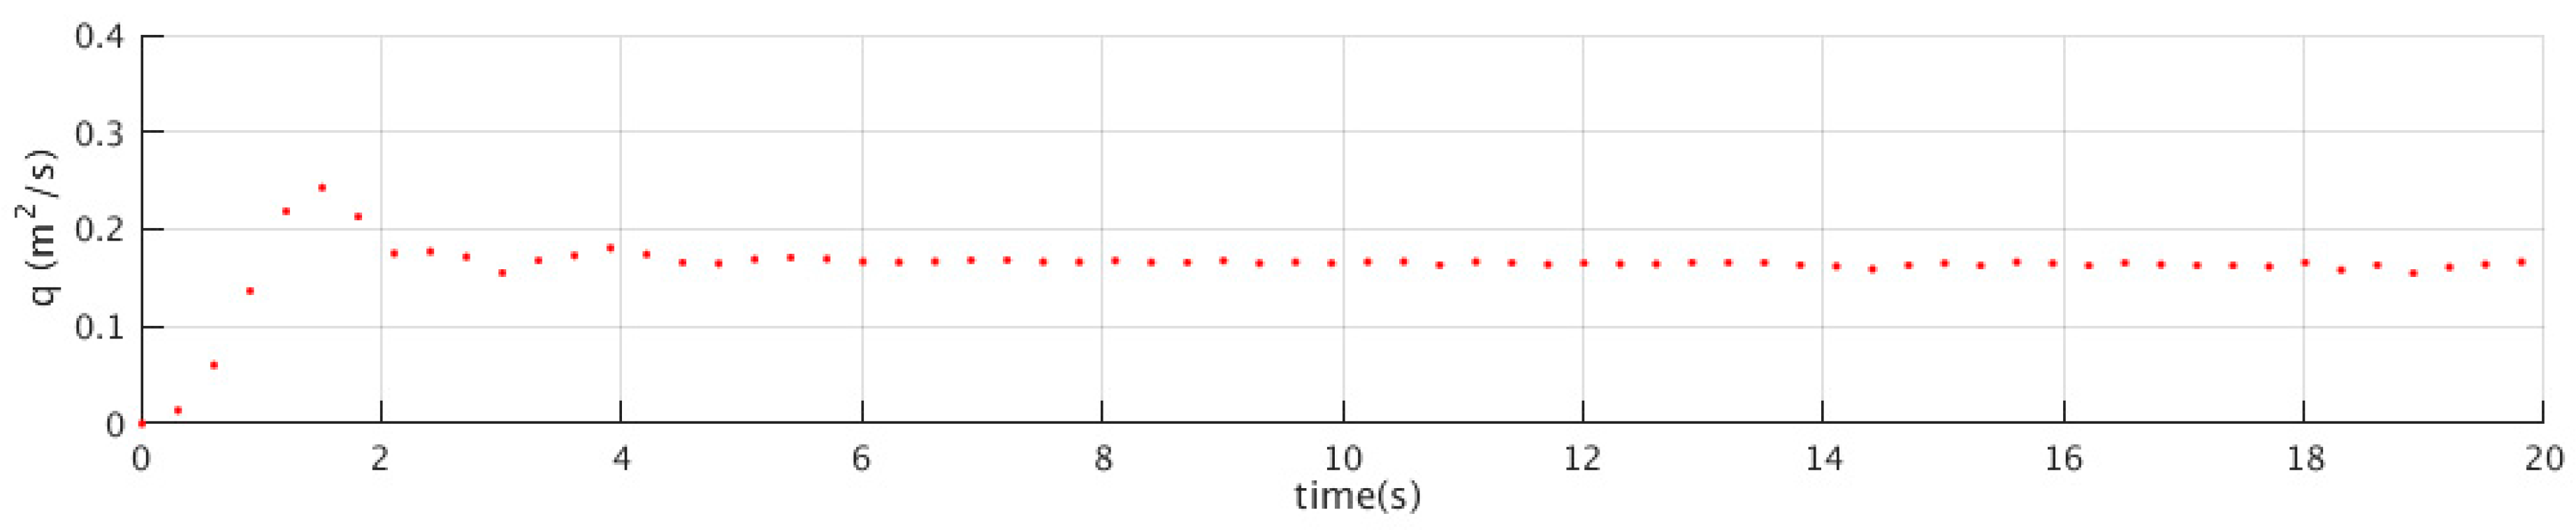
Section 4. To show the stability of inflow generations,
Figure 7 shows the time-dependent discharge hydrograph for the case of 62-step spillway. The gauging point is located just upstream of the weir entrance at
x = 7.9 m. It shows the increasing flow discharge following the forward motion of the push-paddle. After some very slight oscillations, the flow discharge stabilizes at time
t = 8 s.
5.2. Flow Patterns over Stepped Spillways
According to the SPH simulation results, the time history of particle snapshots are shown in
Figure 8a–d, at different time instants based on the 62-step spillway. It shows the importance of steps in dissipating the flow energy and thus reducing the need of a large basin at the end of the spillway. The steps can increase the surface roughness of flow path and then accelerate the growth of turbulent boundary layer. This facilitates the initiation of self-aeration in reality that could protect the spillway surface free of cavitation damage [
31,
41].
Figure 8 shows a typical skimming flow pattern over the stepped spillways. The water surface initially contracts somewhat at the start of the spillway path due to the sudden acceleration from the gravity. Then it gradually rises up towards downstream due to the frictional influence of the steps and the accumulation of incoming flows. With the development of boundary layer, the gravitational force balances the boundary drag. Then the flow reaches quasi-stable state with little variations in the flow depth. Eventually the skimming flow over the spillway resembles a classic open channel uniform flow. At the end of the stepped spillway, the flow plunges into the tailing pool for energy dissipation, when a large scale hydraulic jump is observed. The violent flow interaction as demonstrated by the breaking free surface is expected to dissipate remaining flow energy. Large scale flow circulation is also found in the region enclosed by the step and bottom floor upstream of the hydraulic jump.
Besides, in
Figure 8a–d,
t = 2 s corresponds to the onset of the overflow, while times
t = 8, 12 and 15 s almost indicate a stable flow state in which the flow discharge and water head in front of the spillway remain more or less unchanged. The existence of consistent cavity flow patterns over the spillway steps could be clearly found in the zoomed portions of the figure. However, these cavity flows demonstrate somewhat variations in the time and space due to the influence of flow turbulence that is highly unstable.
5.3. Model Validation of Pressure on Spillway Ftep faces
A good knowledge of the pressure features on the step faces of a spillway helps to understand the spillway hydraulics and improve the structure reliability. The cavitation formation and evolution in the non-aerated flow region under the skimming flow condition is closely related to the pressure variations when they are below the atmospheric level. Husain et al. [
31] investigated the pressure flow field on the horizontal and vertical faces of the steps by using a series version of SPHysics for the experiment of [
41], but there was a lack of pressure data for the model validation. Besides, Husain et al. [
31] also suggested that no detailed information may have been available in the literature relating to the pressure measurement in the non-aerated flow region over moderate slope stepped spillways under the skimming flow condition. To address such a practical issue in the spillway hydraulics, this section provides quantitative pressure measurement on the horizontal and vertical faces of the steps from our laboratory experiment. In addition, the parallelSPHysics simulation results are compared and validated by the measured data.
In the numerical simulations, both the velocity and pressure values of spillway flows were extracted. The pressure was solved from the momentum Equation (2) so it is a total pressure including both the hydrostatic and dynamic components. The velocity sampling point is located along the spillway at a number of locations at a distance of 0.008 m from the step corner in the normal direction to the pseudo bottom, as shown in
Figure 9a. The pressure sampling point is shown in
Figure 9b, for the 31-step spillway case. The scales presented here correspond to the experimental dimensions. Both the velocity and pressure values proposed hereafter are the weight average of neighboring SPH particles within the kernel support range for a true representation of the flow field.
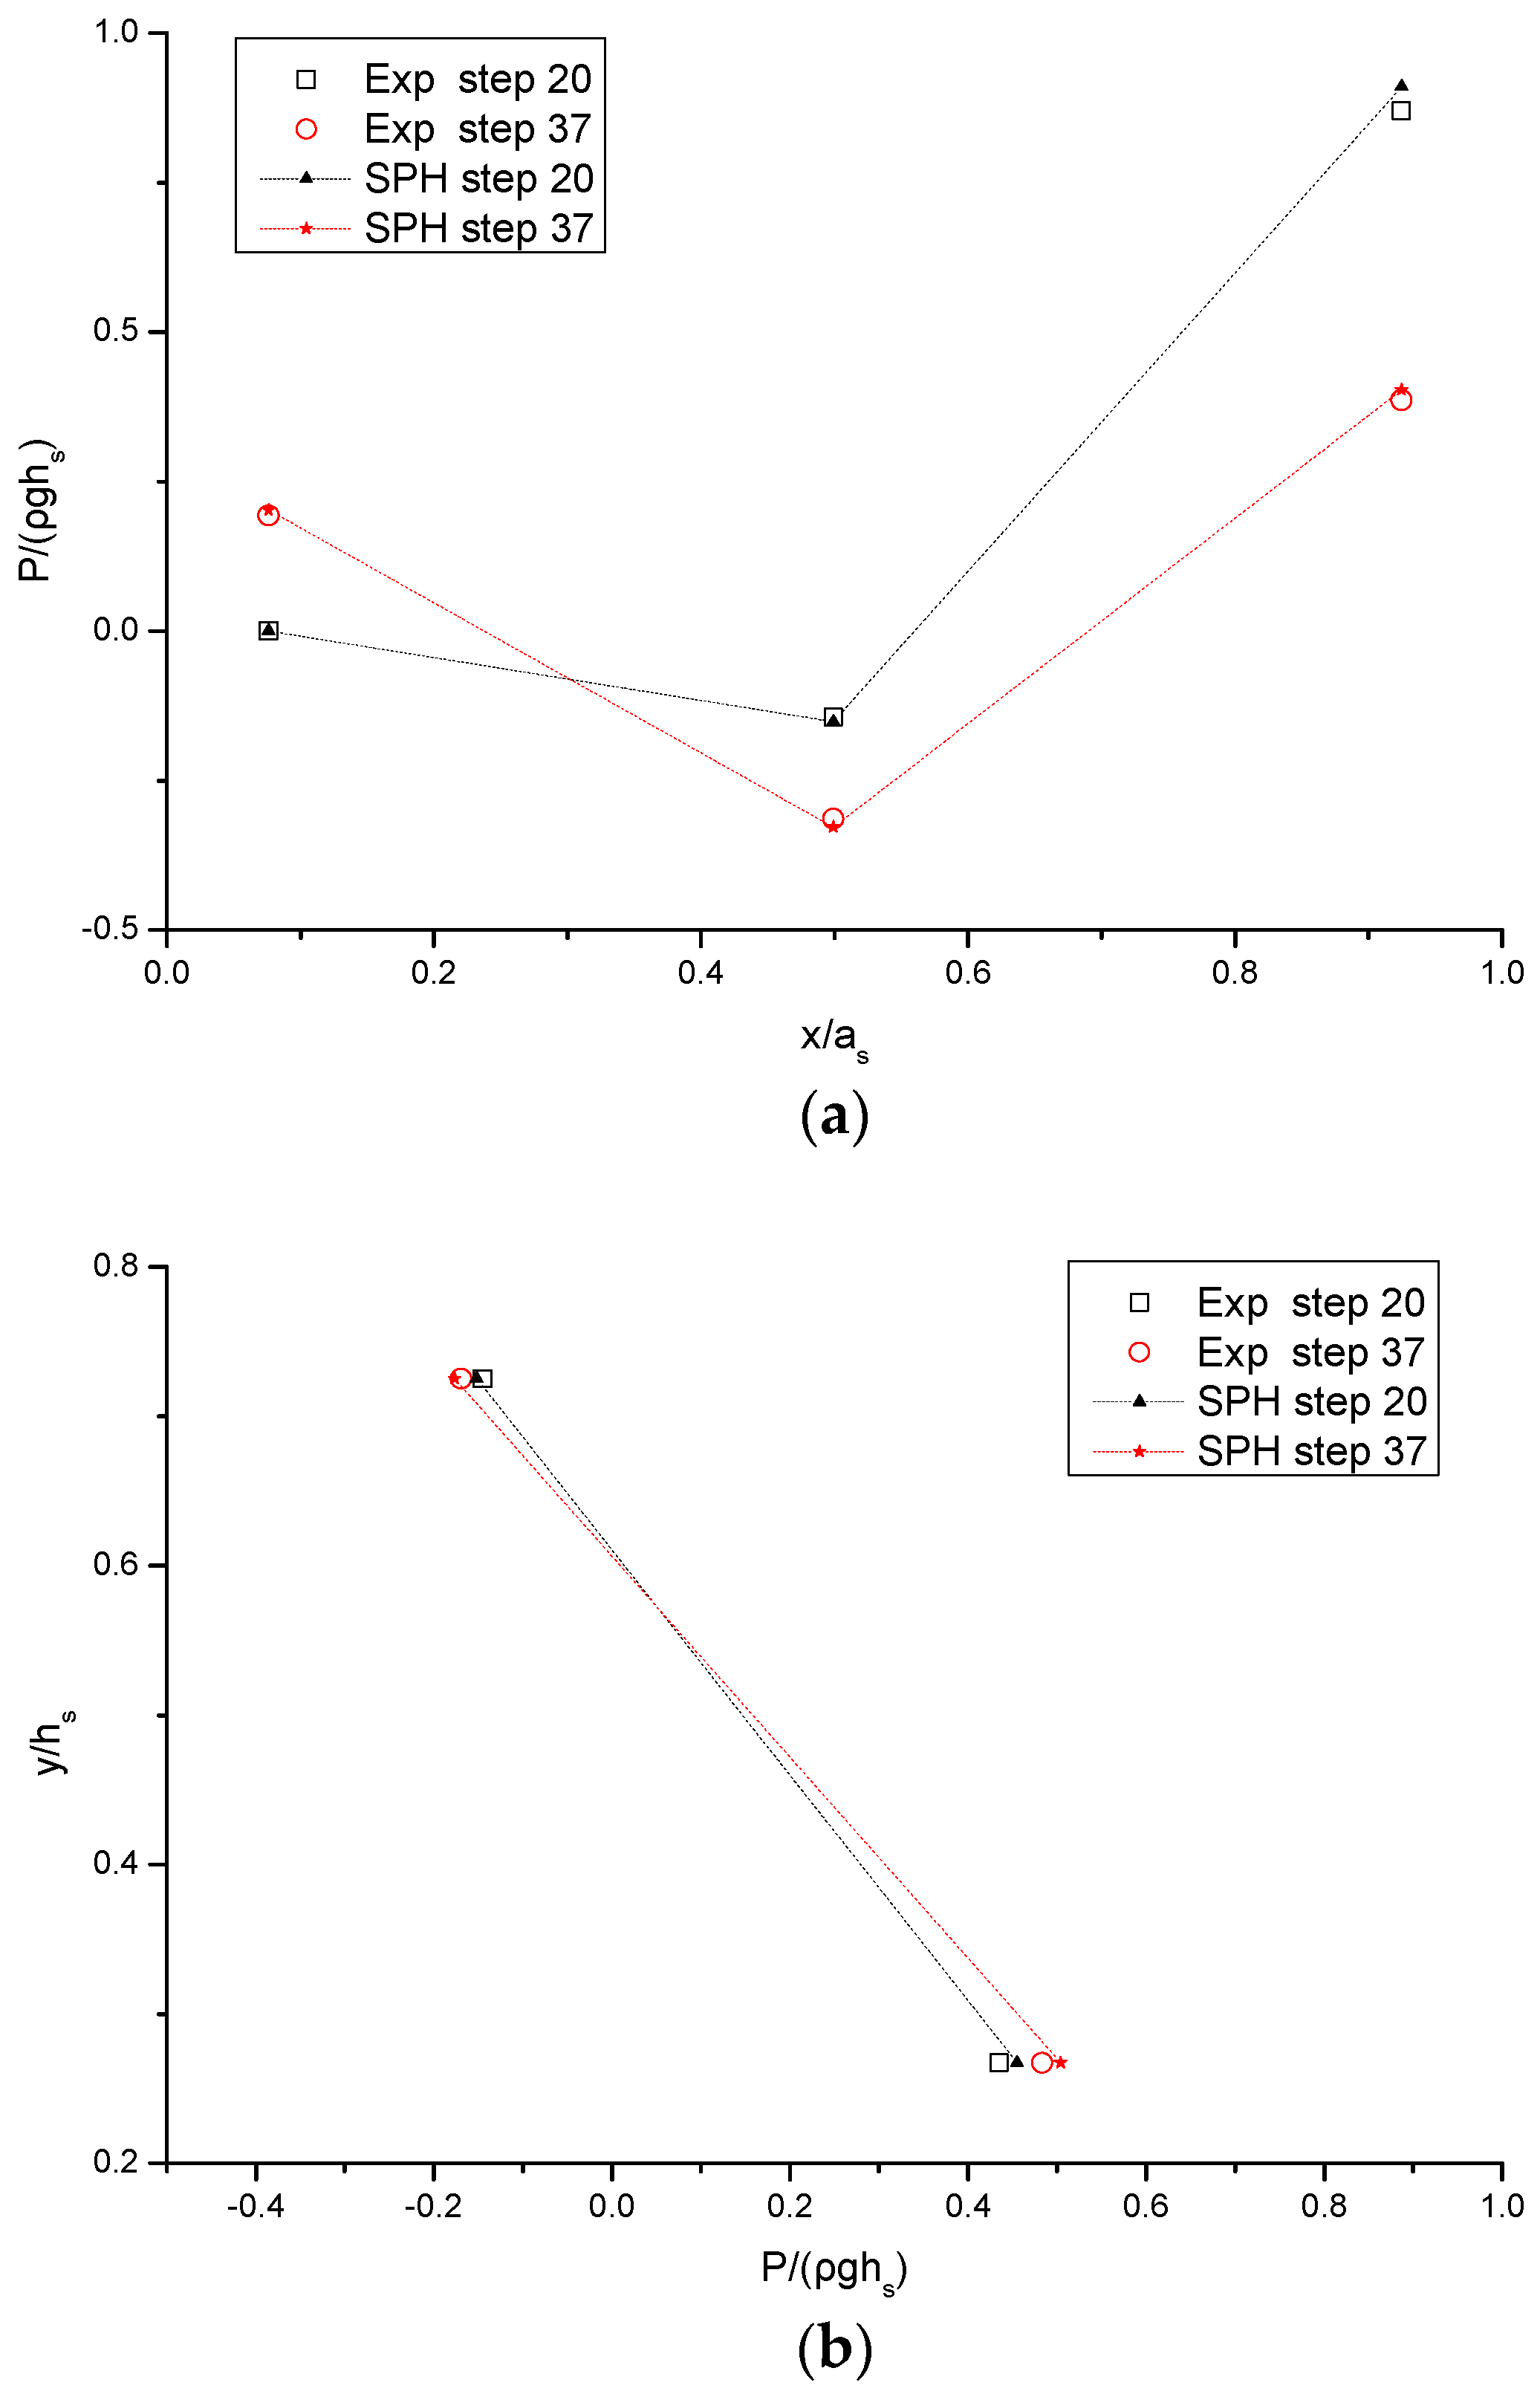
Figure 10 and
Figure 11a,b show the pressure distributions on the horizontal and vertical step faces of the spillway, respectively, at two different stream-wise step locations, for the 31 and 45 step number cases. The results are presented for both the SPH simulations and experimental data converted to the prototype values. It should be noted that only two measurement points are available for the pressure profile on the vertical face of 45-step spillway, as shown in
Figure 11b, while three measuring points are available in other conditions. First a quite satisfactory agreement has been found at all of these locations. An error analysis showed that the normalized average errors between the numerical and experimental results are 0.8–4.3% in the horizontal pressures and 0.7–4.7% in the vertical pressures. Besides, a consistent trend of the curves is shown in the two pressure profiles either on the horizontal or on the vertical faces. However, there exist some kinds of differences in their magnitudes, which could be attributed to the unsteadiness of the vortices formed inside the step cavities according to the study in [
31].
By examining these pressure profiles, it is shown that all of those on the horizontal face of the steps demonstrate a half S-shape. The pressure on the horizontal boundary points is positive with a peak value, and then gradually decreases towards the step corner with a minimum value. According to [
31], the positive pressure can be attributed to the reverse flow inside the cavity, while the peak pressure value occurs when the main stream hits the horizontal step face. This pattern of the pressure on the horizontal step surface is very close to that observed by Husain et al. [
31] in their SPH results with no data validations. As for the pressure profiles along the vertical step faces, they demonstrate more variations. Generally, it is shown that the negative pressure area appears on the upper part of the step face, while the positive pressure occurs on the lower part of the step face and reaches its peak value at the step corner. Following [
31,
41], the negative pressure arises from the combinations of high flow velocities close to the step outer edge and the stepped surface. On the other hand, the positive pressure is due to the formation of small eddies caused by the reverse flows inside the step cavity.
For a more robust validation of the SPH computations, the experimental data of Amador et al. [
42] were added to
Figure 10a,b on the horizontal and vertical faces at different
L/ks values, where
L and
ks are the distance from the spillway crest to the outer step edge and characteristic roughness height, respectively. There is a good trend of the data consistency between the two results, but some obvious discrepancies do exist in the pressure values due to the difference in the flow/step condition and data sampling point used in the two studies. Nonetheless, the potentials of pressure prediction by the SPH model on the step faces can be well demonstrated.
5.4. Analysis of Energy Dissipation Efficiency of Spillway with Different Geometries
One significant practical value of the stepped spillways is their highly efficient flow energy dissipation capacities. This could prevent the downstream channel from severe erosion and stabilize the main flow stream in the river management. Severe erosions at the downstream channel may harm the stability of the hydraulic structures as documented by Dodaro et al. [
43,
44]. More practical issues on the stepped spillway design and energy dissipation have been thoroughly studied in the benchmark of [
45,
46,
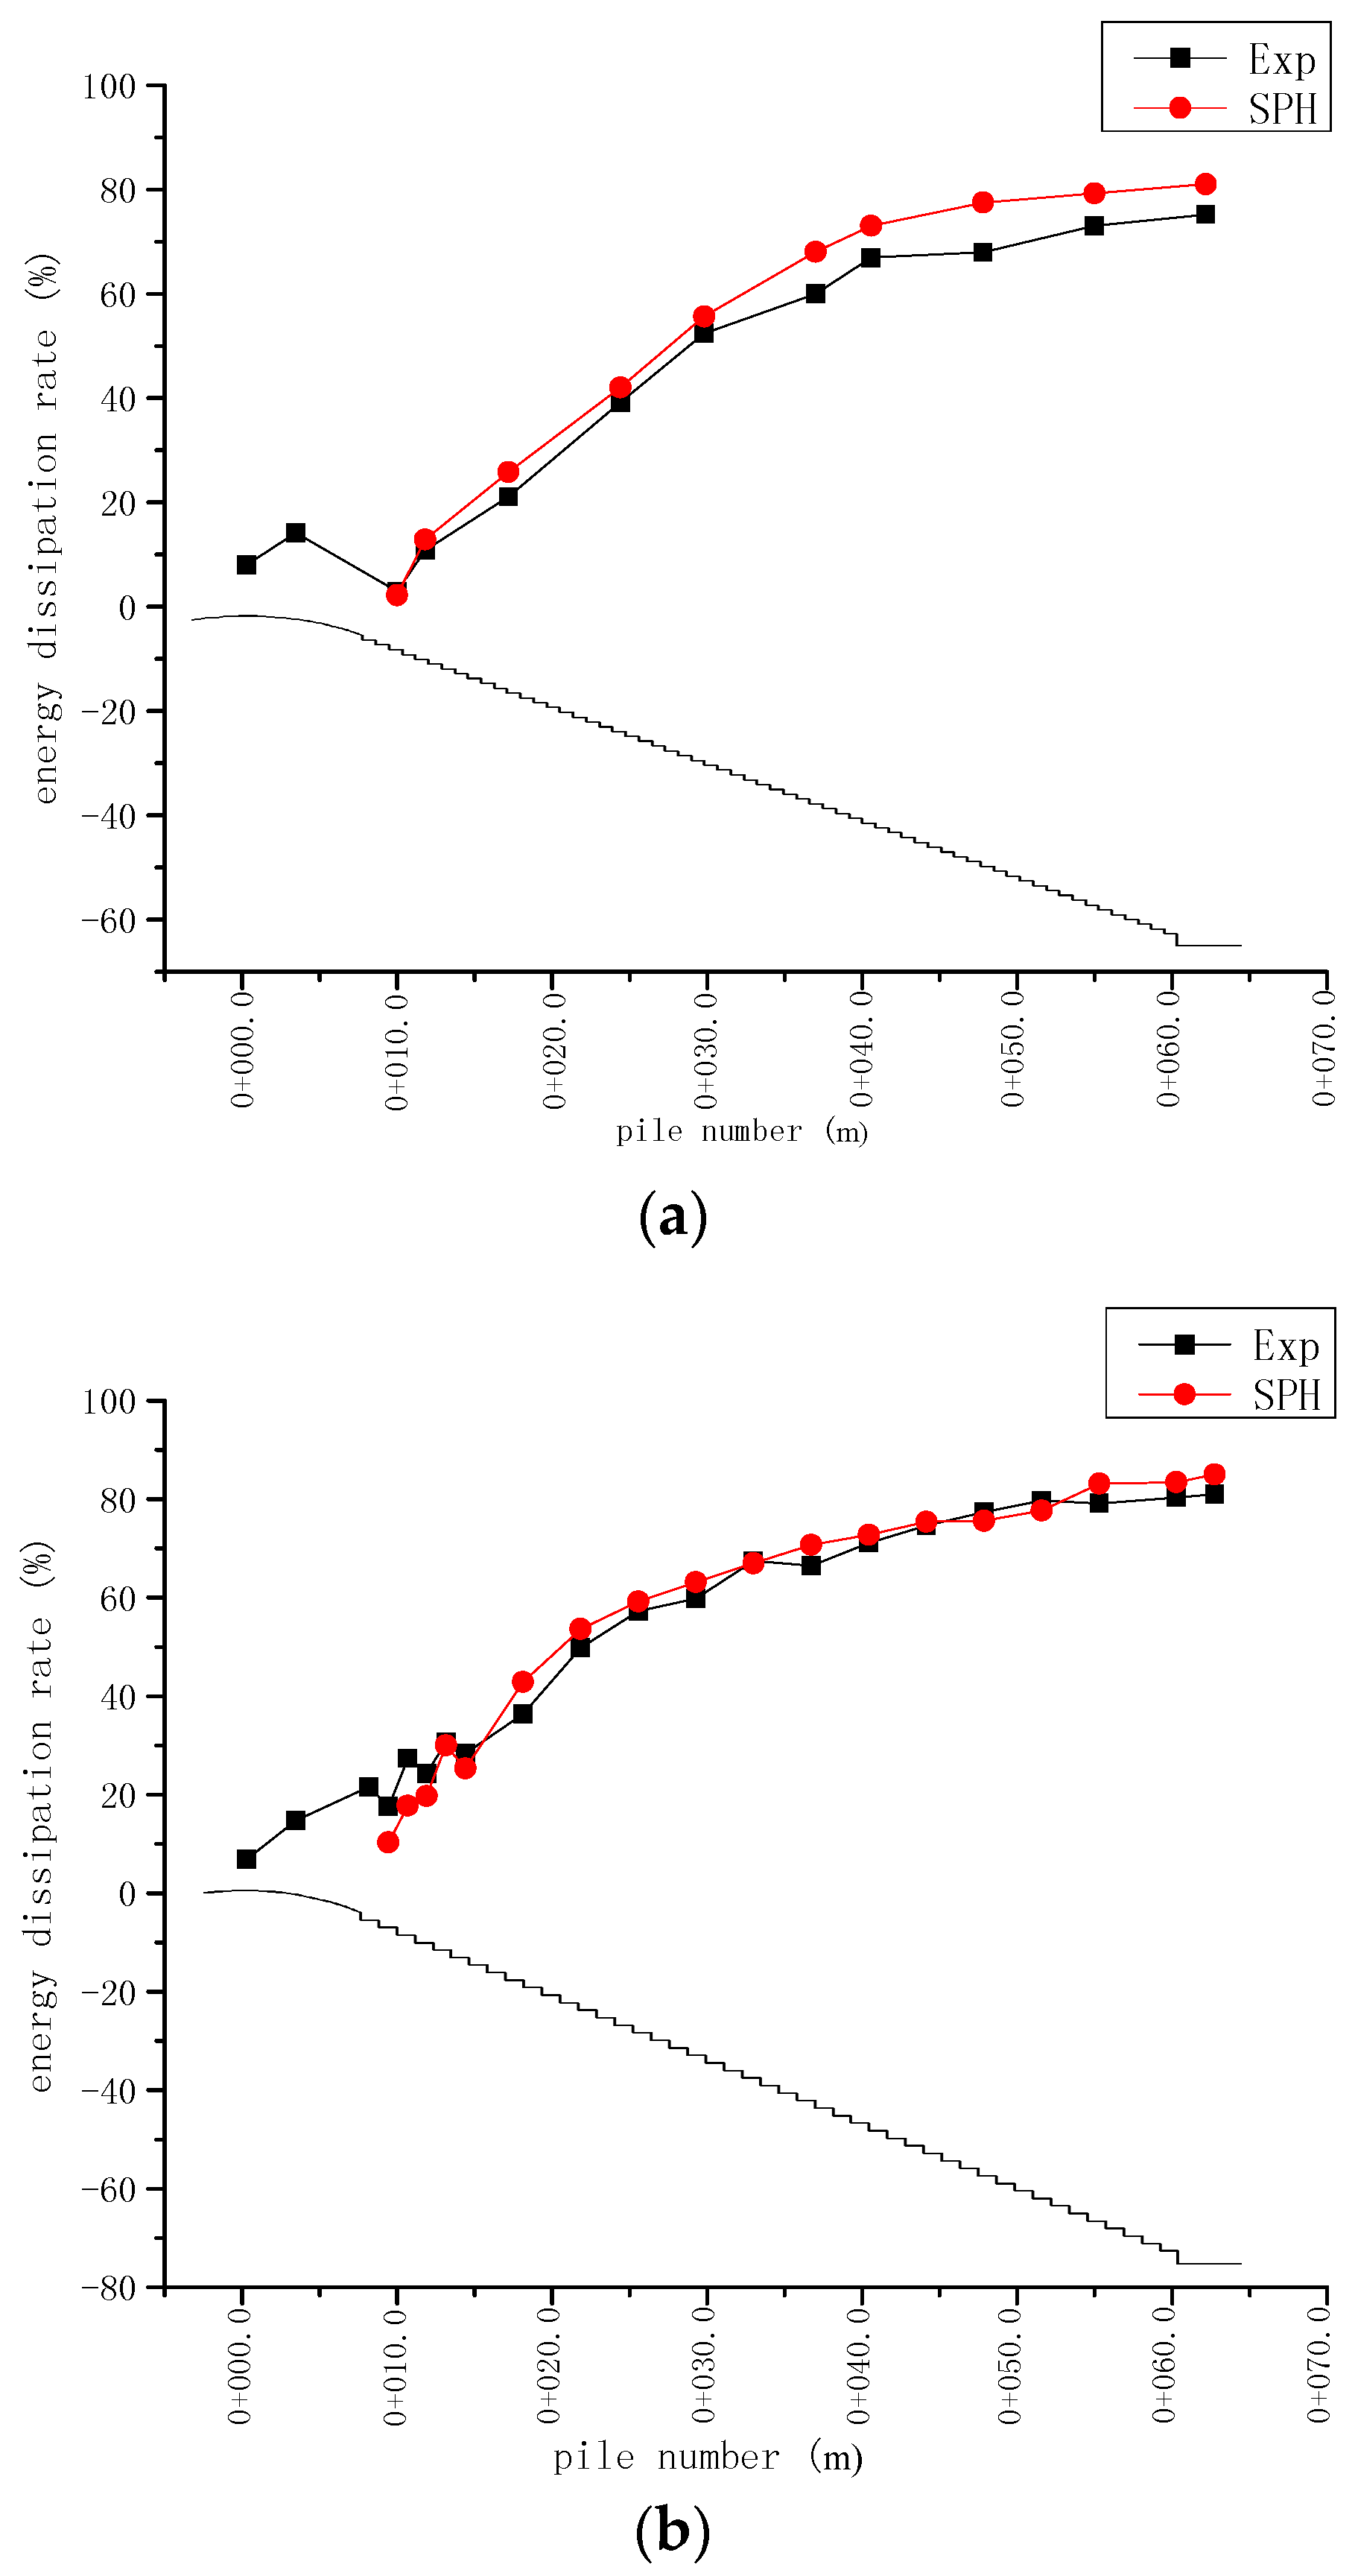
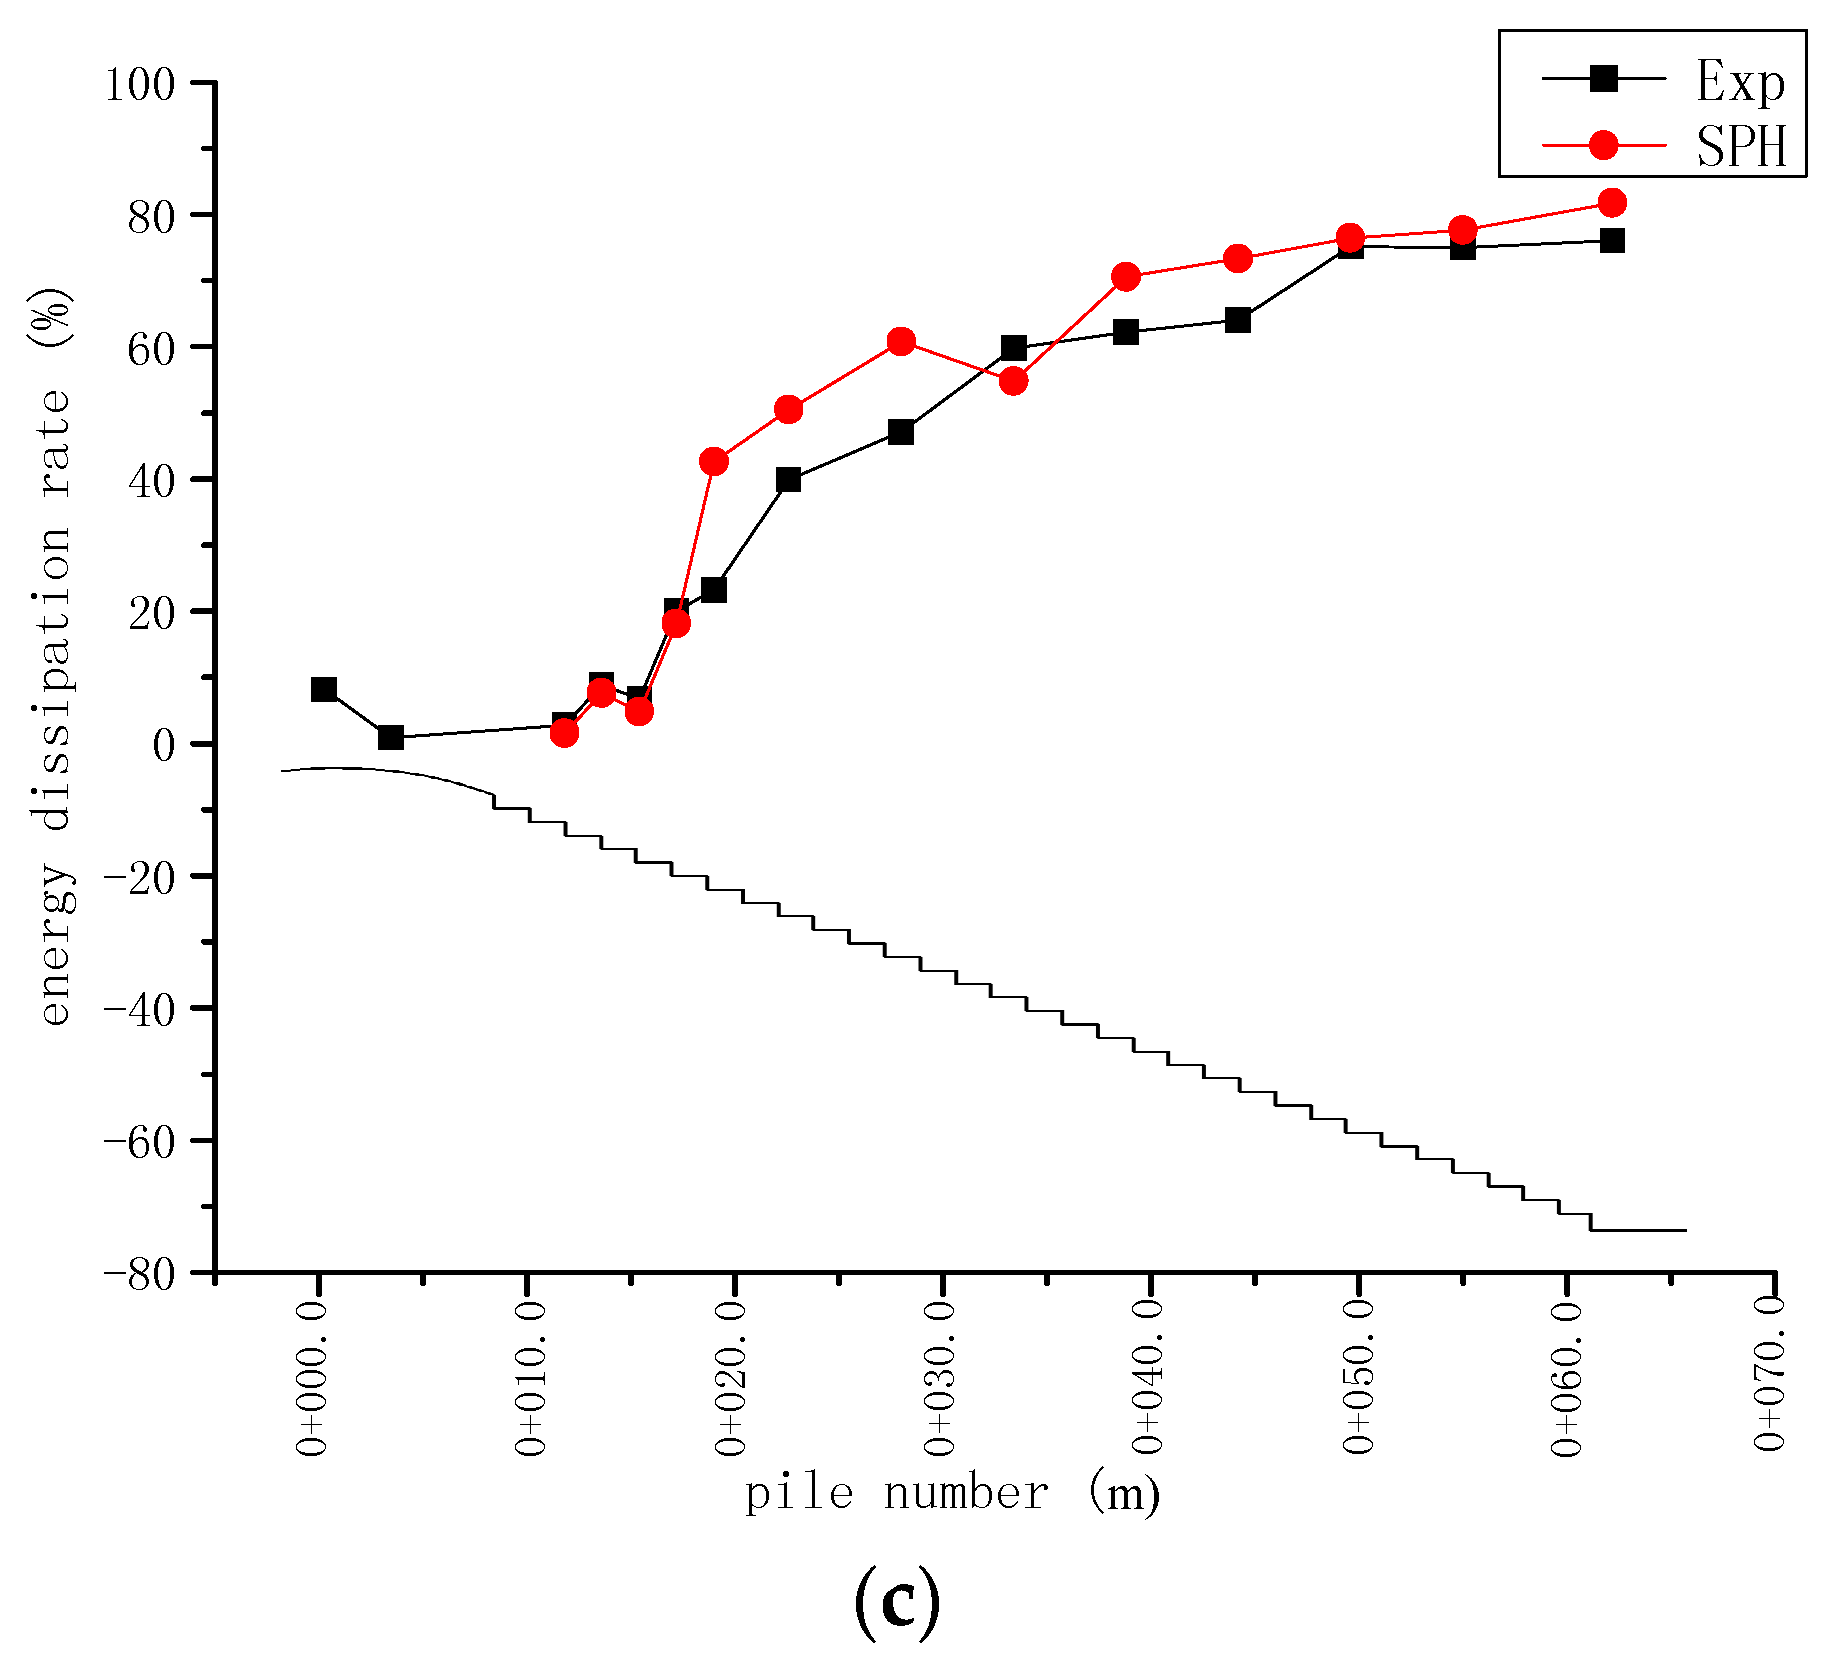
47]. Therefore, a thorough understanding of the energy dissipation features can help to better evaluate the design of stepped spillways and other energy dissipaters such as the tailing basin. In this section, a comparison is made between the SPH and experimental energy dissipation efficiencies along the streamwise spillway direction for the 62, 45 and 31 step cases, respectively. These step numbers correspond to the step dimensions of 9 cm × 6 cm, 12.4 cm × 8.28 cm and 18 cm × 12 cm in the numerical simulations and 2.25 cm × 1.5 cm, 3.1 cm × 2.07 cm and 4.5 cm × 3.0 cm in the laboratory experiment. Another purpose is to use this comparison to validate the flow velocity computations as well, since the energy is calculated from the potentials related to the height of fluids and the kinematics related to the flow velocity.
Figure 12a–c shows the energy dissipation curves of the three different step numbers. The horizontal coordinate is indicated by the number of the pile, which is essentially a common term to represent the horizontal distance measured from the start of the spillway presented in prototype values. The results show that the energy dissipation increases along the downstream-wise directions. At the beginning of the spillway, the gradient of the energy curve is steep and it becomes milder after the pile number reaches around 0 + 40.0 m for all the three cases, until a quasi-terminal value is approached. The maximum energy dissipation efficiency is experimentally 75.17% for the 62-step case, as compared with the SPH value of 80.98% with an averaged error of 8.20%. On the other hand, for the 45-step case the maximum energy dissipation efficiency is experimentally 80.96% as compared with 84.98% by SPH with an averaged error of 3.17%. With regard to the 31-step case, these values are 76.04%, 81.77% and 5.8%, respectively. It should be noted that the energy dissipation of a uniform flow in some energy dissipaters, like corrugated pipes, has a constant rate for certain flow characteristics and does not vary as the flow conveys, according to the study of Calomino et al. [
48].
Here it is also interesting to note the 45-step spillway dissipated slightly more flow energy as compared with the other two cases. This could be understood as follows: for the 31-step spillway, there is an insufficient bottom friction to dampen the incoming flow velocity, and the flow could jump on the step surface and regain their energy before reaching the next step. On the other hand, too many steps may not be beneficial either, since the spillway bed could become similar to the rough bed of an open channel under such a dense step configuration. Therefore, the energy dissipation efficiency of the spillway could decrease accordingly. It might be concluded that there should exist an optimum step dimension and number for a particular spillway design in view of achieving the maximum energy dissipation, which depends on the inflow conditions, bed slope and spillway length, etc. A large series of experimental or numerical trails would be required to find out the most desirable spillway configuration.
6. Conclusions
This study demonstrates the great potentials of the SPH modeling technique in practical engineering applications of a stepped spillway flow. By using the open source code parallelSPHysics to a documented benchmark and a self-implemented laboratory spillway flow based on the prototype hydraulic dam project, the numerical accuracy of the model is fully evidenced. The proposed push-paddle inflow model can generate a quite quite stable inflow hydrograph, which is also easy to program into the SPH numerical scheme and effective in reducing the computational domain by a large margin. The SPH computations are critically validated by the velocity and pressure data through either the literature or the laboratory measurement. An error analysis showed that the average errors between the numerical and experimental results are 0.8–4.3% in the horizontal pressures and 0.7–4.7% in the vertical pressures. Besides, the pressure distributions on the horizontal and vertical faces of the spillway step show significantly different patterns. On the former it is always positive with a peak value towards the outer edge of the step with a decreasing trend to the corner, while on the latter it has alternatively positive and negative pressure values, which is highest near the step corner and lowest near the step edge. In the study, three different step configurations are considered, i.e., the step numbered at 62, 45 and 31. The computed energy dissipations also agree with the experimental data within an error of 8.2%, 3.1% and 5.8%, respectively, for the above three step conditions. One highlight of the present study is that the SPH pressure computations on the step faces are quantitatively validated by the measured experimental data. It seems the parallelSPH could provide a promising simulation tool for the stepped spillway flows in a laboratory scale with great potentials in real hydraulic engineering.
However, it should be realized that SPH still has quite a few limitations in its application to the spillway flows. Compared with the grid modeling technique such as RANS model, SPH consumes more CPU time, especially for a lower water head over the spillway crest, when a very refined particle resolution must be needed to achieve realistic simulation results. Besides, the stepped spillway flow is often associated with the water-air two phase interactions. A single-phase SPH model would not be able to accurately simulate the real flow situations and a two-phase SPH model should provide a more convincing simulation technique. On the other hand, it should also be realized that SPH has very superior advantages when dealing with the large deformation or broken free surfaces associated with the flow jet or flow-step interactions over the spillway. Due to its mesh-free nature, SPH can capture these complex free surface patterns much better than the RANS modeling techniques. Besides, the more recent promising SPH applications in the water field have been vigorously demonstrated by [
49,
50].


 and
and 


