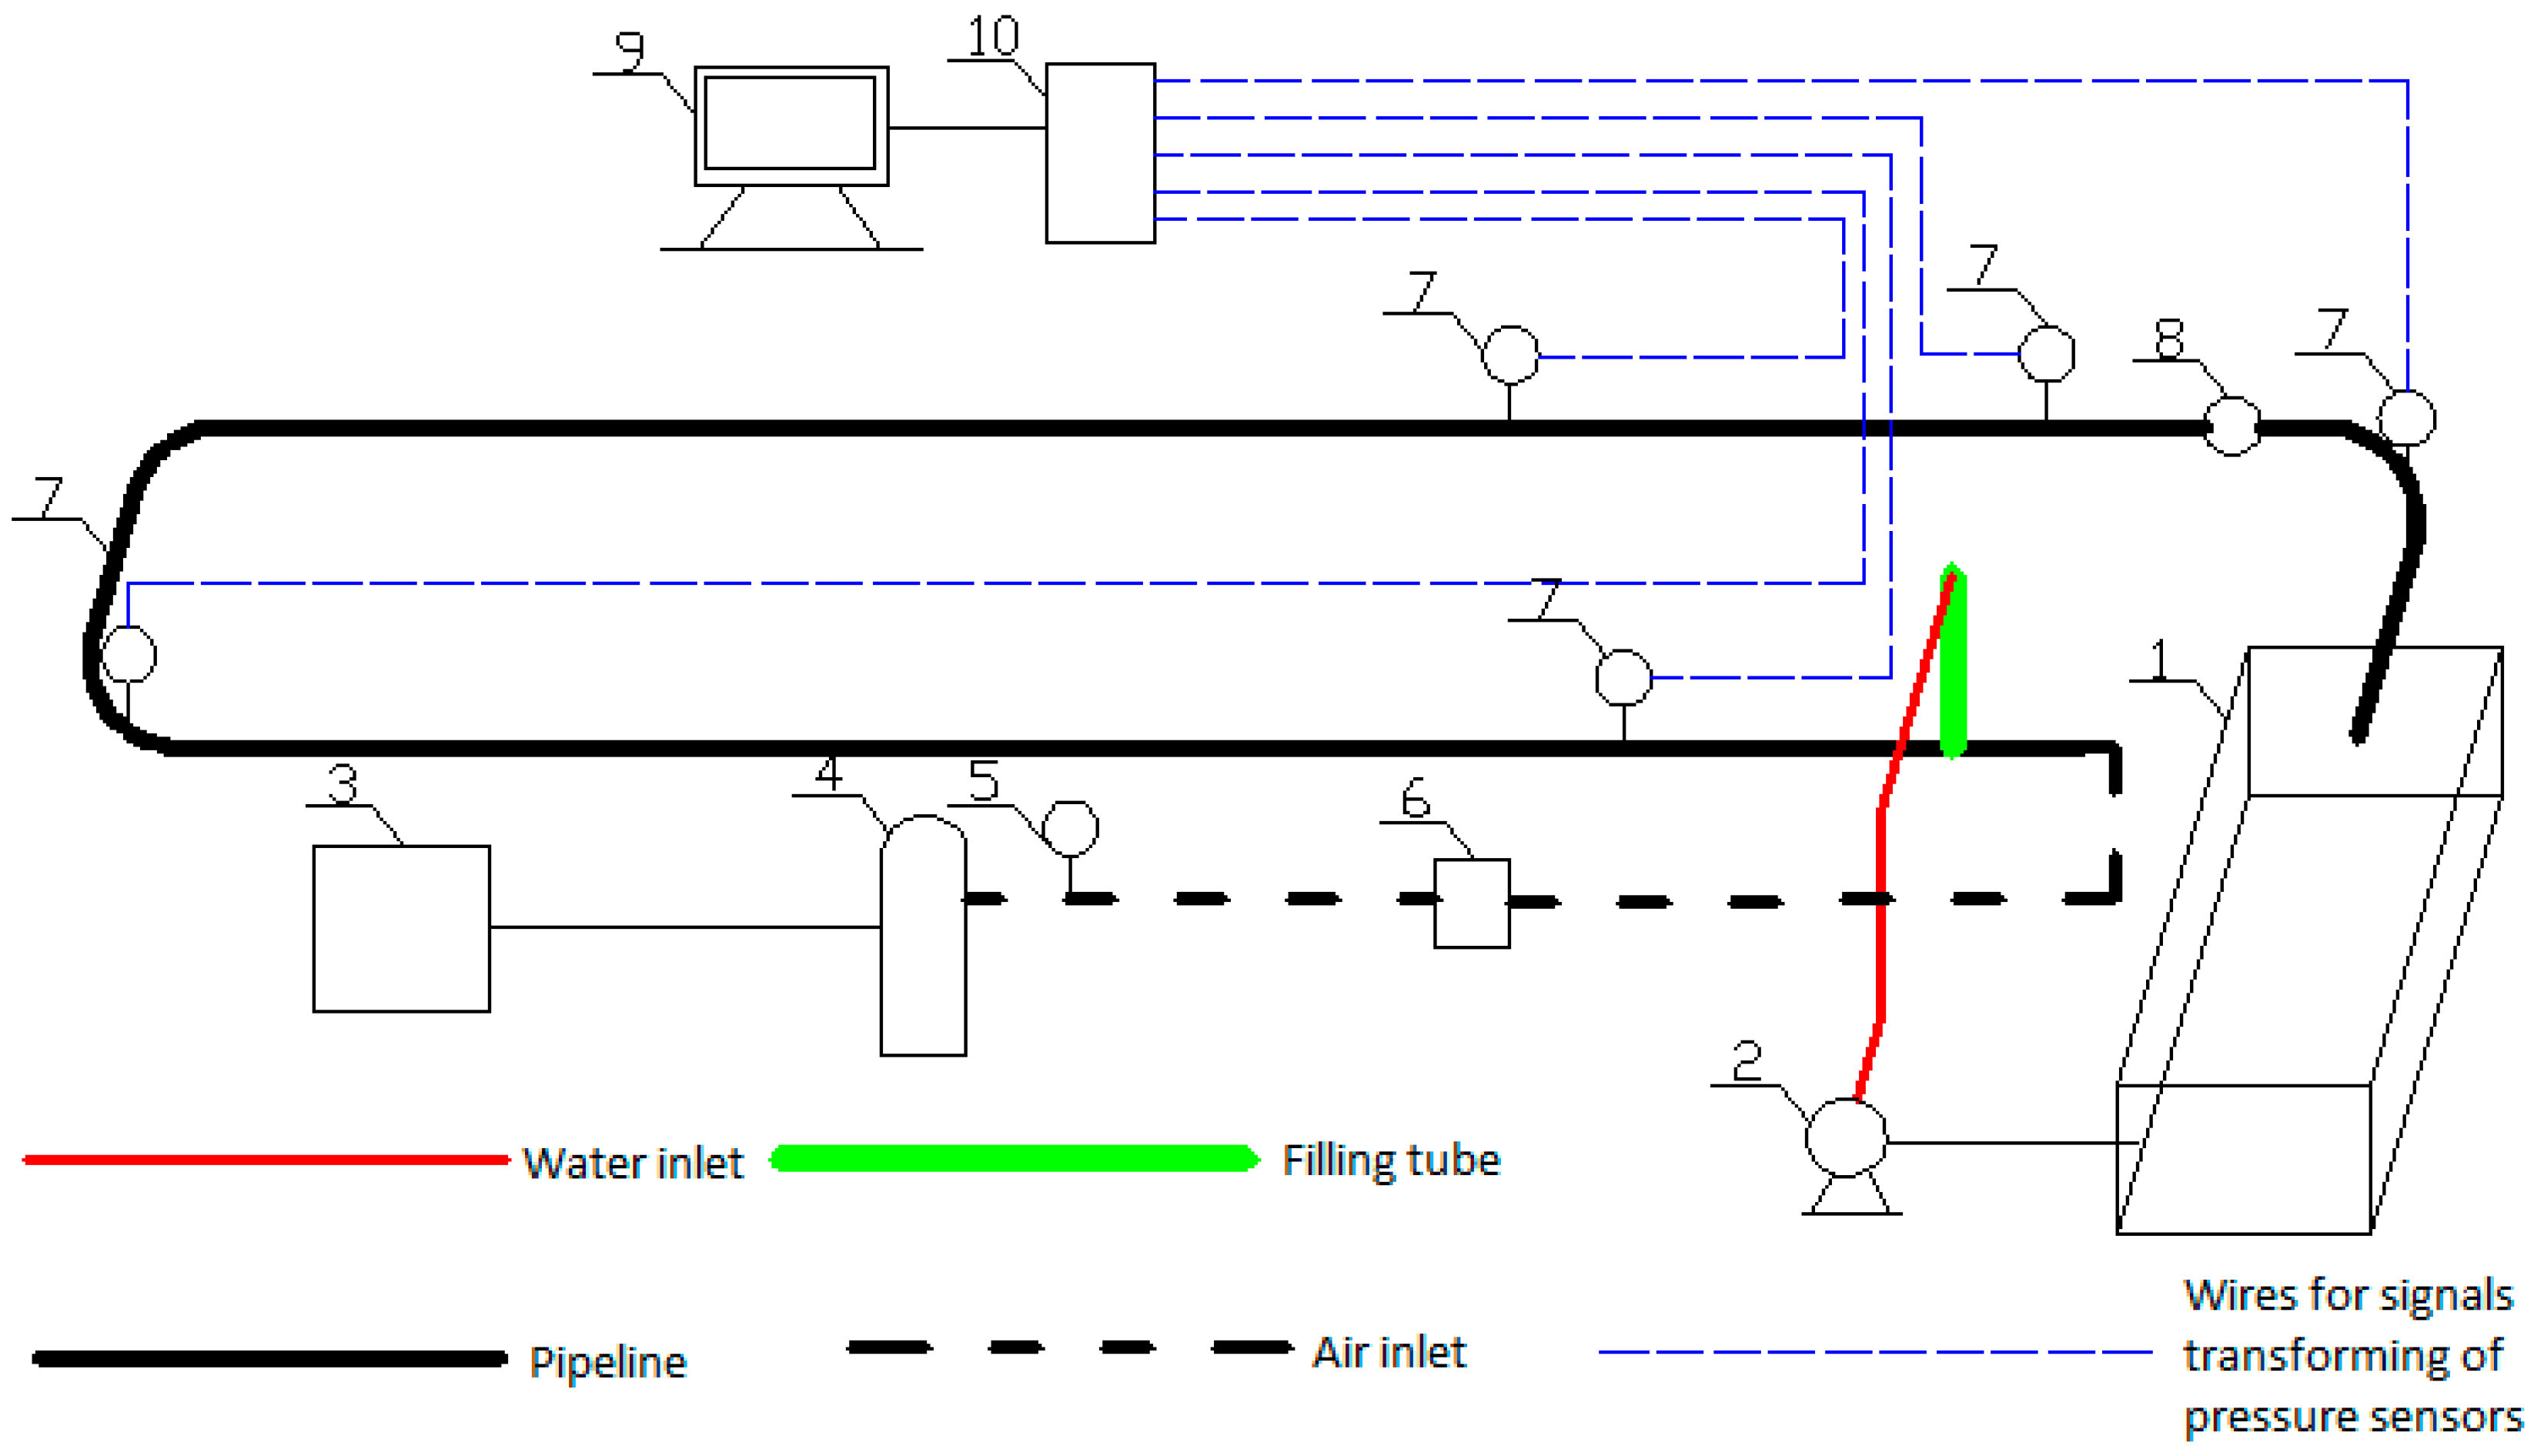
Figure 1.
Two-phase pulse flushing experiment set up: (1) water tank; (2) water pump; (3) wir compressor; (4) gasholder; (5) pressure control valve; (6) pulse generator; (7) pressure transmitter; (8) flow meter; (9) computer; and (10) data acquisition module.
Figure 1.
Two-phase pulse flushing experiment set up: (1) water tank; (2) water pump; (3) wir compressor; (4) gasholder; (5) pressure control valve; (6) pulse generator; (7) pressure transmitter; (8) flow meter; (9) computer; and (10) data acquisition module.
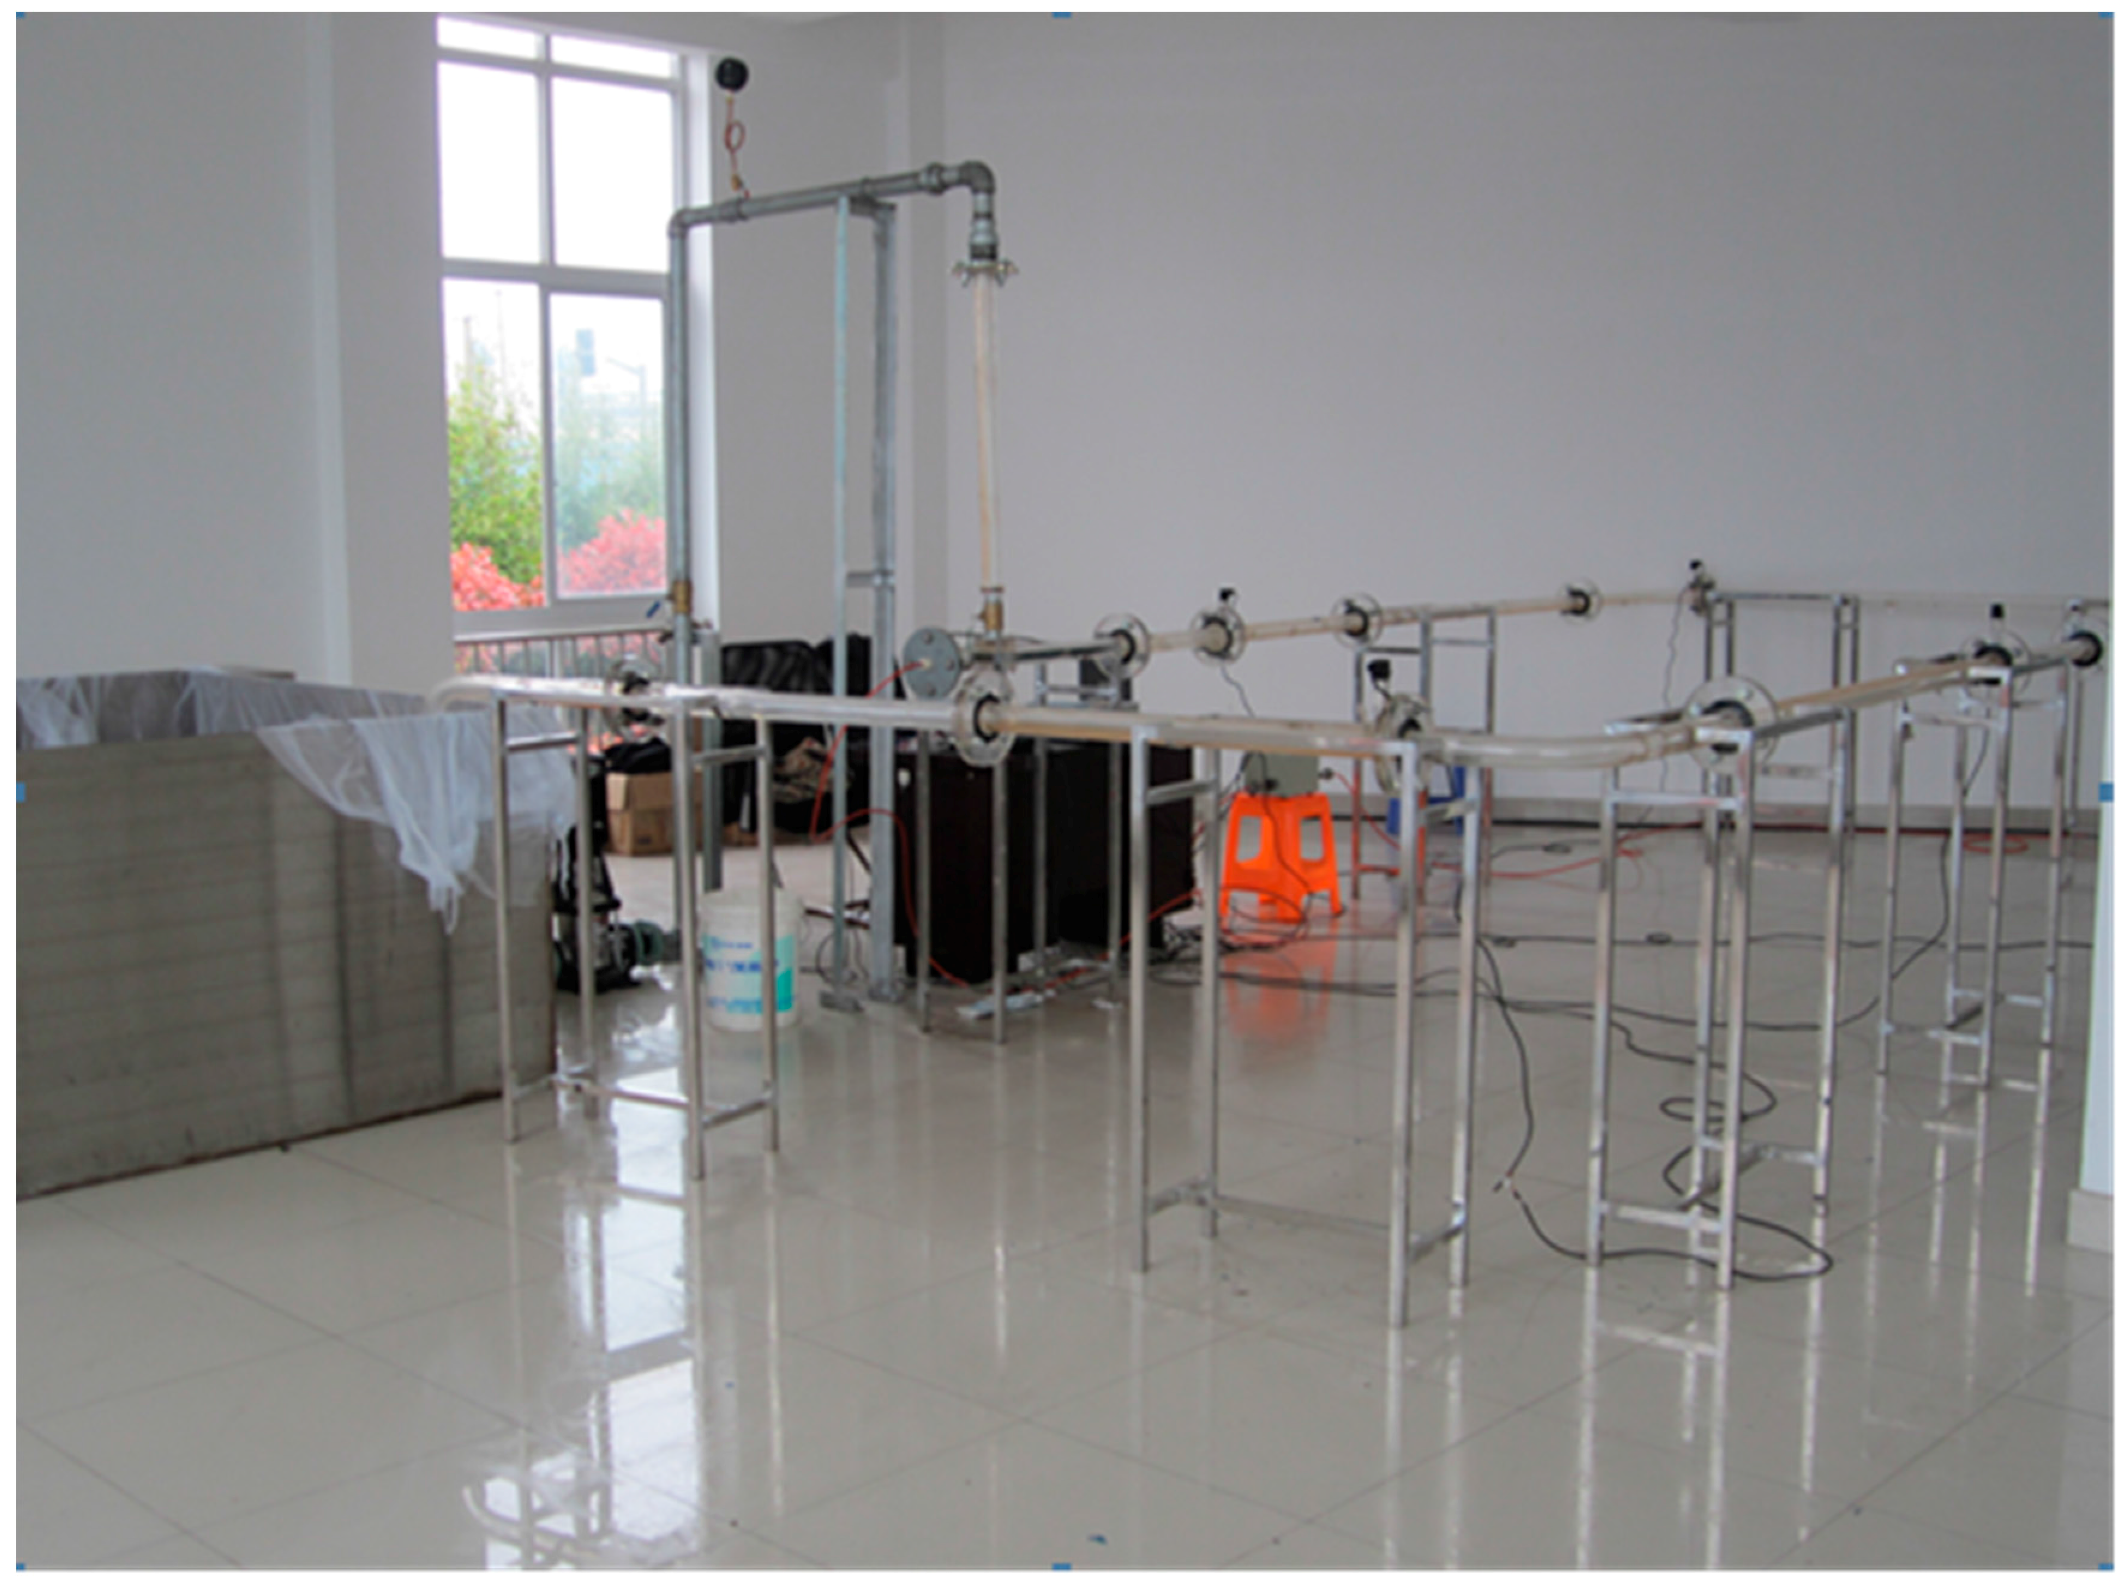
Figure 2.
Practical two-phase pulse flushing experiment set up in the laboratory.
Figure 2.
Practical two-phase pulse flushing experiment set up in the laboratory.
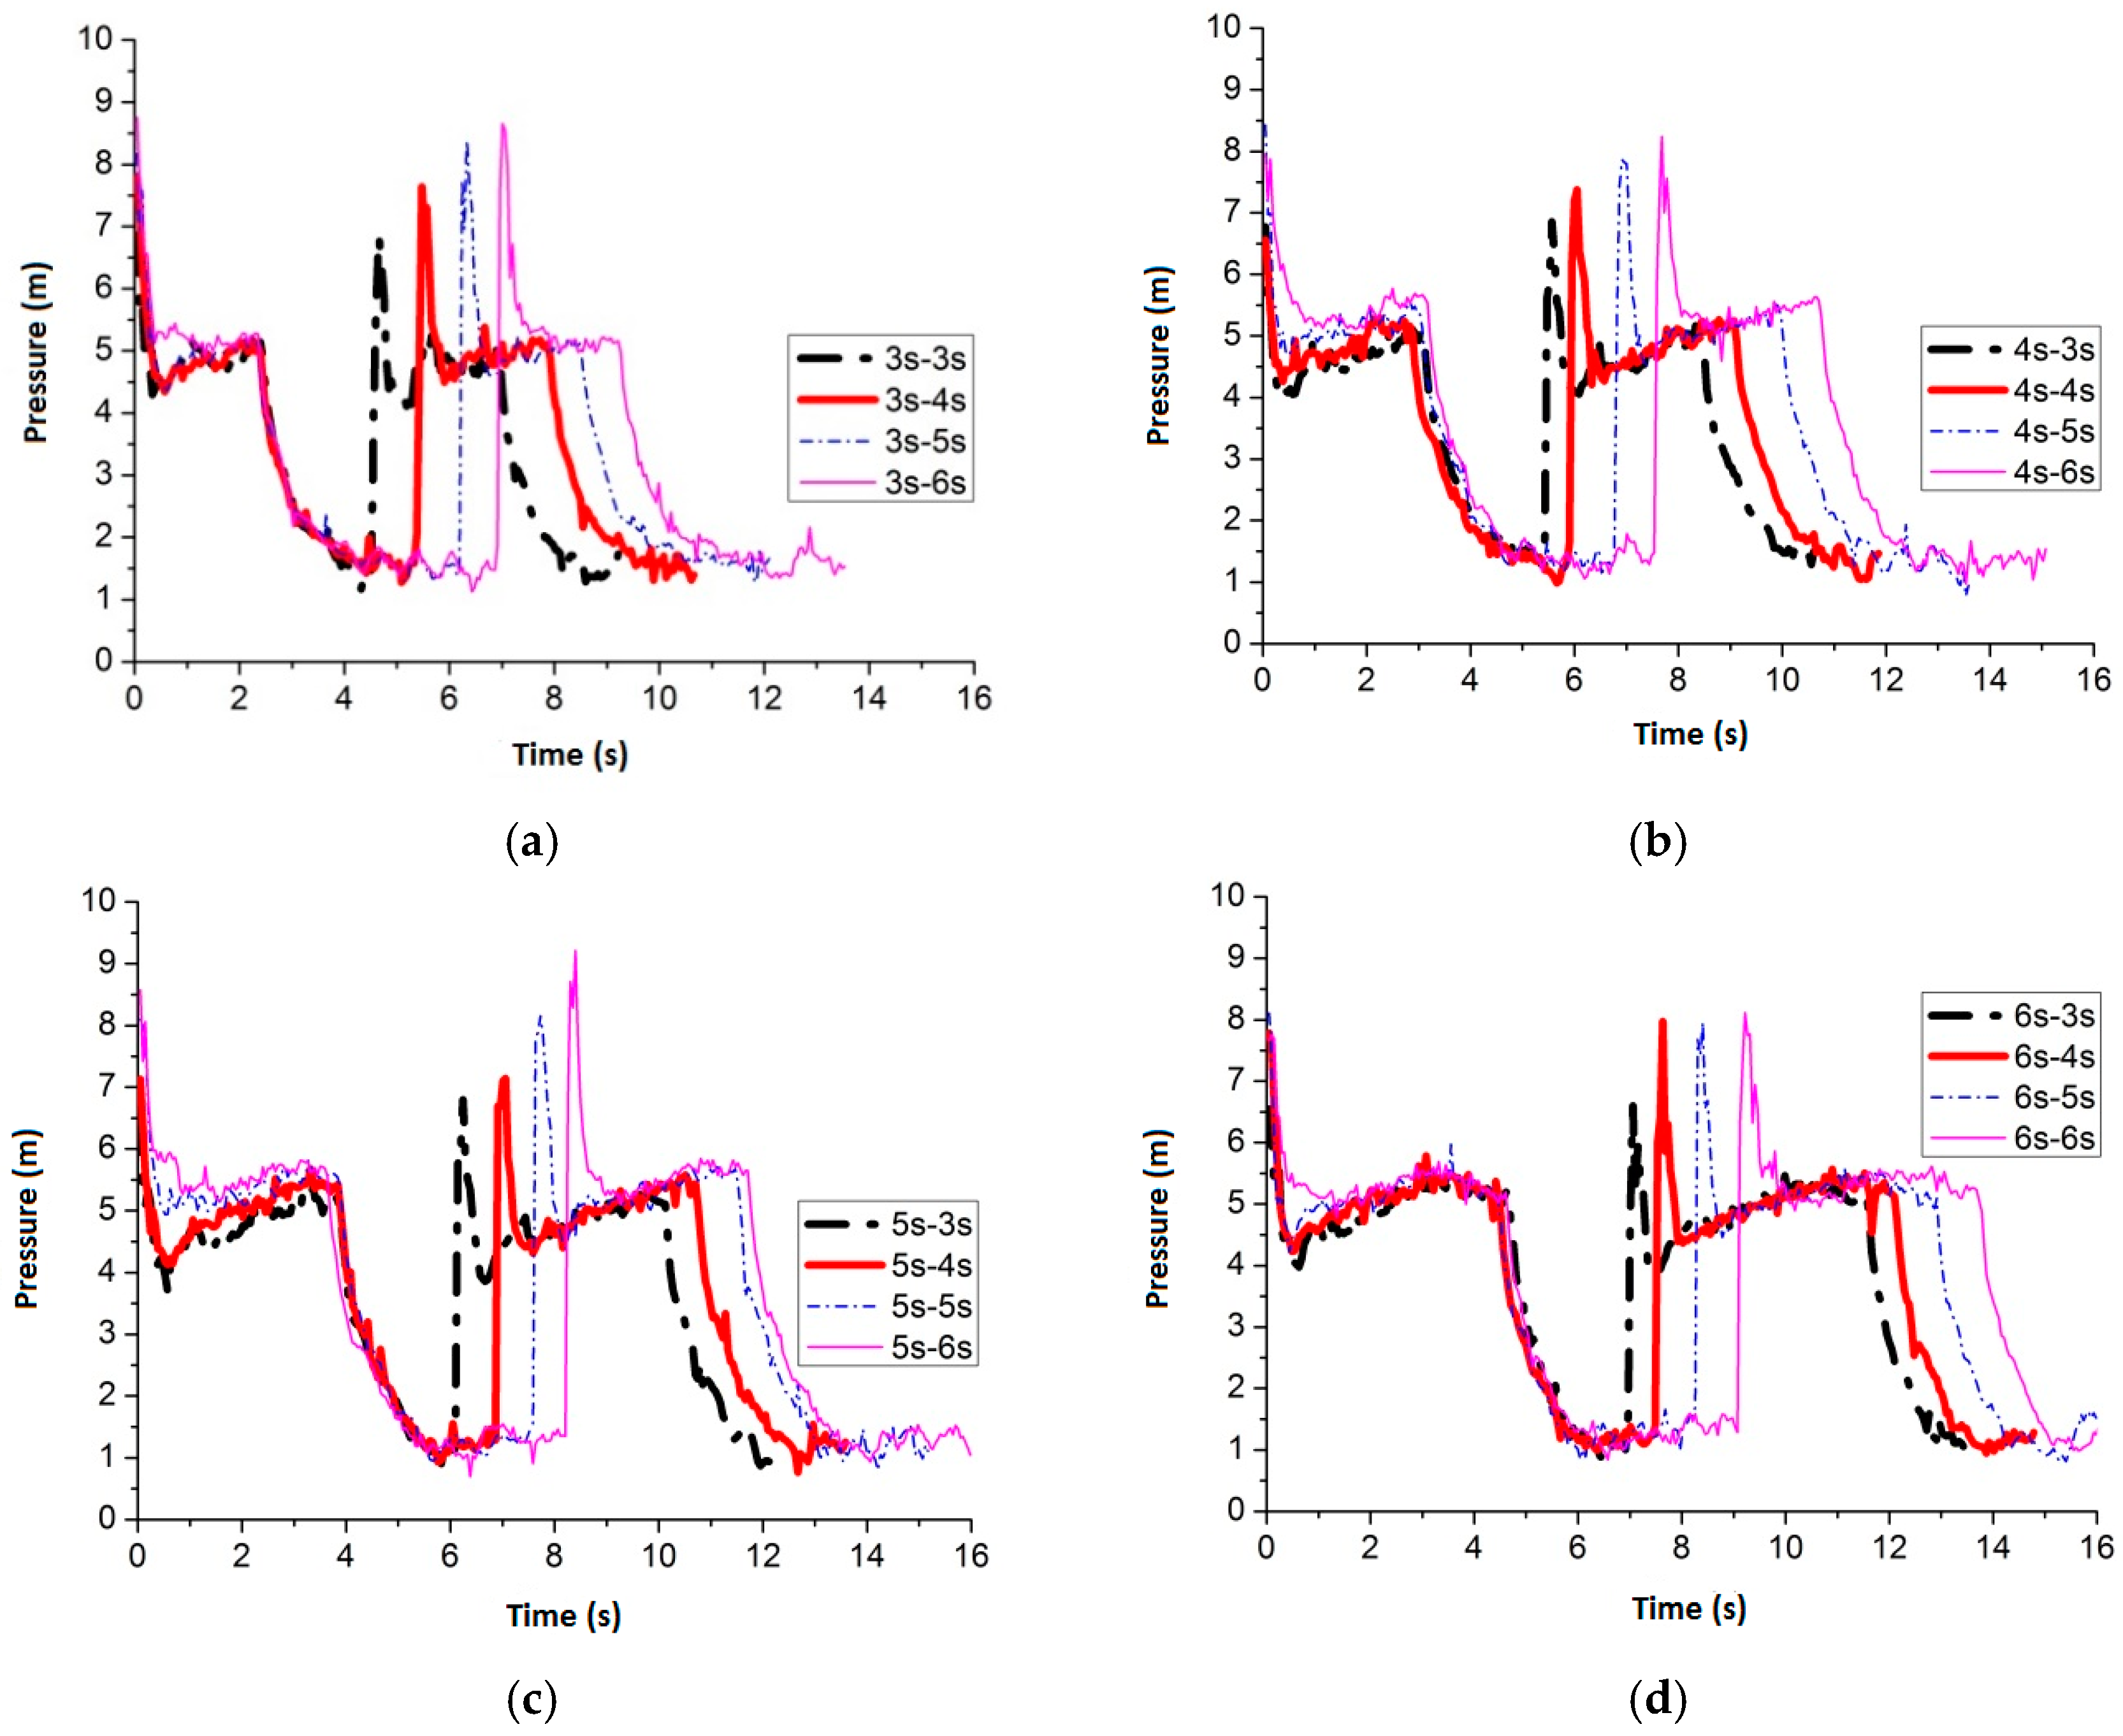
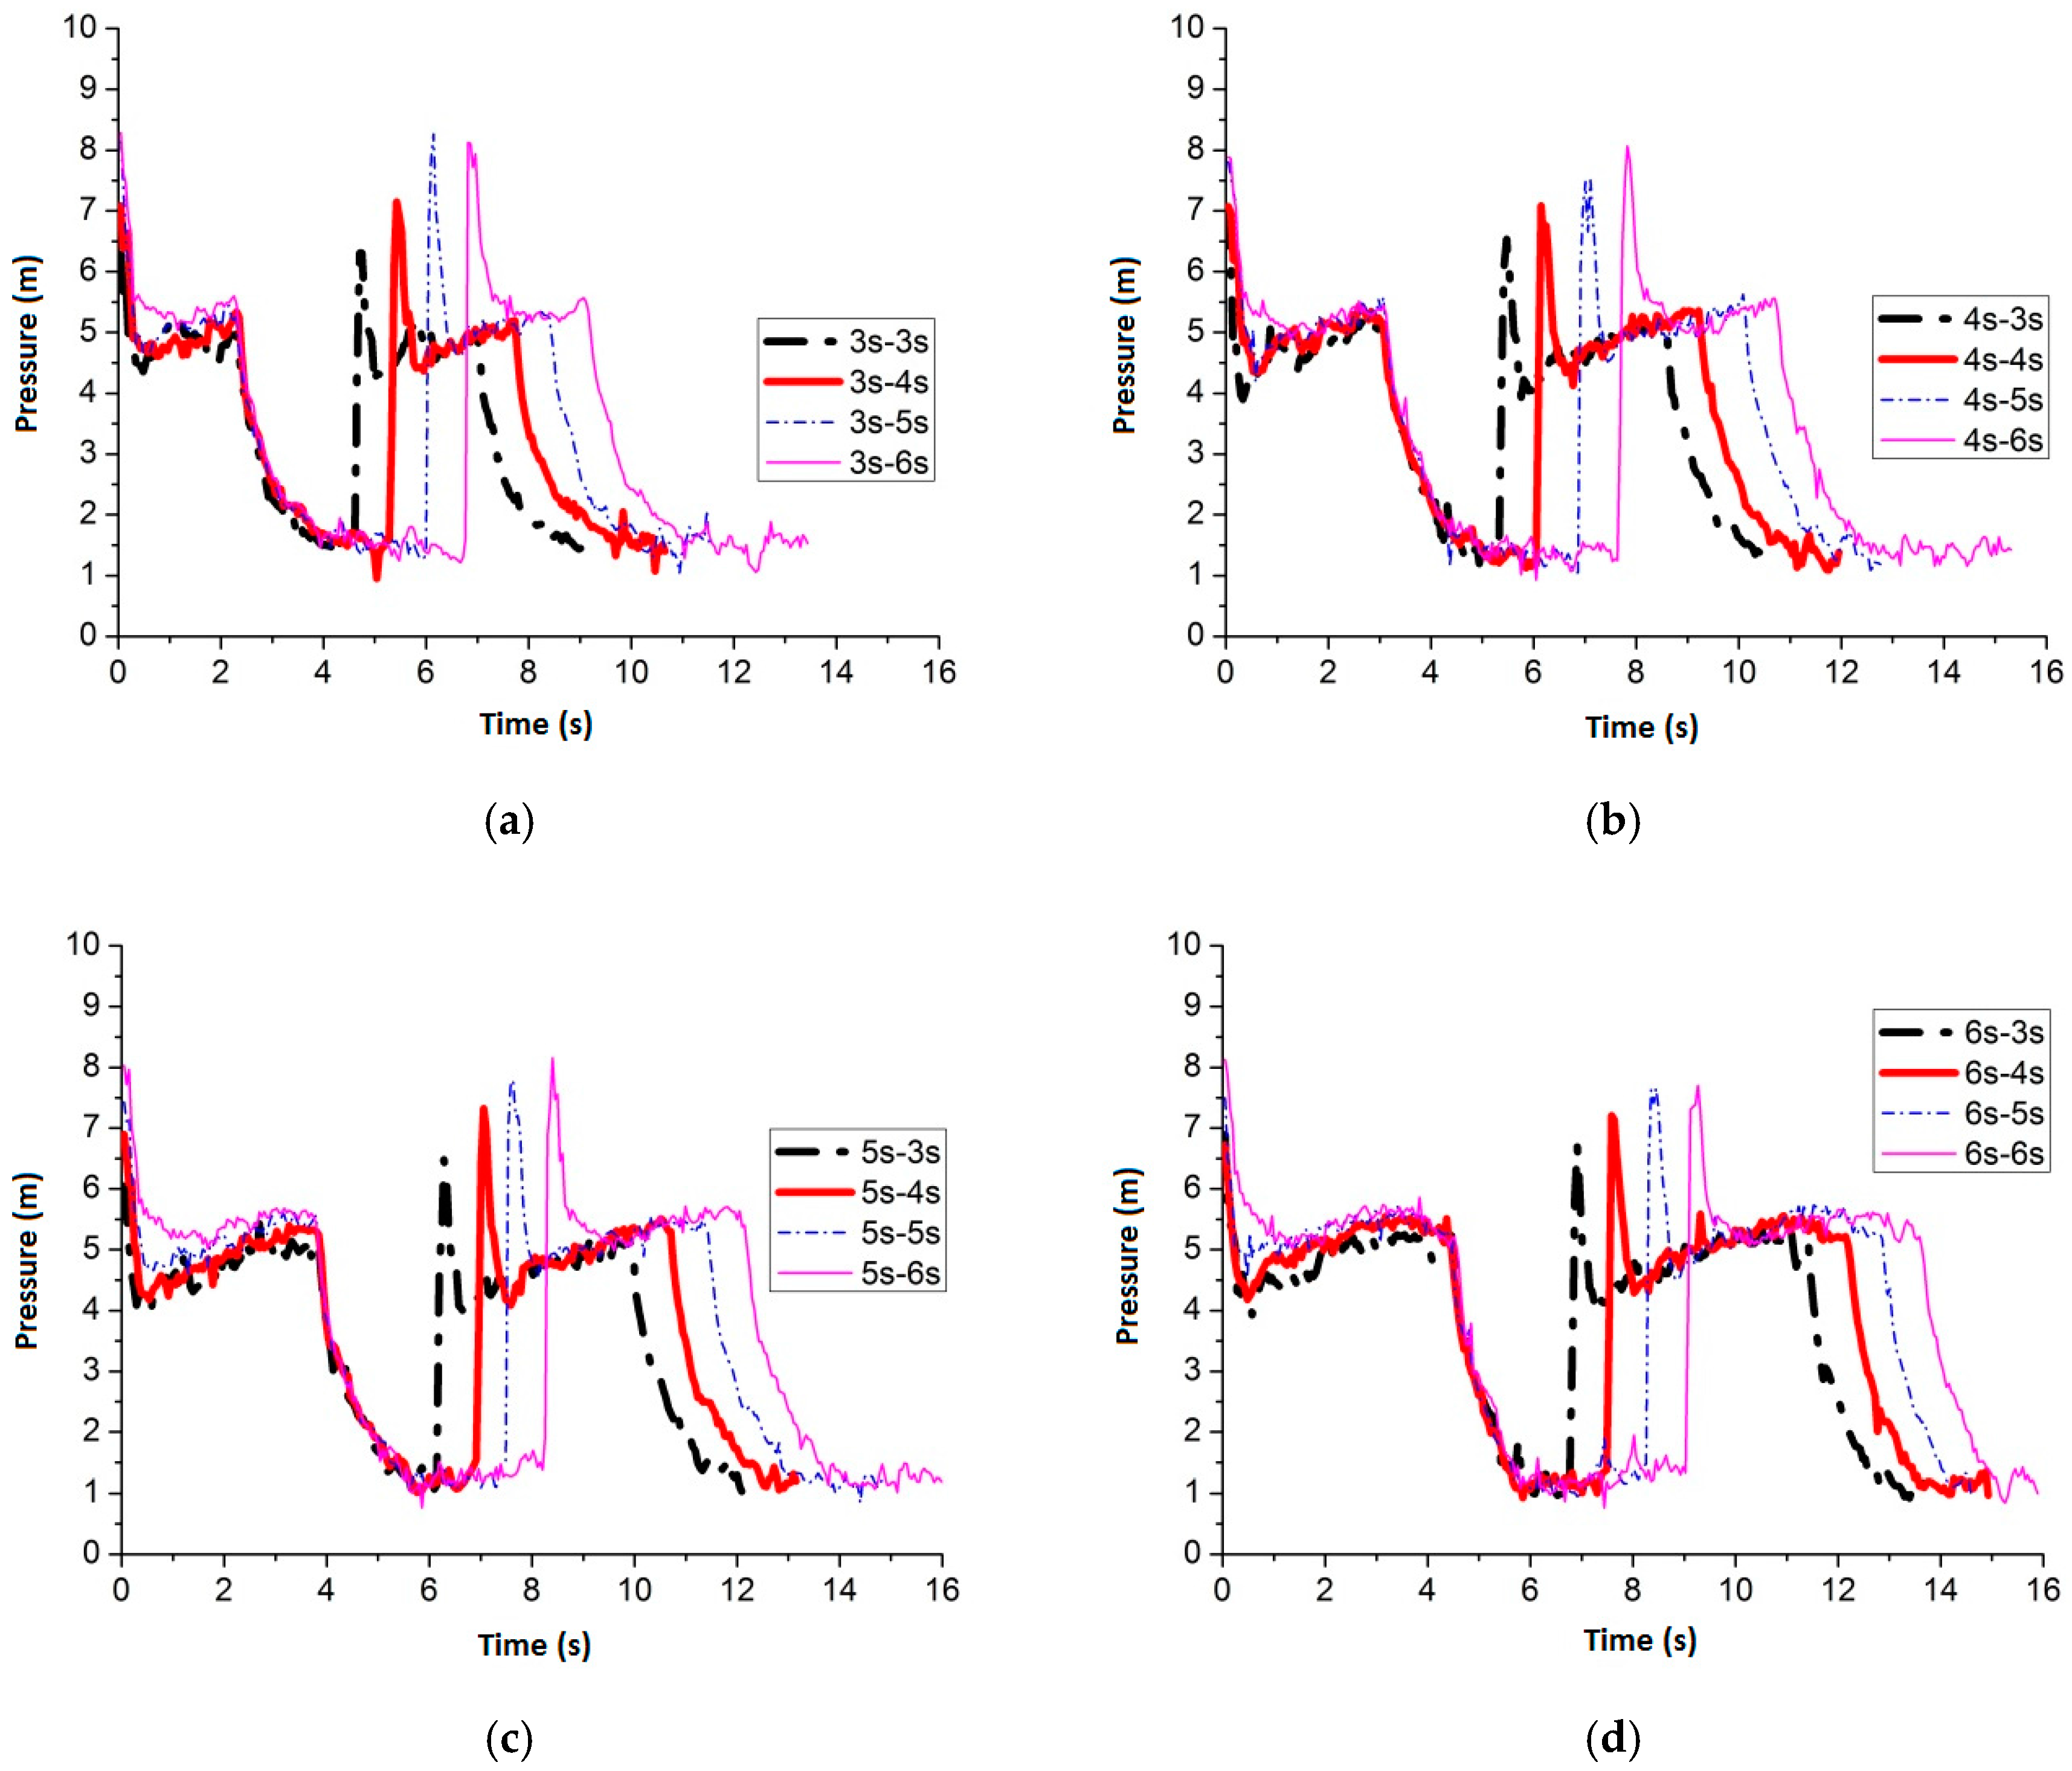
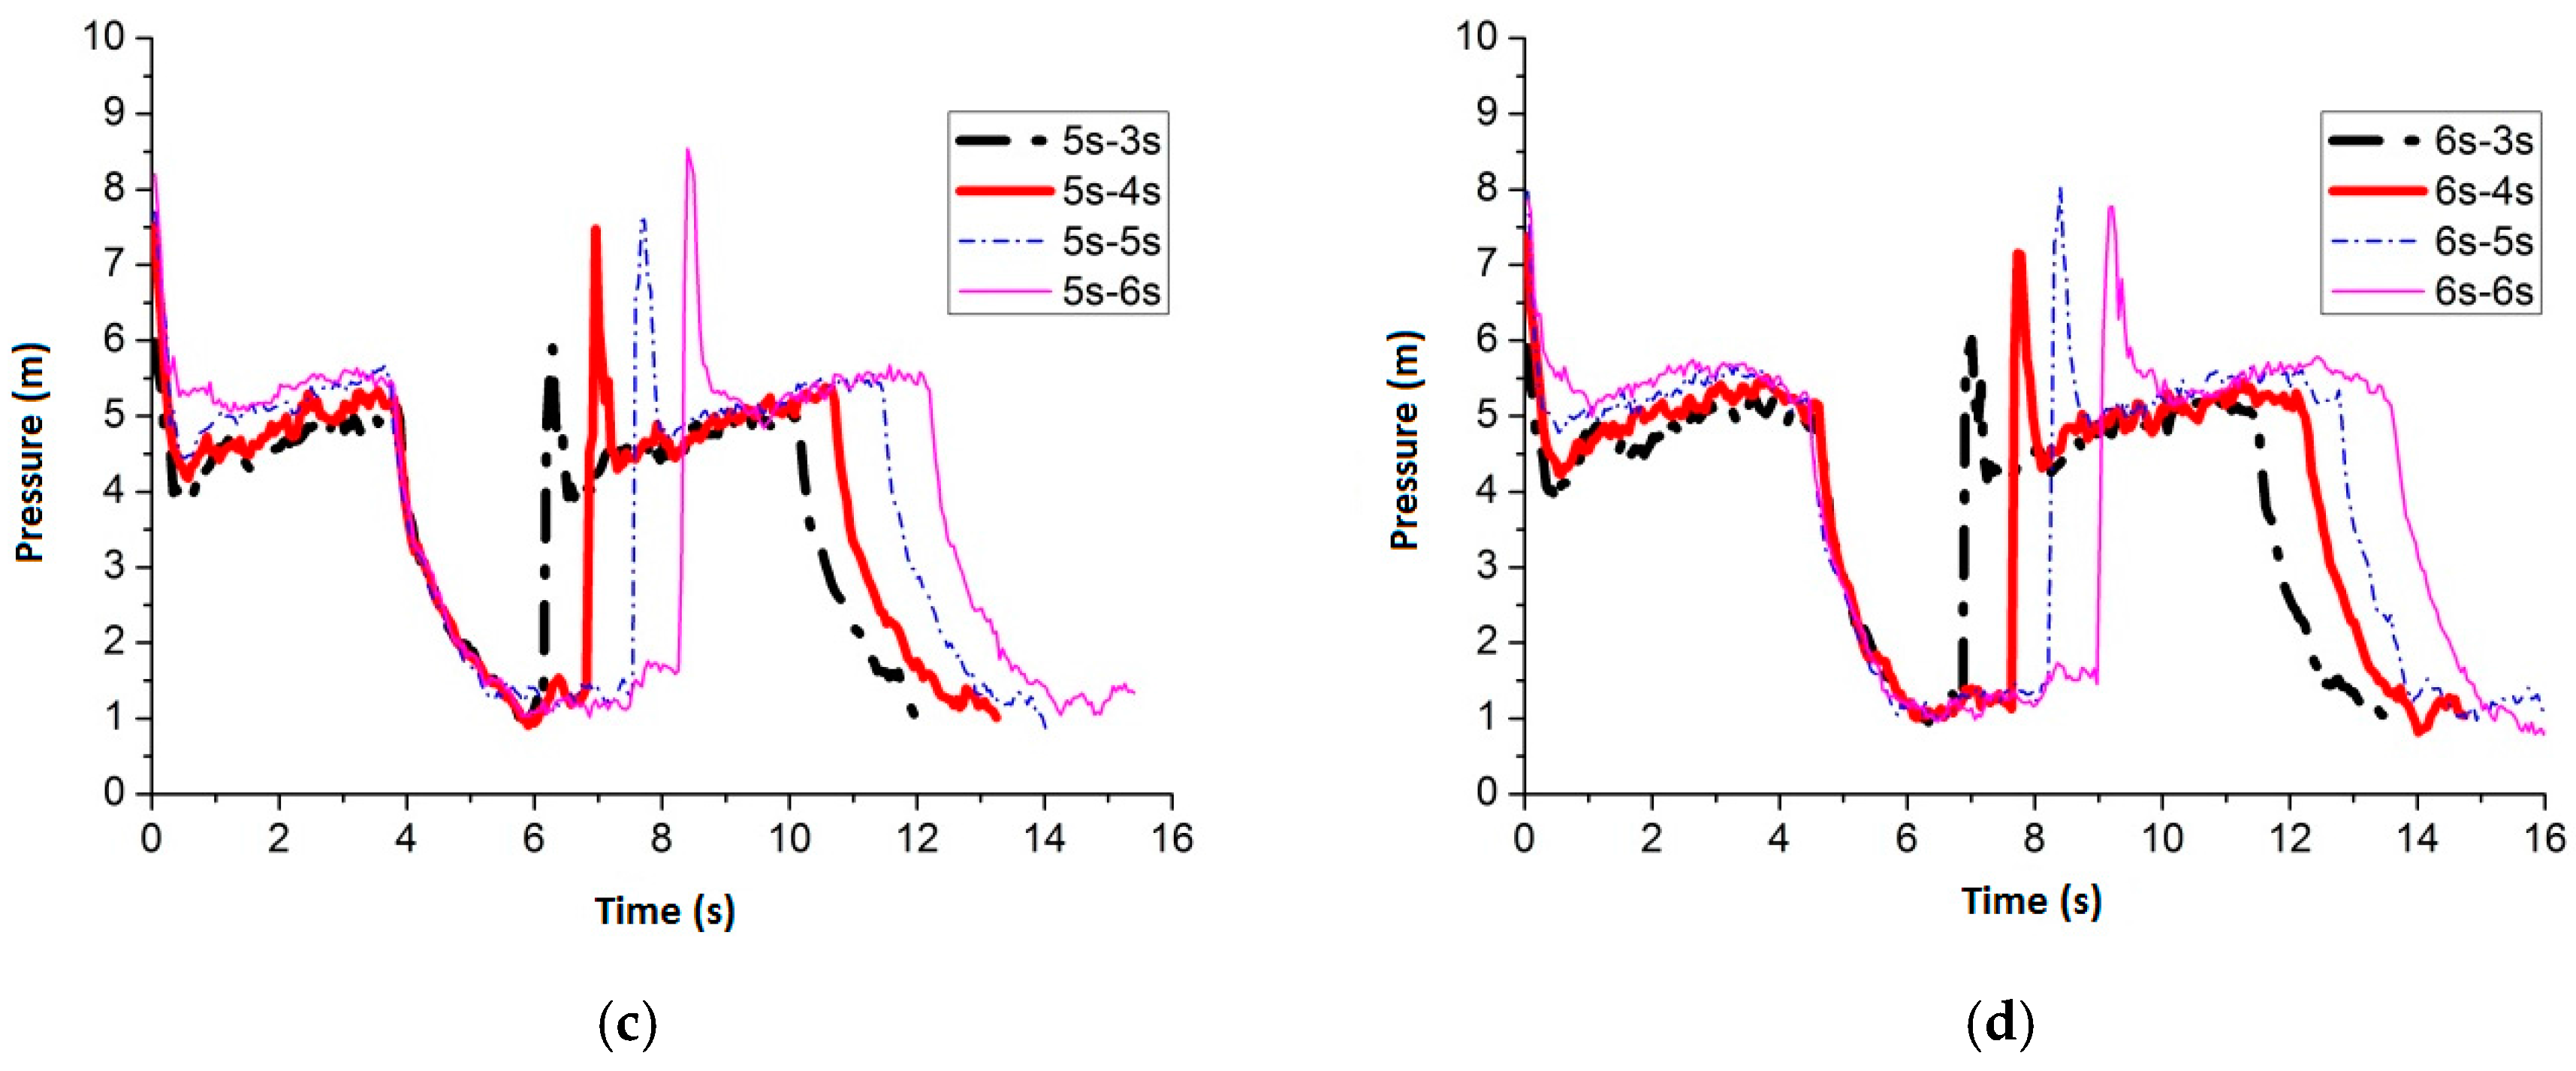
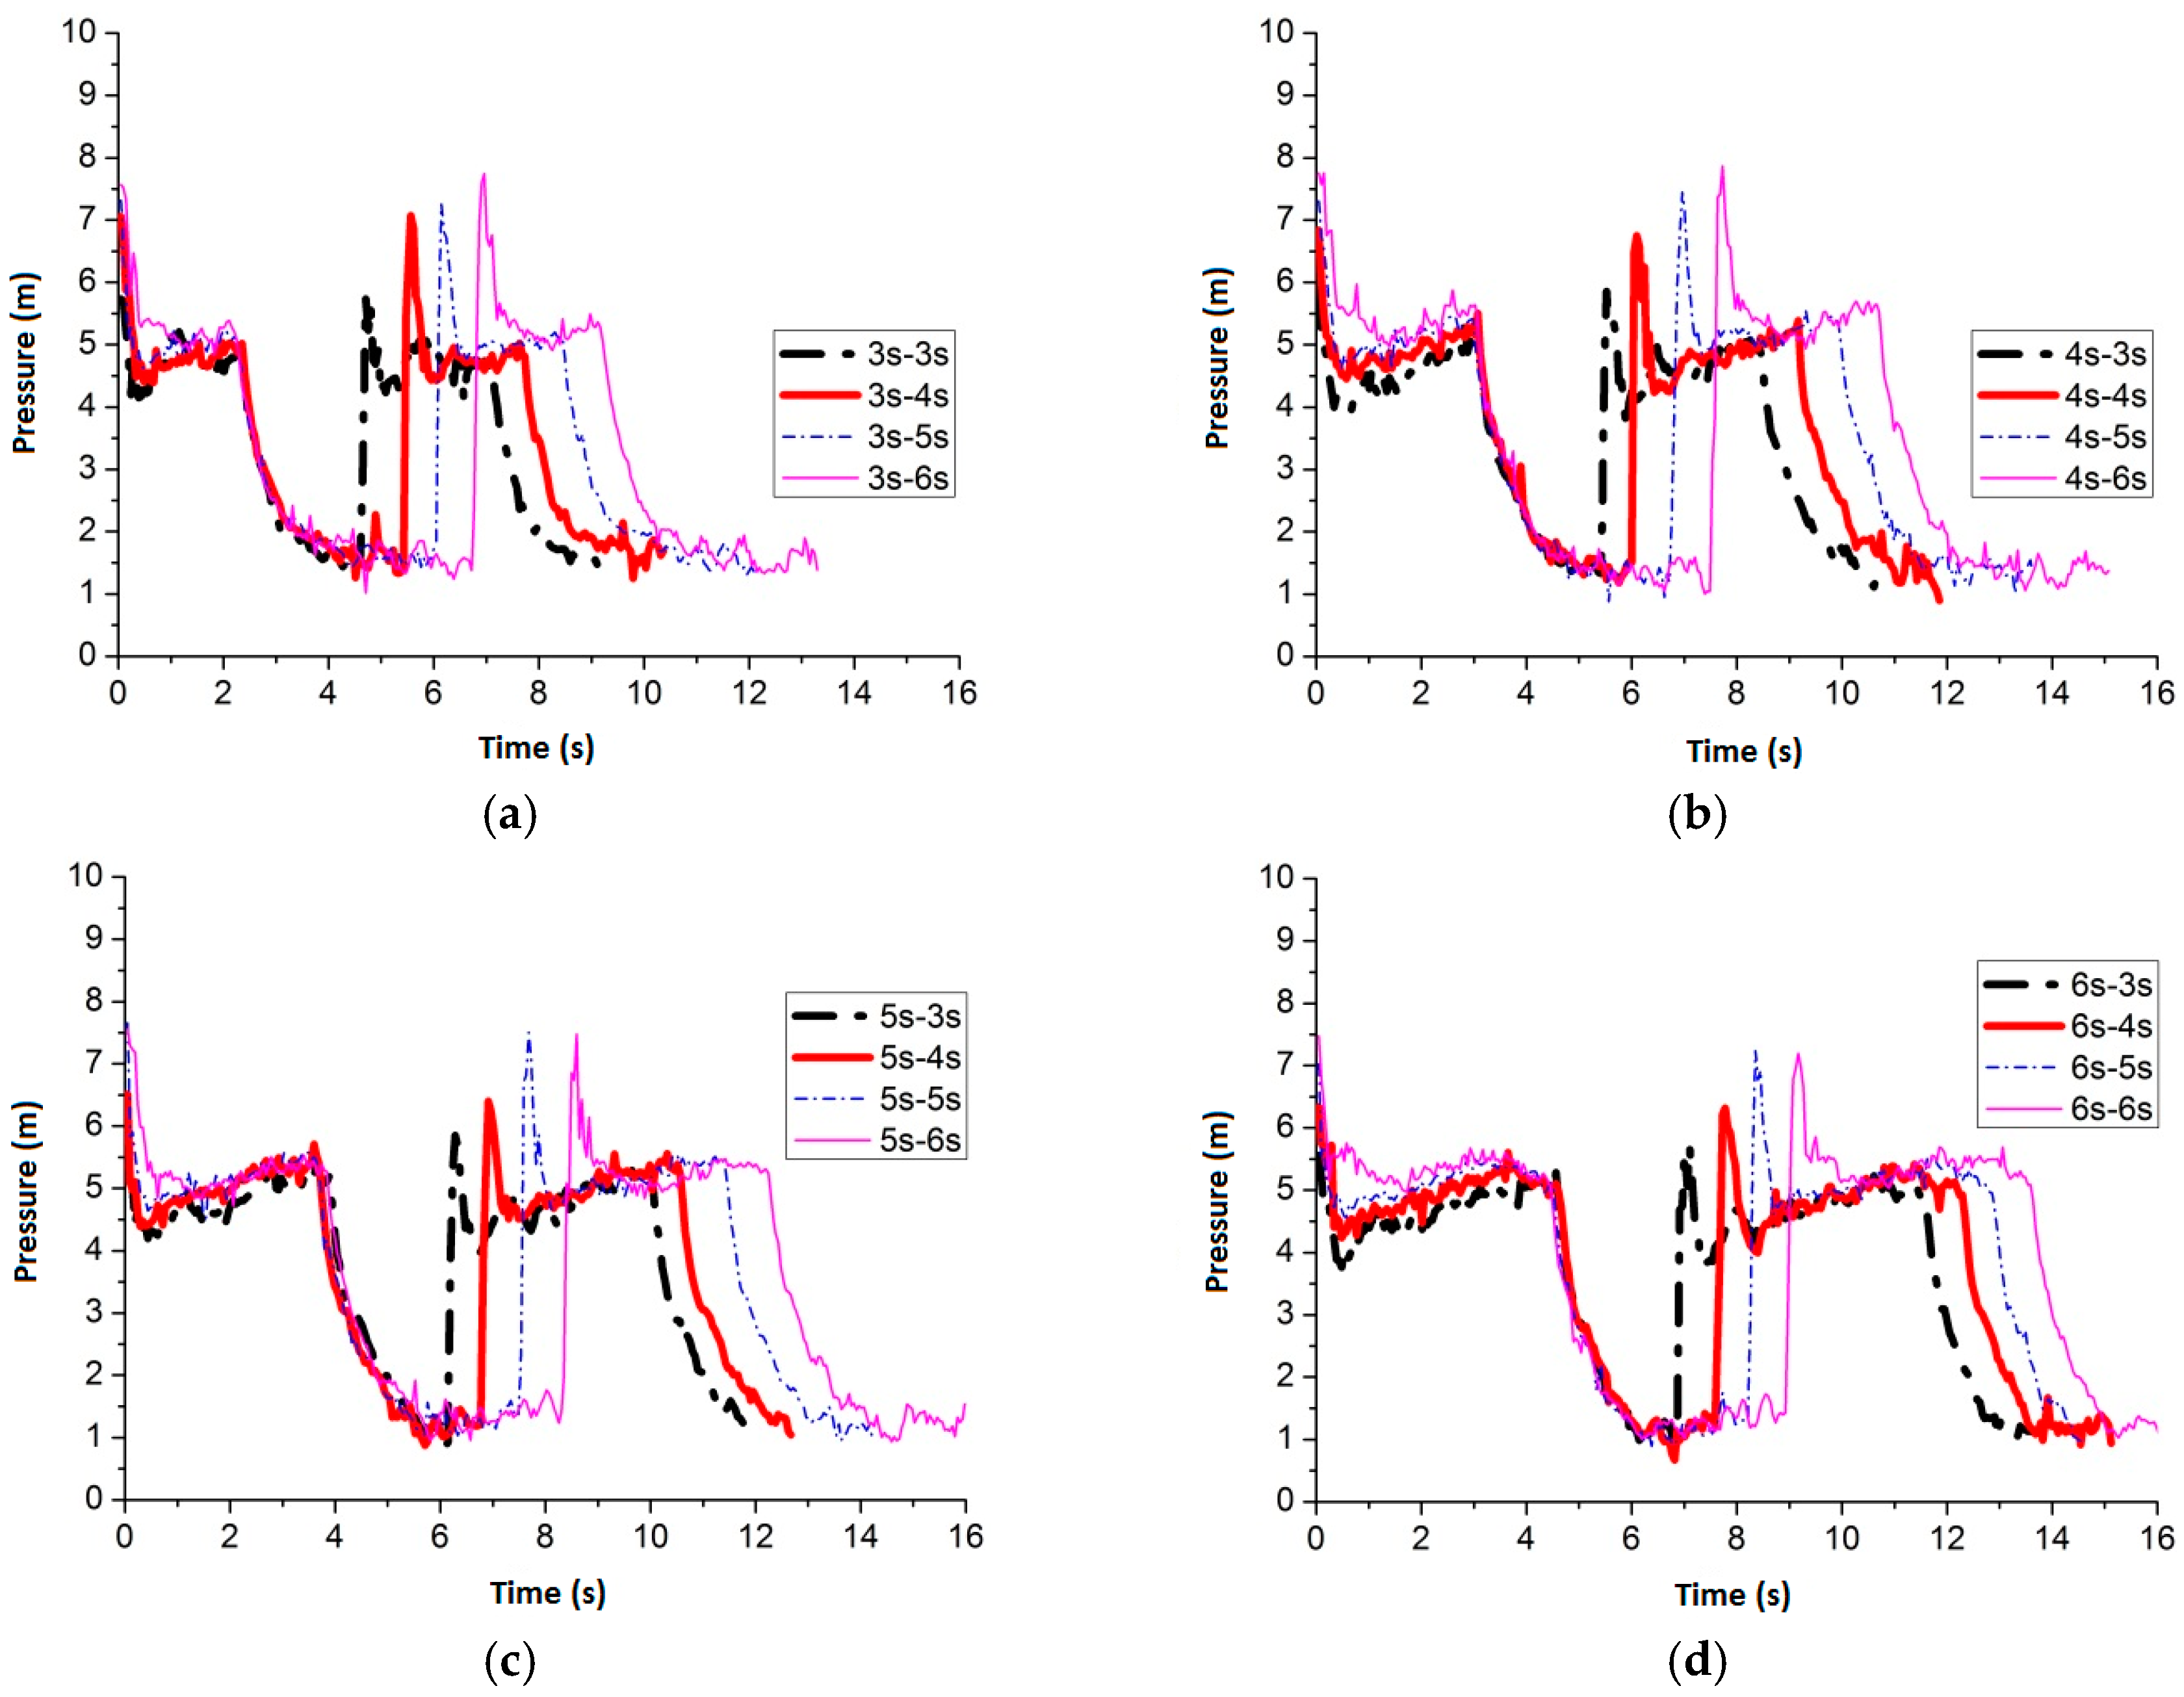
Figure 3.
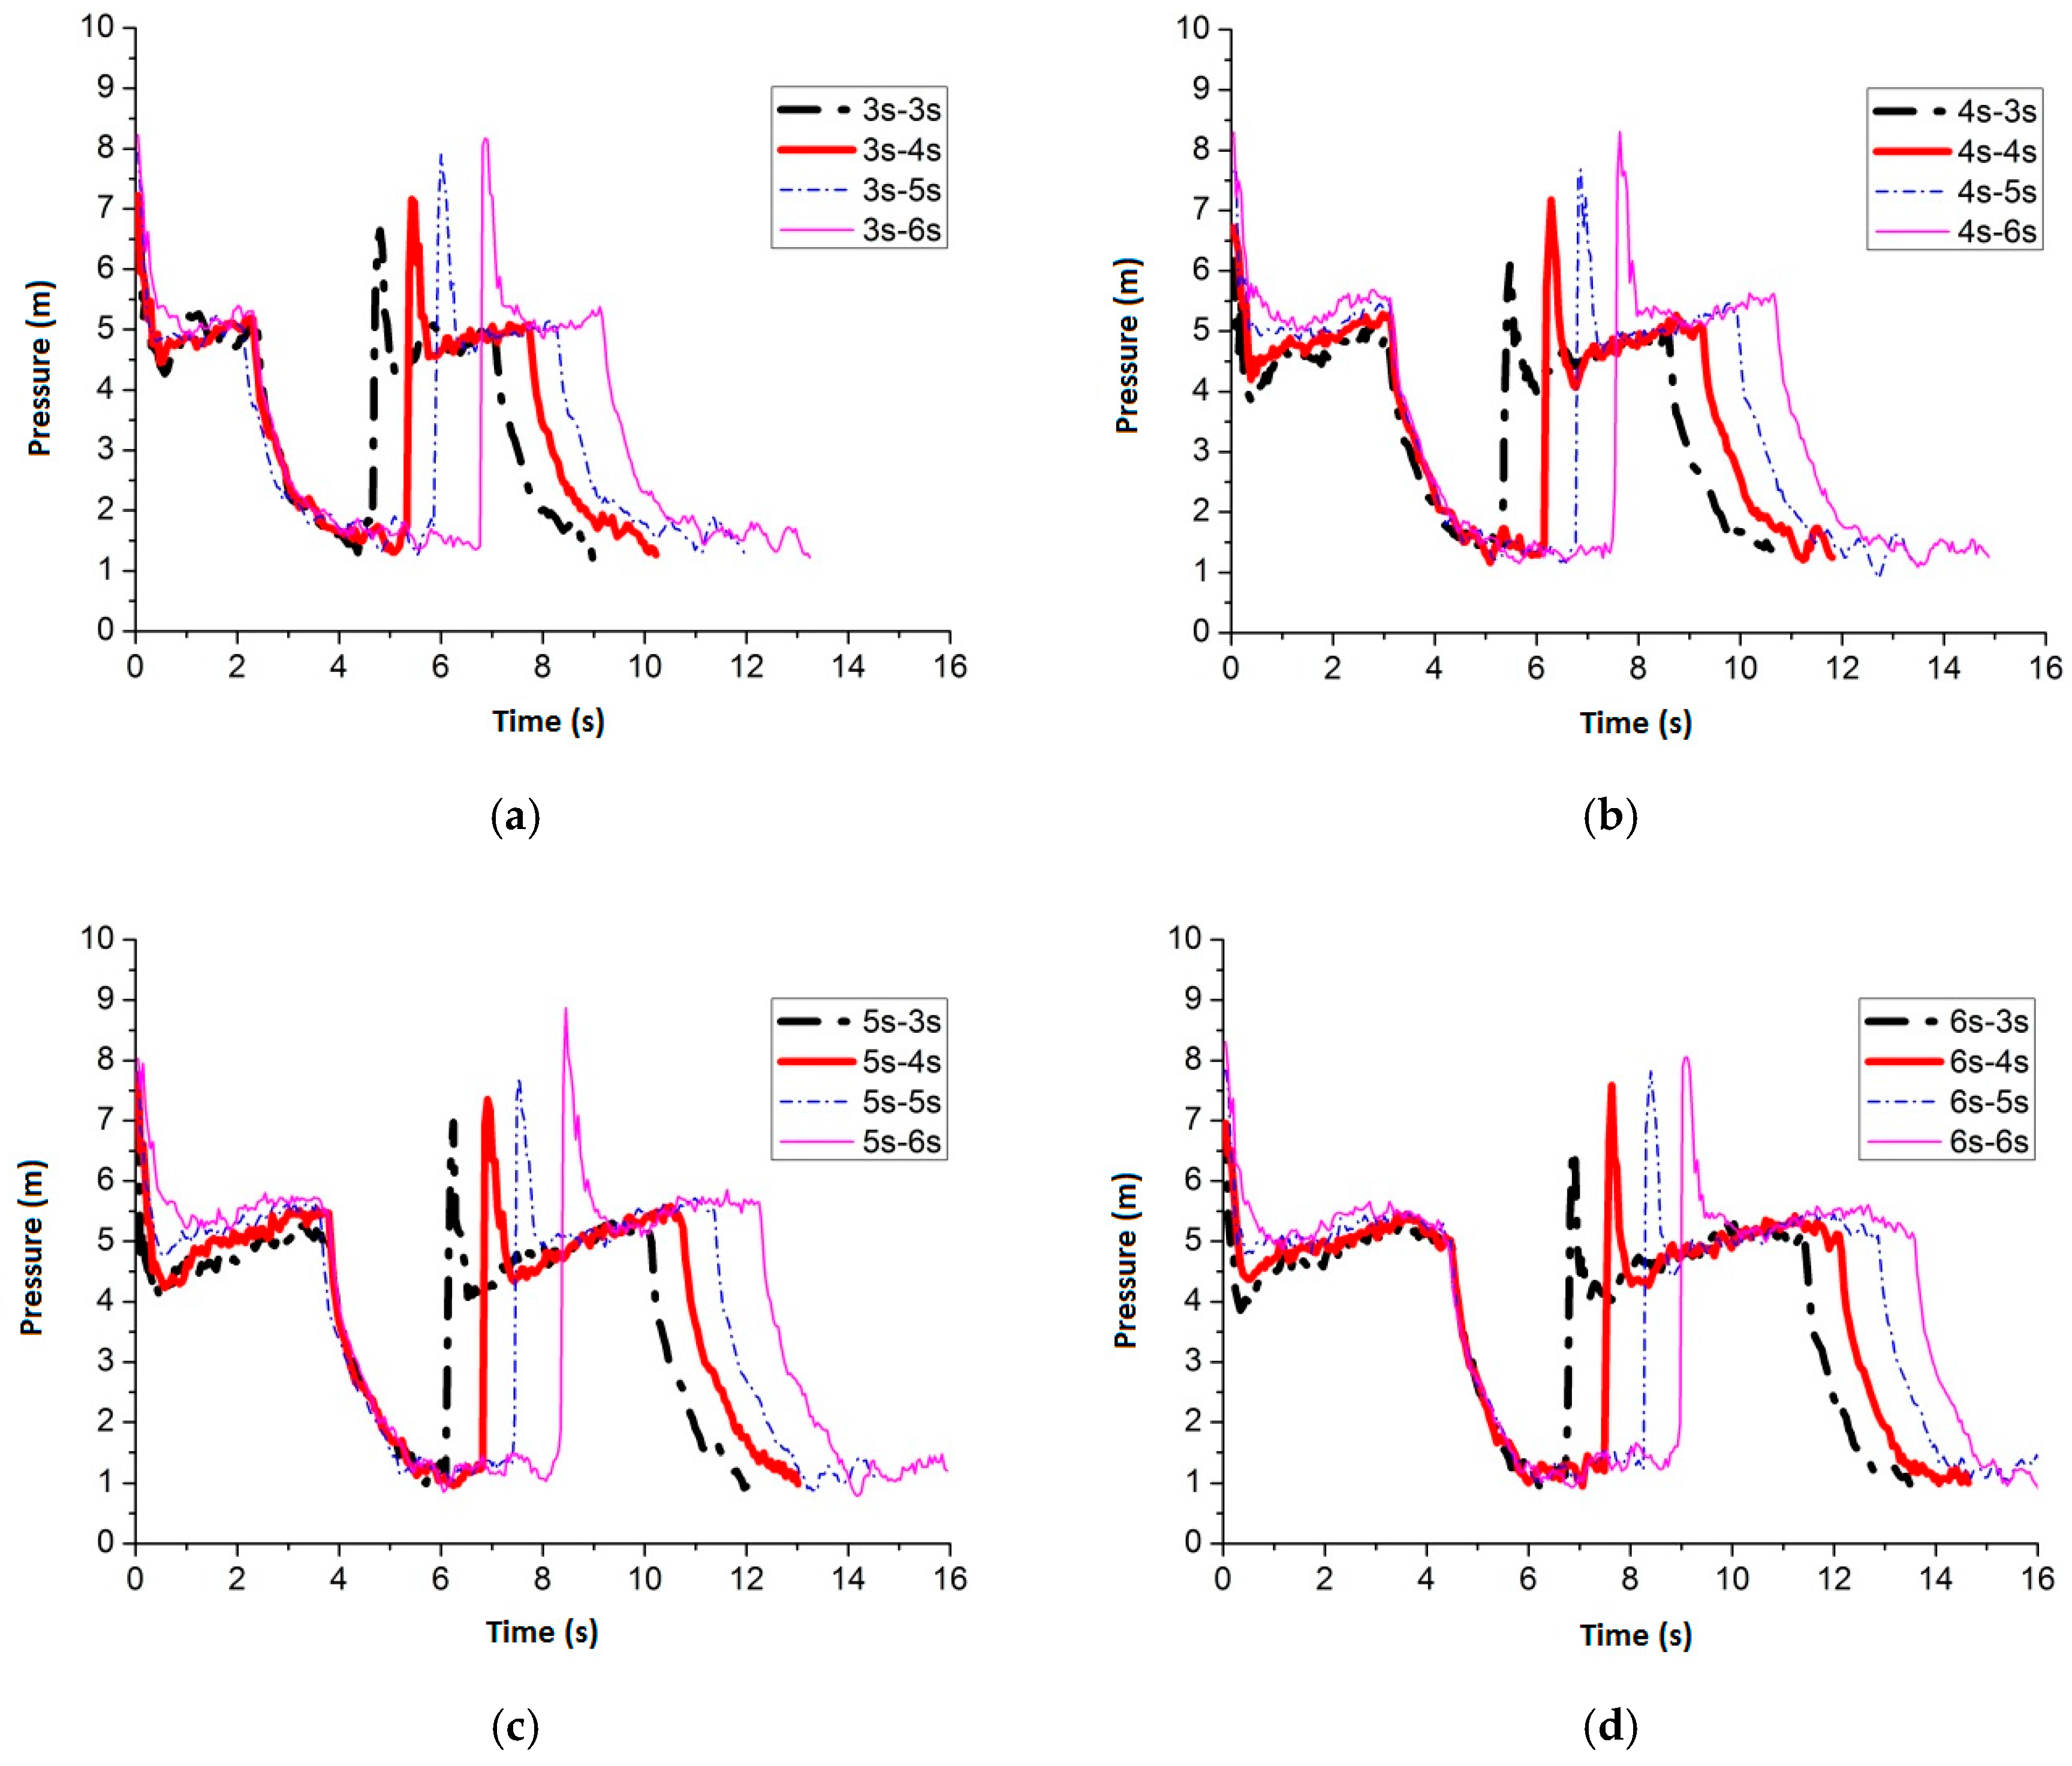
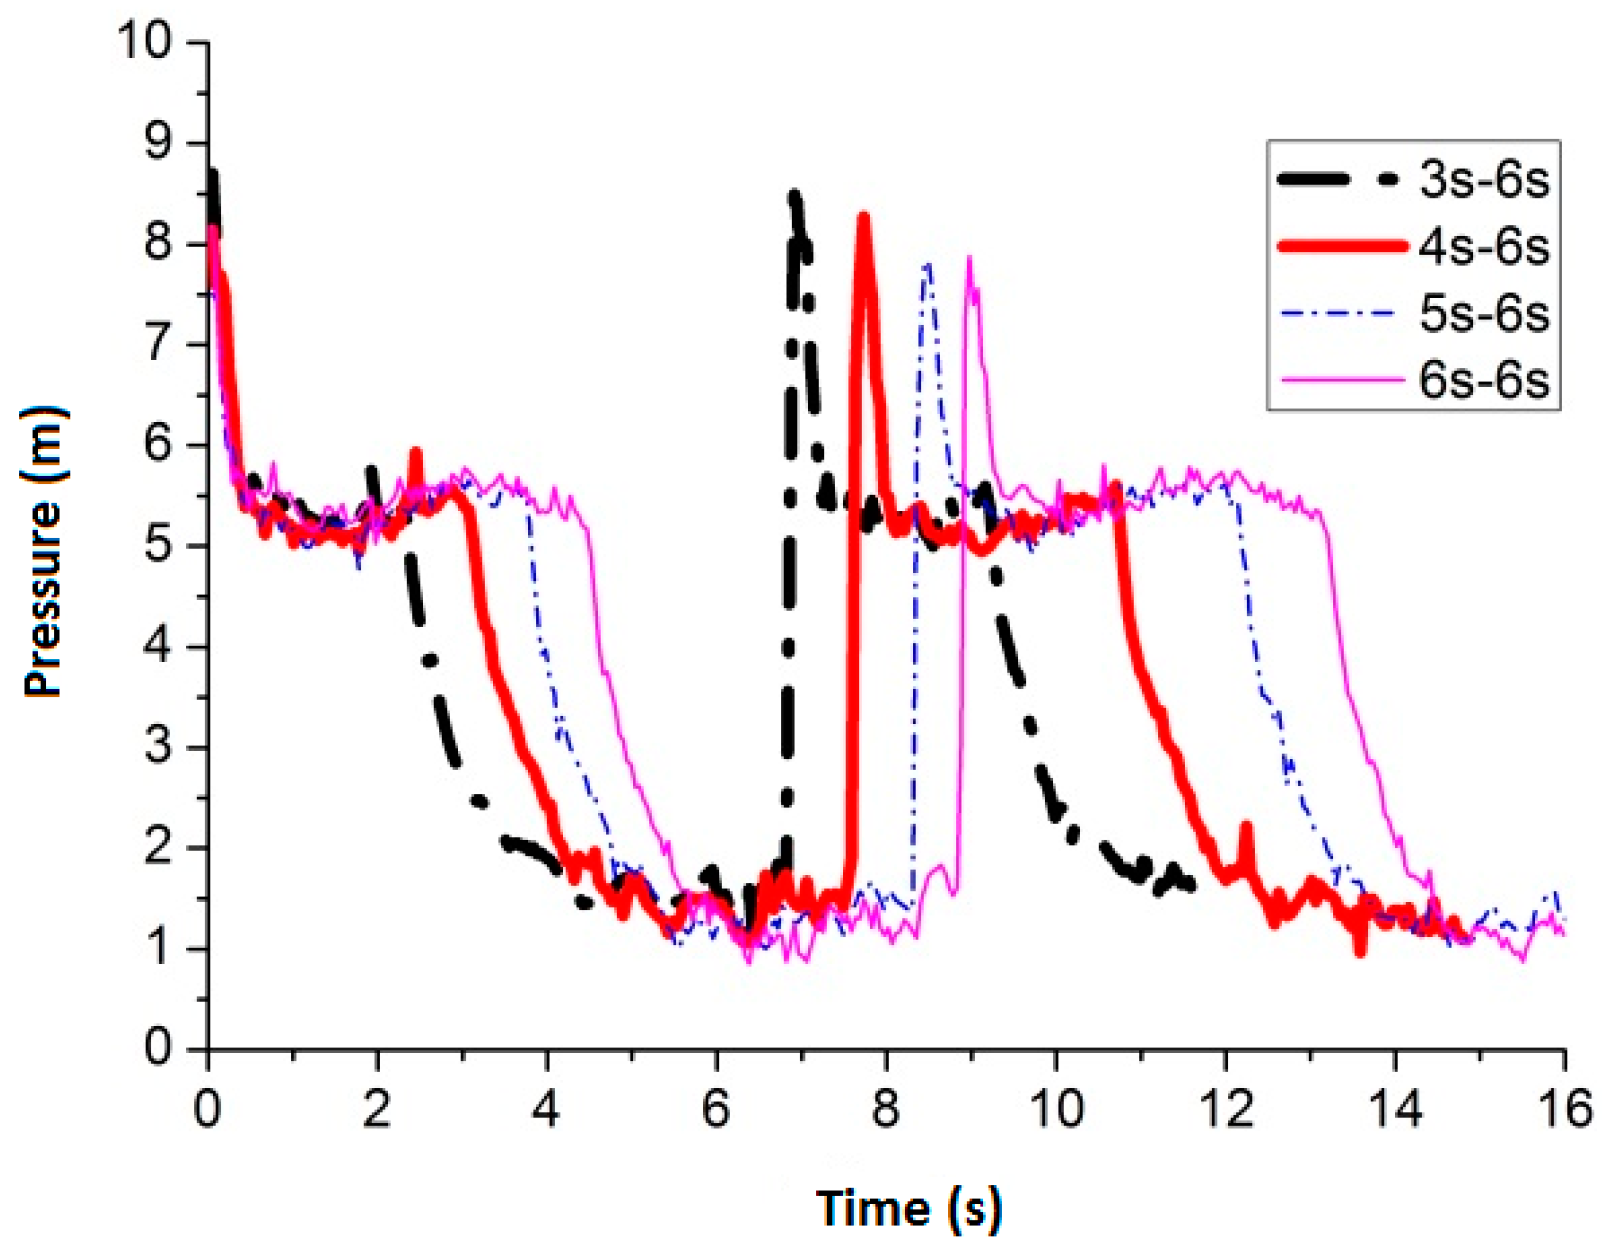
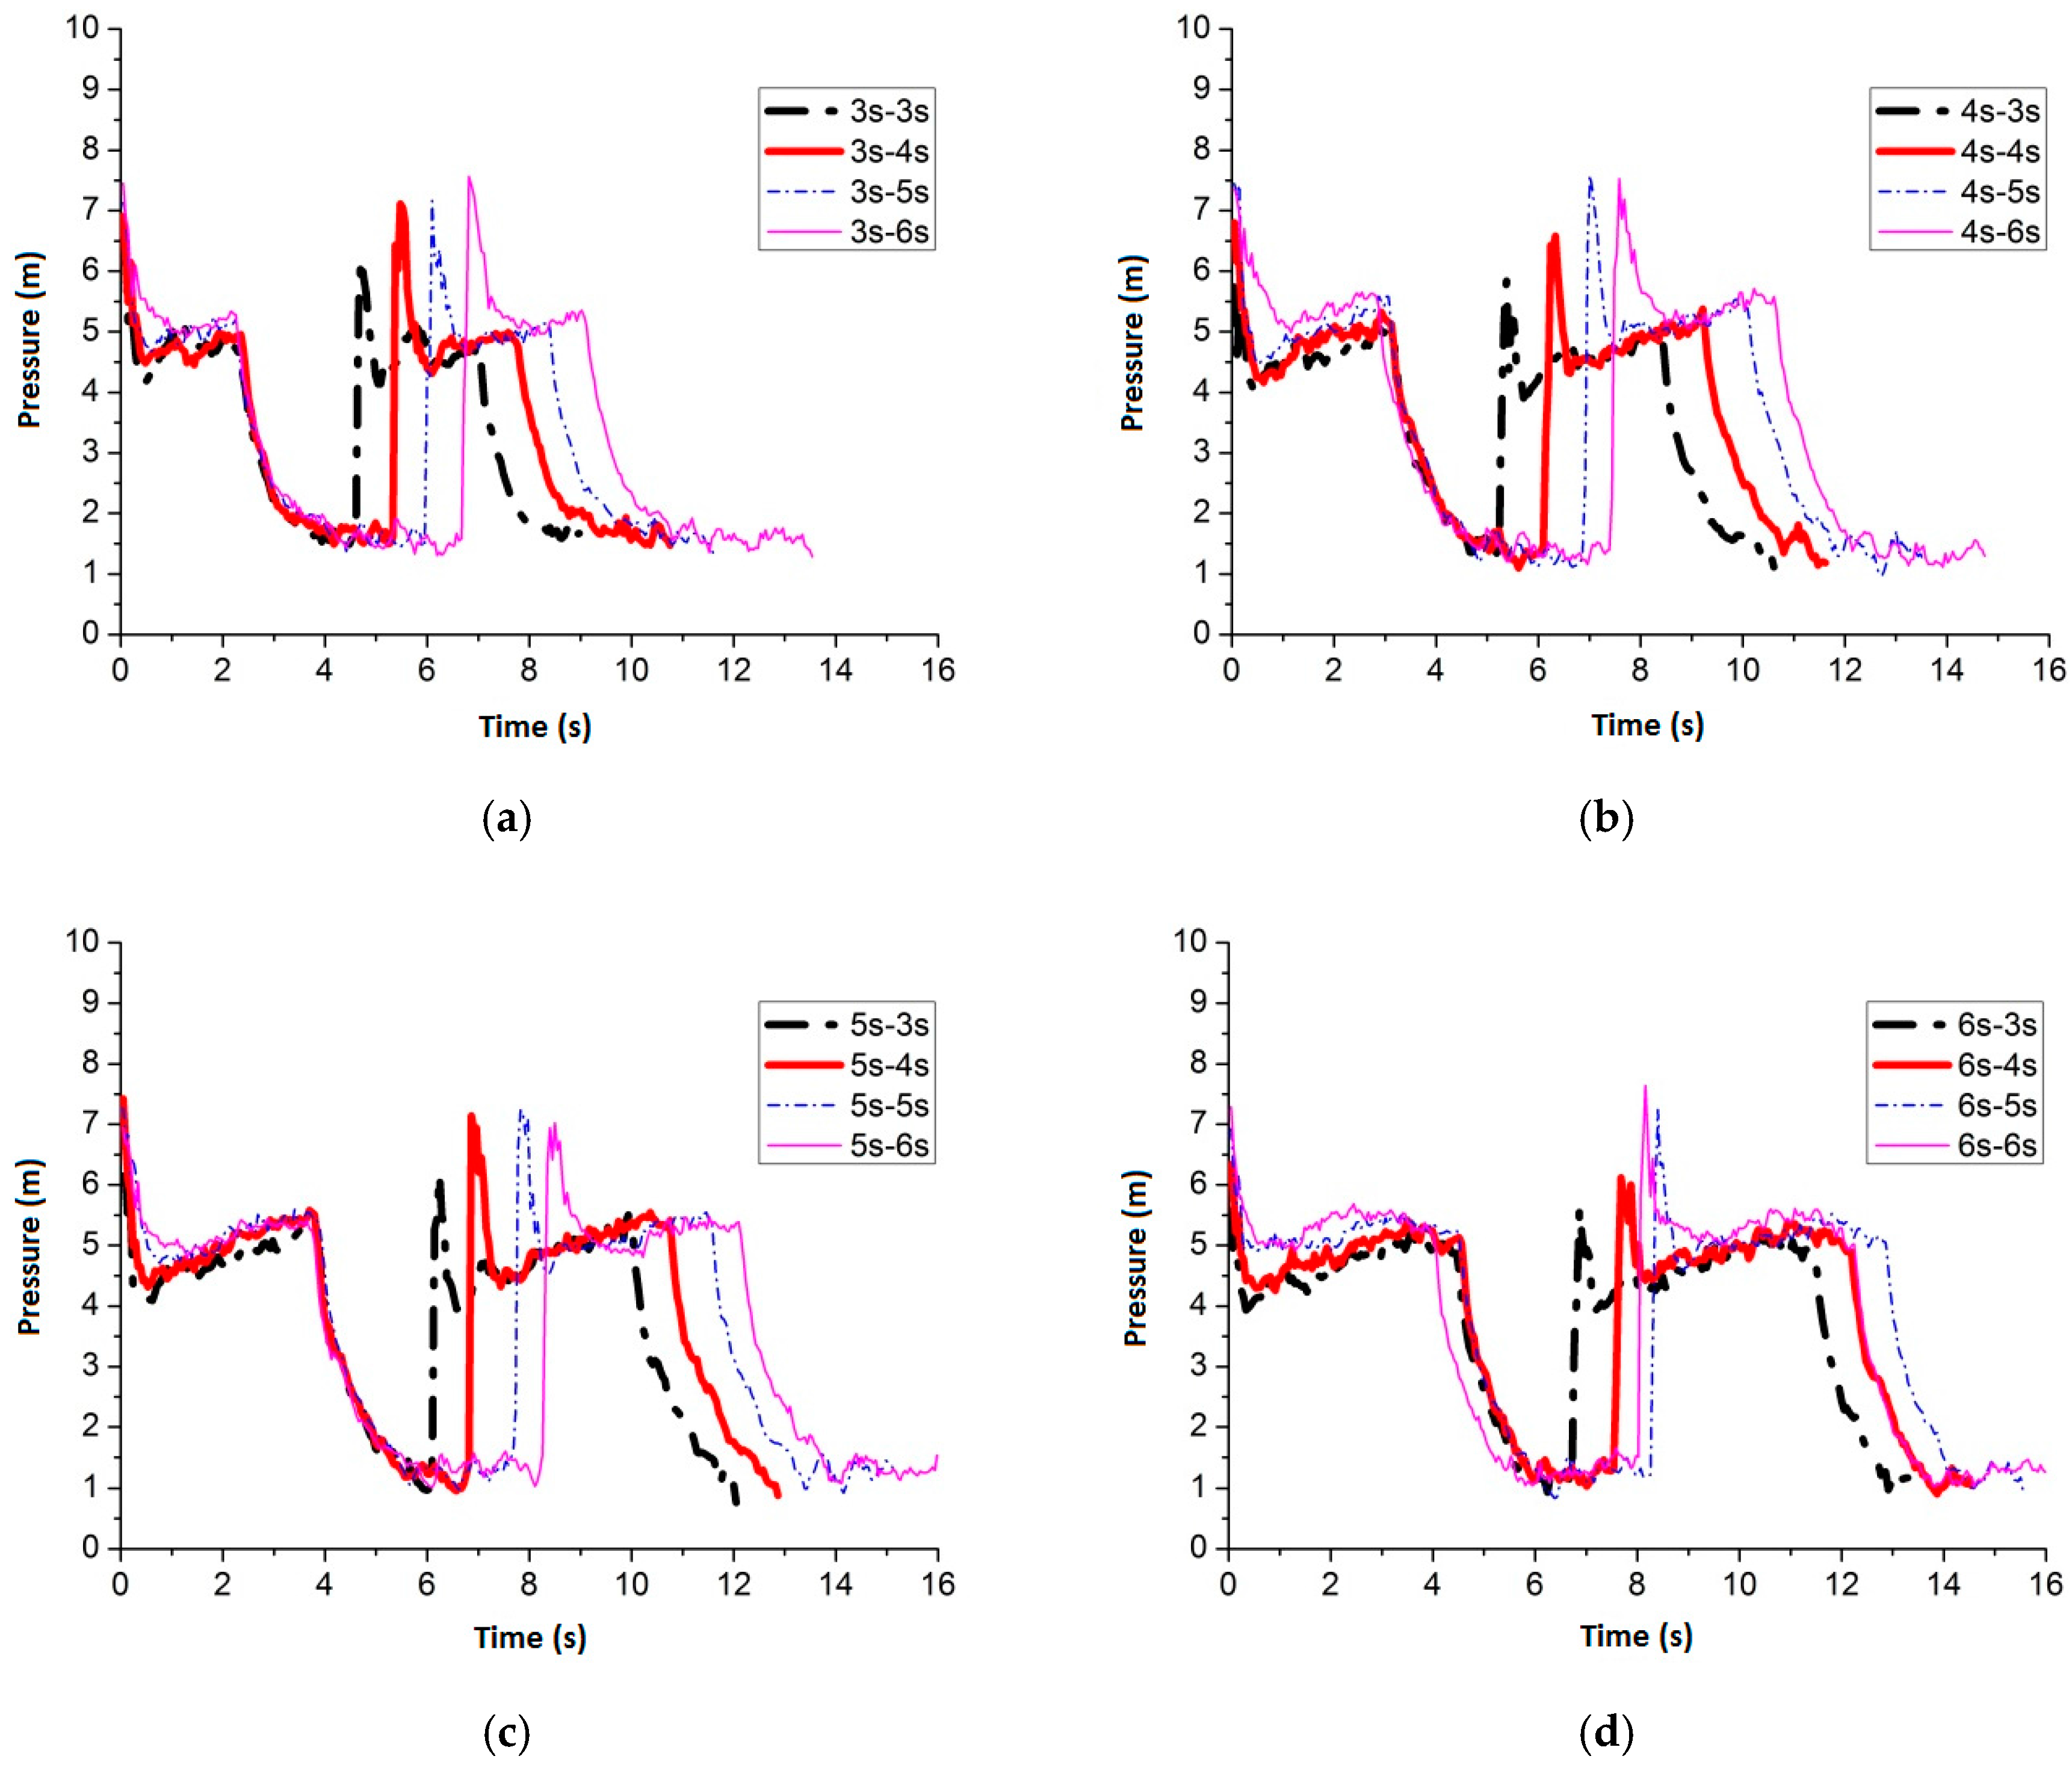
Pressure fluctuation of No. 1 sensing point (round nozzle is in the middle of the pipe): (a) air inflow time is 3 s; (b) air inflow time is 4 s; (c) air inflow time is 5 s; and (d) air inflow time is 6 s.
Figure 3.
Pressure fluctuation of No. 1 sensing point (round nozzle is in the middle of the pipe): (a) air inflow time is 3 s; (b) air inflow time is 4 s; (c) air inflow time is 5 s; and (d) air inflow time is 6 s.
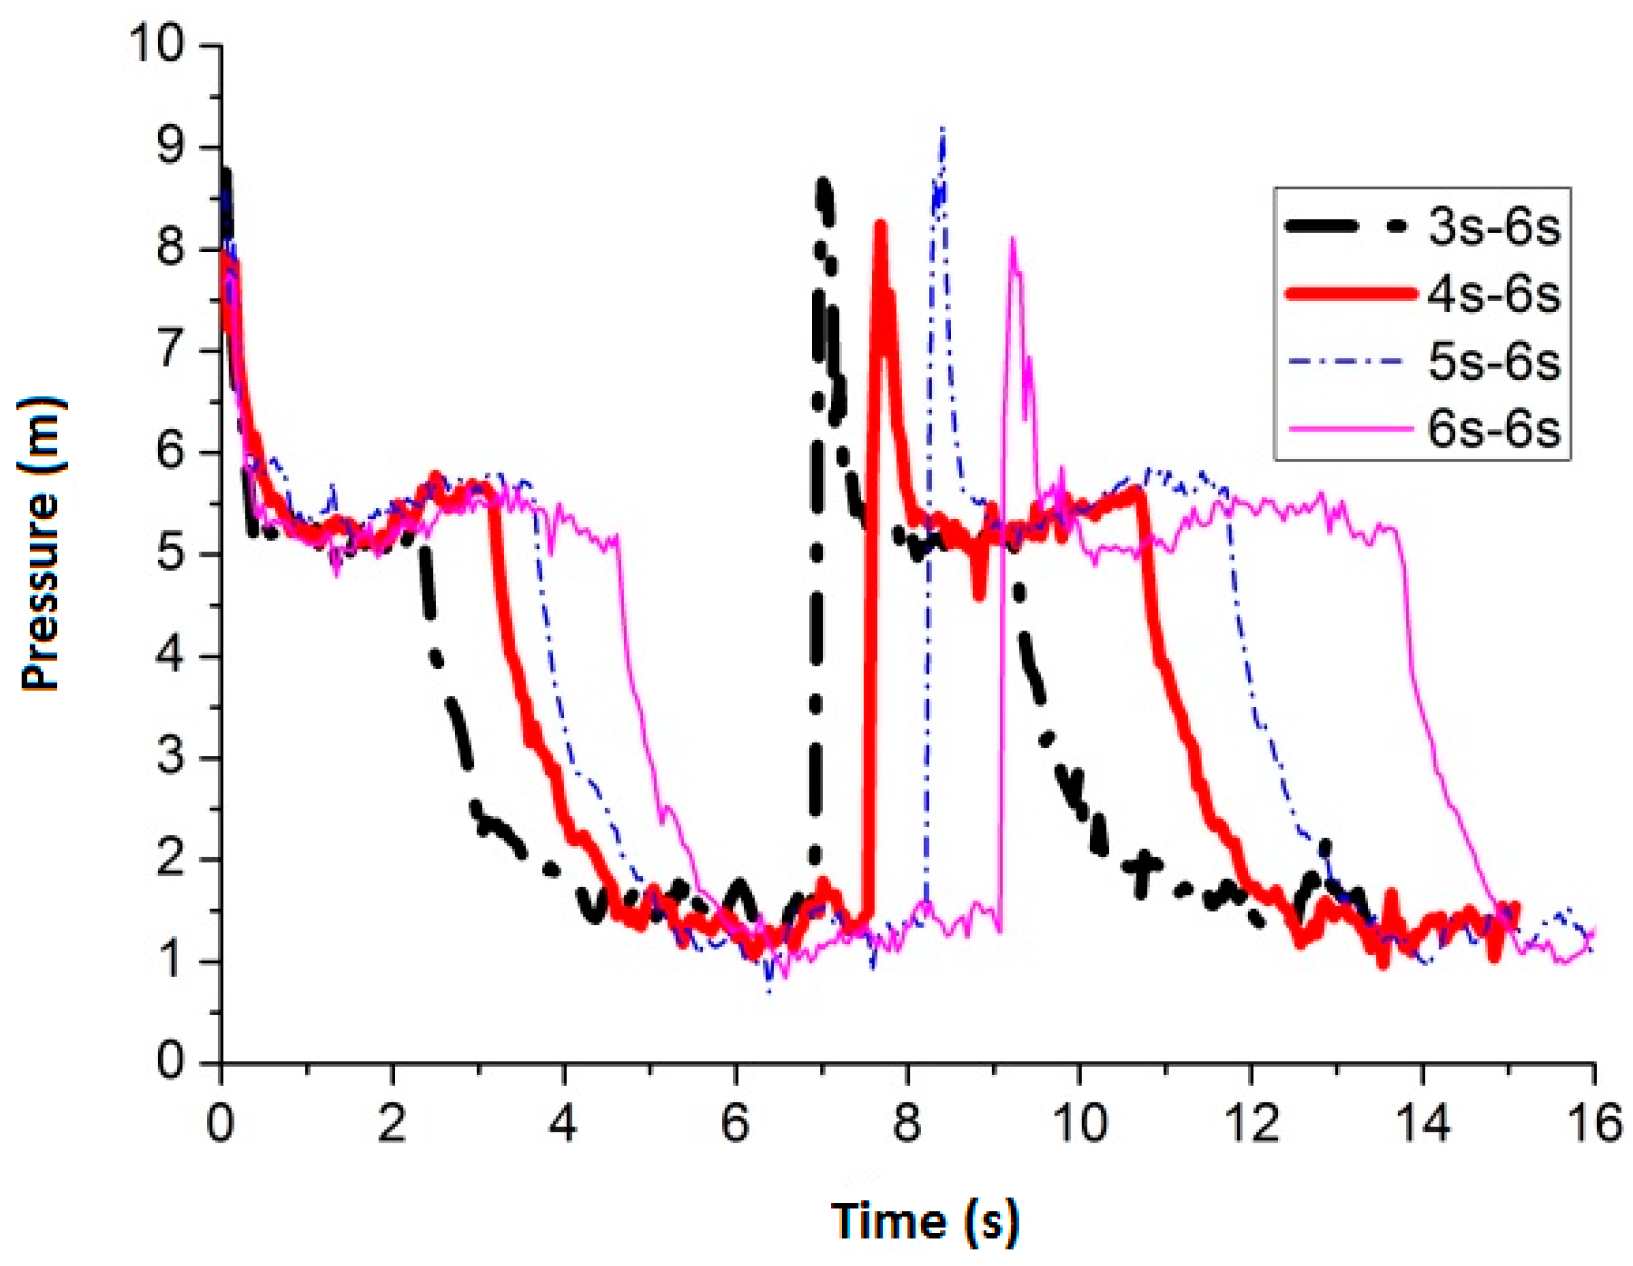
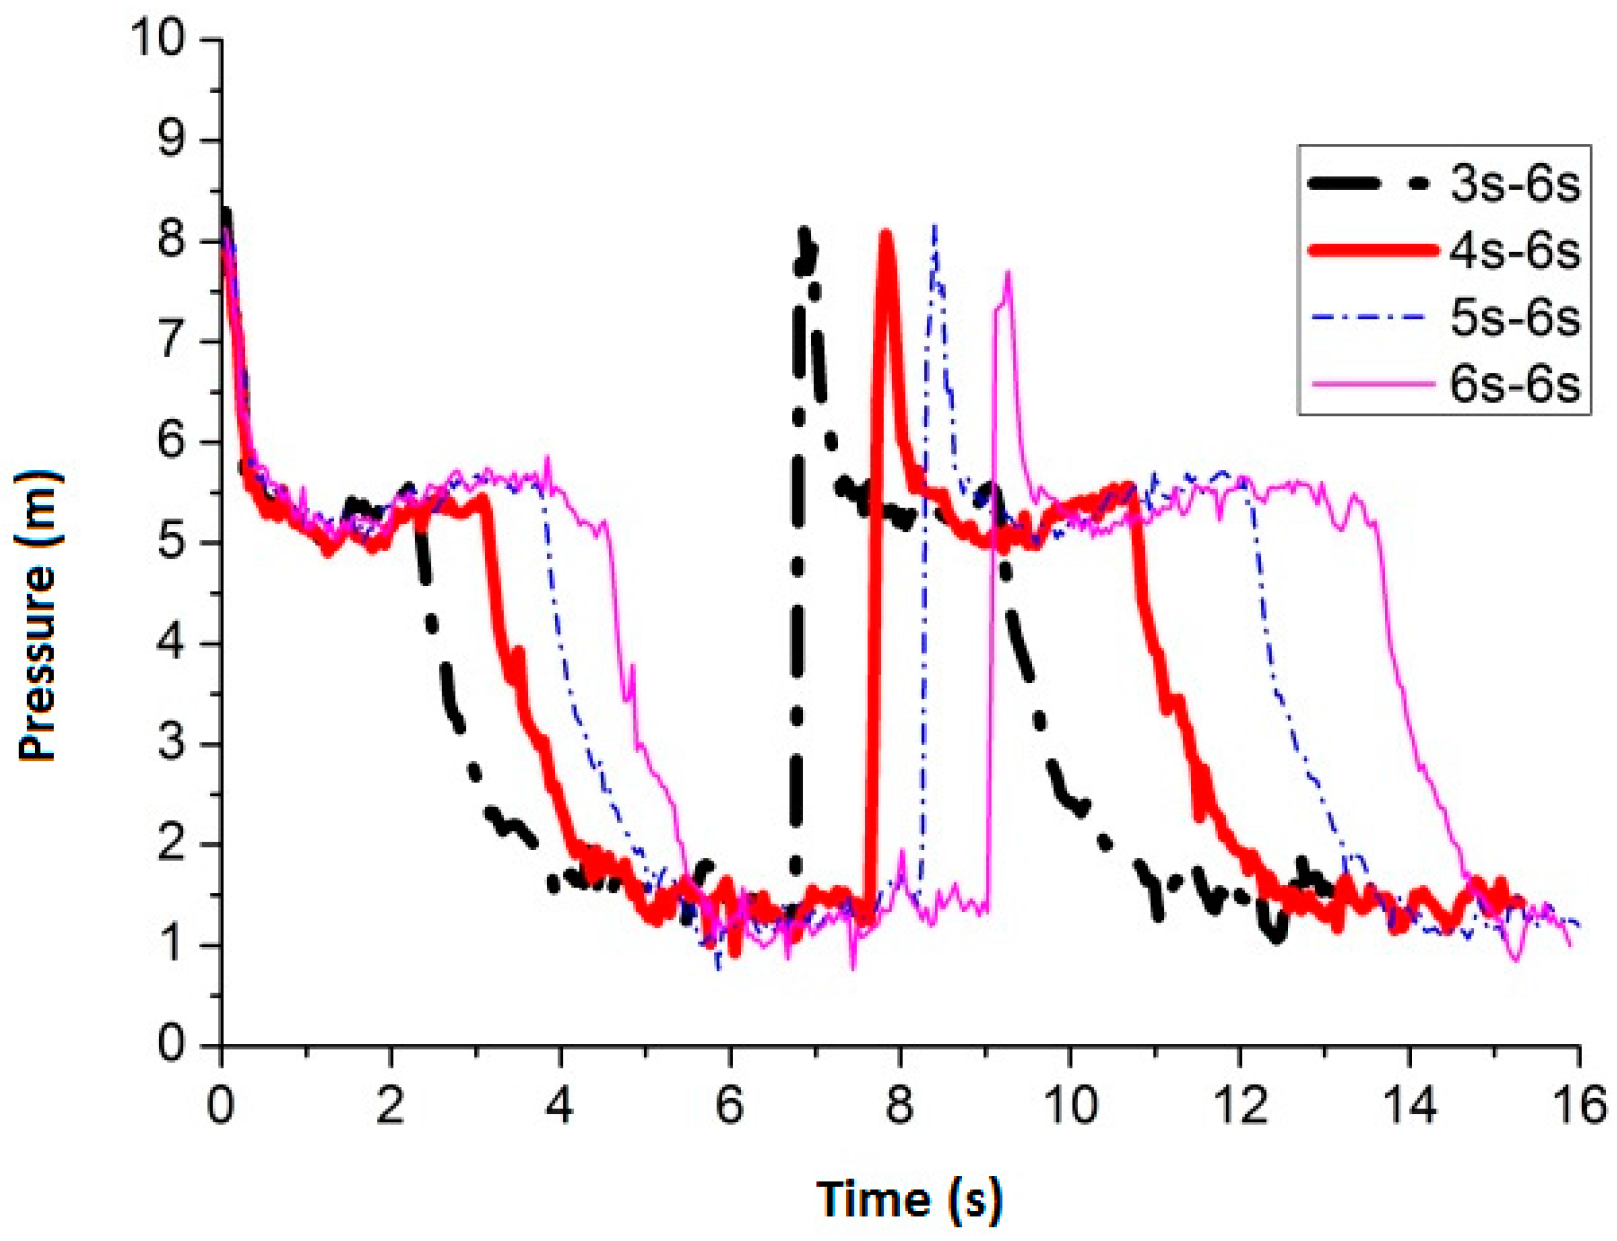
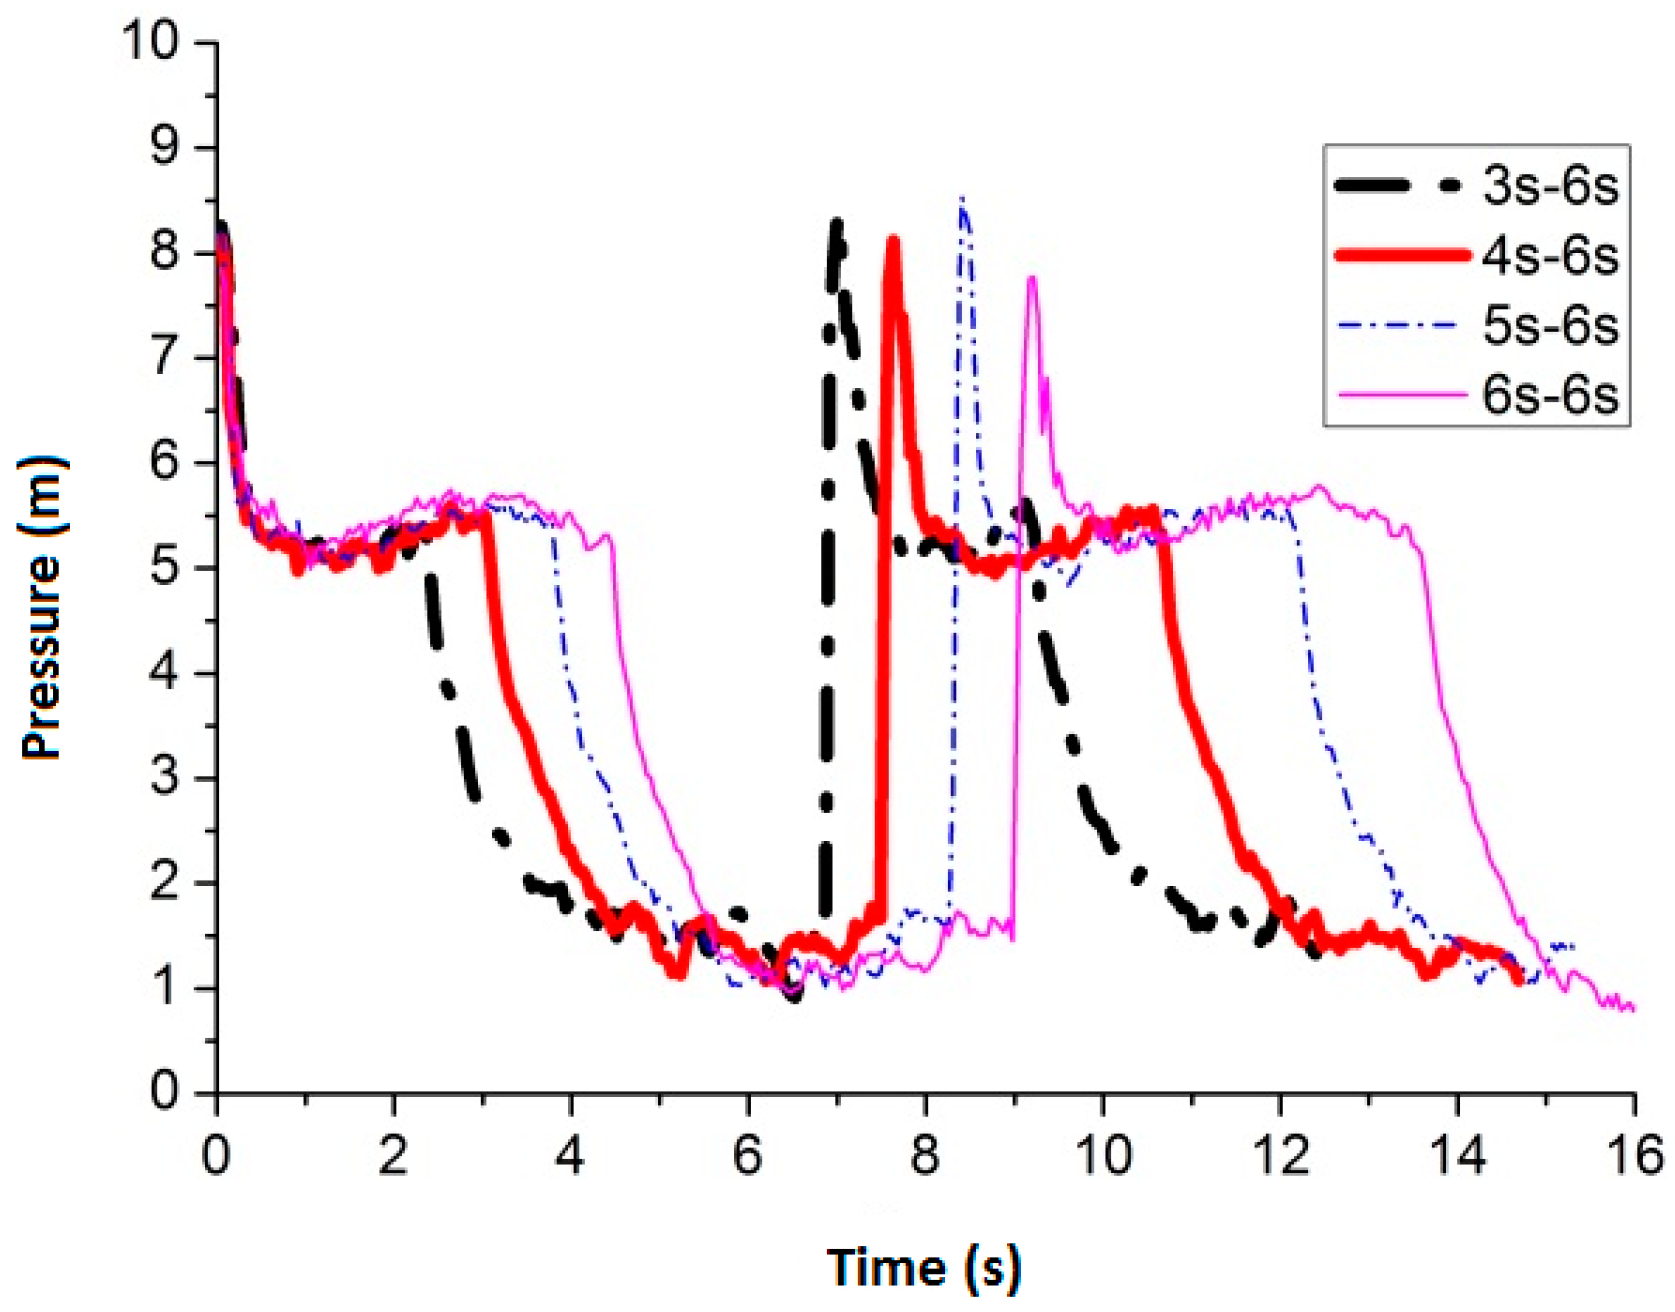
Figure 4.
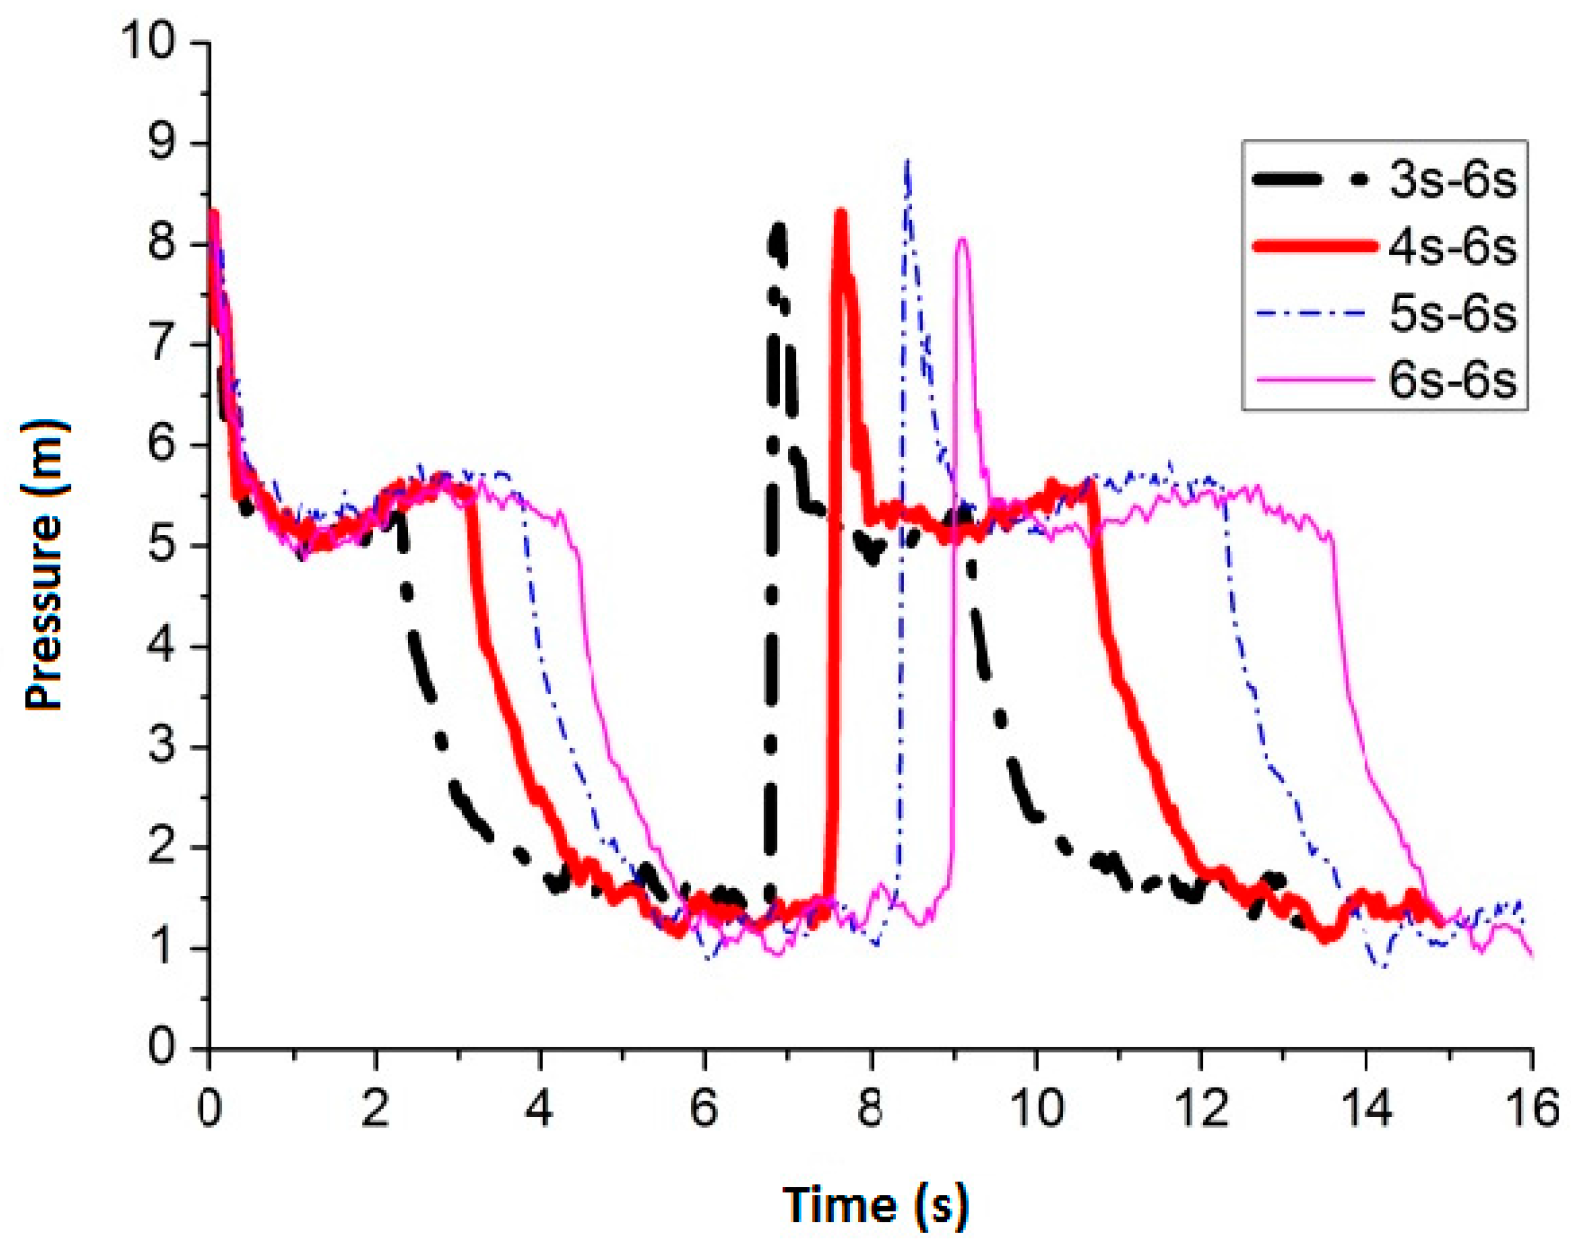
The four best pressure values (round nozzle in the middle of the pipe).
Figure 4.
The four best pressure values (round nozzle in the middle of the pipe).
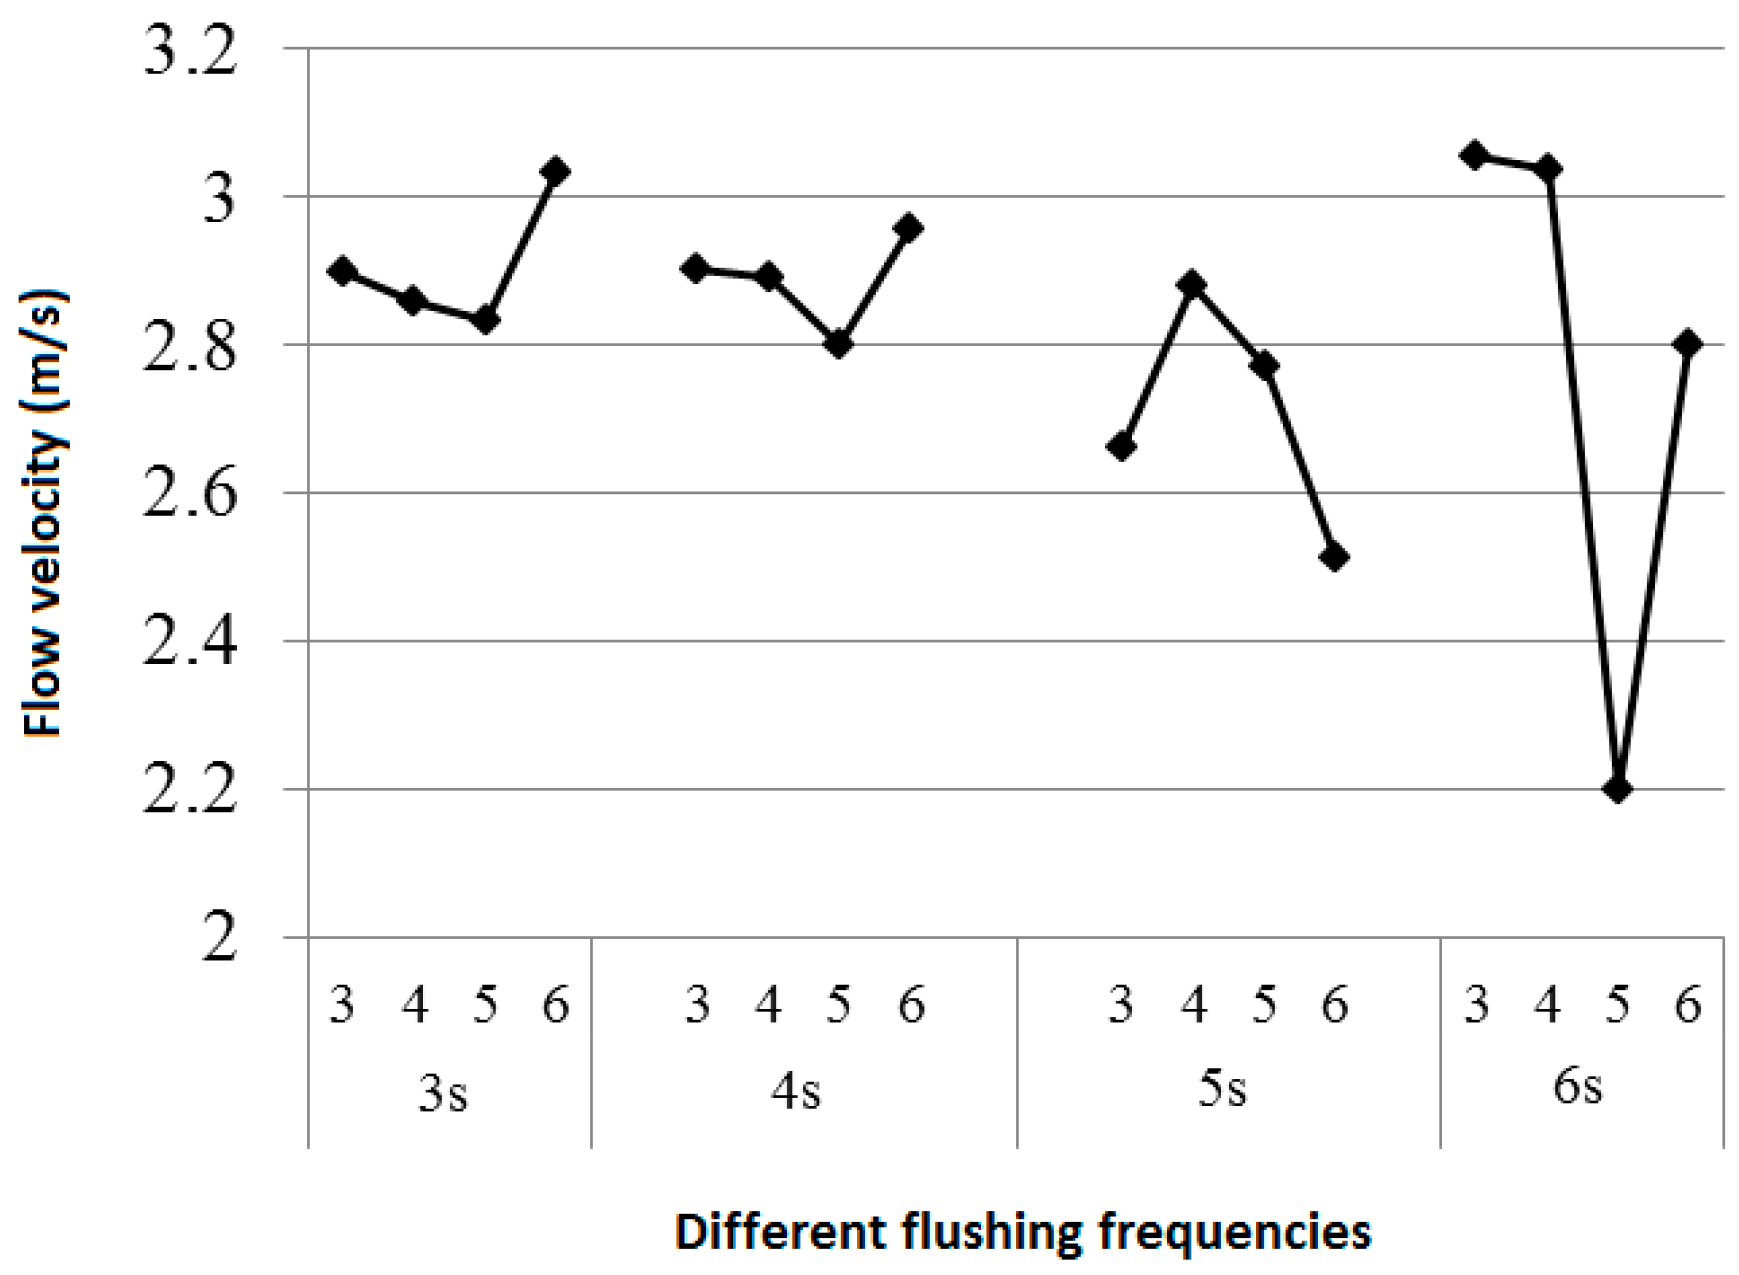
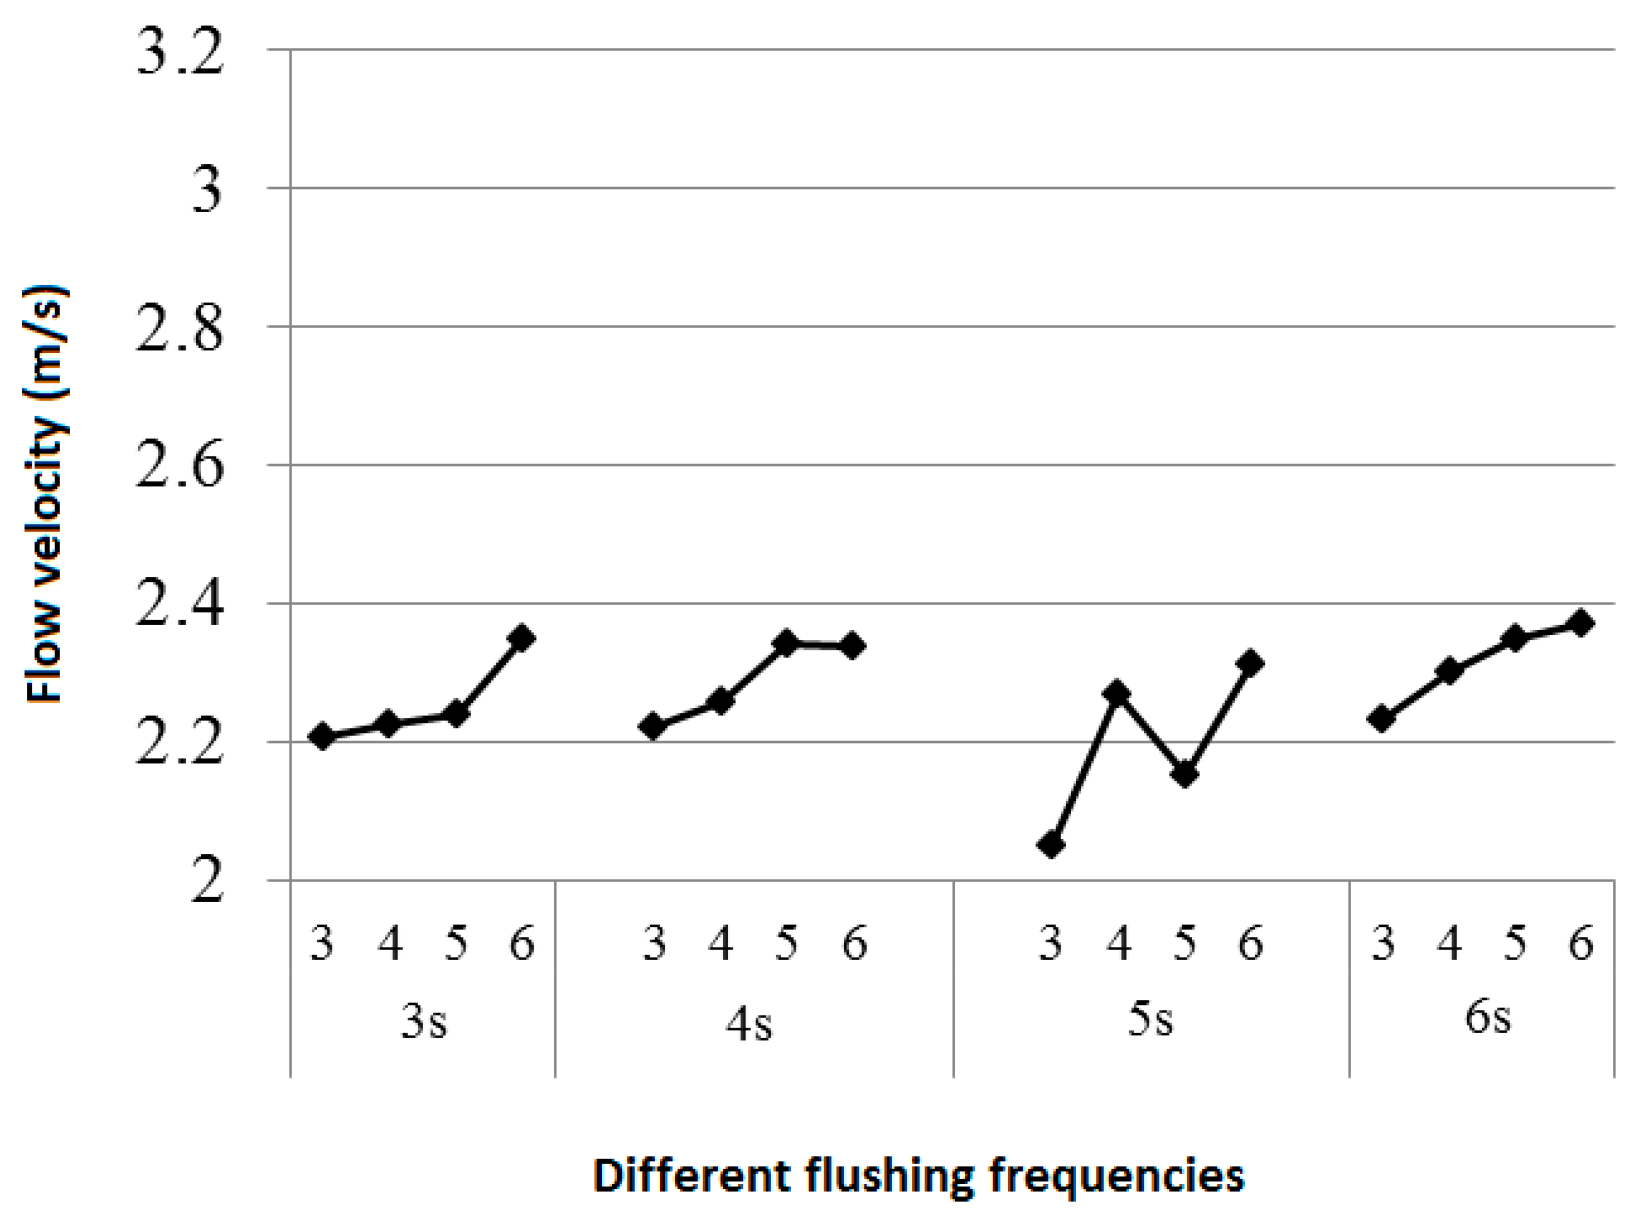
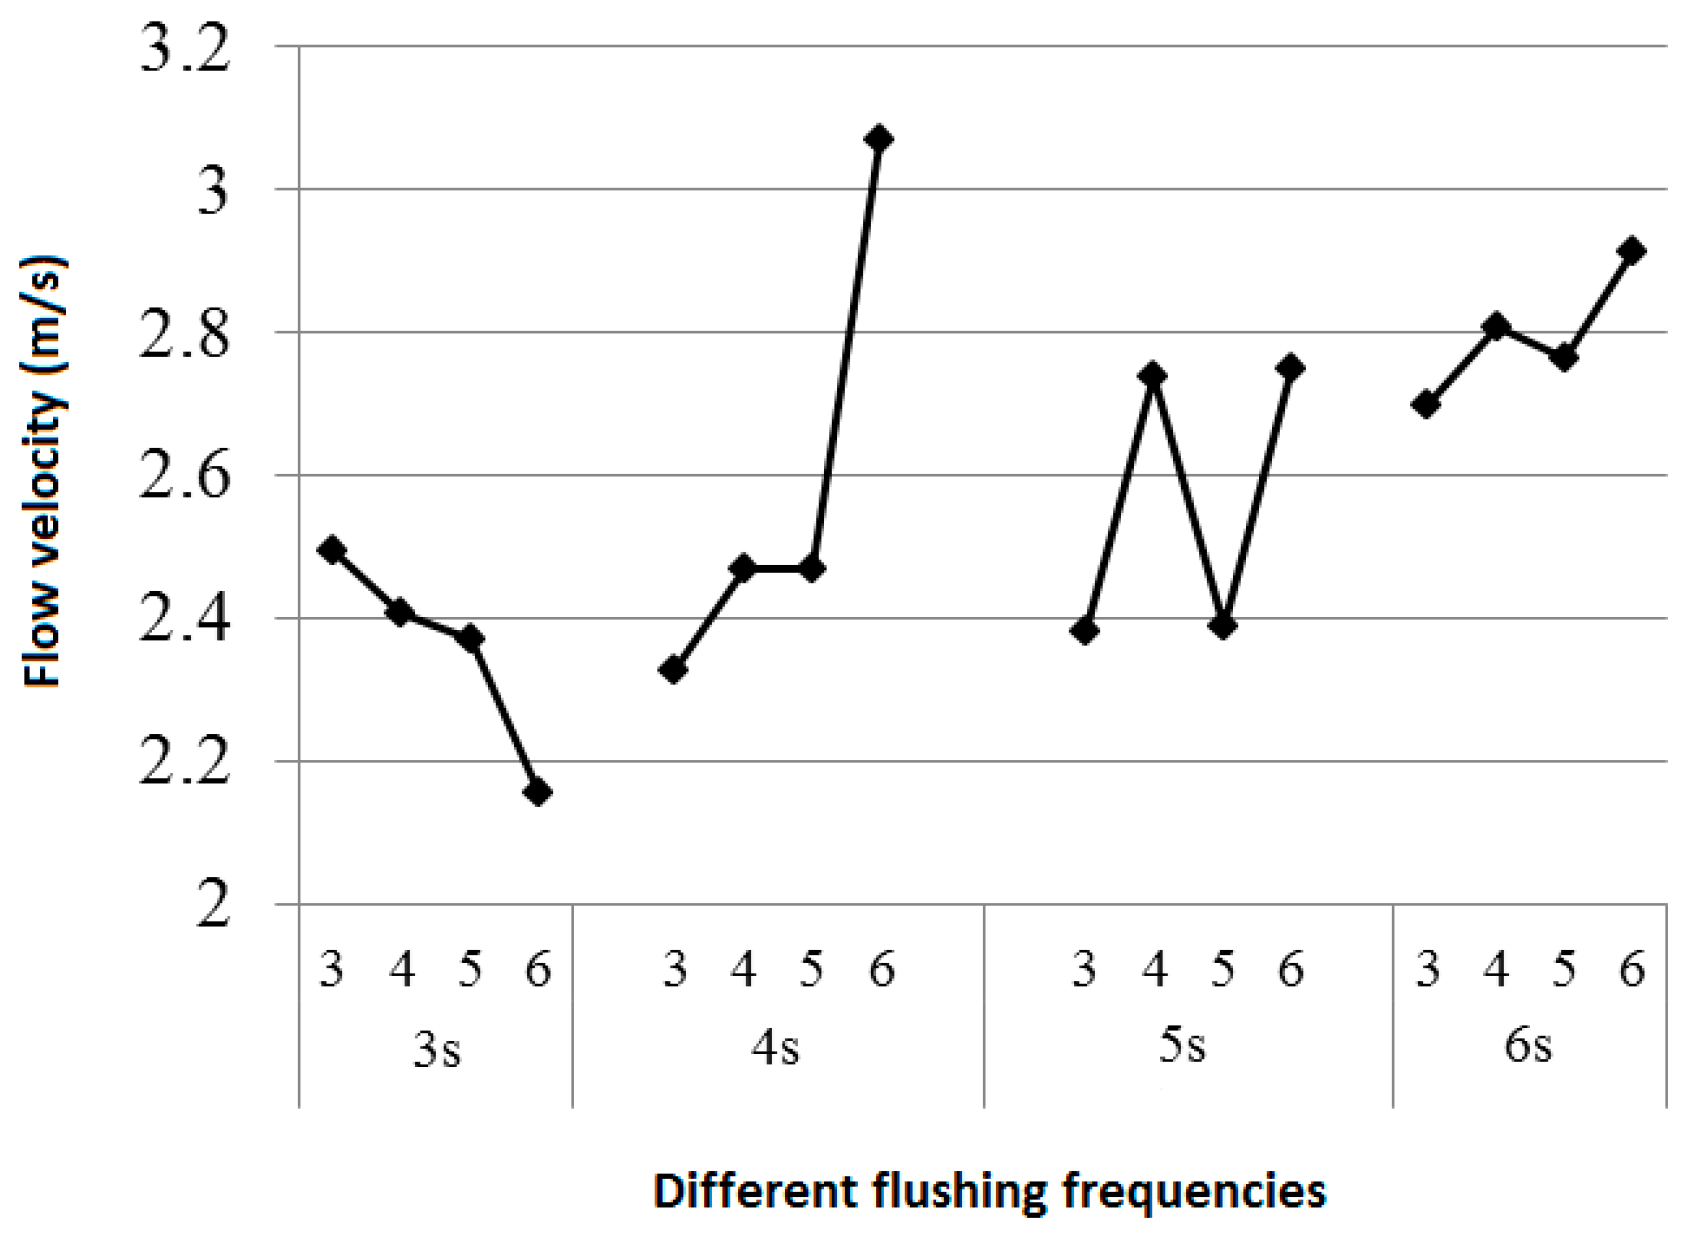
Figure 5.
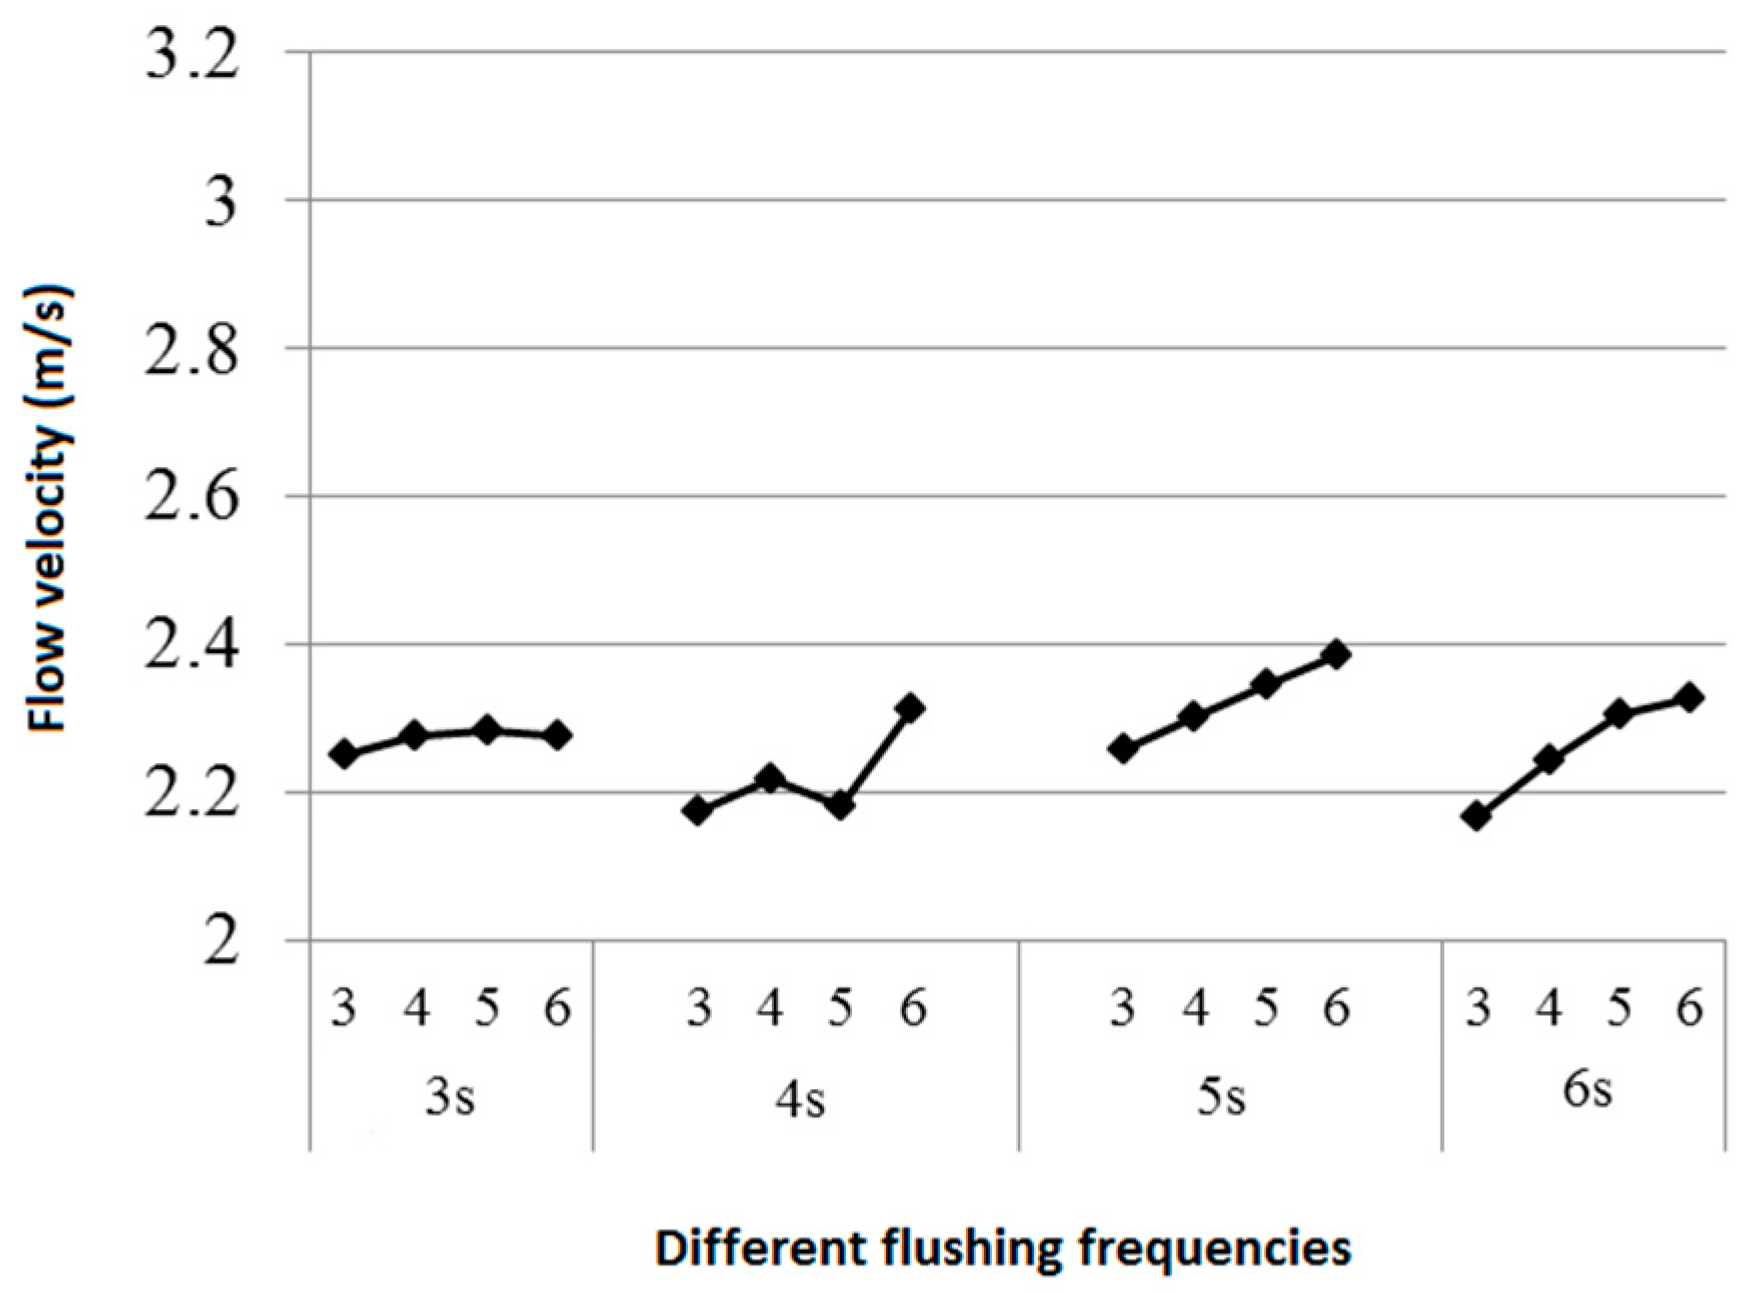
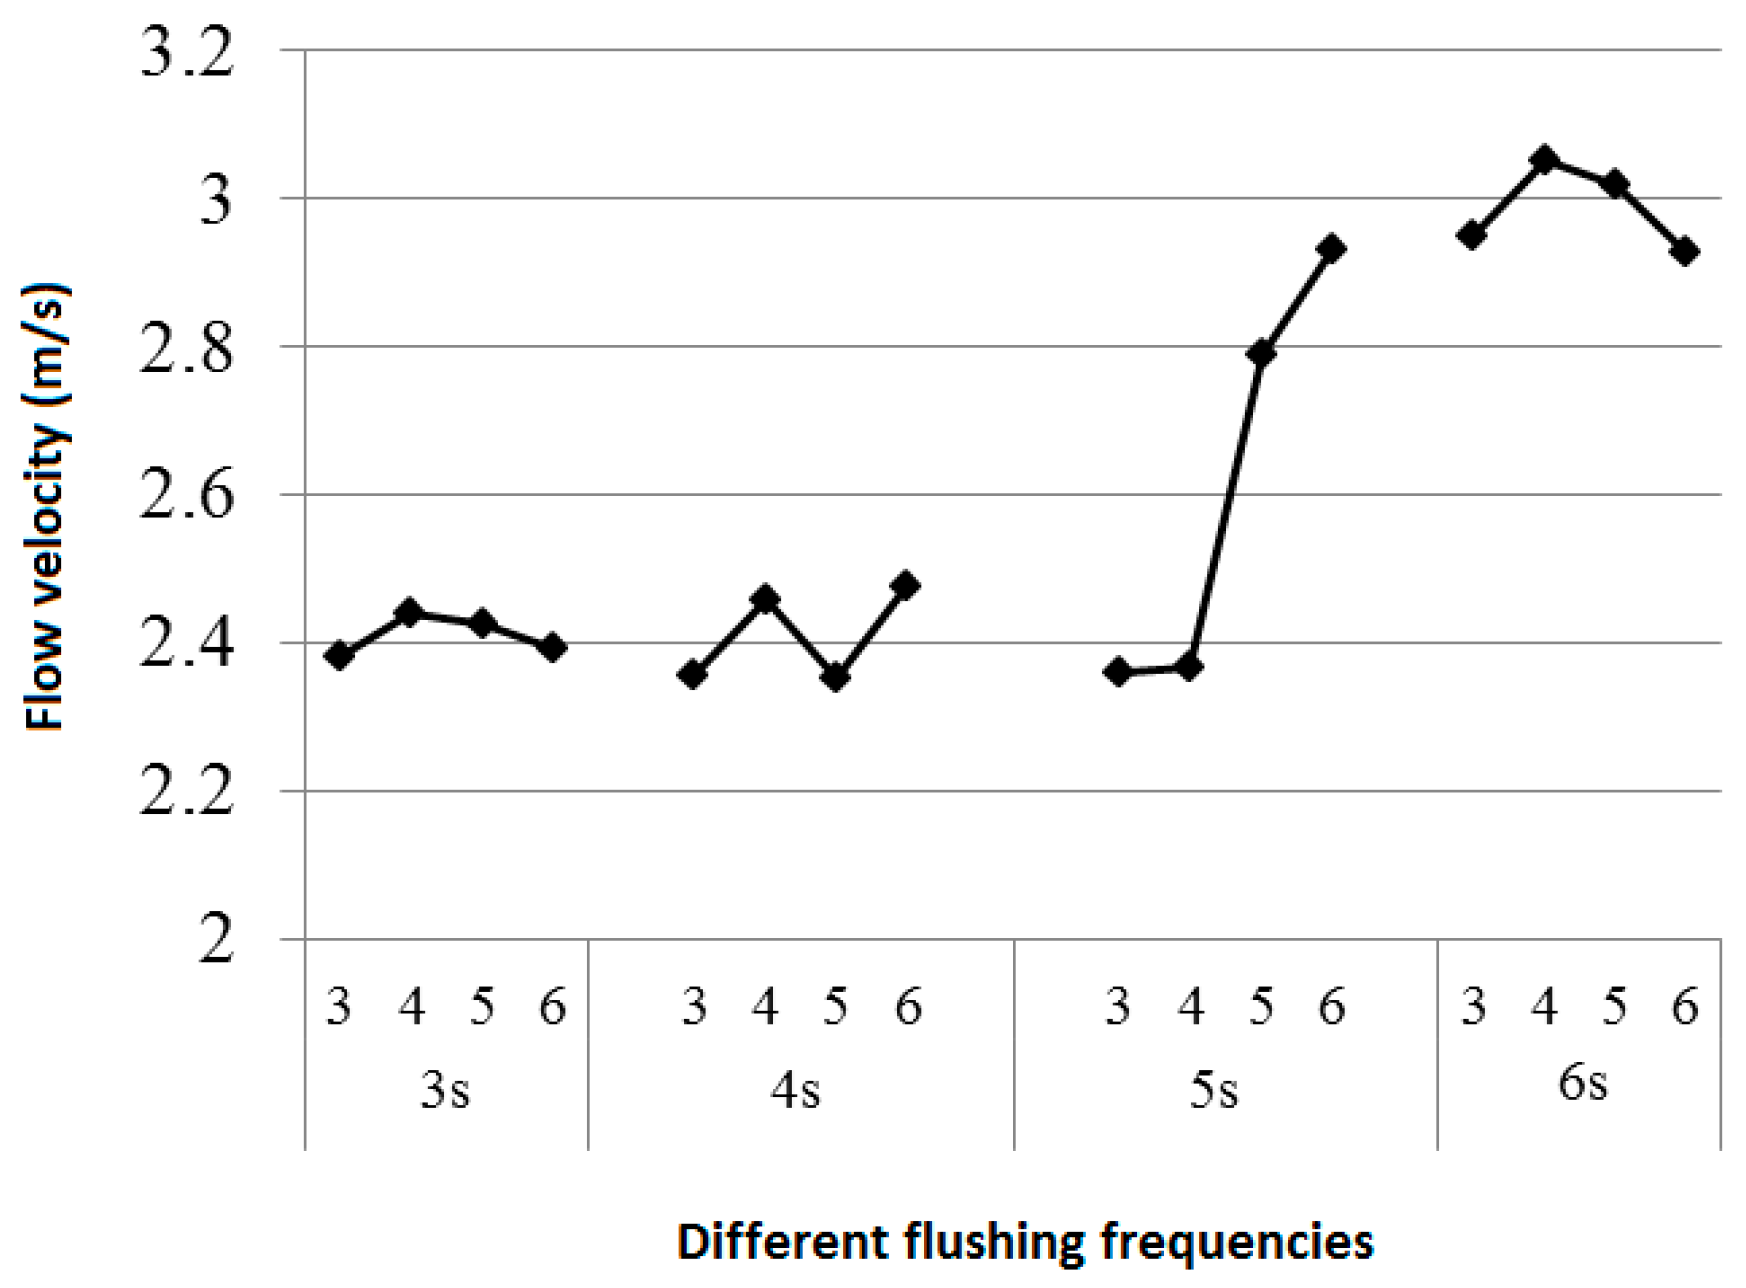
Comparison of water flow velocity at all frequencies (round nozzle in the middle of the pipe).
Figure 5.
Comparison of water flow velocity at all frequencies (round nozzle in the middle of the pipe).
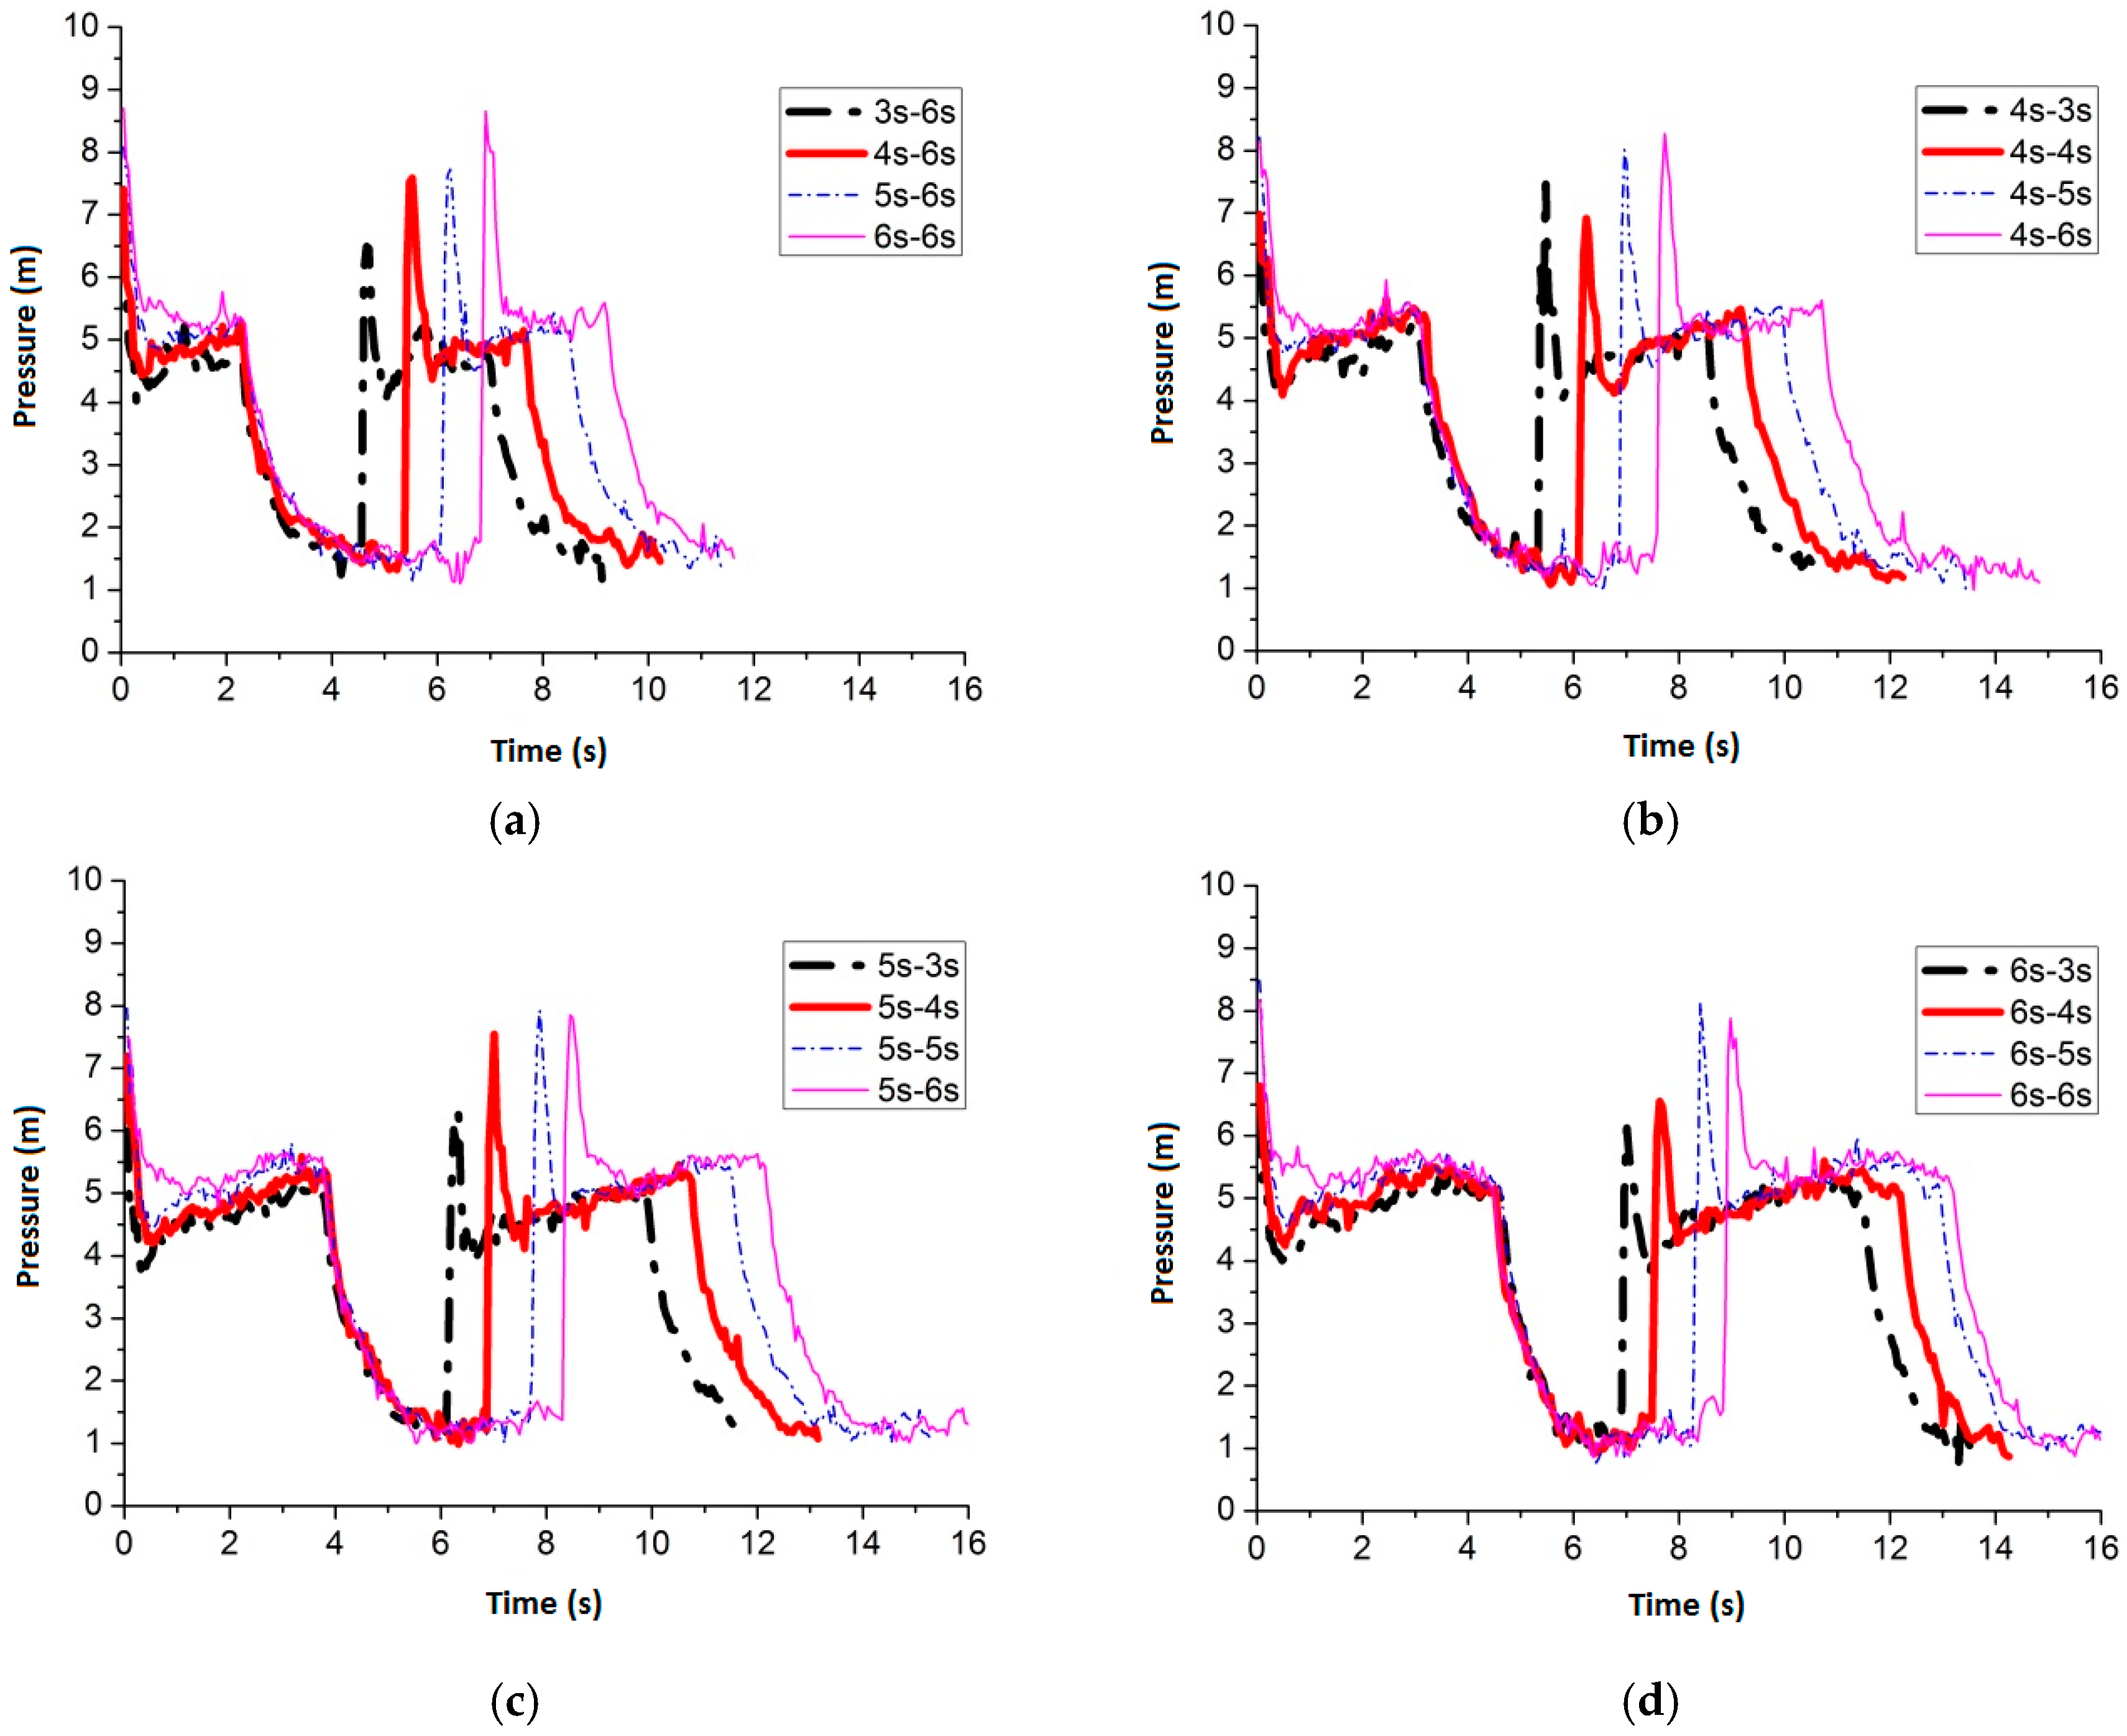
Figure 6.
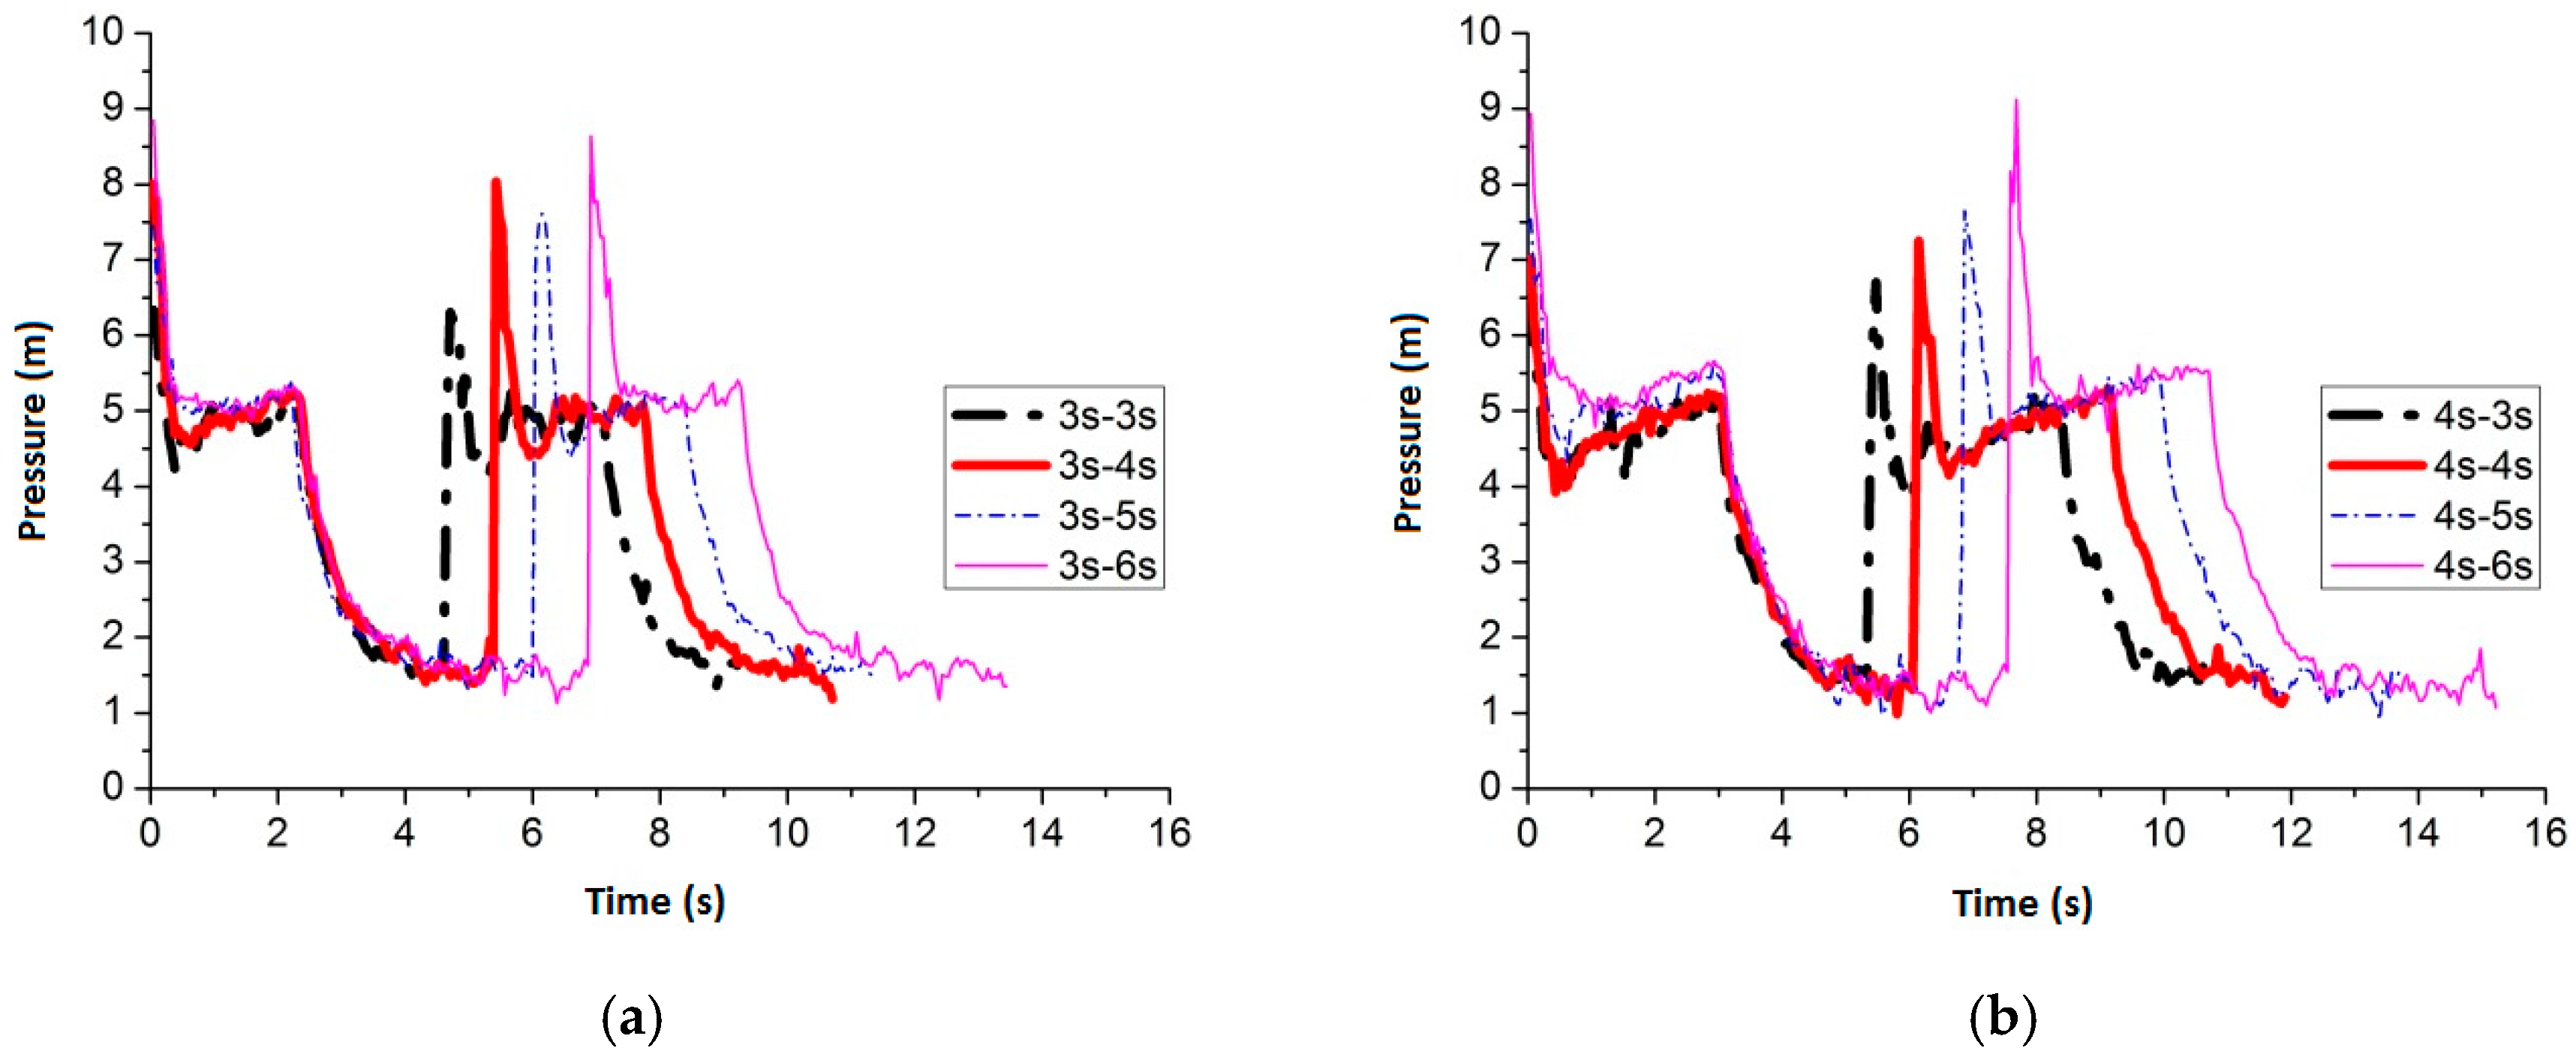
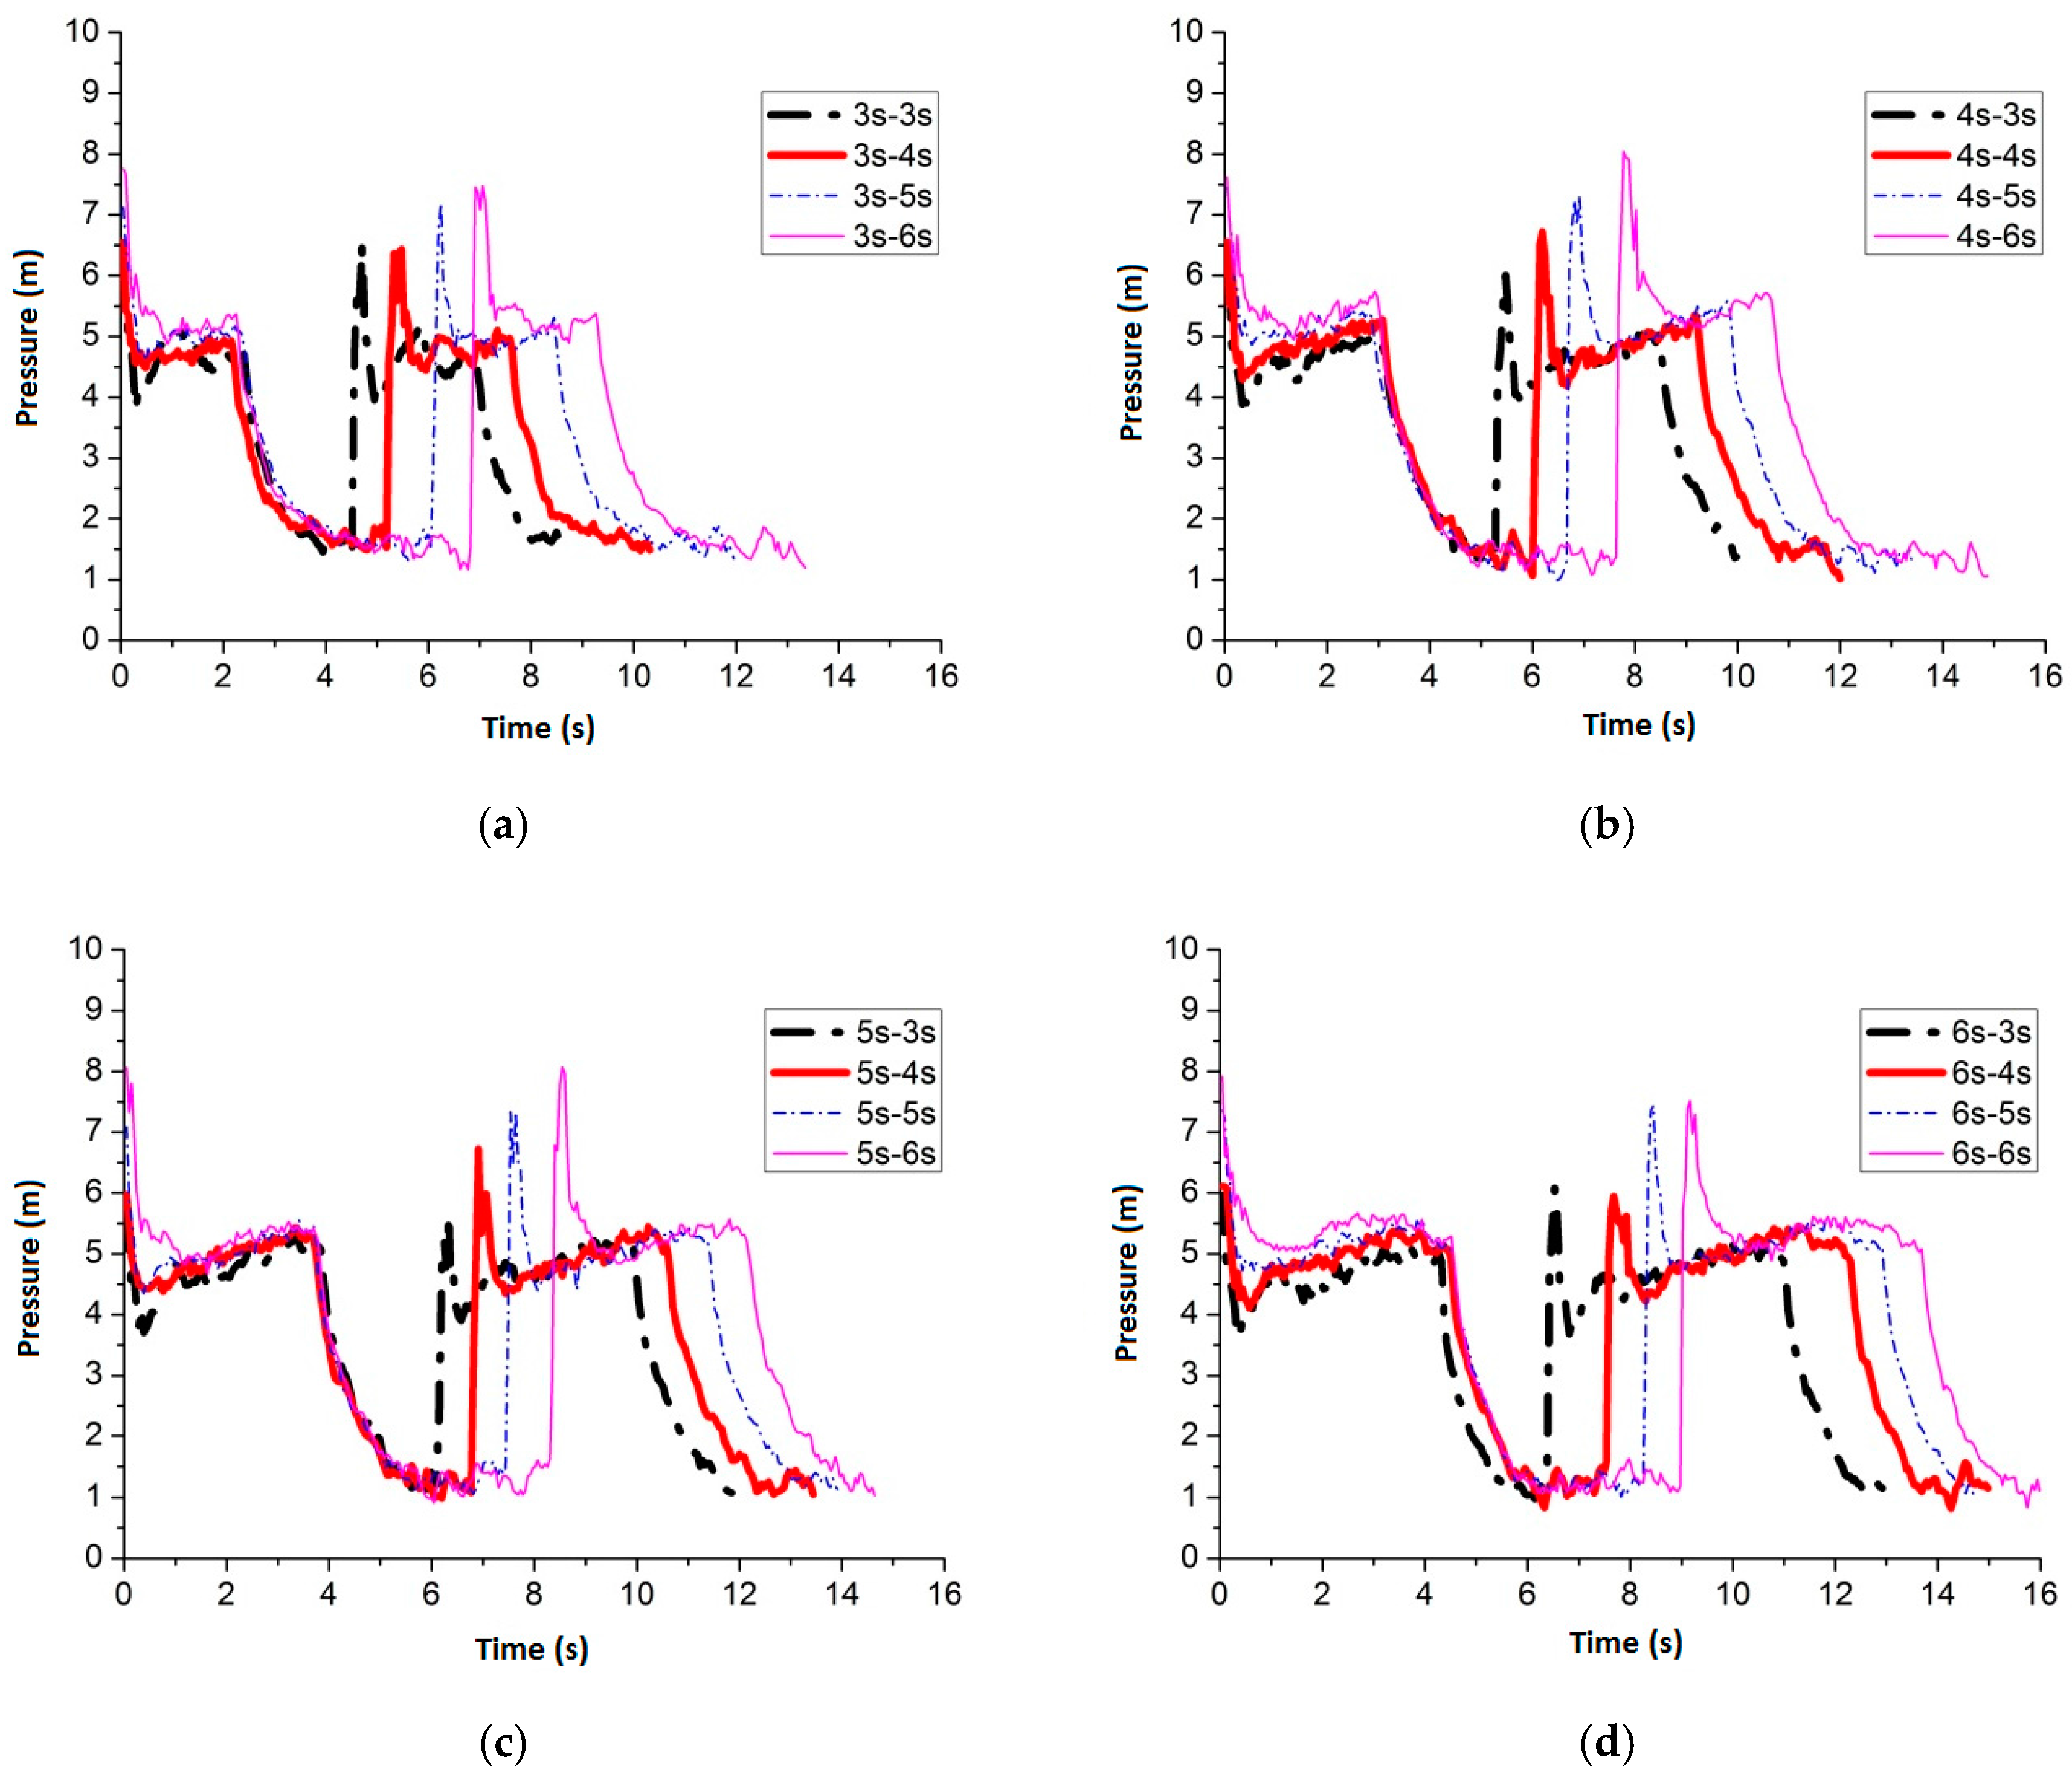
Pressure fluctuation of No. 1 sensing point (round nozzle on top of the pipe): (a) air inflow time is 3 s; (b) air inflow time is 4 s; (c) air inflow time is 5 s; and (d) air inflow time is 6 s.
Figure 6.
Pressure fluctuation of No. 1 sensing point (round nozzle on top of the pipe): (a) air inflow time is 3 s; (b) air inflow time is 4 s; (c) air inflow time is 5 s; and (d) air inflow time is 6 s.
Figure 7.
The four best pressure values (round nozzle on top of the pipe).
Figure 7.
The four best pressure values (round nozzle on top of the pipe).
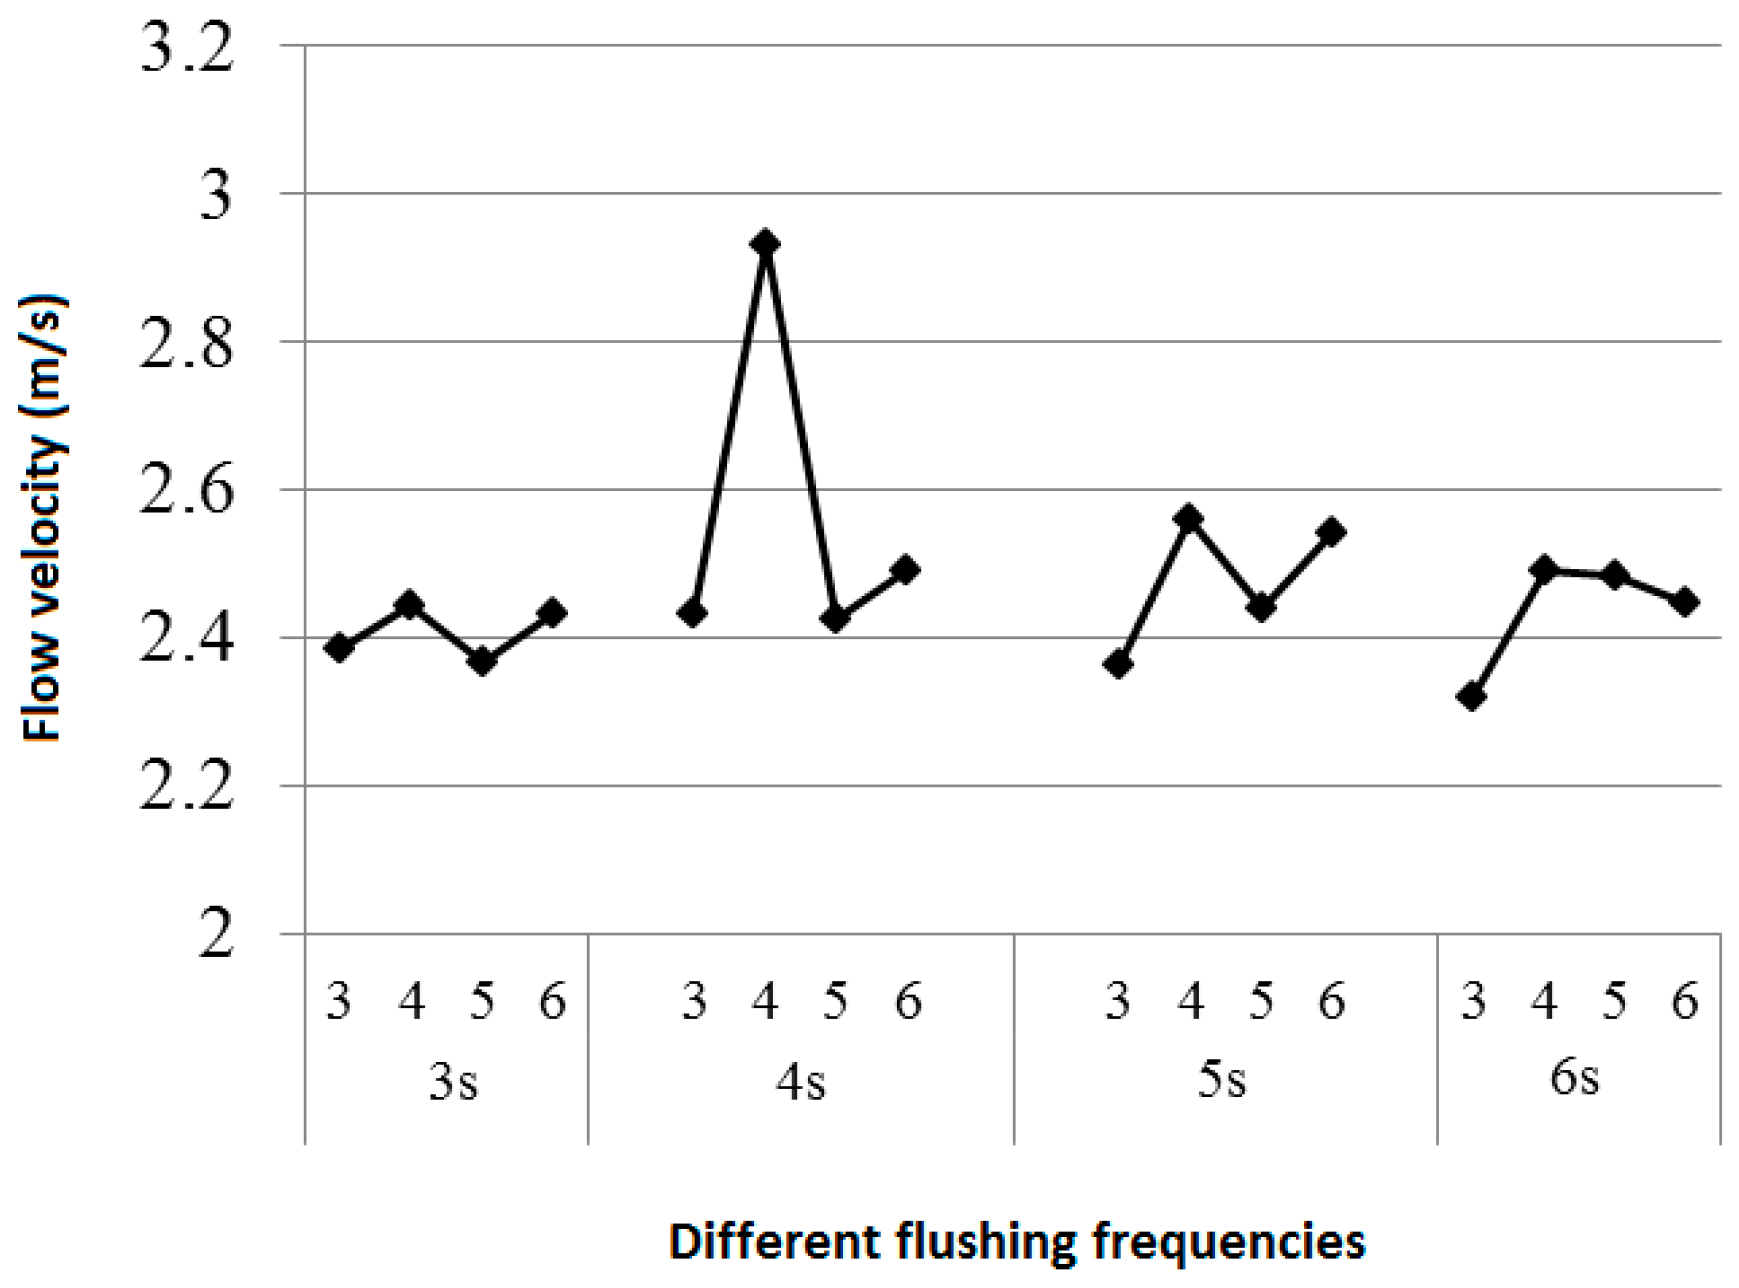
Figure 8.
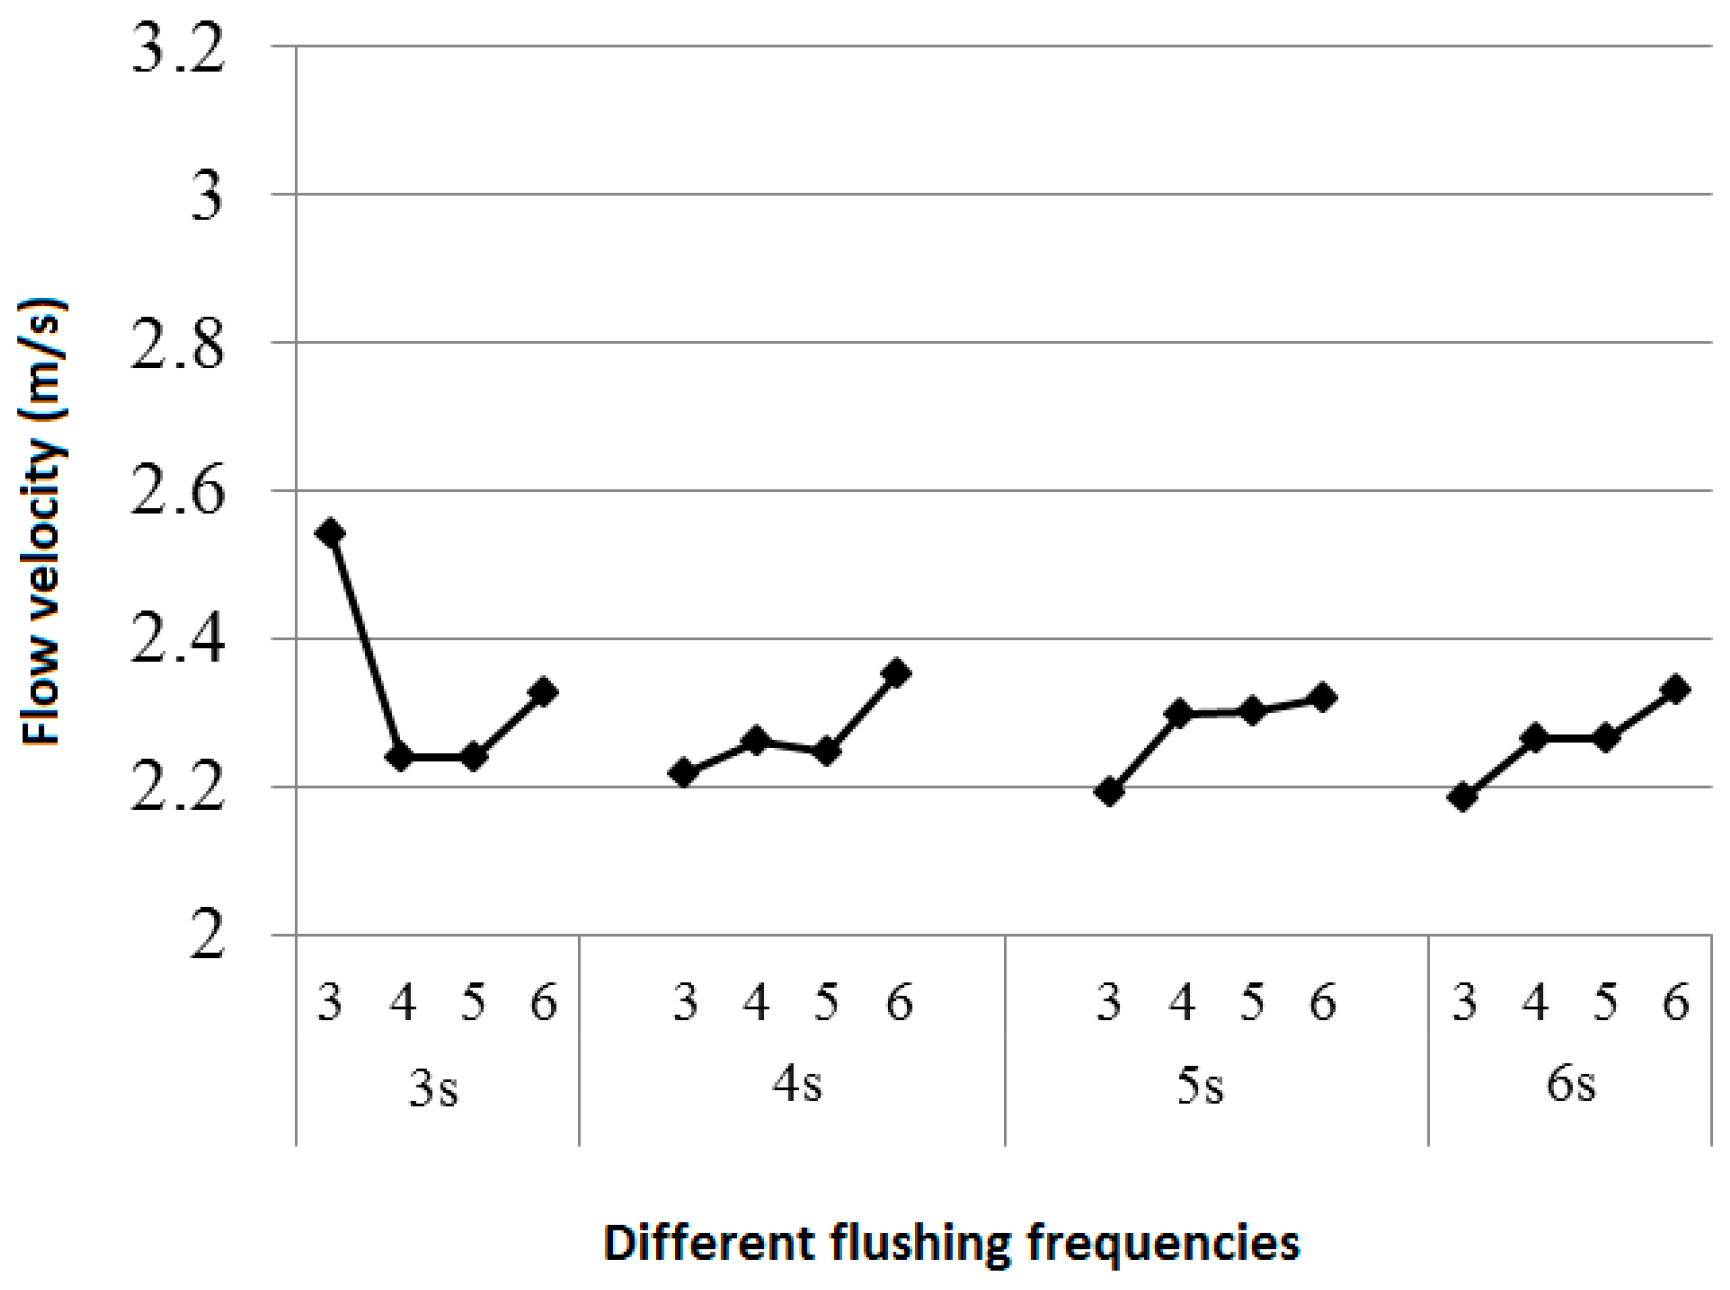
Comparison of water flow velocity at all frequencies (round nozzle on top of the pipe).
Figure 8.
Comparison of water flow velocity at all frequencies (round nozzle on top of the pipe).
Figure 9.
Pressure fluctuation of No. 1 sensing point (round nozzle at the bottom of the pipe): (a) air inflow time is 3 s; (b) air inflow time is 4 s; (c) air inflow time is 5 s; and (d) air inflow time is 6 s.
Figure 9.
Pressure fluctuation of No. 1 sensing point (round nozzle at the bottom of the pipe): (a) air inflow time is 3 s; (b) air inflow time is 4 s; (c) air inflow time is 5 s; and (d) air inflow time is 6 s.
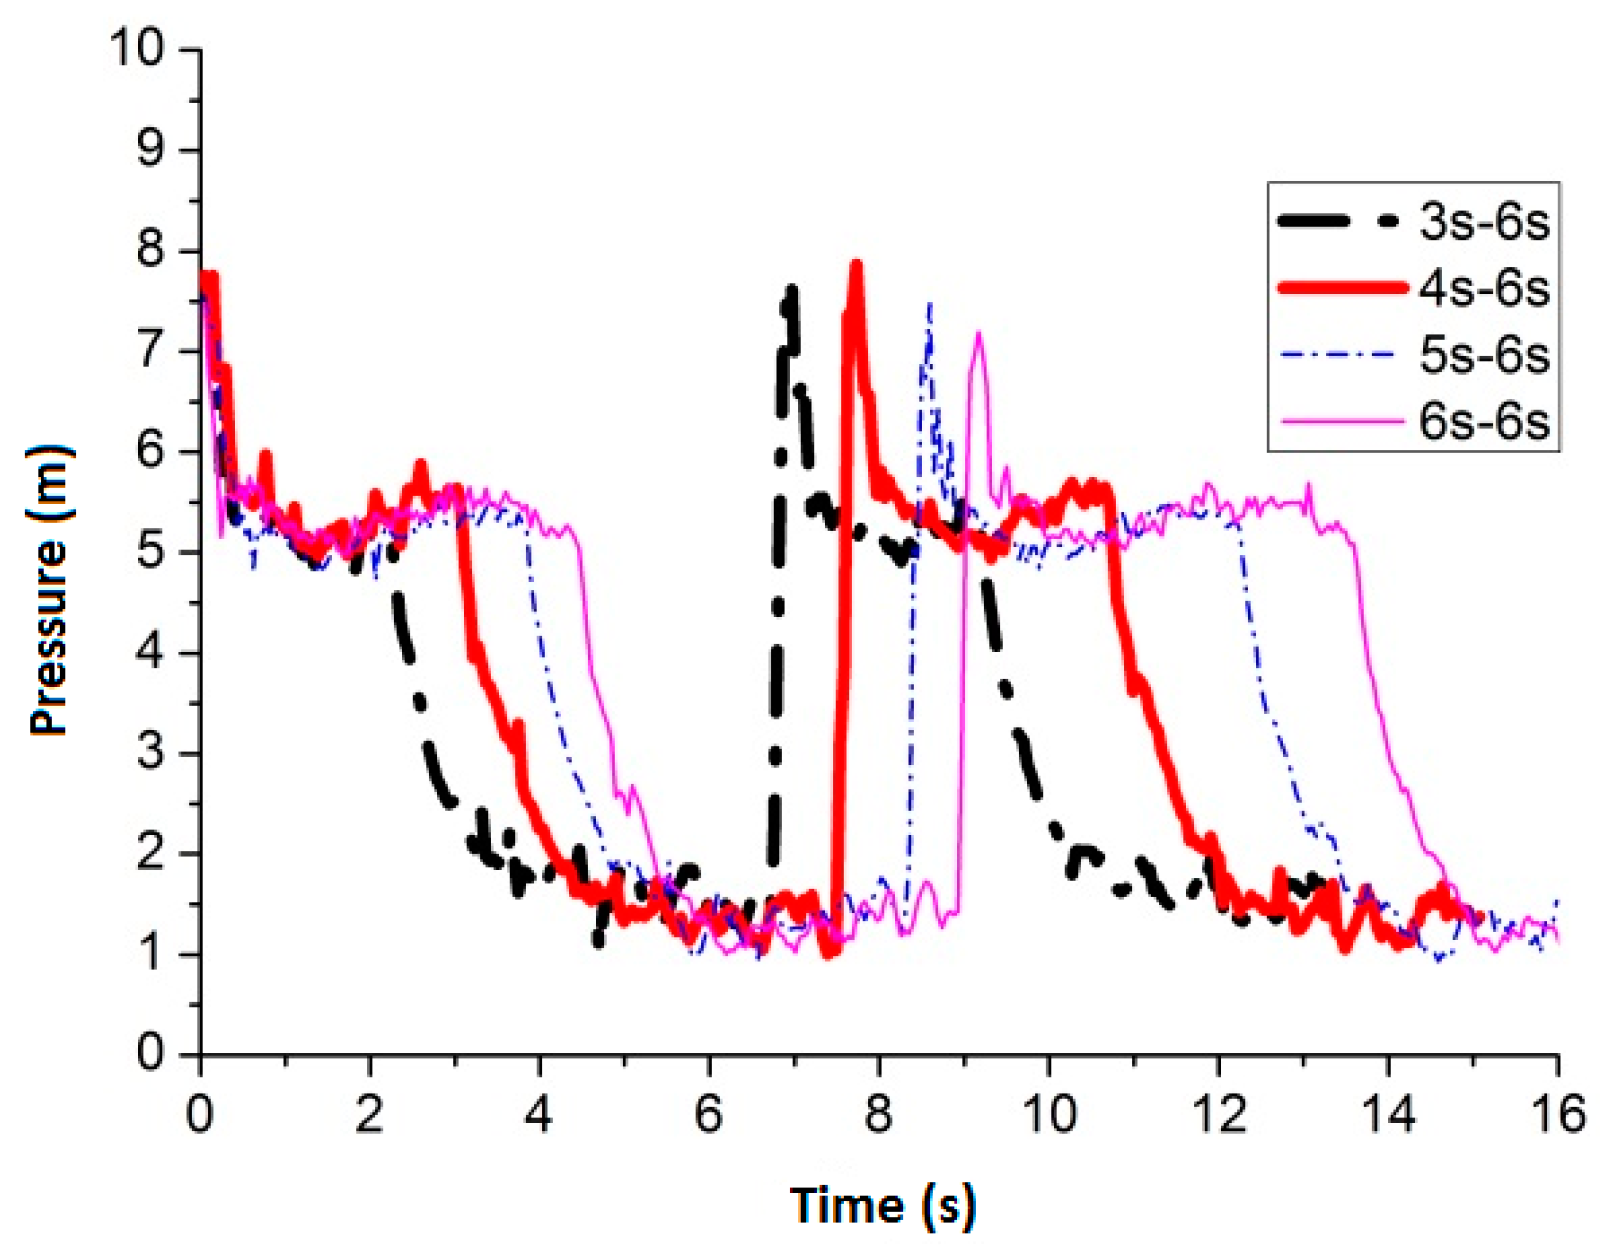
Figure 10.
The four best pressure values (round nozzle at the bottom of the pipe).
Figure 10.
The four best pressure values (round nozzle at the bottom of the pipe).
Figure 11.
Flow velocity comparison of all frequencies (round nozzle at the bottom of the pipe).
Figure 11.
Flow velocity comparison of all frequencies (round nozzle at the bottom of the pipe).
Figure 12.
Pressure fluctuation of No. 1 sensing point (rectangular nozzle in the middle of the pipe): (a) air inflow time is 3 s; (b) air inflow time is 4 s; (c) air inflow time is 5 s; and (d) air inflow time is 6 s.
Figure 12.
Pressure fluctuation of No. 1 sensing point (rectangular nozzle in the middle of the pipe): (a) air inflow time is 3 s; (b) air inflow time is 4 s; (c) air inflow time is 5 s; and (d) air inflow time is 6 s.
Figure 13.
The four best pressure values (rectangular nozzle in the middle of the pipe).
Figure 13.
The four best pressure values (rectangular nozzle in the middle of the pipe).
Figure 14.
Flow velocity comparison of all the frequencies when the rectangular nozzle is in the middle.
Figure 14.
Flow velocity comparison of all the frequencies when the rectangular nozzle is in the middle.
Figure 15.
Pressure fluctuation of No. 1 sensing point (rectangular nozzle on top of the pipe): (a) air inflow time is 3 s; (b) air inflow time is 4 s; (c) air inflow time is 5 s; and (d) air inflow time is 6 s.
Figure 15.
Pressure fluctuation of No. 1 sensing point (rectangular nozzle on top of the pipe): (a) air inflow time is 3 s; (b) air inflow time is 4 s; (c) air inflow time is 5 s; and (d) air inflow time is 6 s.
Figure 16.
The four best pressure values (rectangular nozzle on top of the pipe).
Figure 16.
The four best pressure values (rectangular nozzle on top of the pipe).
Figure 17.
Flow velocity comparison of all the frequencies (rectangular nozzle on top of the pipe).
Figure 17.
Flow velocity comparison of all the frequencies (rectangular nozzle on top of the pipe).
Figure 18.
Pressure fluctuation of No. 1 sensing point (rectangular nozzle at the bottom of the pipe): (a) air inflow time is 3 s; (b) air inflow time is 4 s; (c) air inflow time is 5 s; and (d) air inflow time is 6 s.
Figure 18.
Pressure fluctuation of No. 1 sensing point (rectangular nozzle at the bottom of the pipe): (a) air inflow time is 3 s; (b) air inflow time is 4 s; (c) air inflow time is 5 s; and (d) air inflow time is 6 s.
Figure 19.
The four best pressure values (rectangular nozzle at the bottom of the pipe).
Figure 19.
The four best pressure values (rectangular nozzle at the bottom of the pipe).
Figure 20.
Flow velocity comparison of all the frequencies (rectangular nozzle at the bottom of the pipe).
Figure 20.
Flow velocity comparison of all the frequencies (rectangular nozzle at the bottom of the pipe).
Figure 21.
Pressure fluctuation of No. 1 sensing point when slot nozzle is set in the middle of the pipe (a) air inflow time is 3 s; (b) air inflow time is 4 s; (c) air inflow time is 5 s; and (d) air inflow time is 6 s.
Figure 21.
Pressure fluctuation of No. 1 sensing point when slot nozzle is set in the middle of the pipe (a) air inflow time is 3 s; (b) air inflow time is 4 s; (c) air inflow time is 5 s; and (d) air inflow time is 6 s.
Figure 22.
The four best pressure values when the slot nozzle is set in the middle of the pipe.
Figure 22.
The four best pressure values when the slot nozzle is set in the middle of the pipe.
Figure 23.
Flow velocity comparison of all the frequencies when the slot nozzle is set in the middle of the pipe.
Figure 23.
Flow velocity comparison of all the frequencies when the slot nozzle is set in the middle of the pipe.
Figure 24.
Pressure fluctuation of No. 1 sensing point when the slot nozzle is set on top of the pipe (a) air inflow time is 3 s; (b) air inflow time is 4 s; (c) air inflow time is 5 s; and (d) air inflow time is 6 s.
Figure 24.
Pressure fluctuation of No. 1 sensing point when the slot nozzle is set on top of the pipe (a) air inflow time is 3 s; (b) air inflow time is 4 s; (c) air inflow time is 5 s; and (d) air inflow time is 6 s.
Figure 25.
The four best pressure values when the slot nozzle is set on top of the pipe.
Figure 25.
The four best pressure values when the slot nozzle is set on top of the pipe.
Figure 26.
Flow velocity comparison of all the frequencies when the slot nozzle is on top of the pipe.
Figure 26.
Flow velocity comparison of all the frequencies when the slot nozzle is on top of the pipe.
Figure 27.
Pressure fluctuation of No. 1 sensing point when slot nozzle is set at the bottom of the pipe (a) air inflow time is 3 s; (b) air inflow time is 4 s; (c) air inflow time is 5 s; and (d) air inflow time is 6 s.
Figure 27.
Pressure fluctuation of No. 1 sensing point when slot nozzle is set at the bottom of the pipe (a) air inflow time is 3 s; (b) air inflow time is 4 s; (c) air inflow time is 5 s; and (d) air inflow time is 6 s.
Figure 28.
The four best pressure values when the slot nozzle is set at the bottom of the pipe.
Figure 28.
The four best pressure values when the slot nozzle is set at the bottom of the pipe.
Figure 29.
Flow velocity comparison of all frequencies when the slot nozzle is set at the bottom of the pipe.
Figure 29.
Flow velocity comparison of all frequencies when the slot nozzle is set at the bottom of the pipe.
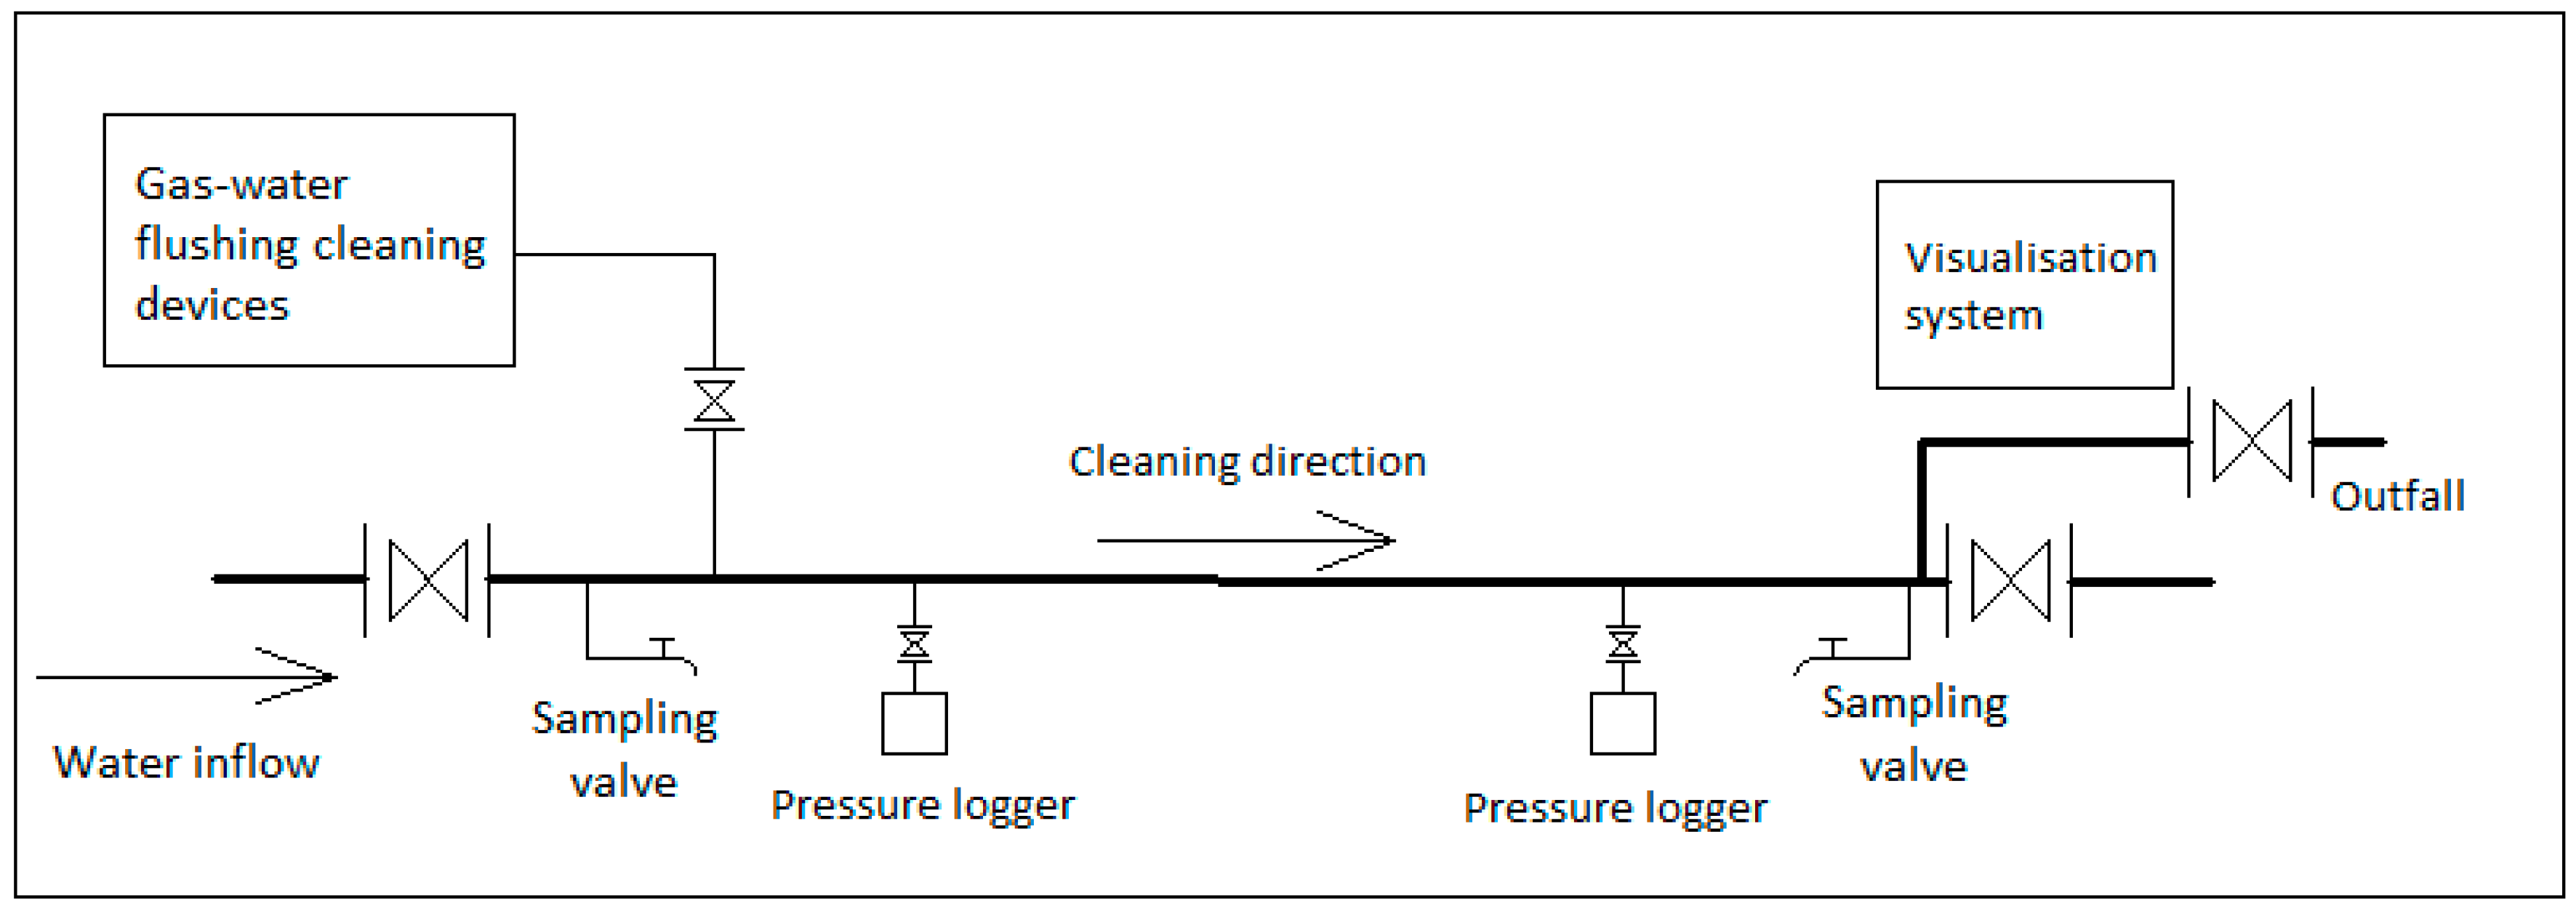
Figure 30.
Diagram of the two-phase (gas and water) flushing process.
Figure 30.
Diagram of the two-phase (gas and water) flushing process.
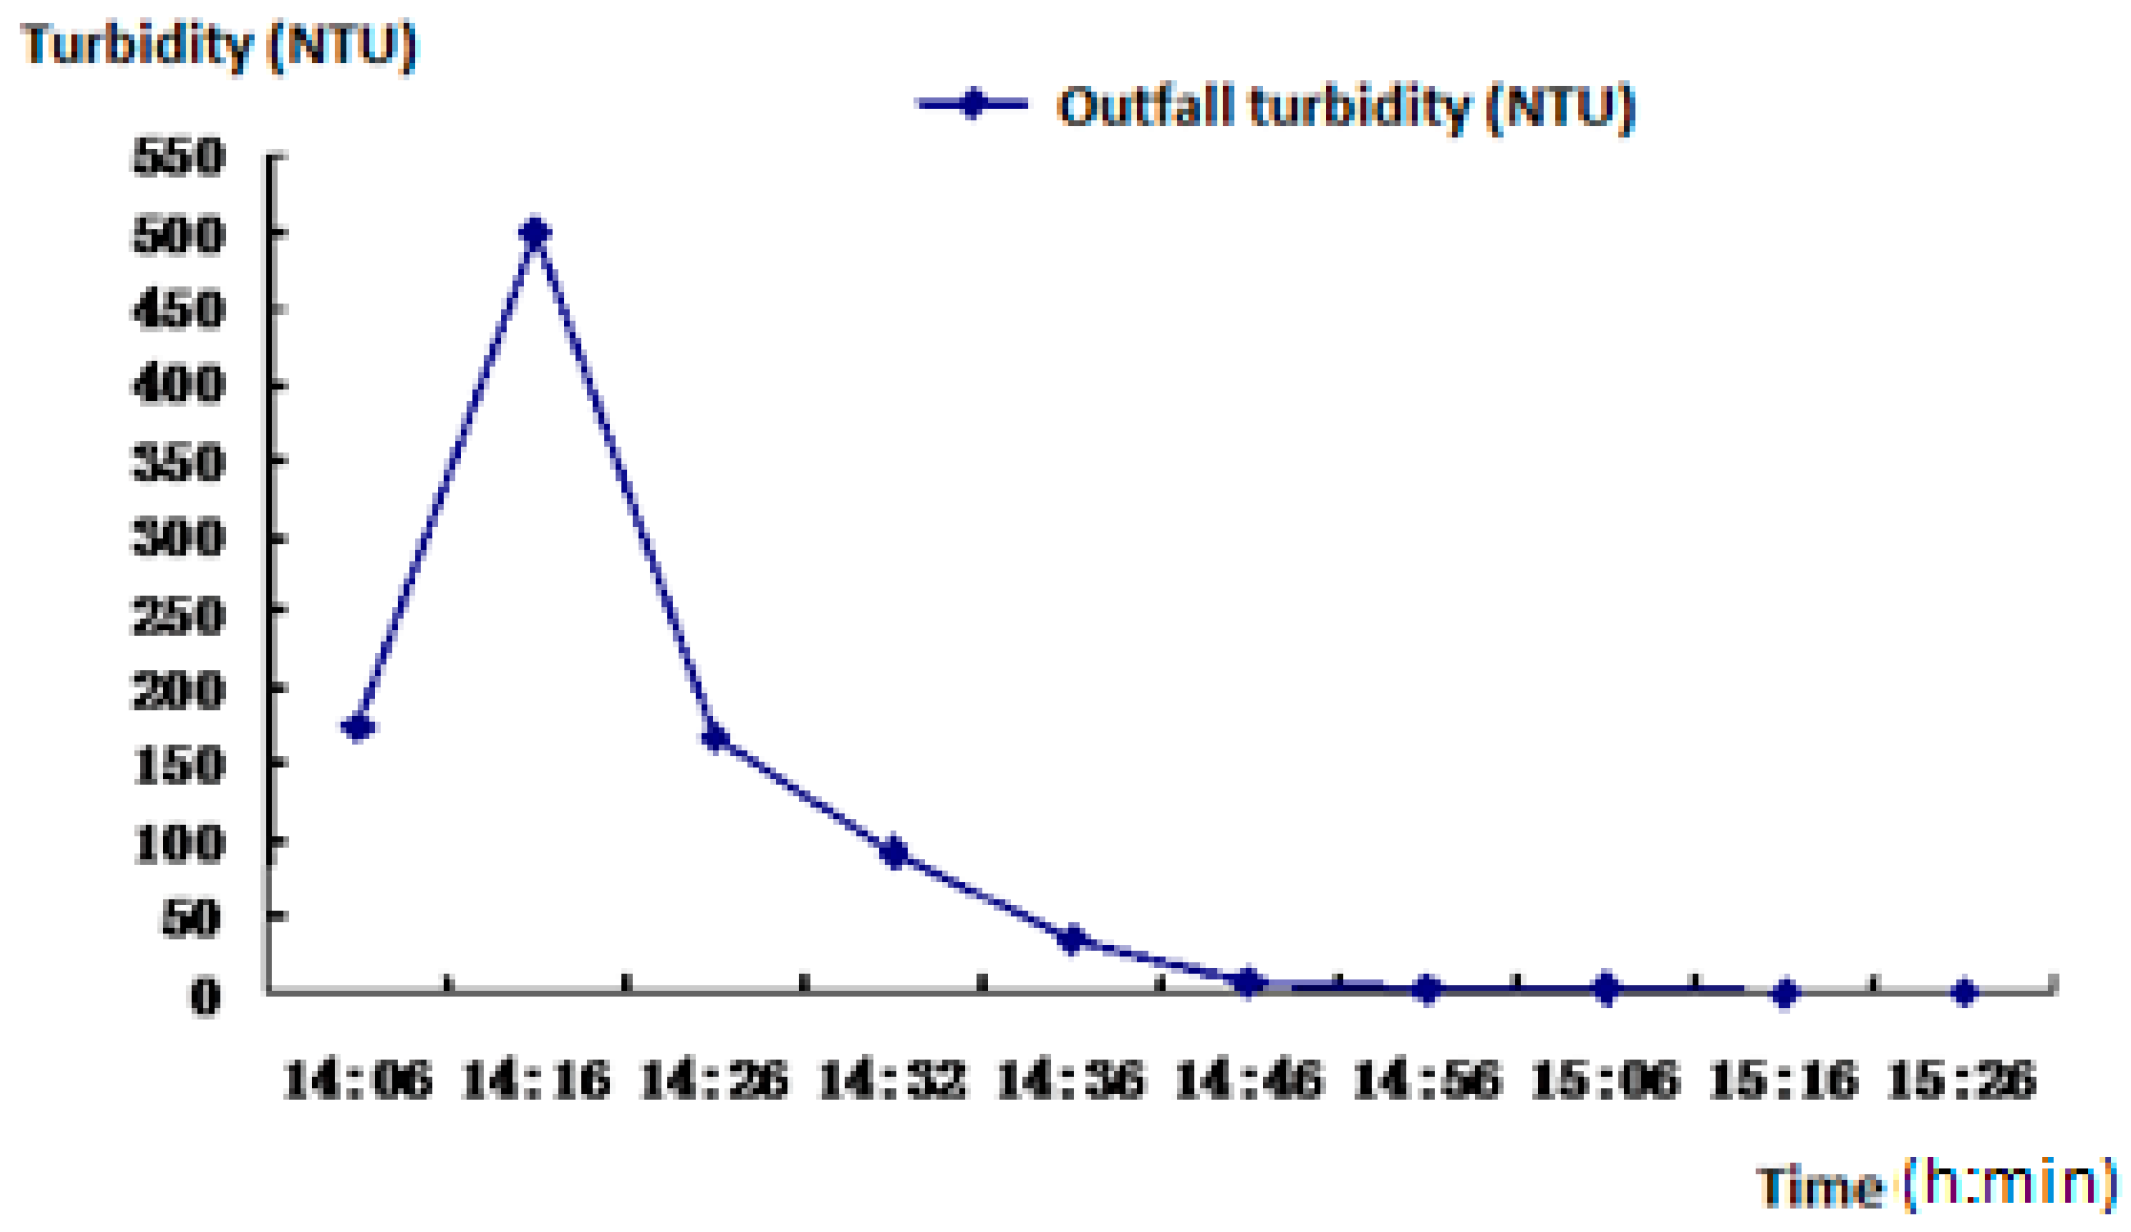
Figure 31.
Data record of turbidity during the flushing cleaning process.
Figure 31.
Data record of turbidity during the flushing cleaning process.
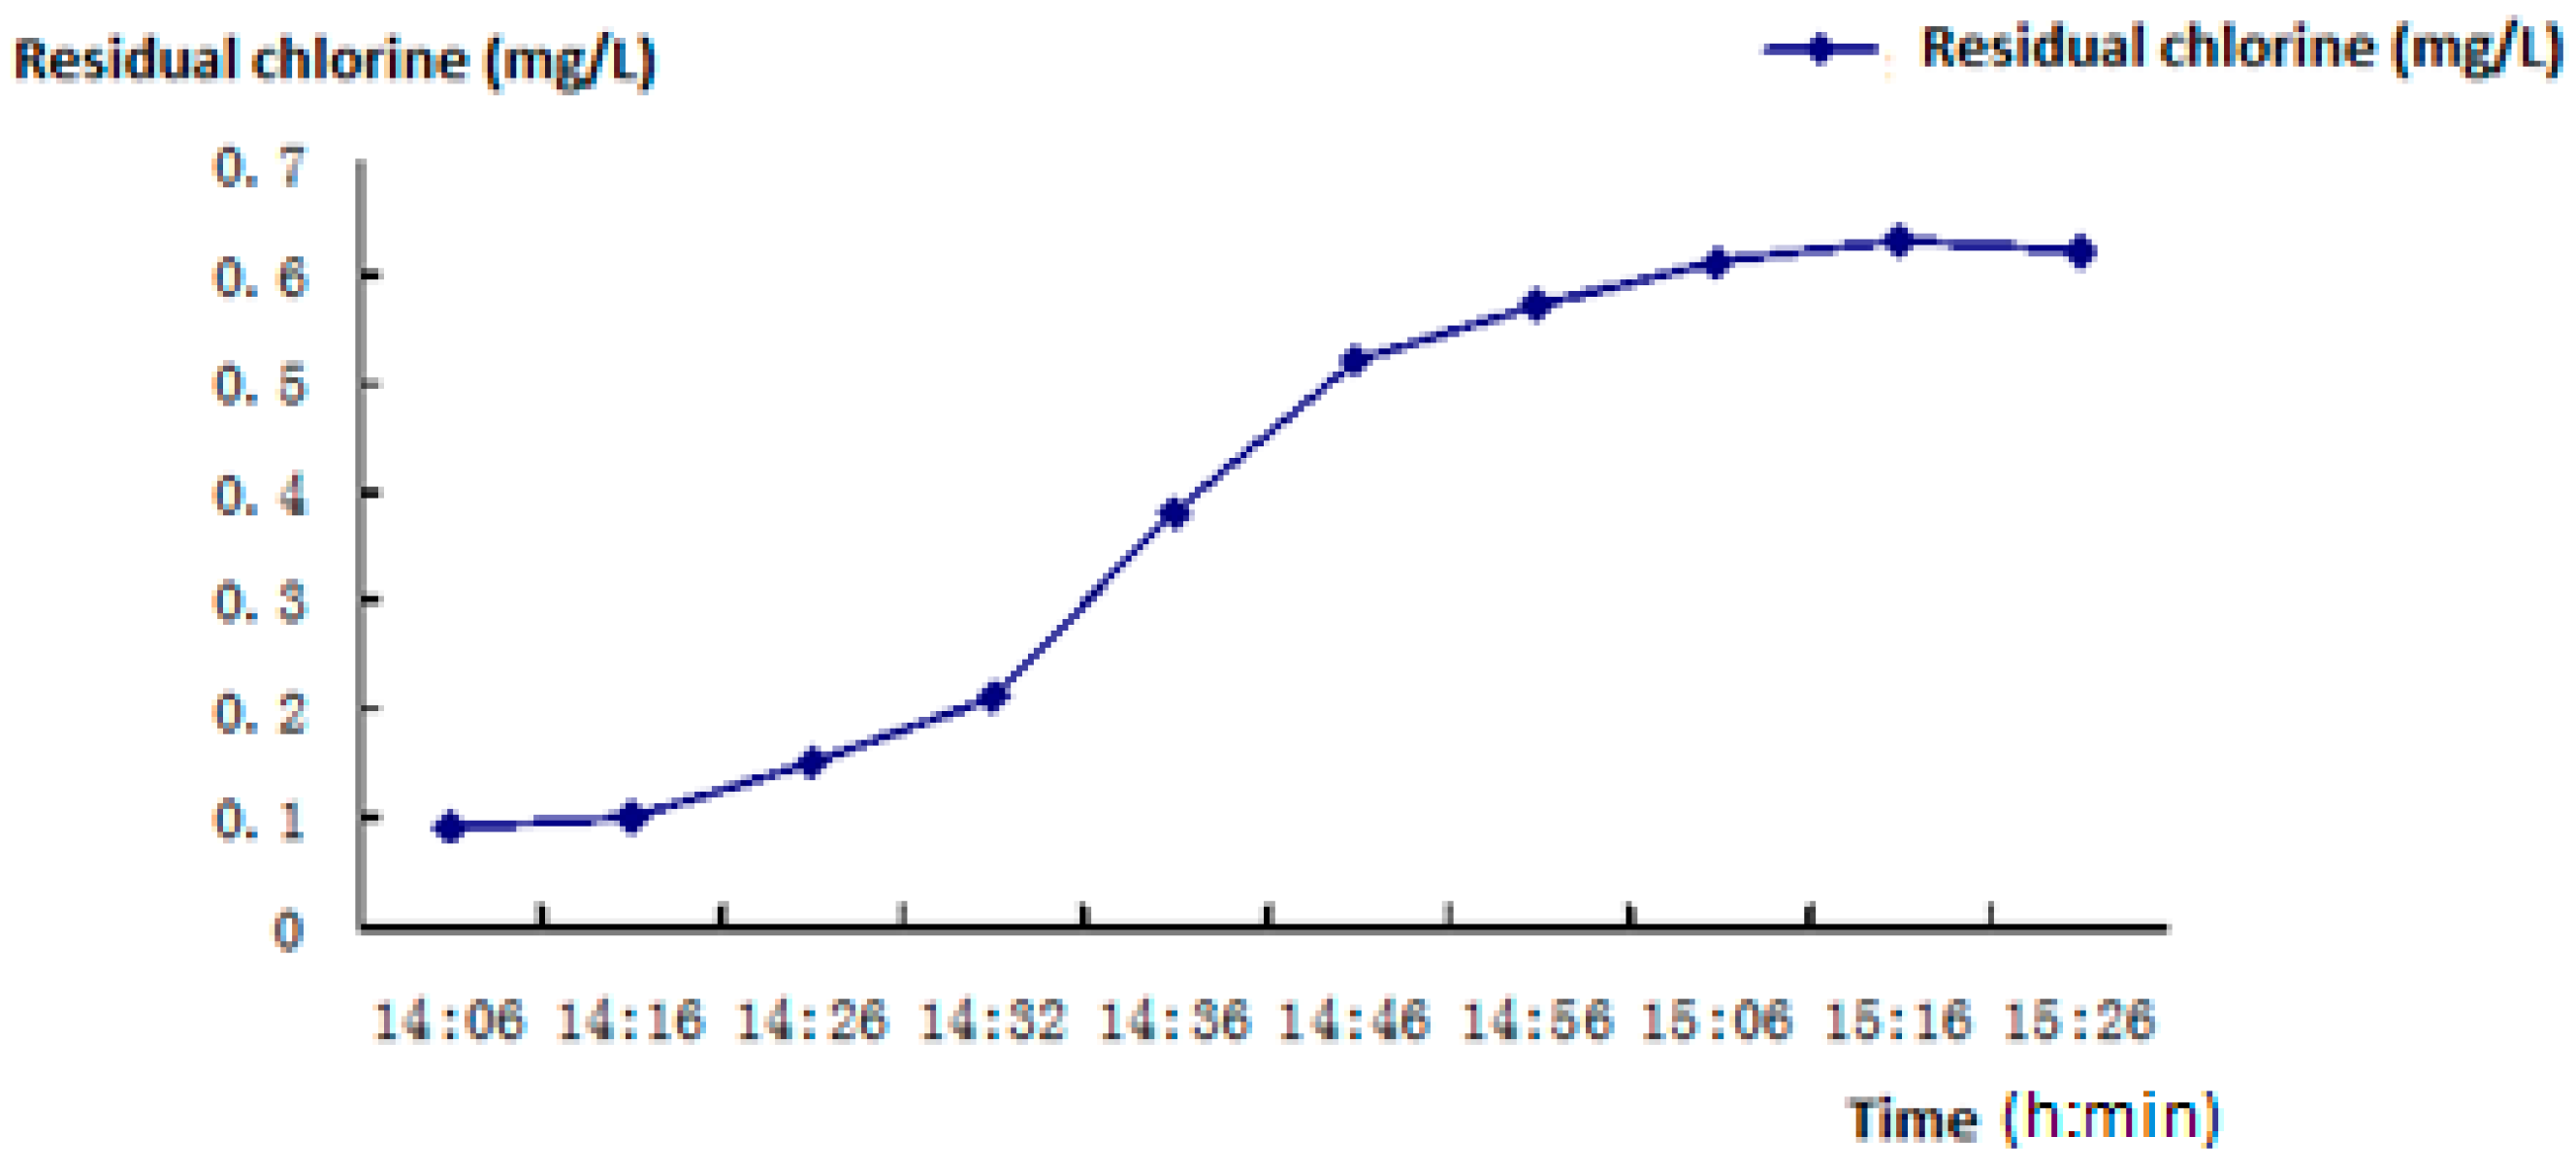
Figure 32.
Data record of residual chlorine during the flushing process.
Figure 32.
Data record of residual chlorine during the flushing process.
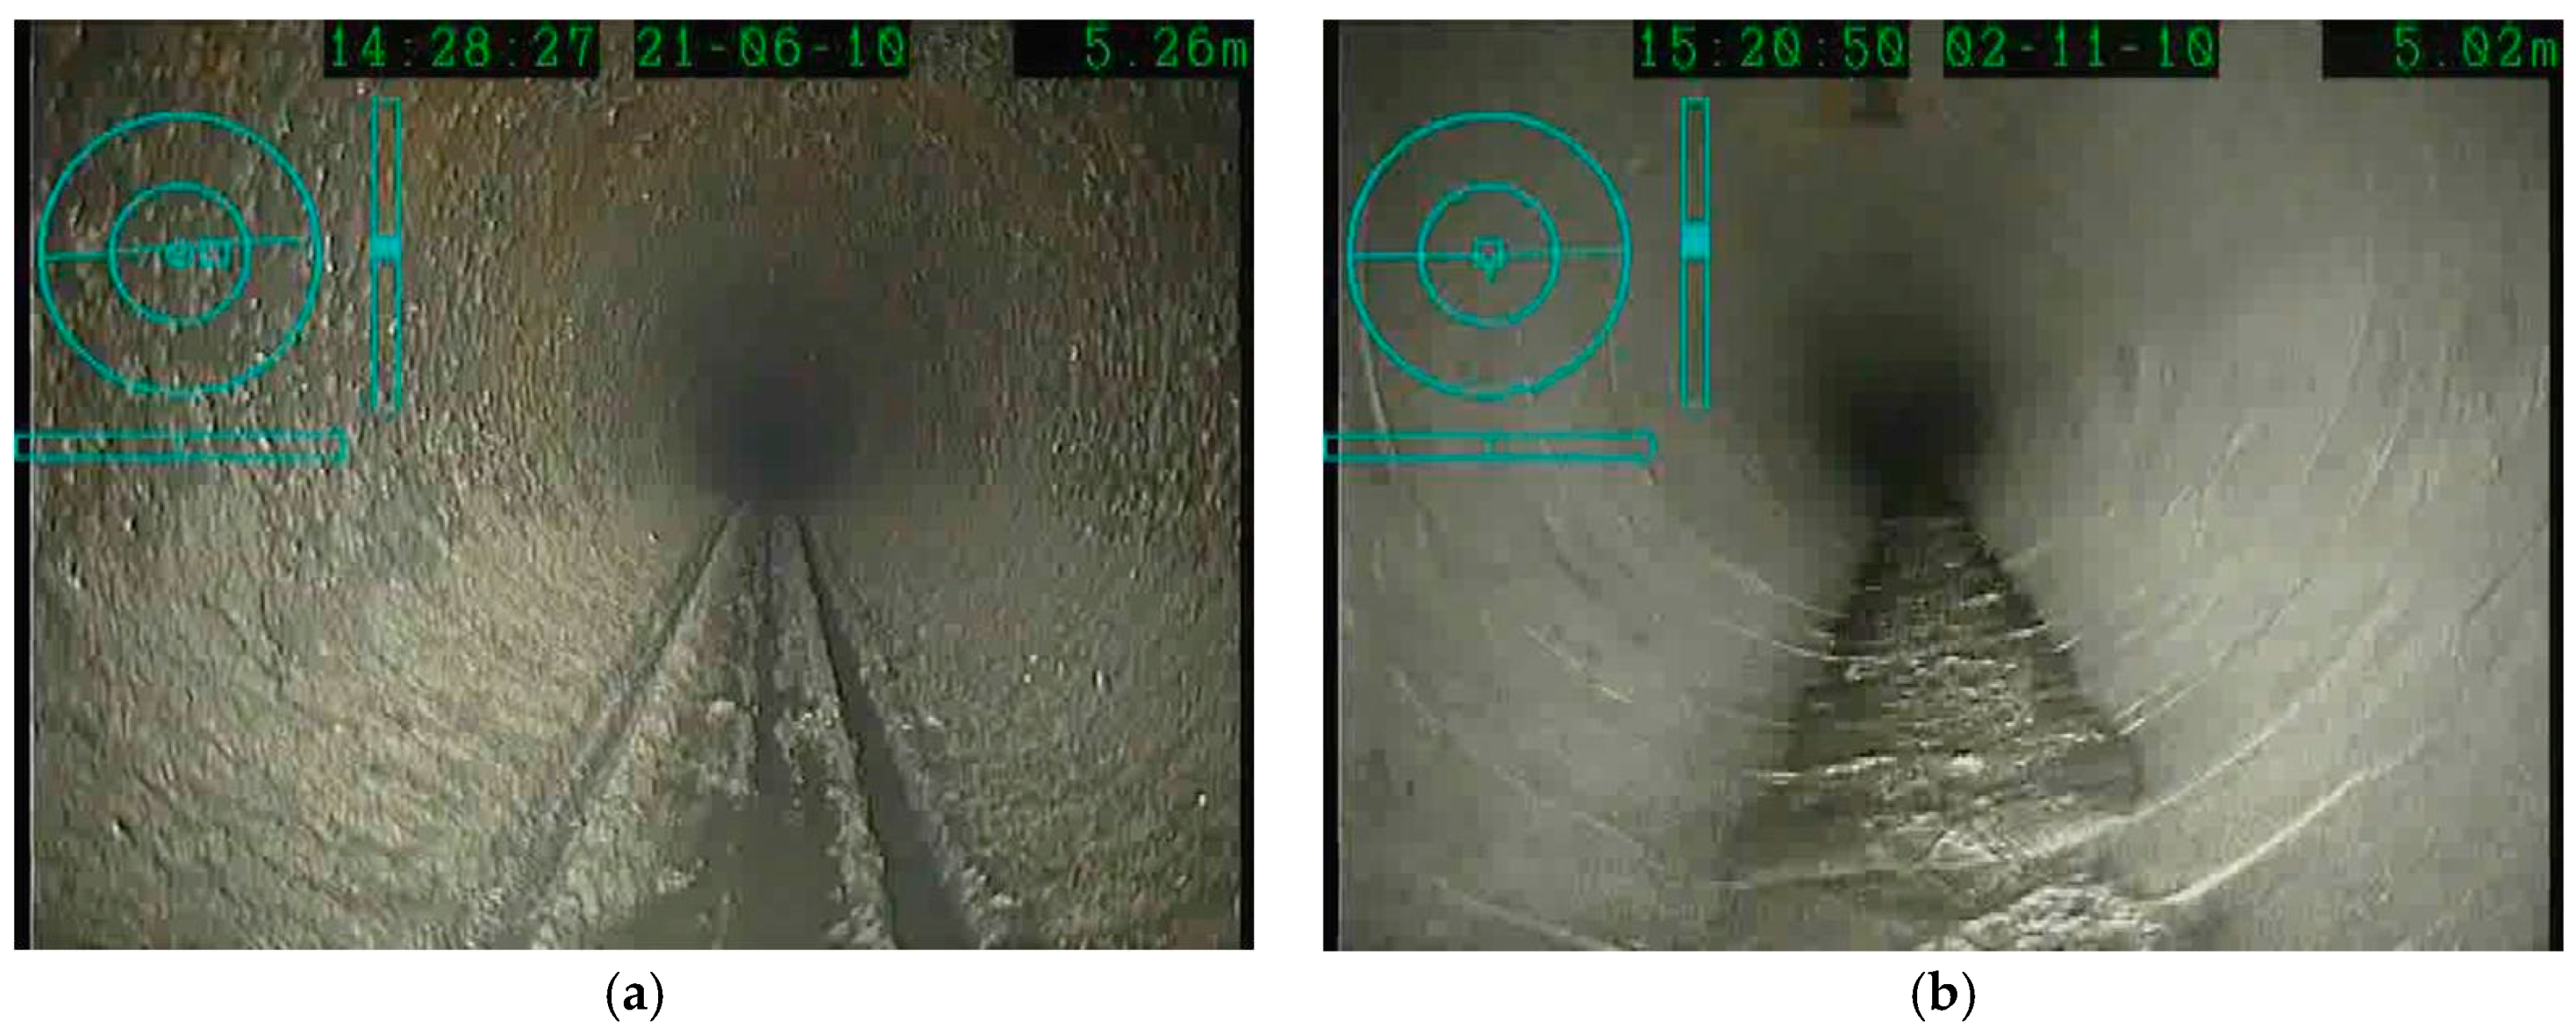
Figure 33.
Photos inside the pipe to show the flushing effect in this case study: (a) before flushing; and (b) after flushing.
Figure 33.
Photos inside the pipe to show the flushing effect in this case study: (a) before flushing; and (b) after flushing.
Table 1.
Pressure values and statistical analysis after air inflow has been cut off for 6 s (round nozzle in the middle of the pipe).
Table 1.
Pressure values and statistical analysis after air inflow has been cut off for 6 s (round nozzle in the middle of the pipe).
| | Parameter | Average Peak Value (m) | Average Minimum Value (m) | Variation Range (m) | Average Value (m) | Peak Value Deviation |
|---|
| Frequency | |
|---|
| 3 s–6 s | 8.6307 | 1.2199 | 7.4108 | 3.1813 | 0.0762 |
| 4 s–6 s | 8.6887 | 0.9891 | 7.6997 | 3.4123 | 0.2182 |
| 5 s–6 s | 8.7165 | 0.7111 | 8.0055 | 3.5498 | 0.2466 |
| 6 s–6 s | 7.8426 | 0.8766 | 6.9660 | 3.5534 | 0.1348 |
Table 2.
Pressure values and statistical analysis after air inflow has been cut off for 6 s (round nozzle on top of the pipe).
Table 2.
Pressure values and statistical analysis after air inflow has been cut off for 6 s (round nozzle on top of the pipe).
| | Parameter | Average Peak Value (m) | Average Minimum Value (m) | Variation Range (m) | Average Value (m) | Peak Value Deviation |
|---|
| Frequency | |
|---|
| 3 s–6 s | 8.3974 | 1.1897 | 7.2077 | 3.1624 | 0.2393 |
| 4 s–6 s | 8.6875 | 1.0217 | 7.6658 | 3.3755 | 0.2635 |
| 5 s–6 s | 8.3382 | 0.8235 | 7.5174 | 3.5776 | 0.2913 |
| 6 s–6 s | 8.1146 | 0.8476 | 7.2669 | 3.5676 | 0.0955 |
Table 3.
Pressure values and statistical analysis after air inflow has been cut off for 6 s (round nozzle at the bottom of the pipe).
Table 3.
Pressure values and statistical analysis after air inflow has been cut off for 6 s (round nozzle at the bottom of the pipe).
| | Parameter | Average Peak Value (m) | Average Minimum Value (m) | Variation Range (m) | Average Value (m) | Peak Value Deviation |
|---|
| Frequency | |
|---|
| 3 s–6 s | 8.7697 | 1.1305 | 7.6392 | 3.2263 | 0.2949 |
| 4 s–6 s | 8.9498 | 1.0193 | 7.9305 | 3.4144 | 0.1342 |
| 5 s–6 s | 8.2246 | 0.7642 | 7.4603 | 3.5700 | 0.1704 |
| 6 s–6 s | 7.8571 | 0.8174 | 7.0397 | 3.5493 | 0.1583 |
Table 4.
Flushing results by setting round nozzle at different locations.
Table 4.
Flushing results by setting round nozzle at different locations.
| | Parameter | Average Peak Value (m) | Average Minimum Value (m) | Variation Range (m) | Average Value (m) | Peak Value Deviation | Flow Velocity (m/s) |
|---|
| Location | |
|---|
| Top (4 s–6 s) | 8.6875 | 1.0217 | 7.6658 | 3.3755 | 0.2635 | 2.311 |
| Middle (5 s–6 s) | 8.7165 | 0.7111 | 8.0055 | 3.5498 | 0.2466 | 2.534 |
| Bottom (4 s–6 s) | 8.9498 | 1.0193 | 7.9305 | 3.4144 | 0.1342 | 2.957 |
Table 5.
Pressure values and statistical analysis after air inflow has been cut off for 6 s (rectangular nozzle in the middle of the pipe).
Table 5.
Pressure values and statistical analysis after air inflow has been cut off for 6 s (rectangular nozzle in the middle of the pipe).
| | Parameter | Average Peak Value (m) | Average Minimum Value (m) | Variation Range (m) | Average Value (m) | Peak Value Deviation |
|---|
| Frequency | |
|---|
| 3 s–6 s | 8.3926 | 1.0700 | 7.3225 | 3.2356 | 0.3094 |
| 4 s–6 s | 8.2113 | 1.0048 | 7.2065 | 3.3311 | 0.4025 |
| 5 s–6 s | 8.3588 | 0.8404 | 7.5184 | 3.4978 | 0.2635 |
| 6 s–6 s | 8.4591 | 0.8235 | 7.6356 | 3.6207 | 0.1342 |
Table 6.
Pressure values and statistical analysis after air inflow has been cut off for 6 s (rectangular nozzle on top of the pipe).
Table 6.
Pressure values and statistical analysis after air inflow has been cut off for 6 s (rectangular nozzle on top of the pipe).
| | Parameter | Average Peak Value (m) | Average Minimum Value (m) | Variation Range (m) | Average Value (m) | Peak Value Deviation |
|---|
| Frequency | |
|---|
| 3 s–6 s | 8.2548 | 0.9625 | 7.2923 | 3.2449 | 0.0955 |
| 4 s–6 s | 8.1376 | 1.0338 | 7.1038 | 3.3550 | 0.1227 |
| 5 s–6 s | 8.6996 | 0.9879 | 7.7118 | 3.4960 | 0.4364 |
| 6 s–6 s | 7.9079 | 0.7558 | 7.1521 | 3.6445 | 0.1118 |
Table 7.
Pressure values and analysis after air inflow has been cut off for 6 s (rectangular nozzle at the bottom of the pipe).
Table 7.
Pressure values and analysis after air inflow has been cut off for 6 s (rectangular nozzle at the bottom of the pipe).
| | Parameter | Average Peak Value (m) | Average Minimum Value (m) | Variation Range (m) | Average Value (m) | Peak Value Deviation |
|---|
| Frequency | |
|---|
| 3 s–6 s | 8.5594 | 1.0833 | 7.4761 | 3.2360 | 0.1221 |
| 4 s–6 s | 8.1811 | 1.0471 | 7.1340 | 3.3390 | 0.1269 |
| 5 s–6 s | 7.9973 | 0.9794 | 7.0179 | 3.4948 | 0.2000 |
| 6 s–6 s | 8.0312 | 0.8706 | 7.1606 | 3.6354 | 0.1027 |
Table 8.
Flushing results by setting rectangular nozzle at different locations.
Table 8.
Flushing results by setting rectangular nozzle at different locations.
| | Parameter | Average Peak Value (m) | Average Minimum Value (m) | Variation Range (m) | Average Value (m) | Peak Value Deviation | Flow Velocity (m/s) |
|---|
| Location | |
|---|
| Top (5 s–6 s) | 8.6996 | 0.9879 | 7.7118 | 3.4960 | 0.4364 | 2.314 |
| Middle (6 s–6 s) | 8.4591 | 0.8235 | 7.6356 | 3.6207 | 0.1342 | 2.447 |
| Bottom (6 s–6 s) | 8.0312 | 0.8706 | 7.1606 | 3.6354 | 0.1027 | 2.912 |
Table 9.
Pressure values and statistical analysis after air inflow has been cut off for 6 s when the slot nozzle is set in the middle of the pipe.
Table 9.
Pressure values and statistical analysis after air inflow has been cut off for 6 s when the slot nozzle is set in the middle of the pipe.
| | Parameter | Average Peak Value (m) | Average Minimum Value (m) | Variation Range (m) | Average Value (m) | Peak Value Deviation |
|---|
| Frequency | |
|---|
| 3 s–6 s | 7.6226 | 1.0362 | 6.5864 | 3.1815 | 0.0610 |
| 4 s–6 s | 7.7085 | 0.9806 | 6.7278 | 3.3761 | 0.1064 |
| 5 s–6 s | 7.5513 | 0.9492 | 6.6021 | 3.4420 | 0.0604 |
| 6 s–6 s | 7.6311 | 0.8356 | 6.7955 | 3.5916 | 0.1245 |
Table 10.
Pressure values and statistical analysis after air inflow has been cut off for 6 s when the slot nozzle is set on top of the pipe.
Table 10.
Pressure values and statistical analysis after air inflow has been cut off for 6 s when the slot nozzle is set on top of the pipe.
| | Parameter | Average Peak Value (m) | Average Minimum Value (m) | Variation Range (m) | Average Value (m) | Peak Value Deviation |
|---|
| Frequency | |
|---|
| 3 s–6 s | 7.7121 | 1.3021 | 6.4100 | 3.1782 | 0.3137 |
| 4 s–6 s | 7.8184 | 0.9842 | 6.8342 | 3.3658 | 0.3693 |
| 5 s–6 s | 7.2866 | 0.9516 | 6.3350 | 3.4161 | 0.1366 |
| 6 s–6 s | 7.3132 | 0.9516 | 6.3616 | 3.5605 | 0.1650 |
Table 11.
Pressure values and statistical analysis after air inflow has been cut off for 6 s when the slot nozzle is set at the bottom of the pipe.
Table 11.
Pressure values and statistical analysis after air inflow has been cut off for 6 s when the slot nozzle is set at the bottom of the pipe.
| | Parameter | Average Peak Value (m) | Average Minimum Value (m) | Variation Range (m) | Average Value (m) | Peak Value Deviation |
|---|
| Frequency | |
|---|
| 3 s–6 s | 7.7894 | 1.0326 | 6.7569 | 3.1755 | 0.0985 |
| 4 s–6 s | 7.8789 | 1.0604 | 6.8185 | 3.3937 | 0.1324 |
| 5 s–6 s | 7.9744 | 0.9709 | 7.0034 | 3.4223 | 0.0919 |
| 6 s–6 s | 7.5610 | 0.9359 | 6.6251 | 3.5801 | 0.1910 |
Table 12.
Flushing results when the slot nozzle is set at different locations.
Table 12.
Flushing results when the slot nozzle is set at different locations.
| | Parameter | Average Peak Value (m) | Average Minimum Value (m) | Variation Range (m) | Average Value (m) | Peak Value Deviation | Flow Velocity (m/s) |
|---|
| Location | |
|---|
| Top (4 s–6 s) | 7.8184 | 0.9842 | 6.8342 | 3.3658 | 0.3693 | 2.303 |
| Middle (6 s–6 s) | 7.6311 | 0.8356 | 6.7955 | 3.5916 | 0.1245 | 2.928 |
| Bottom (5 s–6 s) | 7.9744 | 0.9709 | 7.0034 | 3.4223 | 0.0919 | 2.320 |
Table 13.
Flushing results when different shape nozzles are set in the middle of the pipe.
Table 13.
Flushing results when different shape nozzles are set in the middle of the pipe.
| | Parameter | Average Peak Value (m) | Average Minimum Value (m) | Variation Range (m) | Average Value (m) | Peak Value Deviation | Flow Velocity (m/s) |
|---|
| Location | |
|---|
| Round (5 s–6 s) | 8.7165 | 0.7111 | 8.0055 | 3.5498 | 0.2466 | 2.534 |
| Rectangular (6 s–6 s) | 8.4591 | 0.8235 | 7.6356 | 3.6207 | 0.1342 | 2.447 |
| Slot (6 s–6 s) | 7.6311 | 0.8356 | 6.7955 | 3.5916 | 0.1245 | 2.928 |
Table 14.
Flushing results when different shape nozzles are set on top of the pipe.
Table 14.
Flushing results when different shape nozzles are set on top of the pipe.
| | Parameter | Average Peak Value (m) | Average Minimum Value (m) | Variation Range (m) | Average Value (m) | Peak Value Deviation | Flow Velocity (m/s) |
|---|
| Location | |
|---|
| Round (4 s–6 s) | 8.6875 | 1.0217 | 7.6658 | 3.3755 | 0.2635 | 2.311 |
| Rectangular (5 s–6 s) | 8.6996 | 0.9879 | 7.7118 | 3.4960 | 0.4364 | 2.314 |
| Slot (4 s–6 s) | 7.8184 | 0.9842 | 6.8342 | 3.3658 | 0.3693 | 2.303 |
Table 15.
Flushing results when different shape nozzles are set at the bottom of the pipe.
Table 15.
Flushing results when different shape nozzles are set at the bottom of the pipe.
| | Parameter | Average Peak Value (m) | Average Minimum Value (m) | Variation Range (m) | Average Value (m) | Peak Value Deviation | Flow Velocity (m/s) |
|---|
| Location | |
|---|
| Round (4 s–6 s) | 8.9498 | 1.0193 | 7.9305 | 3.4144 | 0.1342 | 2.957 |
| Rectangular (6 s–6 s) | 8.0312 | 0.8706 | 7.1606 | 3.6354 | 0.1027 | 2.912 |
| Slot (5 s–6 s) | 7.9744 | 0.9709 | 7.0034 | 3.4223 | 0.0919 | 2.320 |
Table 16.
Conventional index of sanitiser and the requirements in drinking water.
Table 16.
Conventional index of sanitiser and the requirements in drinking water.
| Name of Disinfection | Reaction Time in the Water | Regulated Value from Treatment Plant | Minimum Value from Treatment Plant | Minimum Value at End Pipe |
|---|
| Chlorine and free chlorine preparation (free chlorine, mg/L) | At least 30 min | 4 | ≥0.3 | ≥0.05 |
Table 17.
The comparison of two flushing methods in this case study.
Table 17.
The comparison of two flushing methods in this case study.
| Flushing Cleaning Method | Flushing Time | Water Consumption | Water Price | Total Cost |
|---|
| Single-phase flushing method | 8 h | 39,067 m3 | 2.8 Yuan/m3 (approximately 0.42 US dollars/m3 or 0.36 Euros/m3) | 109,387.6 Yuan (approximately 16,421.9 US dollars or 14,096.5 Euro) |
| Two-phase (gas and water) flushing method | 1 h 20 min | 2000 m3 | 2.8 Yuan/m3 (approximately 0.42 US dollars/m3 or 0.36 Euros/m3) | 5600 Yuan (approximately 840.7 US dollars or 721.7 Euros) |
