1. Introduction
Water is the source of life, the key to production, and the foundation of ecology. This natural resource is both irreplaceable and a key resource for economic development, ecological systems, and even national security. However, as economies develop and urban construction and population levels accelerate, surface waters become more-and-more polluted by irrational discharges of municipal waste, domestic sewage, industrial and hospital wastewater, and human and animal manure, which all degrade water quality. Thus, shortages in water resources, as well as pollution, ecological deterioration, flooding, and droughts, all pose serious threats to global economic development, the health of populations, the environment for human inhabitation, and national security. Numerous rivers and lakes around the world have been polluted and have suffered ecological degradation as a result of rapid local economic development; relevant examples of rivers include the Delaware River in the United States [
1], the Thames in the UK [
2], and the Rhine in Germany [
3], as well as Lake Biwa in Japan [
4]. A number of studies have also indicated that the water quality of 40% of rivers and estuaries does not meet environmental standards because of pathogenic microorganisms [
5]. Water polluted by pathogenic microbes can also lead to a variety of water-borne infectious diseases, including diarrhea, nausea, gastroenteritis, and typhoid dysentery, all of which are significant threats to human health, especially in children and people with weak immune systems [
6,
7,
8,
9,
10,
11,
12,
13]. Bacterial pollution can also affect the quality of recreational water [
5]; microbial contamination has led, for example, to a number of water-borne infectious diseases in the Mekong River [
9].
Long-term systematic research on the microorganisms present in Chinese rivers and lakes has generally been limited, and just a handful of reports have appeared. The results of one survey carried out over more than a year revealed rather serious microbial contamination in the Wenyu River, Beijing, including significant organic pollution and eutrophication [
14]. Similarly, the overall water quality in the reservoir area of the Three Gorges Dam was mainly at Grade III of the Water Quality Standard for the Surface Water Environment (GB/3838-2002), although taking the index of fecal coliform bacteria into account, the quality of this water is classified as Grade IV or sub-Grade V overall [
15]. Further work has shown spatiotemporal variability in the distribution of pathogens in the Haihe River Basin as microbial pollution is significantly correlated with population density, the urbanization rate, and the proportion of tertiary industry contributing to local gross domestic product [
16].
The water resources of Tibet are very rich and diverse, include river, lake, rain, ice/snow melt water, and groundwater; according to China’s Water Resources Report in 2016, the volume of surface water of Tibet was 4.642 × 10
11 m
3, the groundwater was 1.028 × 10
11 m
3, and the total water resources of this region are ranked first within China and accounted for 14.3% of the national total in 2016 [
17]. The per capita water resources of Tibet are also the highest in China, even though water per square kilometer land in this region is just 40% of the national average, indicating an uneven distribution [
18]. The annual average precipitation was 611.6 mm in 2016 [
17], but precipitation in Tibet was also extremely irregular throughout the year, as more than 80% occurs between June and September. According to a surface water report for Tibet published in 2012, the quality of this resource is good; 98.96% of the total rivers evaluated reached, or exceeded, Grade III surface water environmental quality [
19]. Water in most parts of Tibet meets Chinese national standards, as well as World Health Organization international standards [
20,
21], as the major rivers and lakes in this region remain in good condition [
22]. At the end of 2016, the total population in Tibet was 330.54 million, of which 70.44% represented the rural population [
23]. The population distribution of this region is also scattered in agricultural and pastoral areas because of complex local physical and geographical conditions. The distribution of the Tibetan population is also significantly related to rivers, as 80.46% of people live less than 10 km away from a water course [
24]. Thus, the main sources of drinking water in this region are river and groundwater that have not been specially purified or disinfected; as just sedimentation and simple filtration are applied, the quality of river water directly influences the quality of drinking water and has health implications for local people in river basins where data has not been collected. To date, few studies have been carried out on the levels of microbial contamination in typical small Tibetan rivers.
The aims of this study were therefore to: (1) Identify the overall level of microbial contamination within the Xincang River Basin; (2) Evaluate the spatiotemporal characteristics of changes in total bacteria (TB) and coliform (TC) levels; and (3) Analyze the main driving forces and factors affecting changes in TB and TC levels within the watershed, including precipitation, animal husbandry, and domestic sewage. Water samples were collected during wet and dry seasons along an upstream-to-downstream river basin transect; both TB and TC levels were evaluated in the laboratory, and locally-investigated human and animal activities. The results of this study are likely to provide important baseline data for local environmental protection and public health management in these small Tibetan Plateau river basins.
2. Materials and Methods
2.1. Study Area
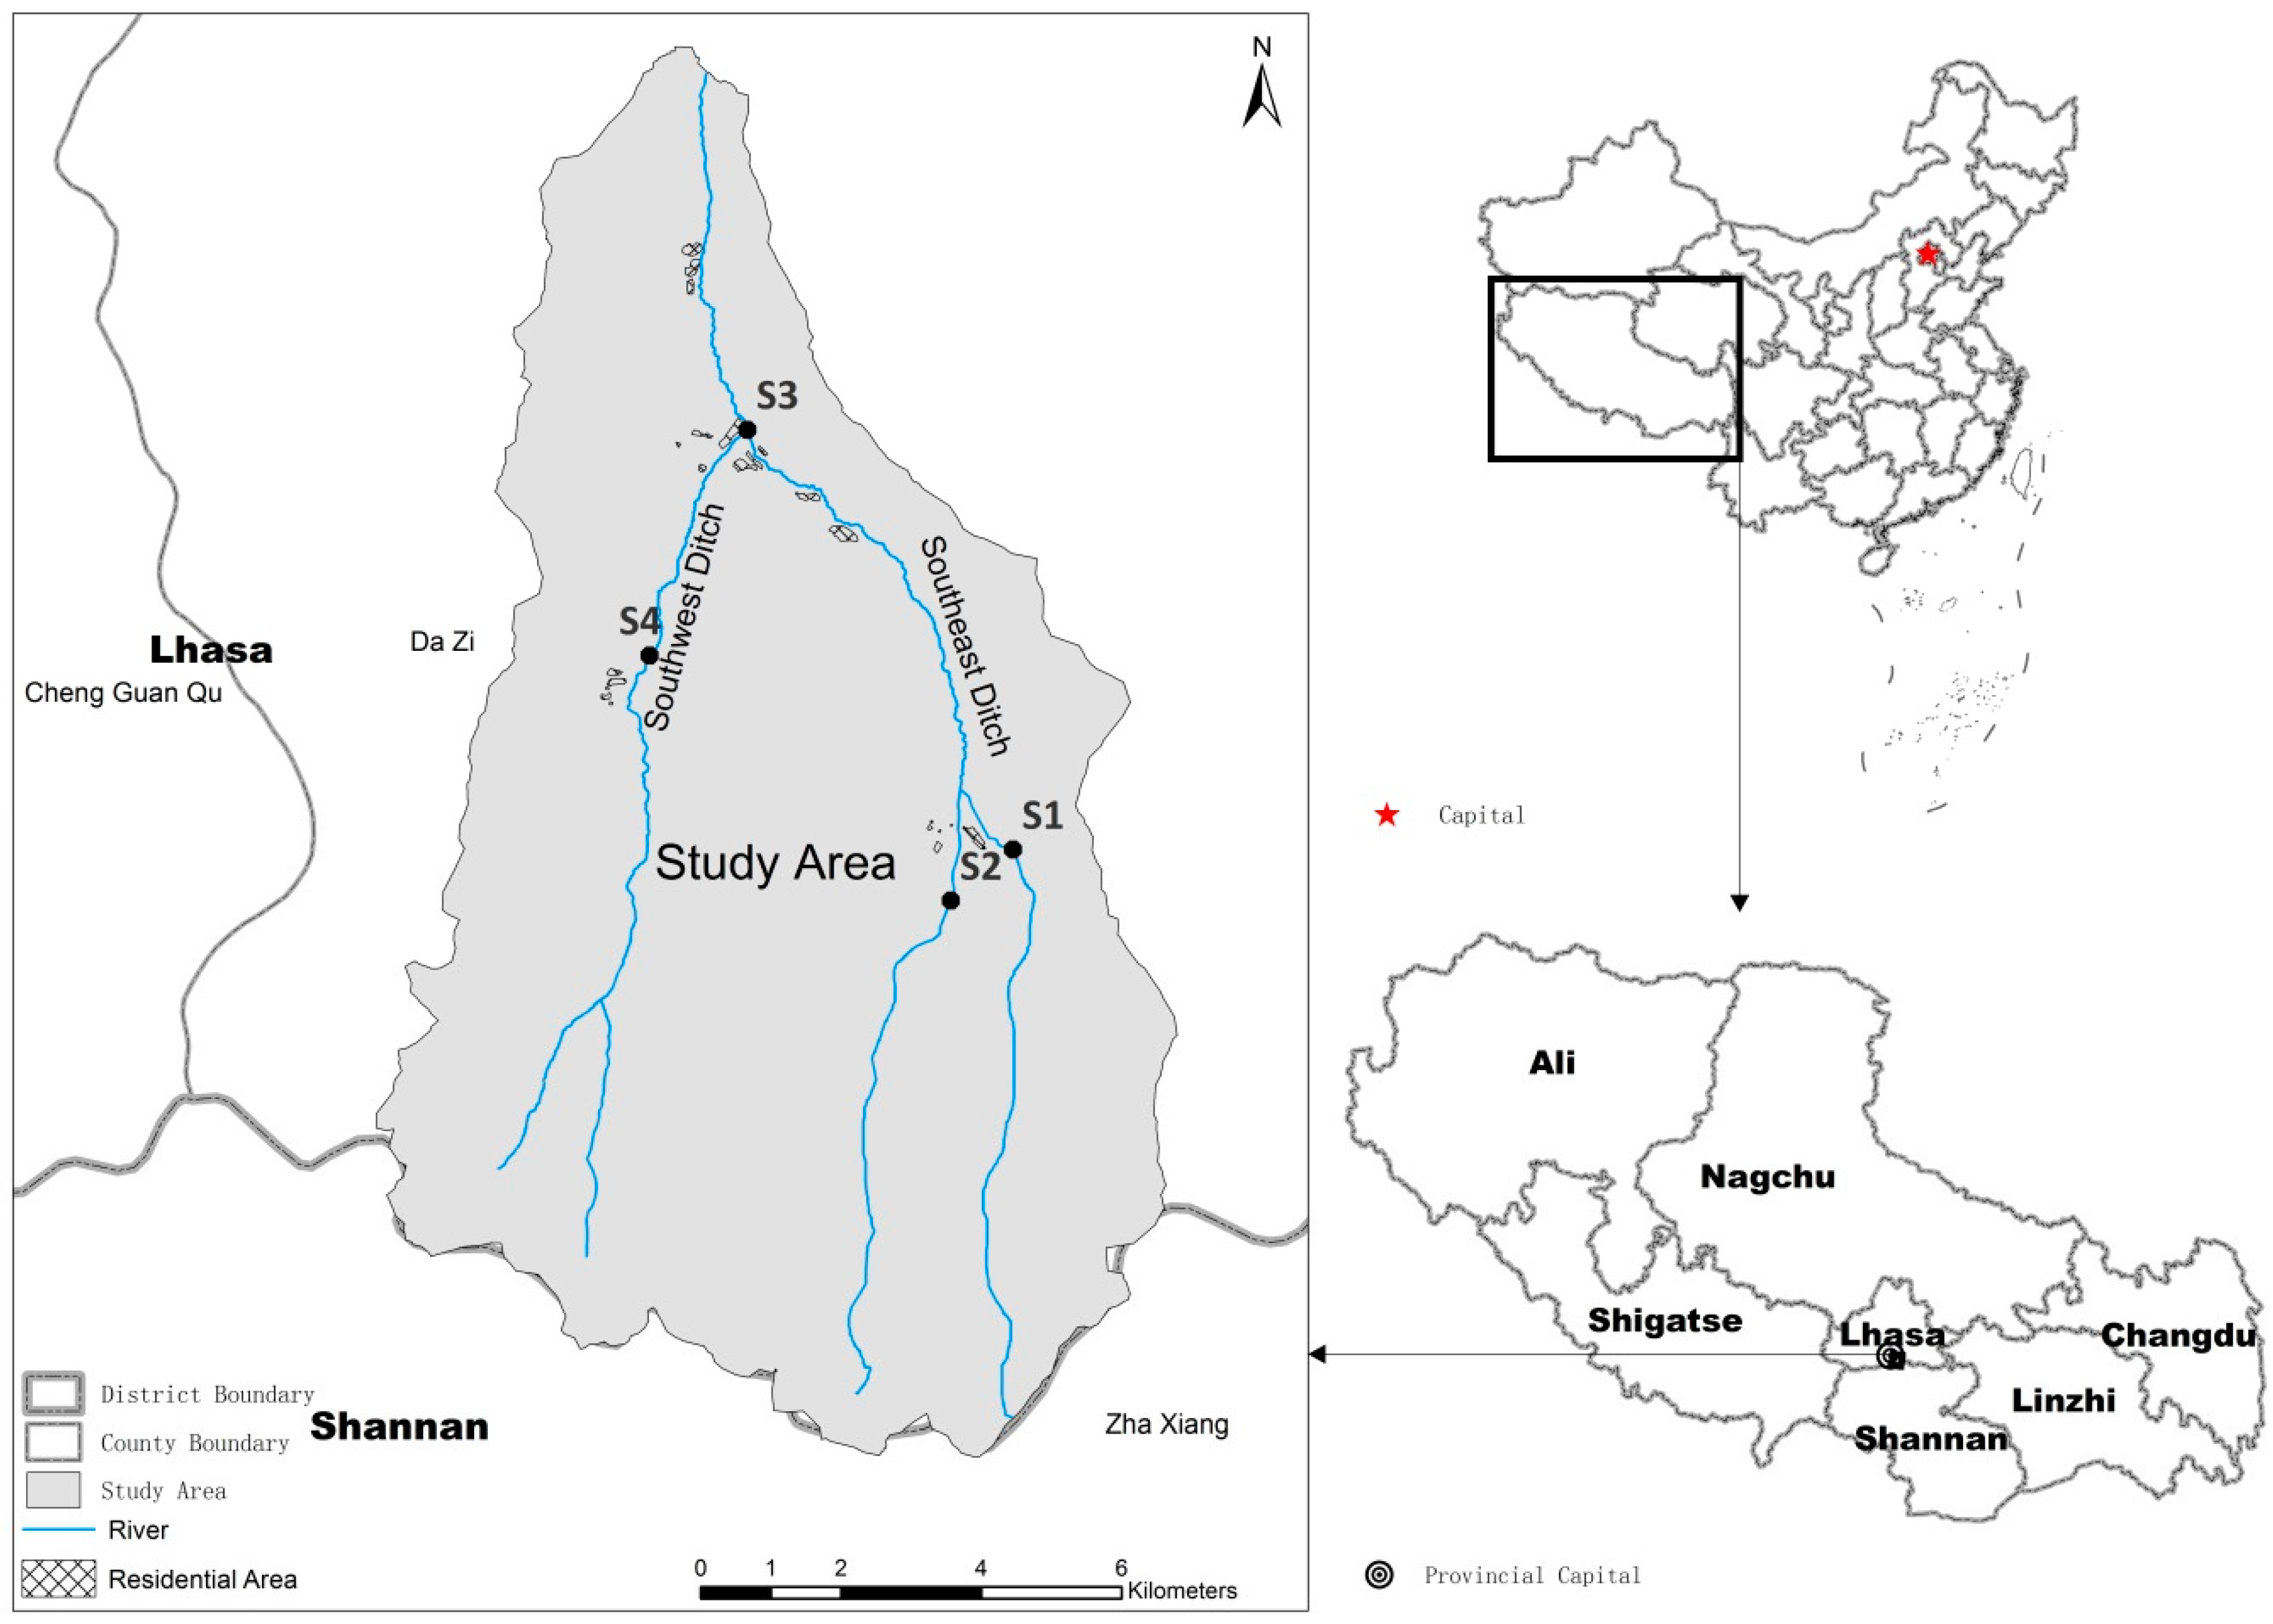
The research reported in this paper was conducted within the Xincang River Basin on the Tibetan Plateau. This River Basin is located 6.2 km from Dazi County and 35.8 km from the city of Lhasa (
Figure 1), and encompasses latitudes between 29.48 degrees and 29.68 degrees, as well as longitudes between 91.24 degrees and 91.50 degrees. The area of this basin is 137.8 km
2, and its highest and lowest elevations are 5539 m and 3662 m, respectively.
The Xincang River has two major tributaries, referred to as the Southeast and Southwest ditches, which both run from south-to-north through the village of Xincang. In 2015, the village population was 1540 people in 346 households. This corresponds to an average of 4.4 people per household. Their drinking water sources were obtained from the upstream section of the Xincang River by a small centralized water supply system. In the downstream (northern) section of the river basin, at elevations between 3750 m and 3800 m, arable land is the main land use type, while at elevations between 3930 m and 4200 m, in the midstream section, the main land use types are grassland and arable land. In contrast, in the upstream (southern) section of the area at elevations more than 4500 m, the main land use type is grassland, where local residents graze their livestock in summer. This land is only suitable for animal husbandry and the main livestock are yak, cattle, goats, and sheep. In addition, there is no industrial activity at these high elevations. Although the rainy season in Tibet extends between June and September, this season only lasts between July and August in the Xincang River Basin. It nevertheless rains enough throughout this period to generate runoff onto the land; this runoff can transport large volumes of sediment, household waste, and even human and animal excrement into the river.
Two modes of production are seen within the Xincang River Basin, planting and animal husbandry, corresponding with typical activities within Tibet in general. Statistics show that 85.3% of the Tibetan population inhabits an area between 3500 m and 4100 m above sea level [
24], a range that encompasses the altitude of the Xincang River Basin. A number of small watersheds like the Xincang River Basin are known throughout Tibet and the population of this region is significantly distributed alongside rivers; farmers and herdsmen live on plains and obtain their drinking water from the local river. However, few studies have been carried out on these small watersheds because of a lack of data, even though such rivers share a number of characteristics with one another, including the Xincang River. We chose the Xincang River Basin as our study area because it is close to the Lhasa National Ecological Research Station, Institute of Geographic Sciences and Natural Resources Research (IGSNRR), China Academy of Sciences (CAS), and so basic data such as temperature and precipitation could be obtained. The results we present for the Xincang River Basin are likely to reflect, to a certain extent, the basic circumstances of other small watersheds for which data are not available. Our results therefore provide a key reference for similar future work, especially the protection of local drinking water safety.
2.2. Sampling Locations and Data Collection
In order to generate information about the spatial change characteristics of microbes and the effects of human activities on Xincang River Basin water quality while taking the distribution of residents and river trends into account, four sampling sites were set up throughout the basin (
Figure 1). Thus, Site 1 and Site 2 are located in the Southeastern Ditch, upstream of the residential area, an area within the upper reaches of Xincang River Basin. In contrast, Site 3 is located in the residential area downstream, while Site 4 is located to the north of the settlement in the Southwestern Ditch, in the middle of the basin. Basic information about these four sampling sites is provided in
Table 1; their locations are shown in
Figure 1. We collected samples between July 2014 and April 2015, encompassing both wet and dry periods in Tibet. We recovered a total of 239 water samples from four points.
2.3. Microbiological Assays
2.3.1. Bacterial Indicators
Microbiological indicators provide the main basis for assessing surface water microbial contamination. However, because of low concentrations of pathogenic microorganisms and testing difficulties, we used a detection indicator bacterial series to evaluate both microbial contamination status and water safety. In this context, the most commonly used indicators internationally [
25,
26] are values for TB, TC, fecal coliforms [
9], Escherichia coli, and fecal streptococci. At present, however, the index system used to evaluate Chinese river water quality is mainly based on conventional physical and chemical indicators and little consideration is currently afforded to microbiological evaluation. The
Environmental Quality Standards for Surface Water (GB/3838-2002), for example, only take FC concentrations into consideration [
27], which means that microbial contamination levels in Chinese rivers currently remain unclear and these indexes are not very useful to the management and sustainable development of water courses.
Related research on microbial indicators in surface water has shown that TB values are useful for evaluating the degree of sample microbiological contamination; thus, a higher standard plate-count of bacteria implies a greater degree of microbial contamination and a higher probability that pathogenic microorganisms are present [
28]. Similarly, the use of TC values is also common in analyses of this type; as the largest number of bacteria is found in the intestines of humans and other warm-blooded animals, TC values can be detected from feces. As TC values are also correlated to a certain extent with water pathogens, this indicator is also a valuable indicator of the presence of water-borne bacteria. Indeed, in 1914, the United States Department of Public Health used TC values as a microbial indicator of the presence of manure pollution in drinking water; this indicator is now commonly used to evaluate levels of water pollution and routinely used for water quality monitoring in China. Thus, as people in both agricultural and pastoral areas of Tibet routinely obtain their drinking water directly from untreated rivers around their dwellings, we chose to mainly monitor TB and TC levels.
2.3.2. Detection Method
We compared the accuracy and convenience of various detection methods [
29] and chose to use the standard plate counting approach to evaluate TB levels, expressed as colony forming units (CFU) per milliliter of water (CFU/mL). We also detected TC levels using the enzyme substrate method, expressing this concentration as the most probable number (MPN) in 100 mL water (MPN/100 mL). All our tests were carried out in accordance with the
Standard Examination Methods for Drinking Water (GB/T5750-2006) [
30], and the collected water samples were protected from direct sunlight exposure and were tested for the bacteria within four hours. All water samples were tested at the Center for Disease Control and Prevention within the Tibet Autonomous Region.
We applied current Chinese water quality standards [
31,
32,
33,
34] in this study and our microbiological evaluation criteria are listed in
Table 2. These standards suggest that when the TB concentration in water is less than 1000 CFU/mL, microbial contamination is considered not serious. However, when the TC level is less than 100 MPN/mL, microbial contamination is mild-to-moderate and water is drinkable if disinfection measures are applied. Only when TC levels are undetectable as required in Chinese
Standards for Drinking Water Quality (GB/T5749-2006) can the water be drunk directly.
2.4. Data Sources
We obtained Digital Elevation Model data from the Data Center for Resources and Environmental Sciences, CAS, and generated land use data via visual interpretation from Landsat remote sensing images. Climate data, including precipitation and temperature, was provided by the Lhasa National Ecological Research Station, IGSNRR, CAS.
2.5. Statistical Analyses
We recorded and sorted all data for analyses, computed the minimum, maximum, median, mean, and standard deviations (SD) of TB and TC values, and simulated the relationship between the month and qualified rate of microbiological indexes in the Xincang River Basin using Microsoft Excel 2010. Statistical analyses were performed using the software SPSS 20.0 (IBM Corp., Armonk, NY, USA); the differences in TC and TB concentrations at different locations and the differences in different seasons were analyzed using Kruskal-Wallis tests with a P value equal to 0.05; a significant difference can be reported when P value is less than 0.05. We assessed relationships between microorganisms and precipitation, as well as between microbiological contamination condition and main sources, using Pearson correlation coefficients [
35]. Several figures in this paper were generated using the software OriginPro 2017 (OriginLab Corp., Northampton, MA, USA).
3. Results and Discussions
3.1. TB and TC Data Analysis
3.1.1. TB and TC Concentrations
We counted microbiological indicators in our water samples using the software Microsoft Excel 2010 (
Table 3). Results show that the TB concentration in the Xincang River Basin varied greatly, ranging between undetectable levels and 840 CFU/mL (mean: 83 CFU/mL; median: 35 CFU/mL; SD: 129.42).
Although the maximum recorded TC level in water samples from the Xincang River Basin was 500 MPN/100 mL, in some water samples, this index was not detectable (mean: 300 MPN/100 mL; median: 235 MPN/100 mL; SD: 1.93).
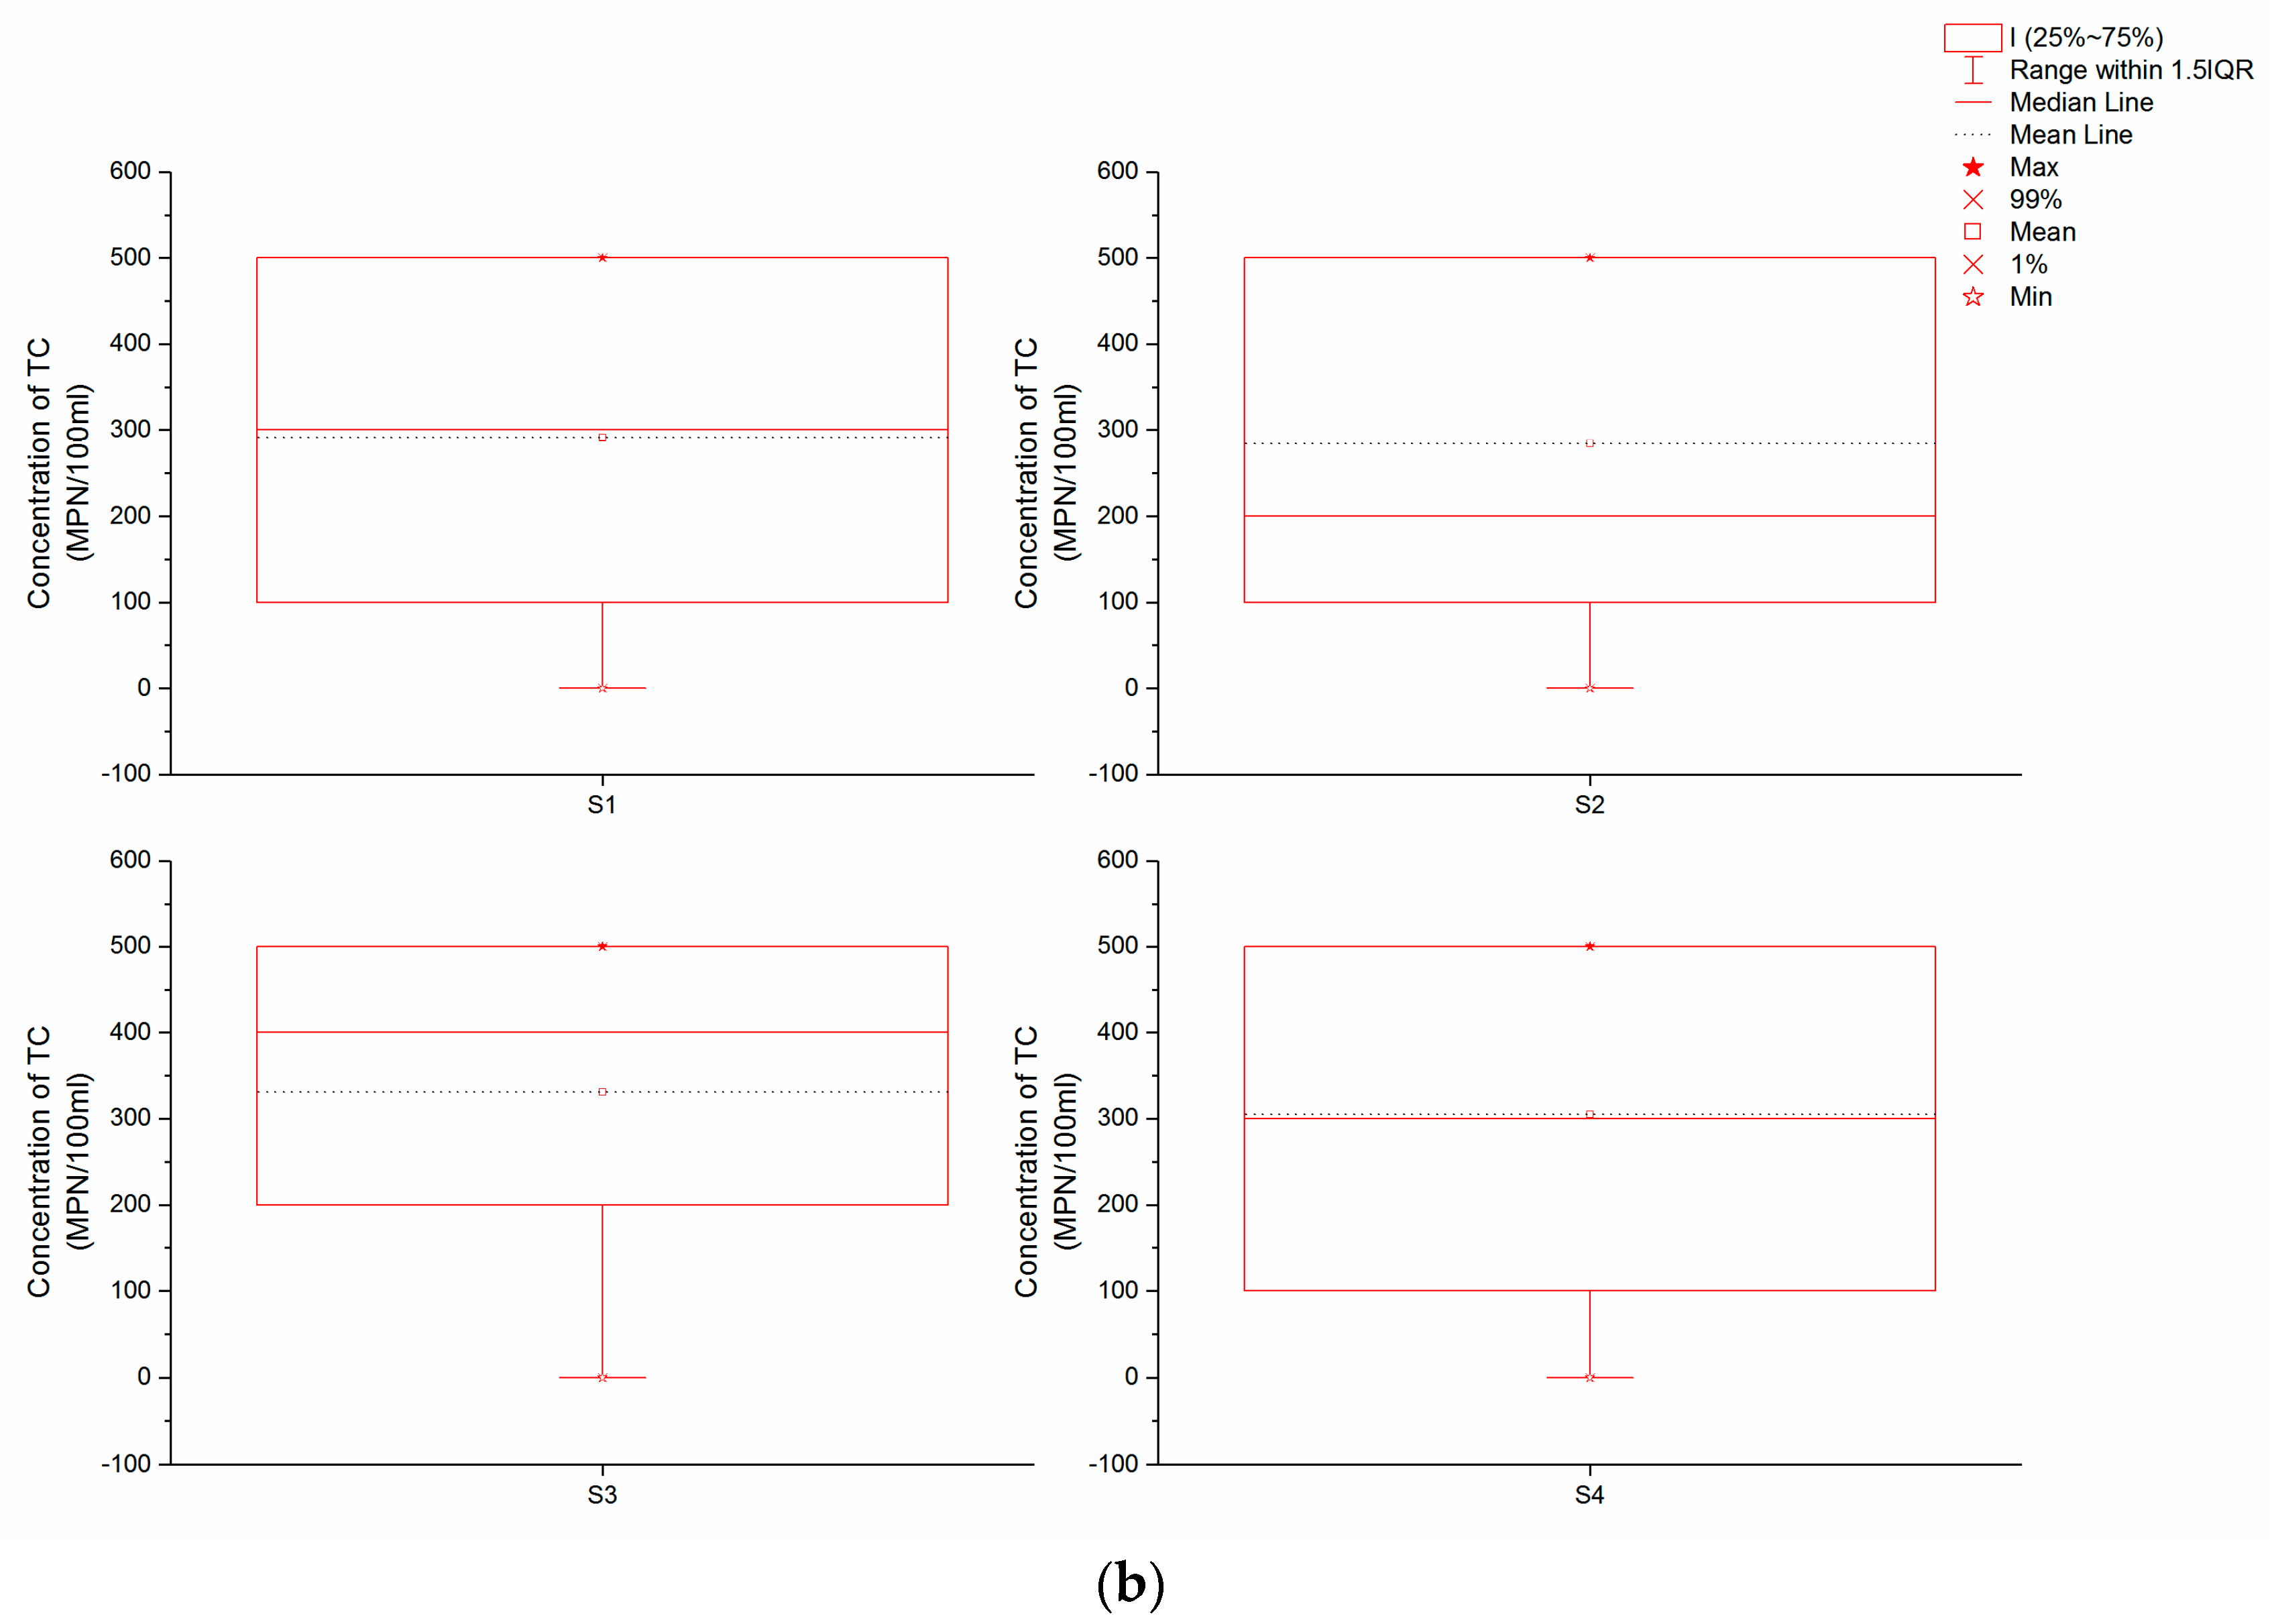
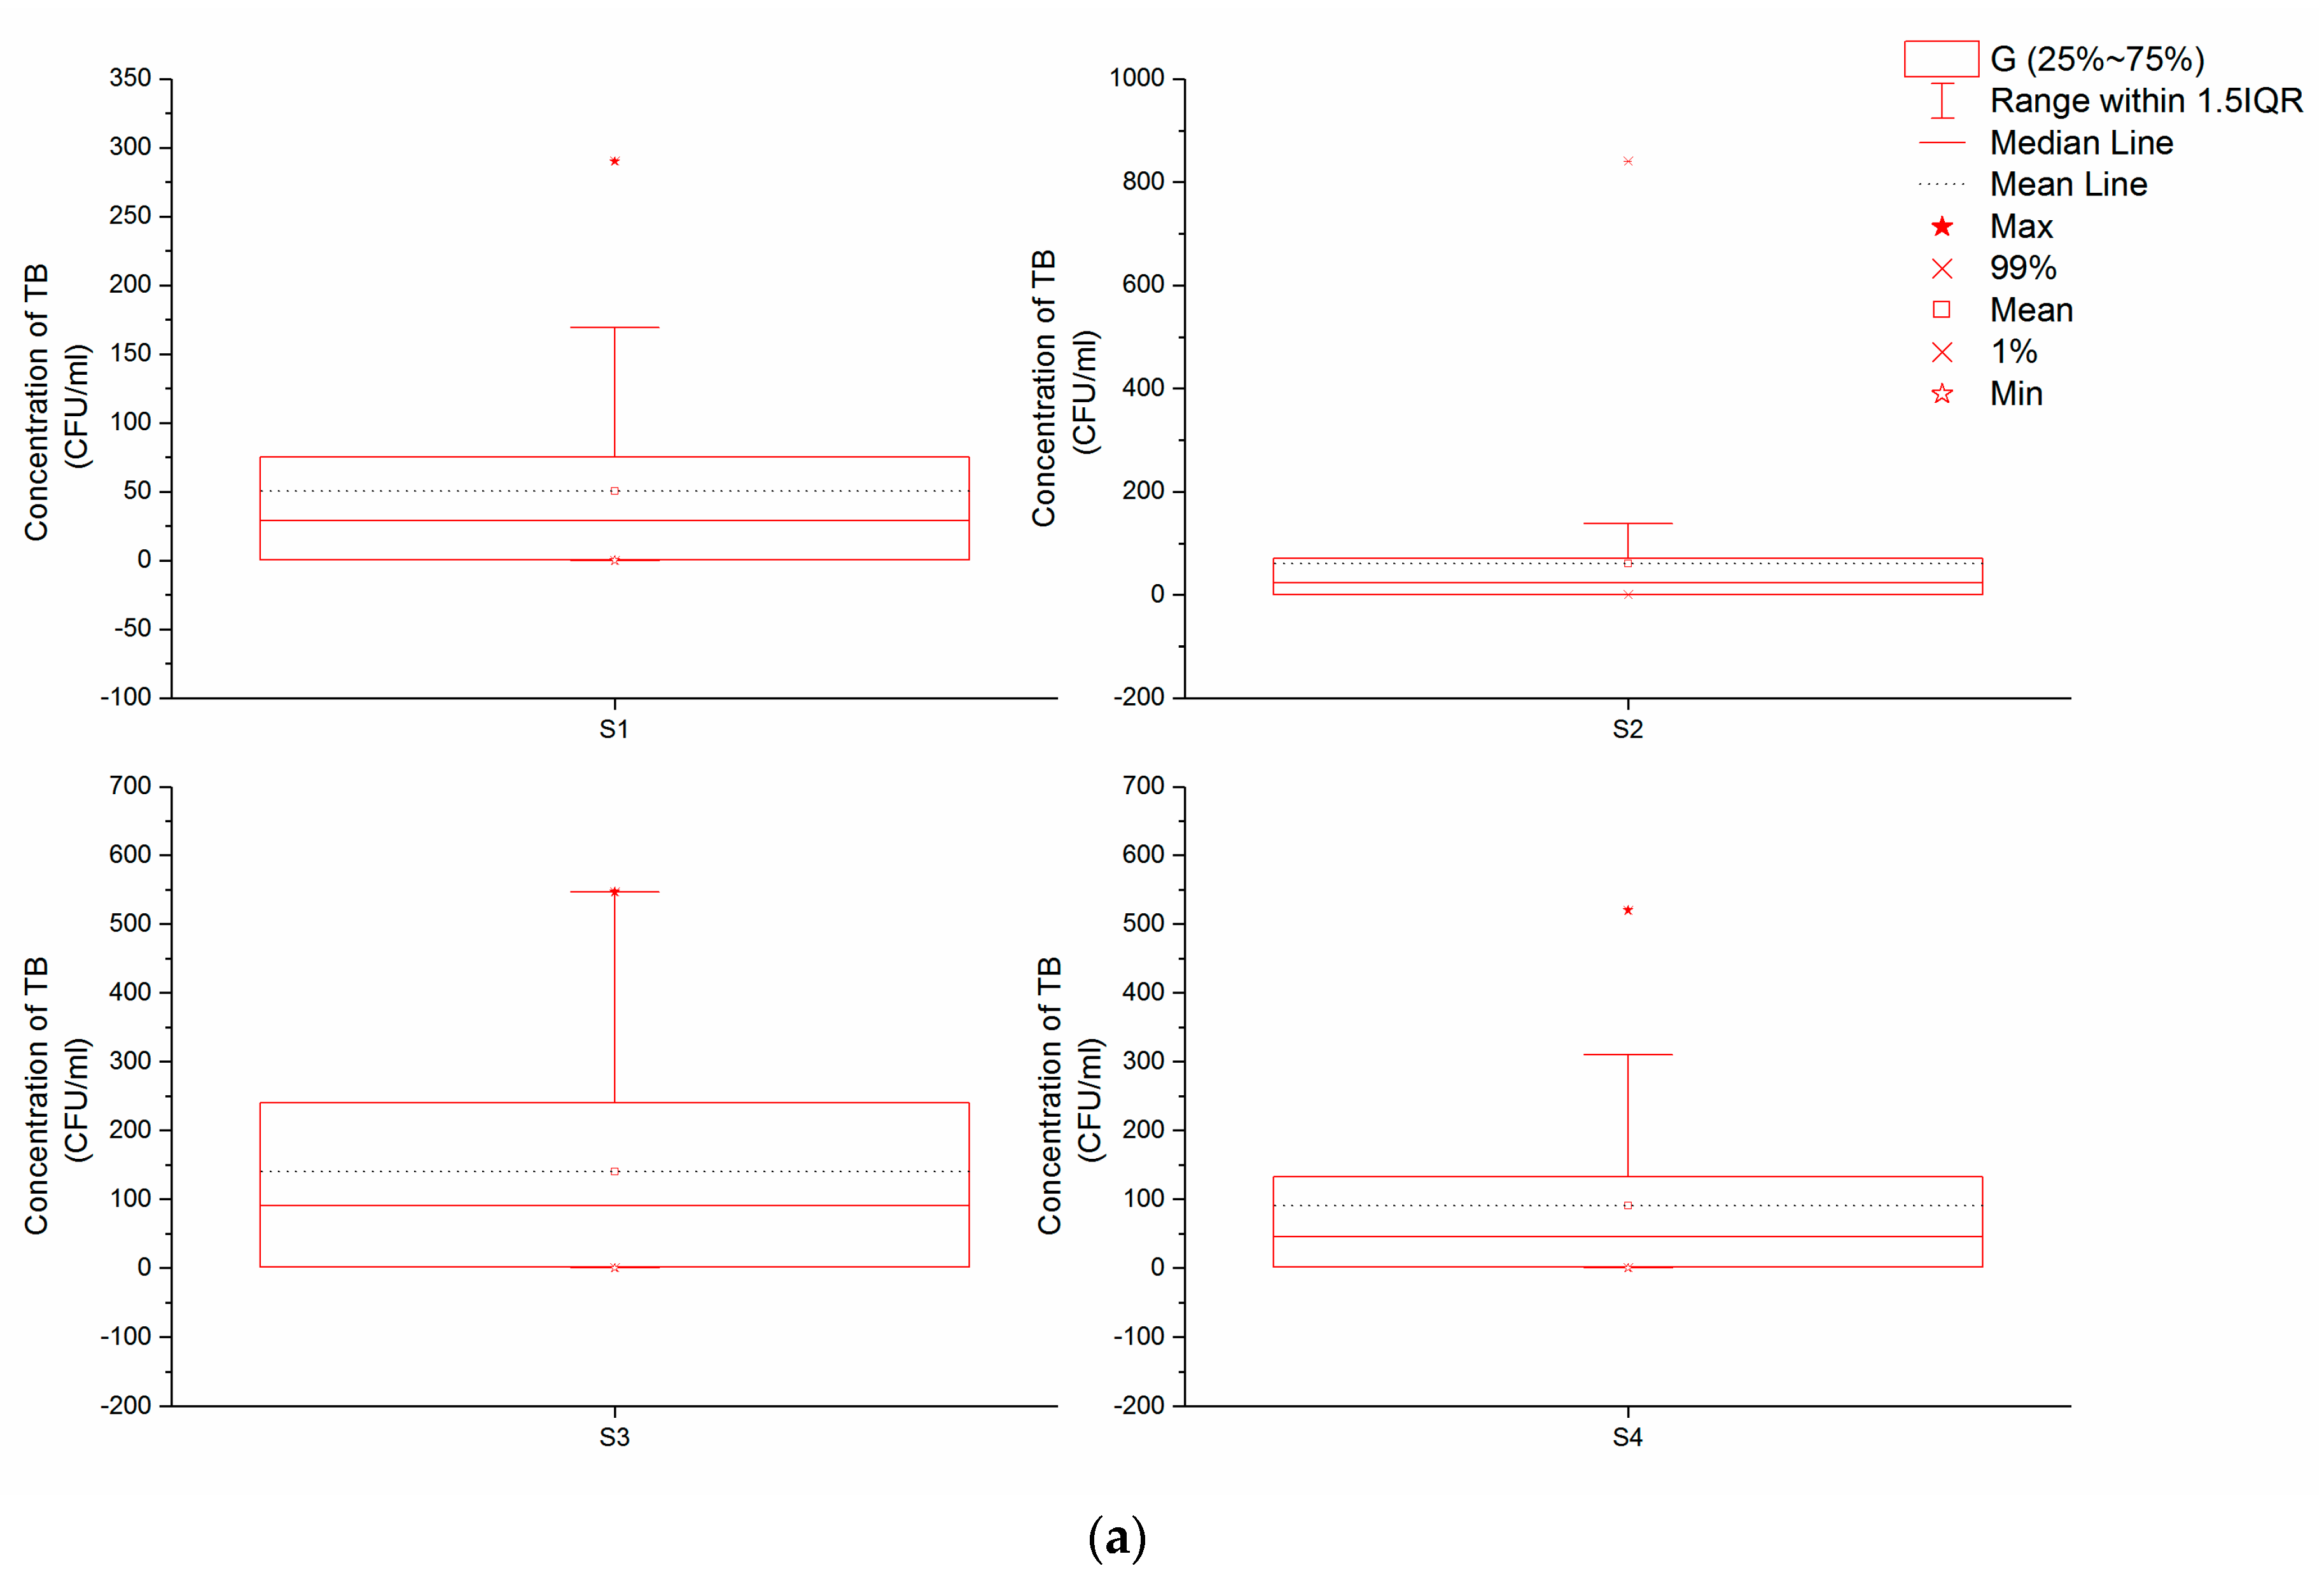
Our results reveal significant differences in TB and TC concentrations between sampling points (
Figure 2a,b); the maximum TB concentration we recorded within the Xincang River Basin was 840 CFU/mL at S3. Indeed, across all four sampling points, the mean concentration of TB at S3 was the highest, 135 CFU/mL, while at S1 and S2, this concentration was less than 100 CFU/mL in most (more than 75%) samples (recorded means at S1 and S2 were 50 CFU/mL and 61 CFU/mL, respectively). Similarly, although the concentration of TB in some water samples from S4 was greater than 100 CFU/mL, both the mean and median were less than 100 CFU/mL, higher than values recorded at S1 and S2, but lower than those from S3.
The data presented in
Figure 2b show that the mean concentrations of TC at S1 and S2 approached 280 MPN/100 mL, while the mean at S4 was a little higher, with a value of about 300 MPN/100 mL. In contrast, the mean TC concentration at S3 was 331 MPN/100 mL, the highest recorded at our four sampling points.
3.1.2. Qualified Microbiological Index Rate
Because local people on the Tibetan Plateau always use surface water or groundwater adjacent to their dwellings as drinking water sources, the Xincang River Basin is the main water source for the village of Xincang. Applying the Standards for Drinking Water Quality (GB/T5749-2006), we determined microbial contamination in this river, noting that when TB is less than 100 CFU/mL and TC is undetectable in 100 mL water samples, the sample is qualified at the point of the microbial index. We therefore applied a rate equivalent to the proportion of microbial qualified water samples versus the total number of samples. Our data show that of 239 water samples we collected from Xincang River Basin, 31 meet both TB and TC requirements and thus the qualified microbiological index rate was 12.97%.
The results also show that qualified microbiological index rates differ at different sampling points within the Xincang River Basin; thus, the rate recorded at S2, 23.73%, was the highest, while those recorded at S1 and S4 were 11.86% and 10.17%, respectively, and that at S3 was the lowest, at just 5.08%. The S3 qualified rate was less than a quarter of that at S2 and just half the rate recorded at S1 and S4.
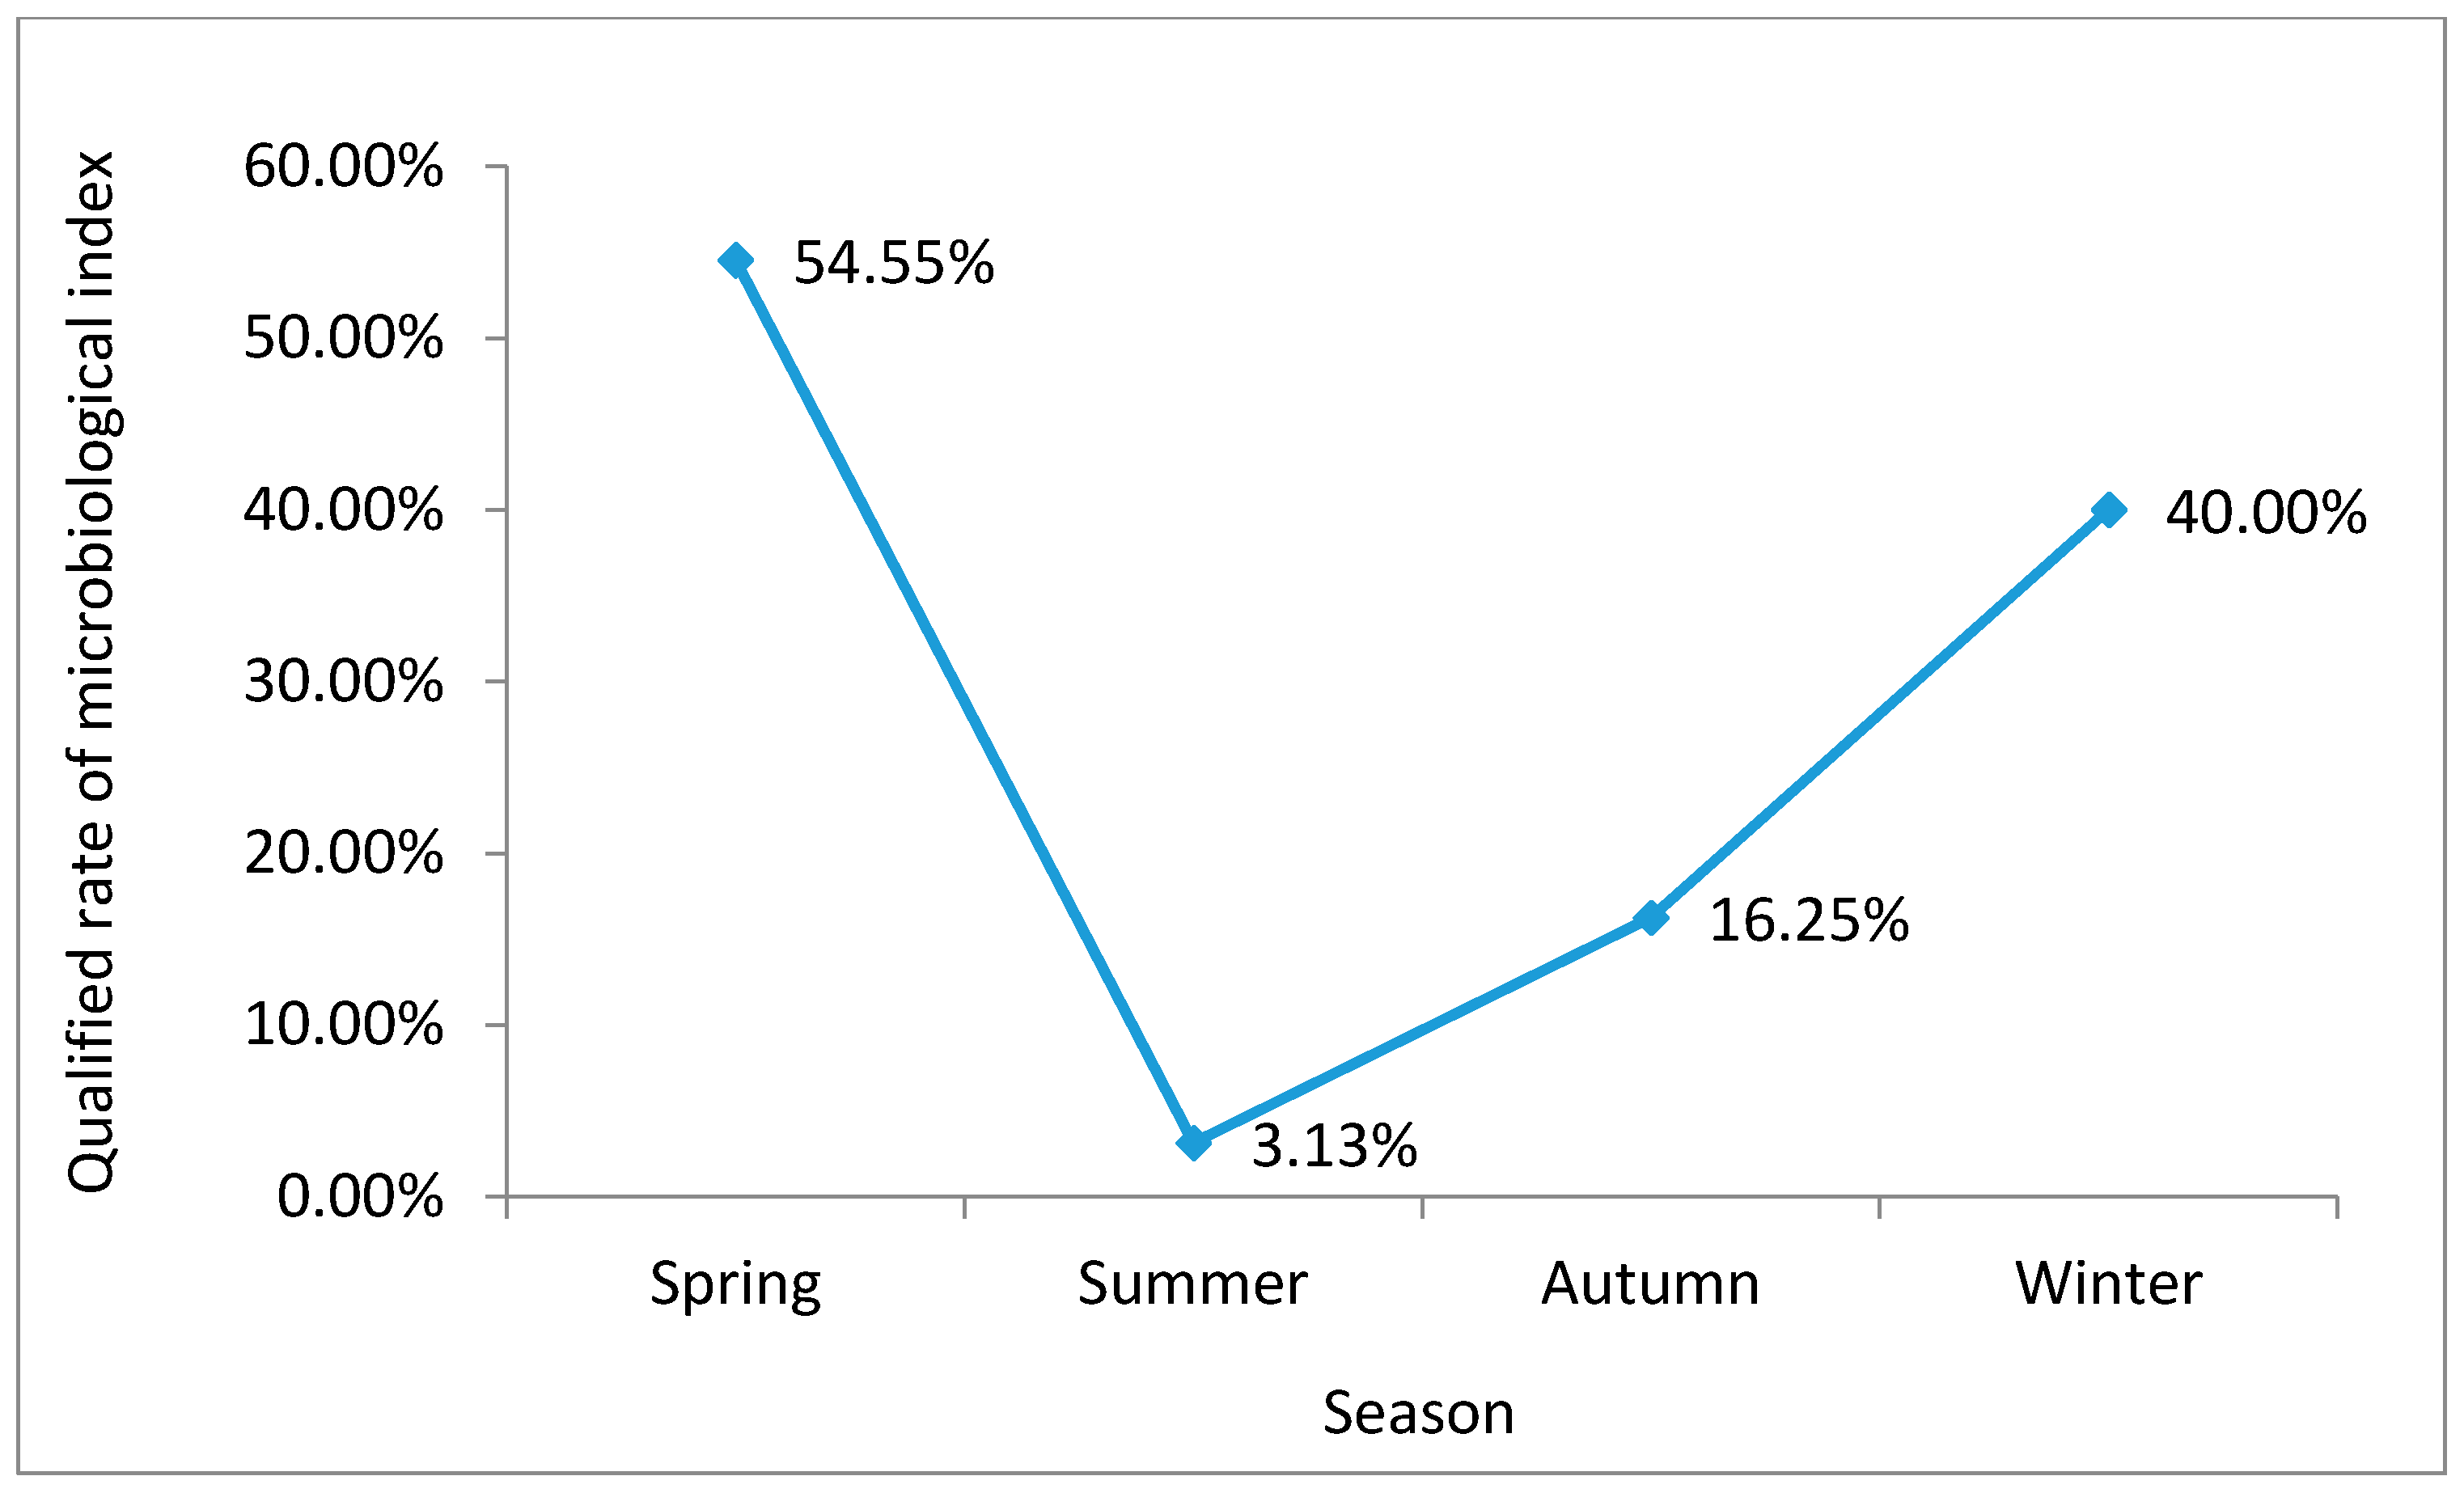
Comparing the qualified rates of water samples from different seasons, our data show that the proportion of microbes in water samples varies in a ‘V-shape’ throughout the year (
Figure 3). The qualified microbiological index rate began to decrease from spring onwards, reaching its lowest rate in the summer, before starting to rise again in the autumn to another relatively high winter level.
3.1.3. Overall Microbial Contamination in Xincang River Basin
Applying relevant Chinese water quality standards, we utilized the microbiological evaluation criteria shown in
Table 2. Data show that because the maximum TB and TC concentrations recorded in the Xincang River Basin were 840 CFU/mL and 500 MPN/100 mL, respectively (
Table 3), microbial contamination of this watershed is not serious. At the same time, however, the level of microbial contamination at each sampling point was different; data show that both the mean and median of TB at S1 and S2 were nearly 50 CFU/mL, while at S4, these values were a bit higher than S1 and S2 but less than 100 CFU/mL. These data suggest that S1, S2, and S4 are all oligo-contaminated, with a microbiological condition that can be considered mild or moderate. In contrast, because the mean TB concentration at S3 was more than 100 CFU/mL, this site can be classified as being within the β-mesosaprobic zone. The mean TC concentration at S3 was highest, followed by S4; this implies that microbiological contamination at S3 is more serious than at S4, although both levels are still moderate. In contrast, much less contamination is detected at S1 and S2, exhibiting only mild levels.
3.2. Spatiotemporal Characteristics of TB and TC Distribution
We chose Spring (March, April, and May), Summer (June, July, and August), Autumn (September, October, and November), and Winter (December, January, and February) as the four time periods used in this study to analyze the bacterial characteristics of the Xincang River Basin. Upstream, midstream, and downstream sections were used as spatial scales, and we applied Kruskal-Wallis tests to determine microbe spatiotemporal variability at the three locations across the four seasons. The results of these tests reveal highly significant differences in the concentrations of TB and TC between different seasons (p = 0.000, less than 0.05). The spatial distribution of TB between different locations was also significant (p = 0.006), while that of TC was not (p = 0.238).
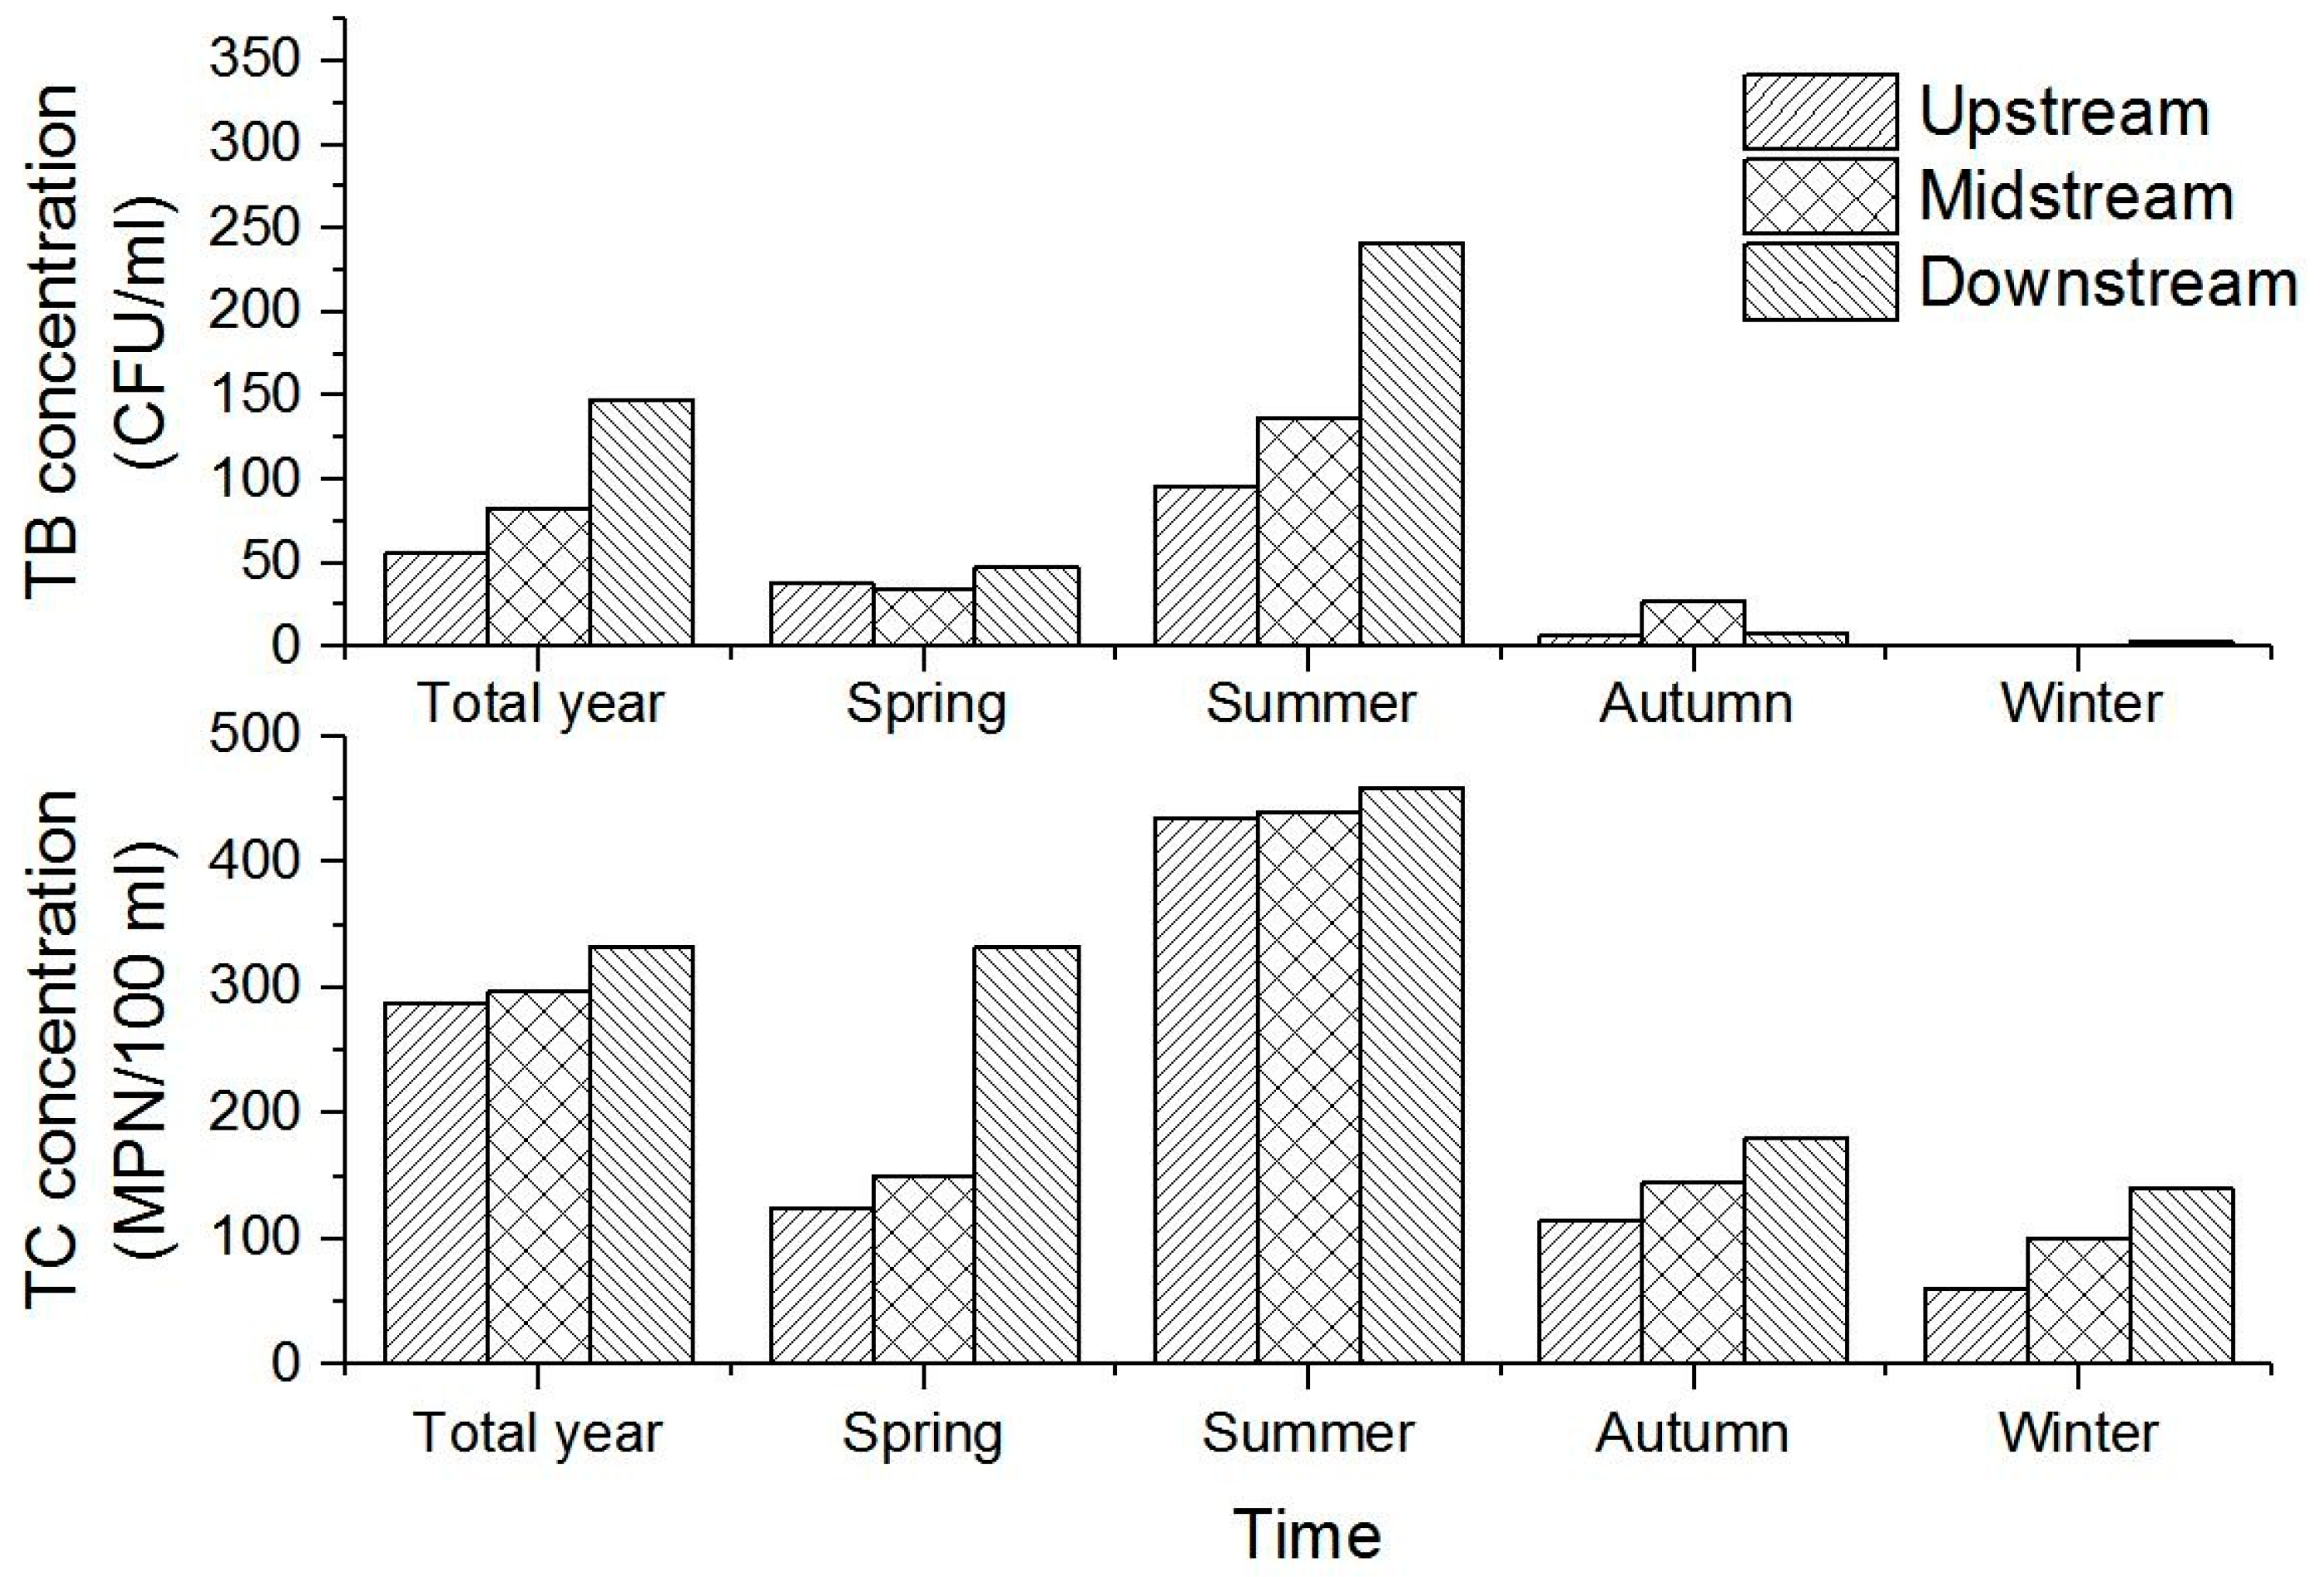
A comparison of TB and TC concentrations (
Figure 4) shows that downstream microbial contamination is significantly more serious than in either upstream or midstream sections. The results show that concentrations of TB and TC downstream were 148 CFU/mL and 333 MPN/100 mL, respectively, while in the midstream section, these concentrations were 83 CFU/mL and 297 MPN/100 mL, respectively. Microbial contamination upstream was slight, with TB and TC concentrations at 56 CFU/mL and 288 MPN/100 mL, respectively, lower than in either downstream or midstream sections. Previous studies have shown that the levels of river microbial contamination are related to local land use, population density, and economic development [
16]. More residential areas and thus higher population levels are located in the downstream sections of the Xincang River Basin, resulting in much larger volumes of rural and domestic sewage discharge and rendering microbial contamination much more serious. Because of a higher population density, it is also important to protect public health and safety within the downstream section of this river basin; thus, studies that deal with the microbial contamination of rivers are of paramount importance to their protection, sustainable development, and the maintenance of local public health.
In
Figure 4, both TC and TB concentrations are kept at the highest level in summer and kept at the lowest level in winter. Microbial contamination in summer is more serious than in the other three seasons.
Figure 4 also shows that the differences in TB concentration from upstream to downstream sections in summer are more significant than the other three seasons. In contrast, the differences in TC concentration from upstream to downstream sections in summer are most insignificant when compared to the other three seasons.
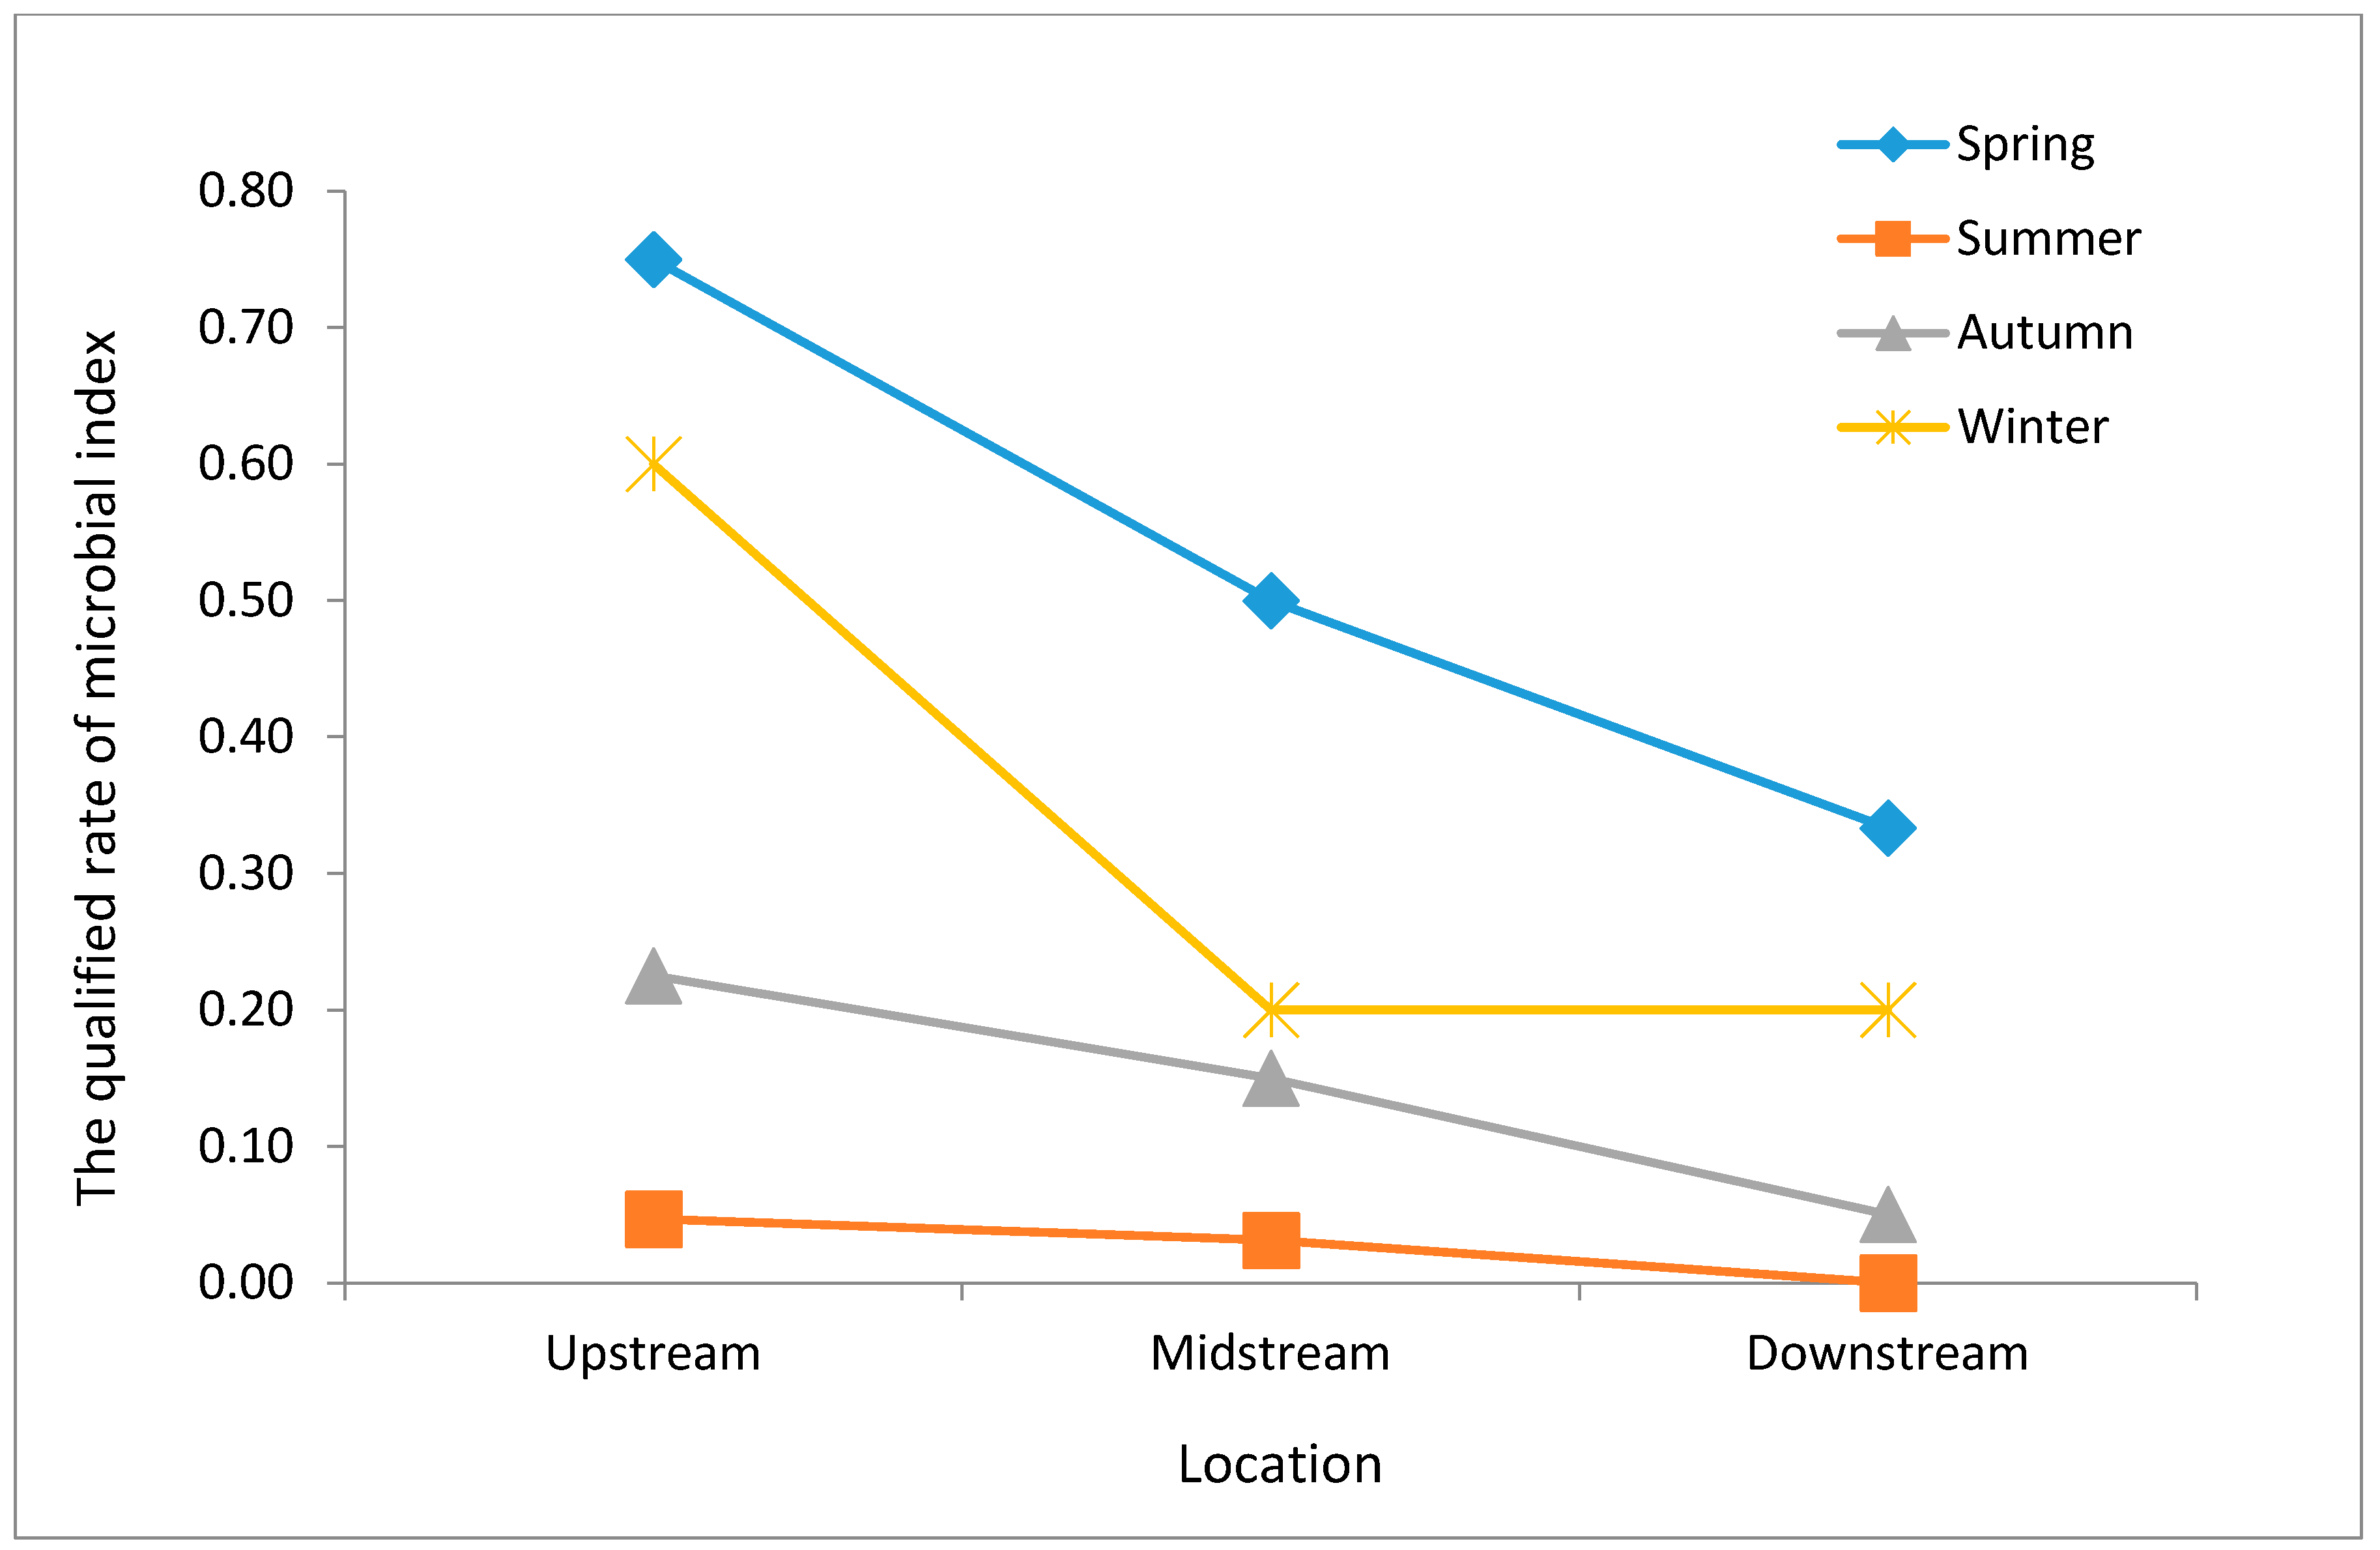
Our data show that the qualified microbiological index rate at different locations between seasons was highest in the spring, irrespective of the river section (
Figure 5). The second highest levels were seen in the winter and then the autumn, with the lowest rate recorded in the summer. Within the same season, the upstream qualified rate was the highest, while the downstream rate was the lowest.
The data presented in
Figure 4 and
Figure 5 reveals a significant difference in the temporal distribution of bacteria. Sampling results show that microbial contamination was most serious during the summer when the qualified microbiological index rate was also the lowest, and the mean concentrations of TB and TC were 142 CFU/mL and 442 MPN/100 mL, respectively. The vast majority of precipitation on the Tibetan Plateau (90%) is concentrated in the summer (June, July, and August) and so surface runoff is common at this time. This runoff scours surface dust, humus, animal feces, and other pollutants into the river, resulting in excessive TB and TC values [
36]. It can therefore be concluded that non-point source pollution carried by surface runoff exerts a significant effect on the bacterial levels of water resources [
37,
38,
39]. As a result, TB and TC levels are higher in summer than in other seasons, while the qualified rate of water samples is correspondingly lower. Farmers and herdsmen also discharge more domestic sewage into the river during summer for the reason that they eat more vegetables and wash clothes more frequently in summer, and even some local residents wash their clothes in the water. The river water temperature in summer is also higher than in other seasons; a relatively higher temperature is more conducive to the survival and reproduction of microorganisms. It is therefore straightforward to conclude that the summer microbial concentration of the Xincang River Basin is generally high, and contamination is more serious.
In addition,
Figure 5 also shows that the qualified microbial index rates in all four seasons exhibited a decreasing trend from upstream to downstream sections. The decreasing trend in summer is much slower than in the other three seasons, and microbial contamination in the upstream section is as serious as in midstream and downstream sections.
3.3. Factors Cause TB and TC Spatiotemporal Distribution
Due to topography, the high altitude air environment, and the weather system, climate in Tibetan Plateau is unique and diverse, and precipitation is extremely irregular throughout the year, as more than 80% occurs in summer. The main production modes are planting and animal husbandry in the Xincang River Basin, and in summer, local residents always graze their livestock along the upstream section. Livestock is free range in this region, directly drinking from the river and excreting feces on the banks. The runoff from concentrated precipitation scours surface dust, humus, animal feces, and other pollutants into the river, leading to the aggravation of upstream microbial contamination in summer.
3.3.1. Correlations between Bacterial Levels and Rainfall
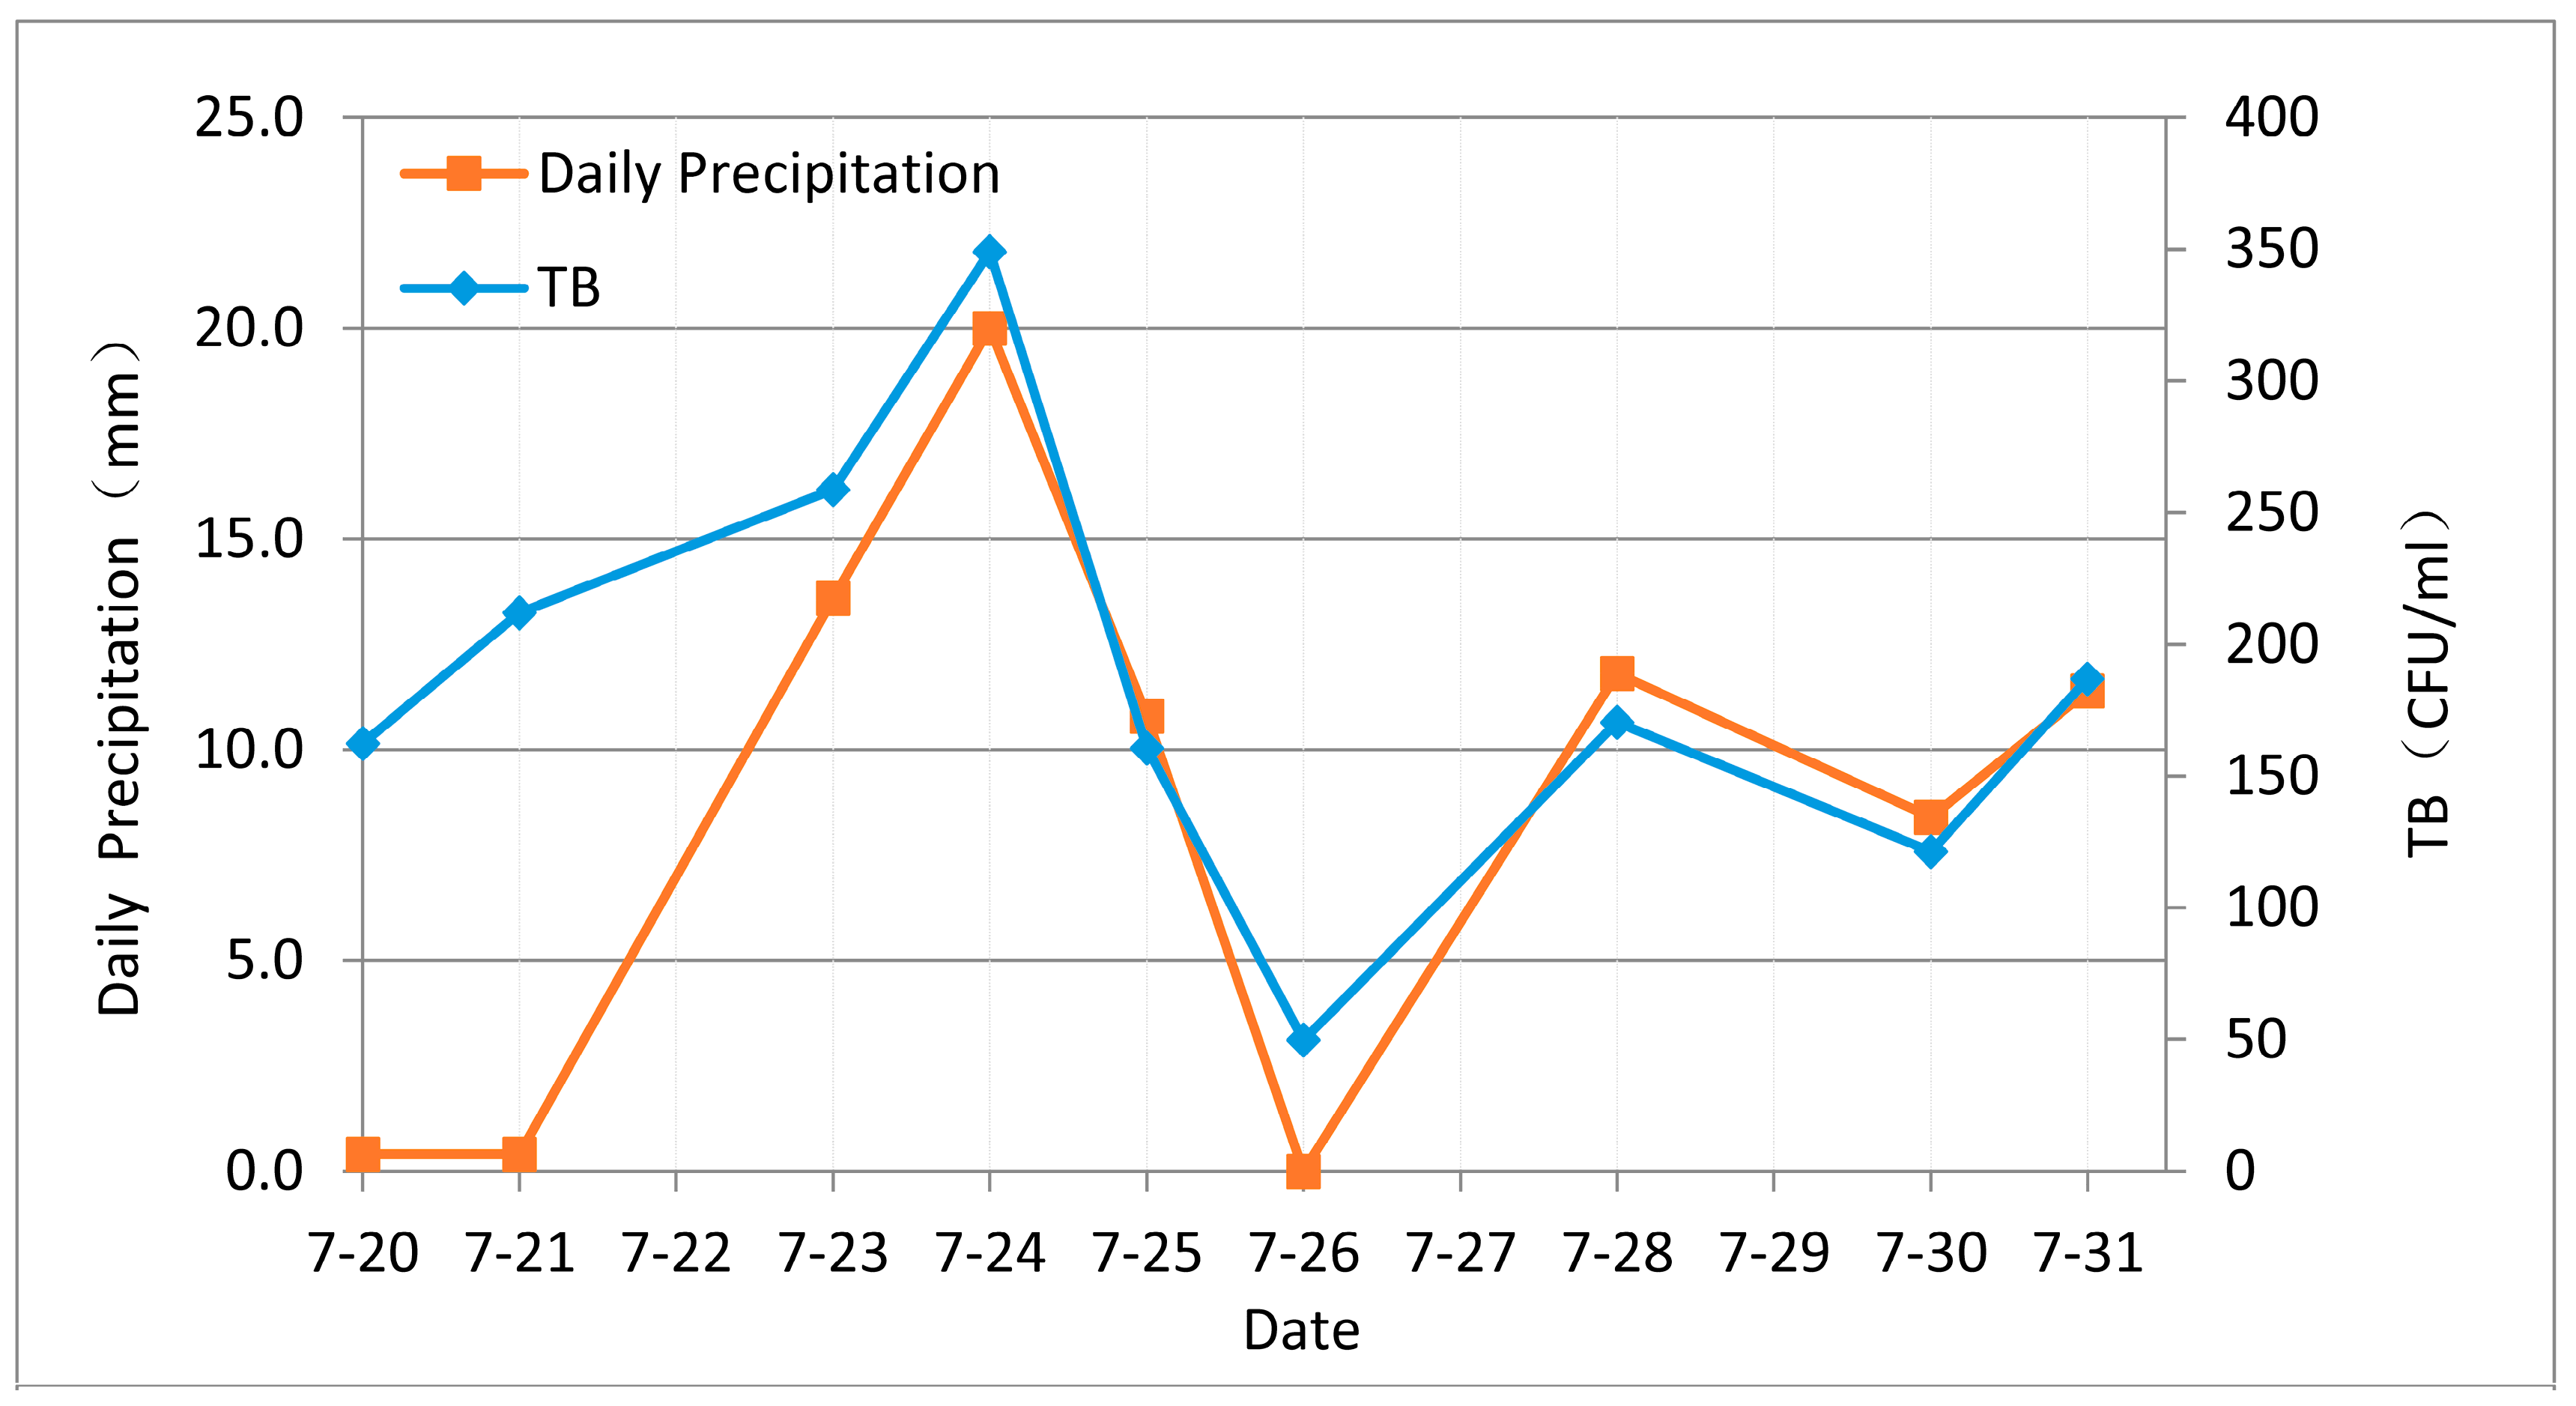
Rainfall varies significantly throughout the year in the Xincang River Basin, with precipitation often close to zero during low flow periods between November and March. During the research time period, we found that bacterial index concentrations have similar changing trends with daily precipitation. For example, daily precipitation and TB concentration change between 20 July 2014 and 31 July 2014, as is shown in
Figure 6, and these changes mirror one another; peak precipitation in this period was on 24 July 2014, when the value for TB was also maximal. Similarly, precipitation on 26 July 2014 was zero and TB was also decreased accordingly.
Statistical data show that changes of annual precipitation in Tibet conform to an inverted ‘V-shape’, and precipitation is the highest in summer. Conversely, the proportion of microbes in water samples varies in a ‘V-shape’. Thus, in order to further evaluate the relationship between rainfall and bacterial levels, we analyzed the statistical correlations between monthly mean precipitation, monthly mean TB concentrations, and monthly mean TC concentrations using the software SPSS 20.0. The current data covers seven months including April, July, August, September, October, November, and December (N = 7). The results show that both TB and TC are significantly positively correlated with precipitation (
Table 4); indeed, TB is significantly correlated with precipitation at the 0.05 probability level (two-tailed) and with a correlation coefficient of 0.789. Similarly, the correlation between TC and precipitation is at the 0.01 probability level (two-tailed) and has a correlation coefficient of 0.876. Data also show that there is a significant correlation between TB and TC at the 0.01 probability level (two-tailed), with a correlation coefficient of 0.886.
Data show that the concentration of bacteria fluctuates based on the amount of precipitation. Thus, during periods of abundant precipitation, the volume of bacteria in the watershed increased, causing a concomitant increase in microbial contamination.
3.3.2. Sources of Microbial Contamination
When the total number of microbes is fixed, the microbial concentration will theoretically decline when the flow discharge increases. However, this rule is not true in the Tibetan Plateau. The main reason for this is that rainfall runoffs carry a lot of microbial contamination sources into the river and cause the increase of microbial concentration in summer. Previous work has shown that microbiological contamination is dispersed, sporadic, and influenced by a range of interacting environmental factors including the physical characteristics of a watershed, climatic conditions, and agricultural management practices [
40]. The main bacterial contamination sources in Tibetan Plateau are mostly manifest by production processes and daily life, which mainly include animal husbandry and domestic sewage.
1. Rural Domestic Sewage
Because most rural counties in China lack a sewage pipe network and treatment systems, domestic sewage is often discharged into the local river where it seriously affects water quality [
41]. Although rural domestic sewage mainly includes kitchen waste, as well as water from washing and flushing [
42], in these areas of Tibet, the toilets comprise dry pail latrines [
43] and are relatively simple. Nevertheless, waste from these simple dry pail latrines, as well as kitchen sewage and washing water, pollutes rivers via groundwater seepage and surface runoff.
Household surveys and calculations show that each person within the Xincang River Basin produces 35.36 L of domestic wastewater daily [
36]. Thus, combining the population, we calculated the daily volumes of upstream, midstream, and downstream wastewater to be 5.5 m
3, 4 m
3, and 44.93 m
3, respectively [
44]. In addition to domestic sewage discharge, laundry washing in the river, as well as the disposal of household garbage, also affects river water quality. We performed a further analysis to assess the relationship between the amount of domestic sewage and the qualified microbial index rate using Pearson’s correlation coefficient. These results show that sewage discharge is significantly correlated with the qualified microbial index rate. The Pearson correlation coefficient in this case is −0.847; this indicates that a larger sewage discharge will cause more serious microbial pollution.
2. Animal Husbandry
Human and animal manure is the main source of TC [
44,
45]. Surface runoff from abundant rainfall carries livestock effluent into rivers and causes the TC concentration to exceed safety standards. As the livestock within the Xincang River Basin are mostly free-range outdoors, they drink directly from the river and defecate everywhere throughout the basin. Although local residents do collect yak feces as fuel, more than one-third of this excrement is nevertheless abandoned on riverbanks and in grasslands.
According to the excretion coefficient recommended by the State Environmental Protection Administration, the volume of fecal emissions downstream is highest, reaching 28,022 Mg, followed by upstream (16,706 Mg) and midstream (9160 Mg) sections [
44]. Thus, the qualified TC rate in the downstream river section was lowest, at just 6%, while rates in midstream and upstream sections were 7% and 11%, respectively. The qualified TC rate trend recorded within the Xincang River Basin is consistent with fecal discharge; livestock manure is the main TC source in areas where grazing intensity is greatest and thus microbial contamination is more serious. Due to animal husbandry, microbial contamination in upstream, midstream, and downstream sections remains at the same level during the summer.
Fences are not always present in the rural areas of Tibet to isolate livestock from drinking water sources. This means that animals are able to drink directly from sources also used by humans, further increasing the risk of contamination.
4. Conclusions
The results of this study reveal several basic changes in microbe levels between different seasons and locations in a typical small Tibetan watershed, the Xincang River Basin. We show that both TB and TC values within a typical small watershed exhibit obvious spatiotemporal distribution characteristics; in summer, the mean values for both these indexes are much higher than in other seasons, while the qualified microbiological index rate of water samples was much lower at this time than during the winter and spring. Our data show that the qualified rate of water microbes changed over the year according to a ‘V-shaped’ pattern. The results also reveal significant differences in TB, TC, and qualified microbial rates between upstream, midstream, and downstream river sections. Values for TB and TC were lowest upstream, followed by midstream, and greatest downstream, while the opposite relationship is seen in the qualified microbiological rate. Our data also reveal that TB and TC values are significantly correlated with precipitation, with correlation coefficients of 0.789 and 0.876, respectively; this means that surface runoff due to precipitation is the key factor leading to microbial changes in the river. Finally, we show that animal husbandry and domestic sewage constitute the main sources of microbial contamination within the Xincang River Basin. Through this research, we can see the unique modes of production and special climate conditions that affect the temporal and spatial distribution characteristics of microbial indexes in the Tibetan Plateau.
Limited by the current development level and sparsely populated areas in the Tibetan Plateau, the farmers and herdsmen directly obtain water from the river nearby, and there are hidden dangers in drinking water. The results on microbe spatiotemporal distribution characteristics can be used to ensure local drinking water safety. In order to ensure local drinking water safety, the government has recently taken microbial contamination into consideration when developing a rural drinking water safety project, selecting sources as far upstream as possible away from human and animal activities. Although a step in the right direction, this local drinking water safety initiative is not sufficient; if possible, water source protection areas should be established within the Xincang River Basin and fences should be installed to prevent livestock contamination. In addition, microbial pollution monitoring of rivers and groundwater should be enhanced in local areas and a risk warning system put in place to ensure drinking water safety for residents, to maintain the ecological health of the river, and to promote local sustainable development.
Because of the limitations of this study, detailed quantitative work on the degree of influence of precipitation and the mechanisms by which it affects TB and TC was not carried out; this would be an important direction for further research in this small river basin. It is also very important to carry out further analyses on the natural and social factors influencing the spatiotemporal distribution of bacteria in small watersheds across Tibet in order to enhance their protection. Other factors in addition to precipitation can also influence bacteria in river water, including temperature, solar radiation, livestock management practices, and seasonal patterns of recreational water use [
46,
47]. Additional comprehensive and accurate research is necessary in these areas where limited data has so far been collected.
There are a large number of watersheds like the Xincang River Basin on the Tibetan Plateau that have similar natural and socioeconomic characteristics. Thus, the results of this study can be considered to some extent indicative of the basic characteristics of other small watersheds where limited data has been collected. The results of this study are therefore of practical significance in protecting the ecological environment of typical small watersheds, achieving local sustainable development, guaranteeing drinking water safety, and enhancing human health in the agricultural and pastoral areas of Tibet.


