3.1.1. Runoff Water Quality
The stormwater runoff survey was conducted three times at each of the survey points. In Jungjohangcheon and Johangcheon, which are in the upper part of the Jaun area, dense areas of highland fields are observed. These areas were identified as having a large range of fluctuations in nutrients, such as SS, TP and TN. Variations in the SS loads and water quality decreased as the flow was transported to the lower areas, including Jauncheon and Naerincheon 1. In Naedongcheon, which is in the upper part of the Mandae area, variations in the SS content and water quality were large and the mean values of the water quality measurements were high.
From the Naedongcheon to the Inbukcheon, the range of fluctuations in the SS content and water quality decreased, as indicated by standard deviation values in
Table 4. As shown in
Table 4, the maximum SS concentration of Jungjohangcheon is 1152 mg/L and the maximum SS concentration of Naedongcheon reached 4598 mg/L. Limited variations in the water quality of Bukcheon are observed, and the mean value of the water quality measurements is also low. The turbidity and water quality concentration in Gaahcheon is low compared with that in areas with dense highland fields, such as Naedongcheon and Jungjohangcheon. The Soyang River is the furthest downstream and shows a smaller mean water quality value and fewer variations than the areas with dense highland fields, although the average SS and variations in SS content are greater than those of Bukcheon and Gaahcheon.
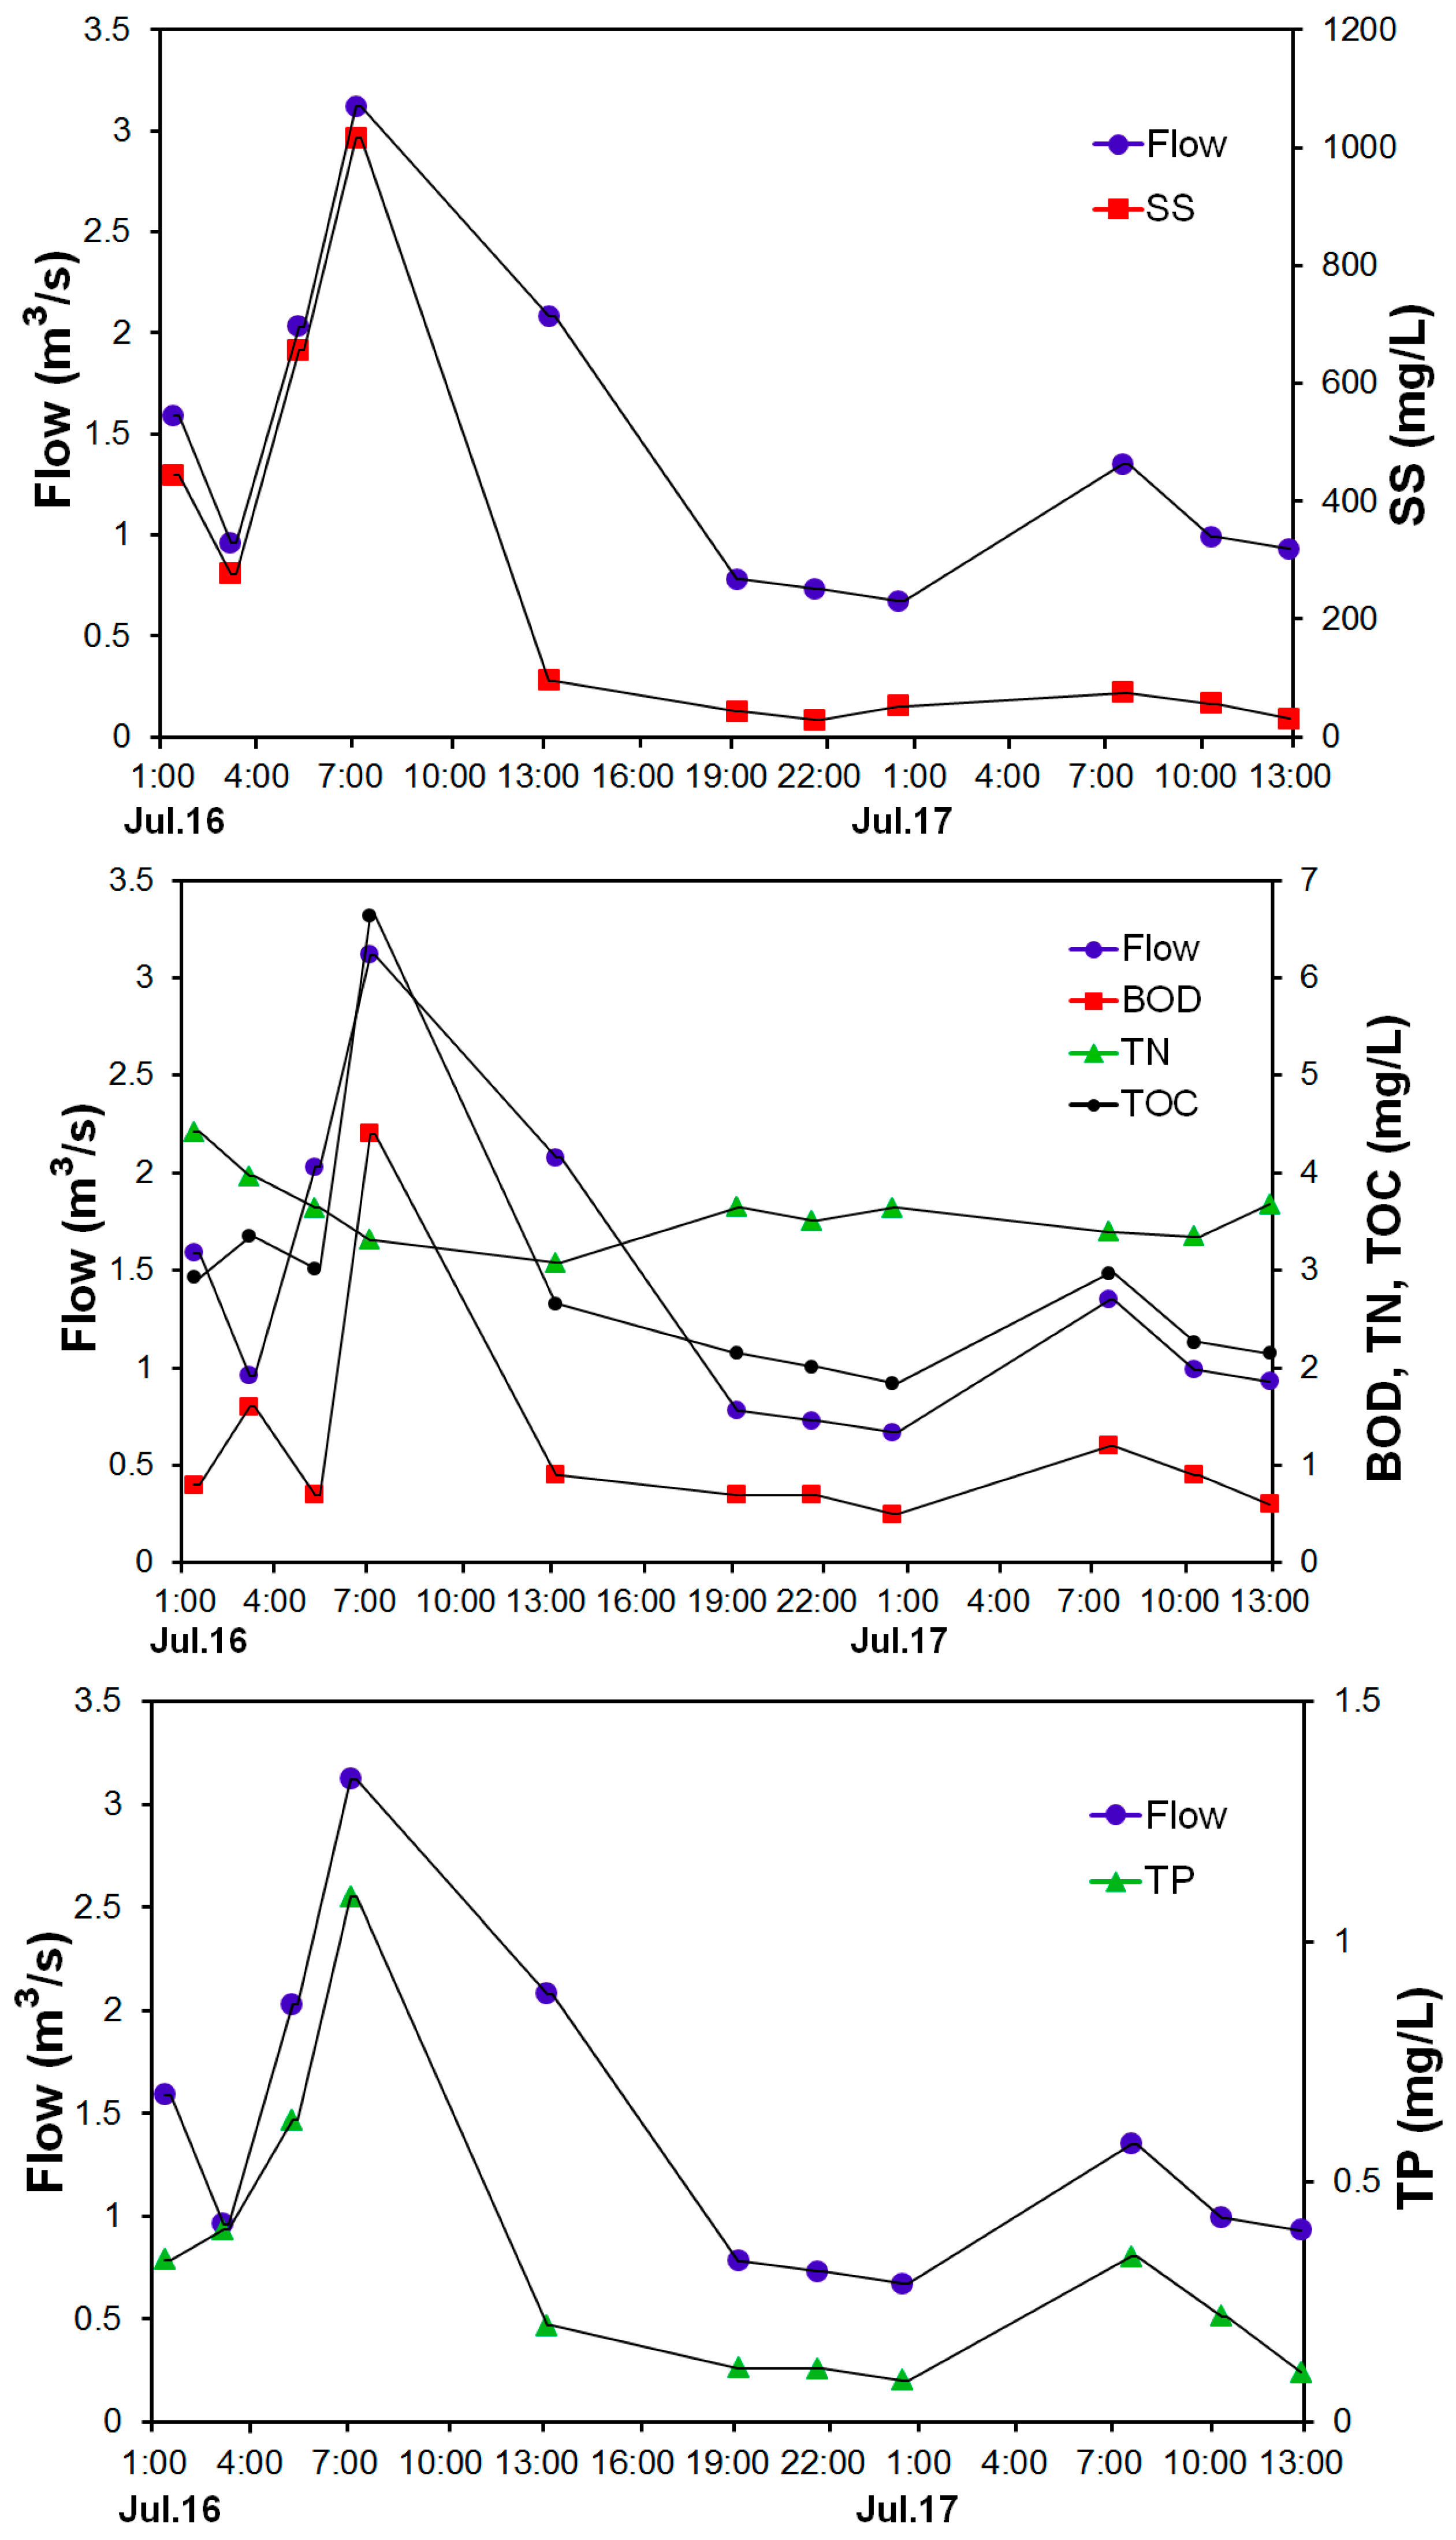
Typical pollutographs at most of the upstream survey points (Naedongcheon) in the Mandae area are shown in
Figure 4. Weather data for 16–17 July showed that the rainfall depth was 61 mm, the rainfall duration period was 33 h, and the number of preceding dry days was 3.5. The peak flow and water quality, such as the SS, TP, BOD, and TOC concentrations, were recorded at the same time. The variable patterns in SS concentrations and flow indicate that a first flush phenomenon occurred for this rainfall event.
3.1.2. M(V) Curve Fitting and First Flush
When drawing the mass-volume curve for each rainfall event, most of the measurement values are placed above the 45° straight line. If the points are significantly higher above this 45° straight line, then large quantity of the pollution load is discharged in the initial stage of rainfall and the runoff pollution load continuously declines over time. This type of runoff pattern could be indicative of a first flush. However, most of the measurement data points are distributed below the 45° straight line, which indicates that a large quantity of the pollution load was discharged at the final stage of rainfall.
As indicated by the
M(
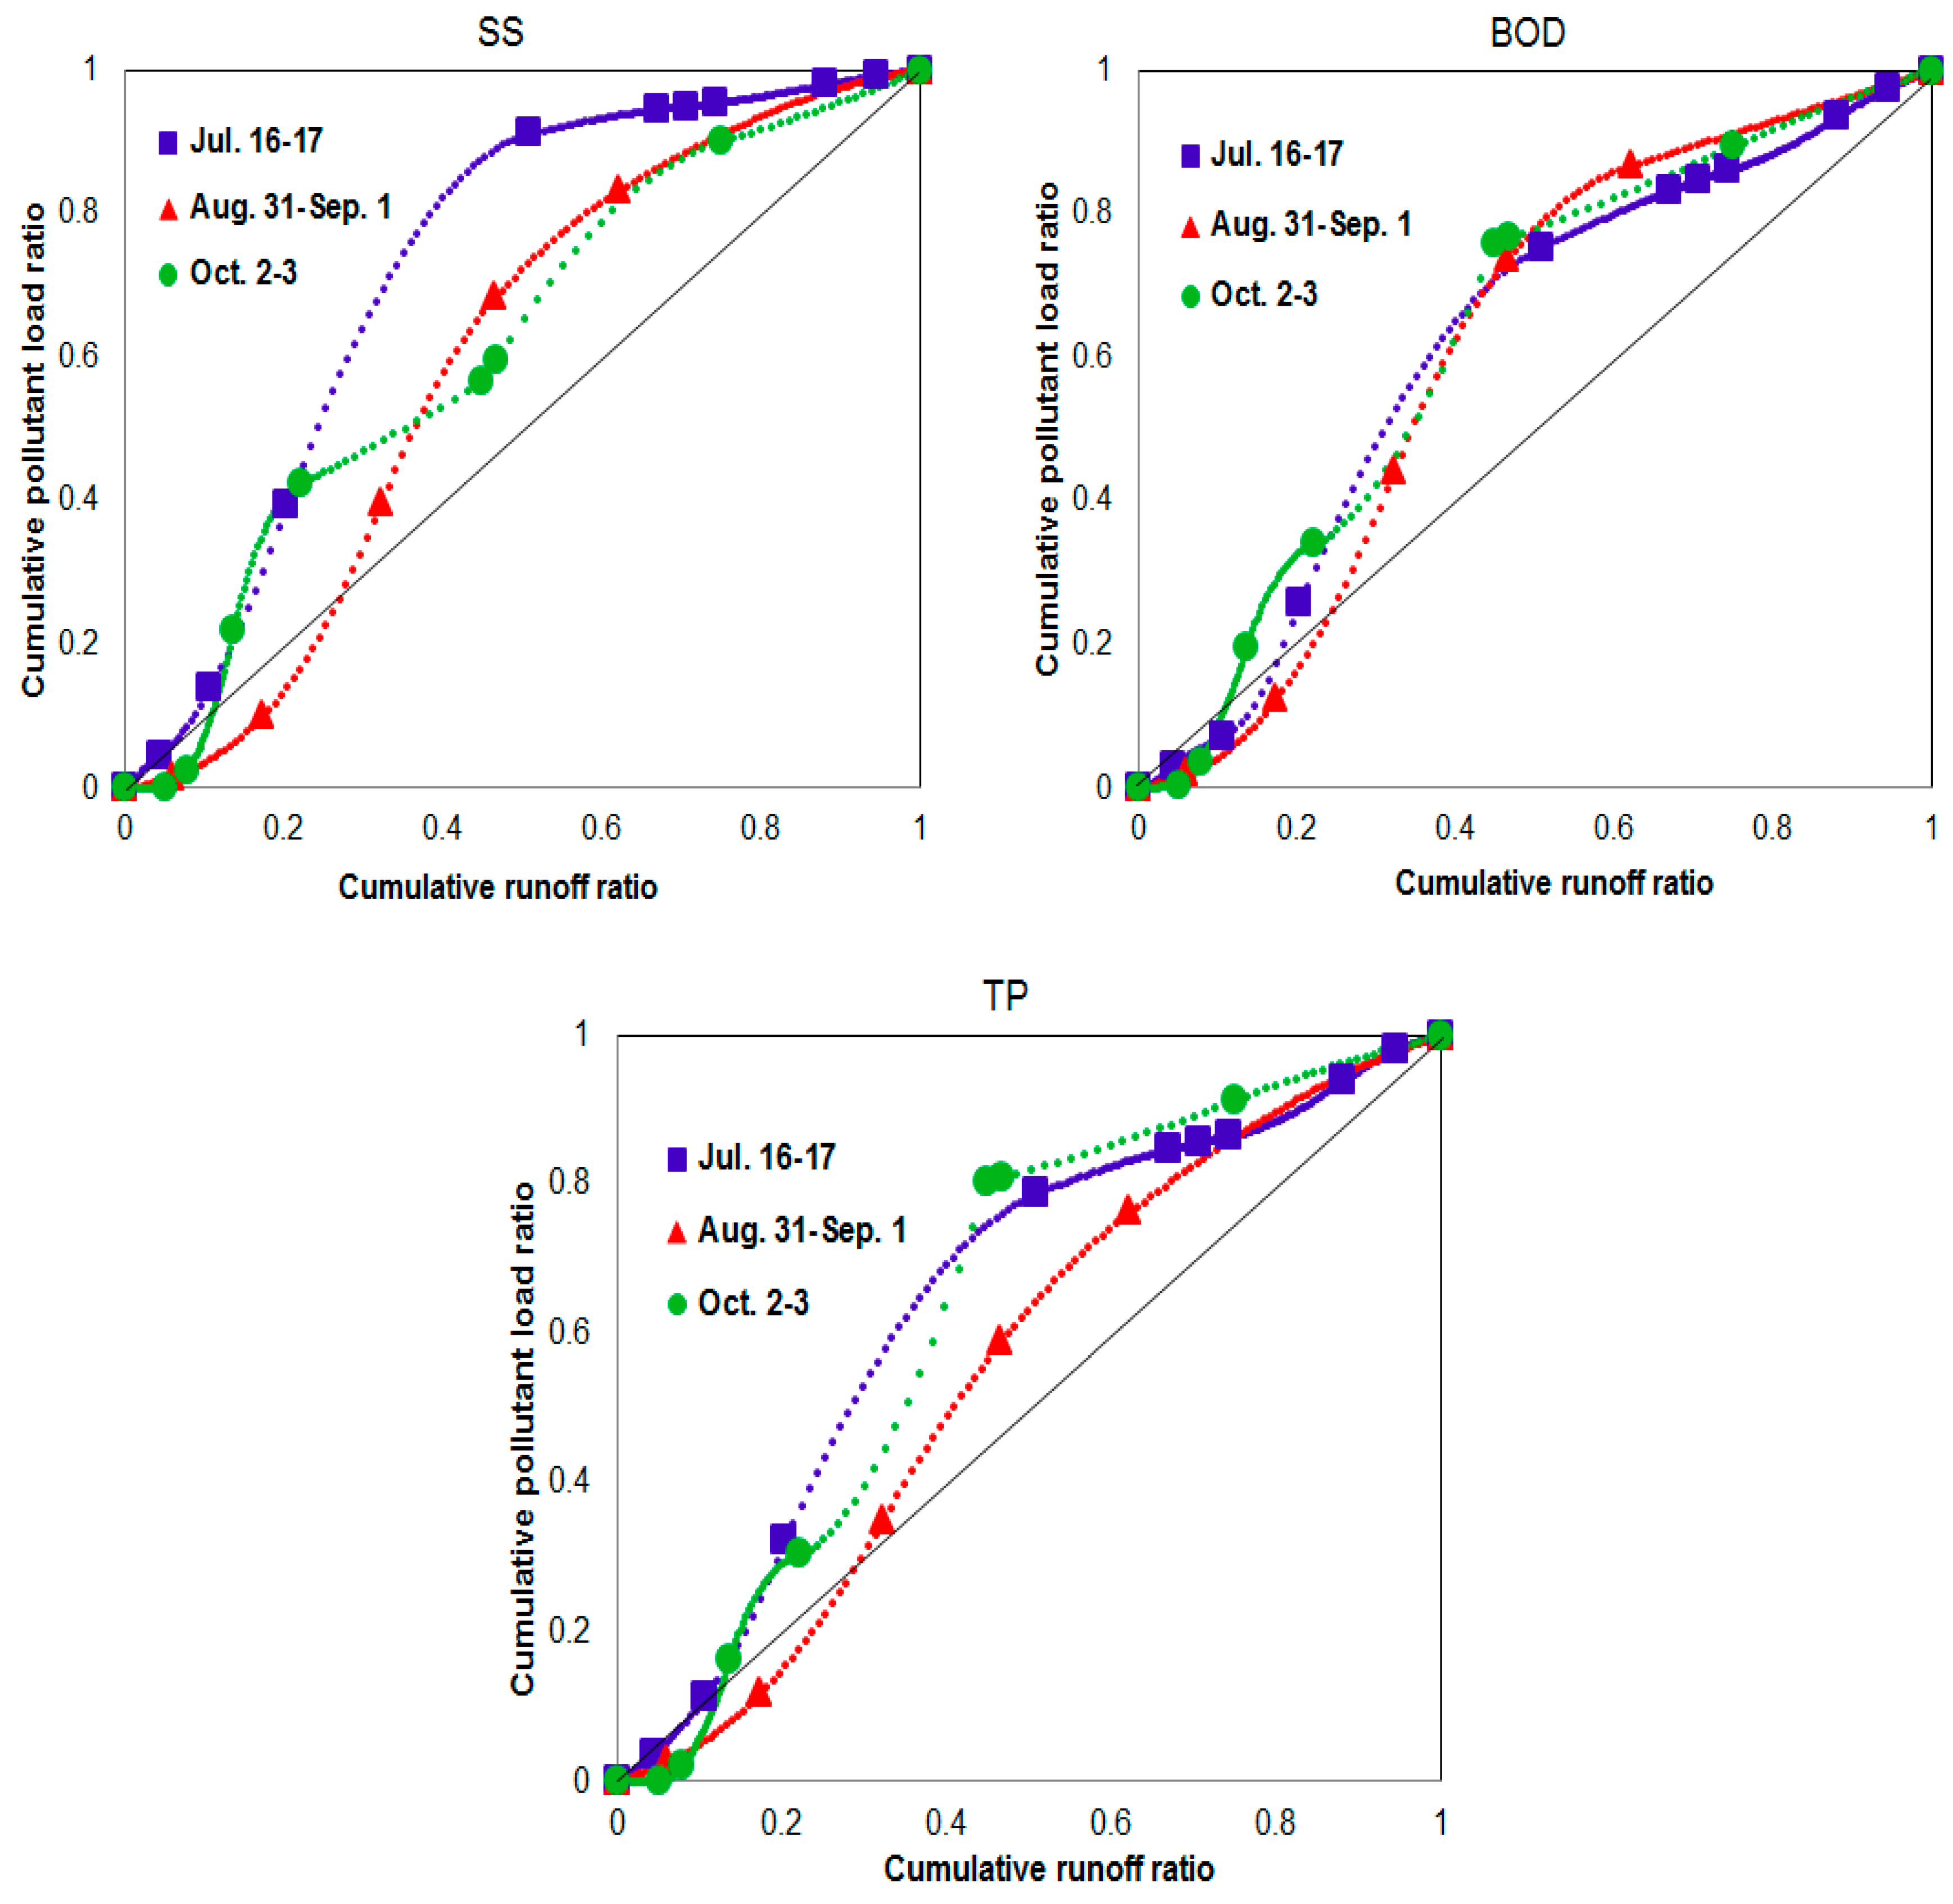
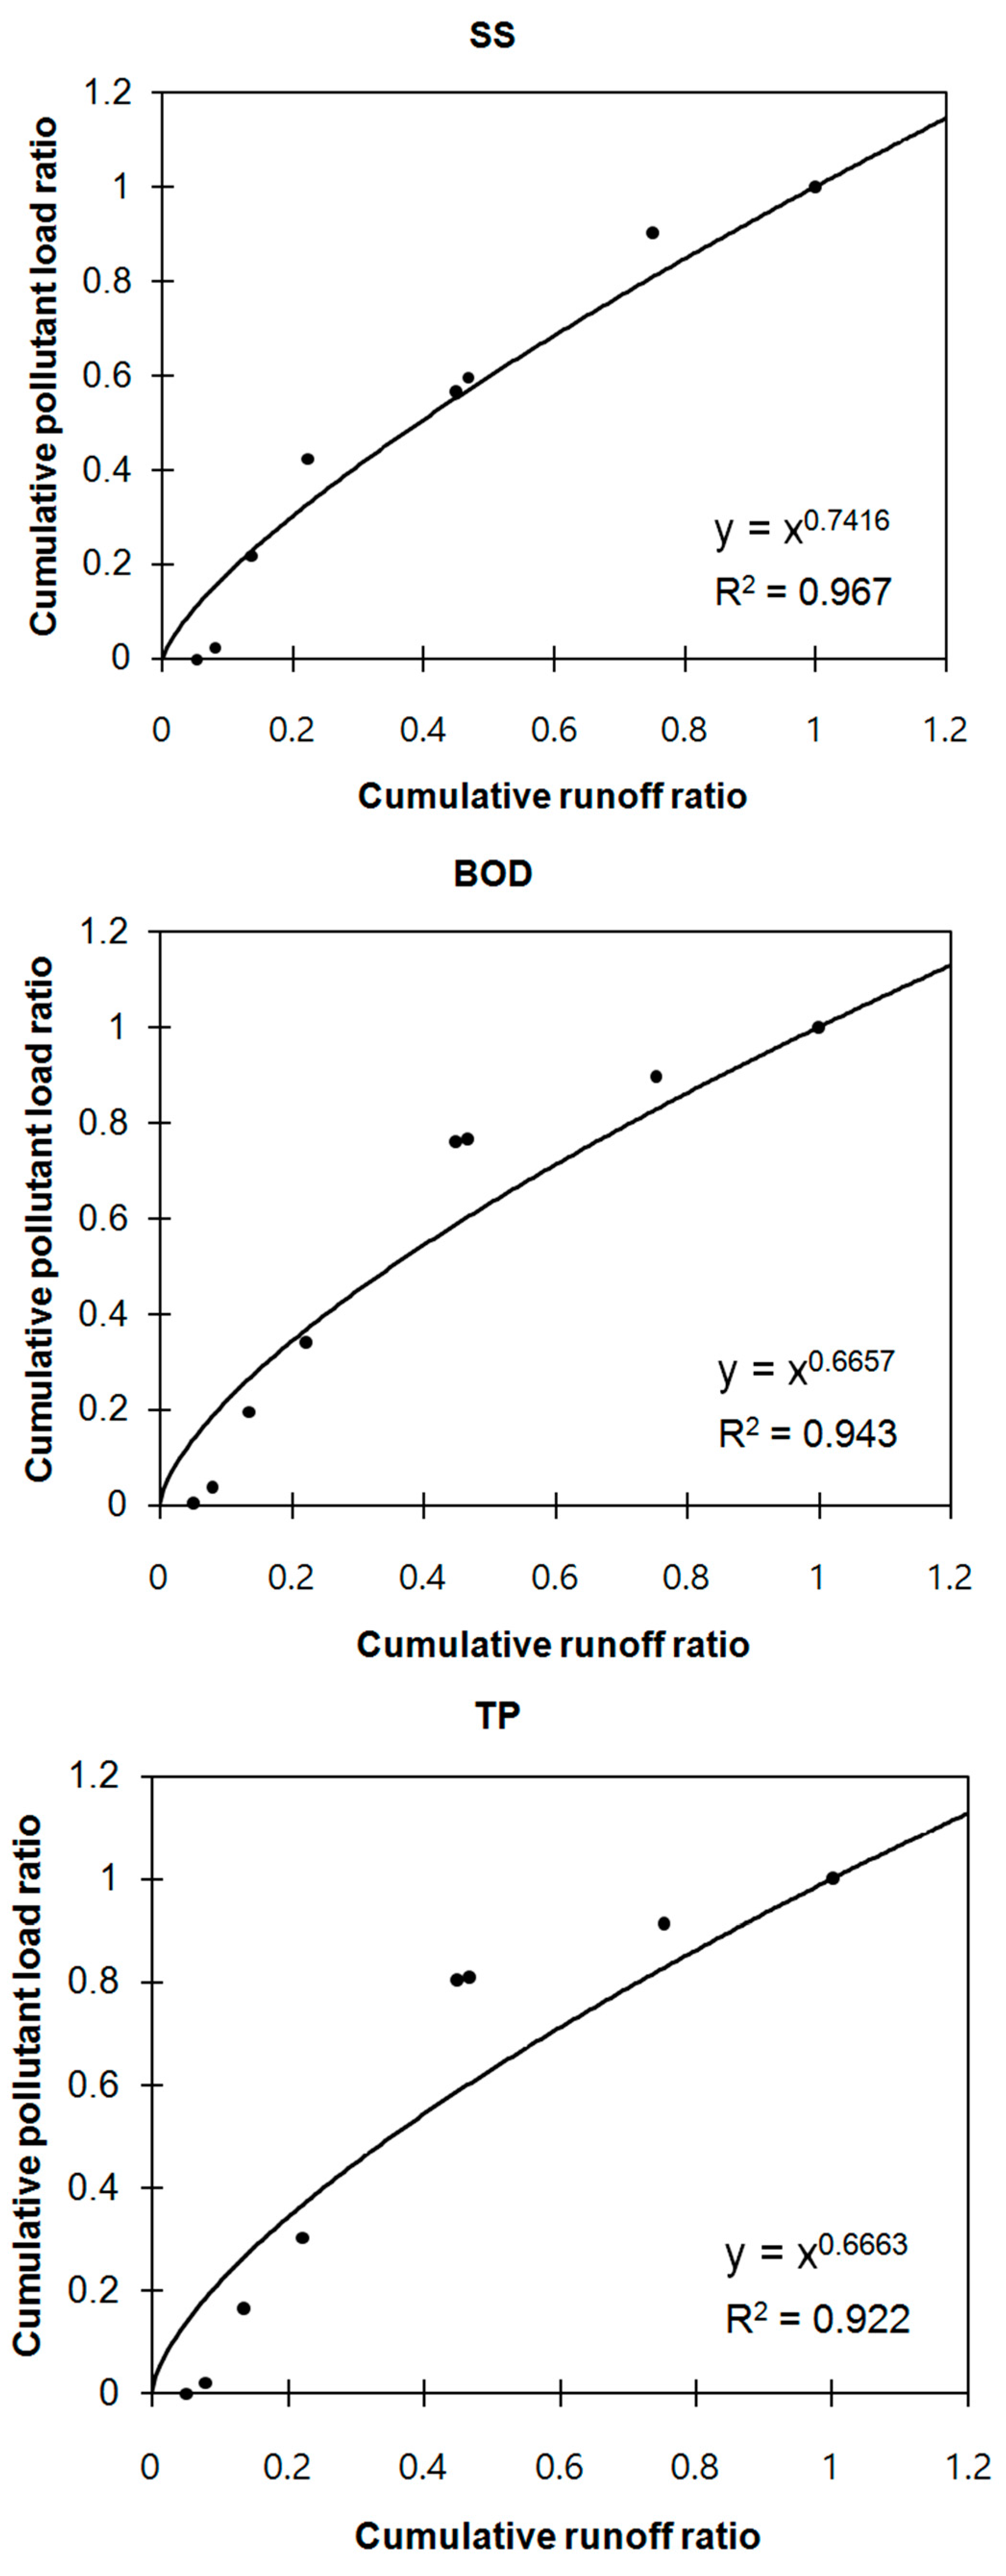
V) curve, the first flush effect in Naedongcheon is easily observed because many of the observed values from 16 July to 17 July and from 2 October to 3 October were marked above the straight line at a slope of 1 (
Figure 5). Based on the storm water survey from 1 July to 2 July 2017, the
M(
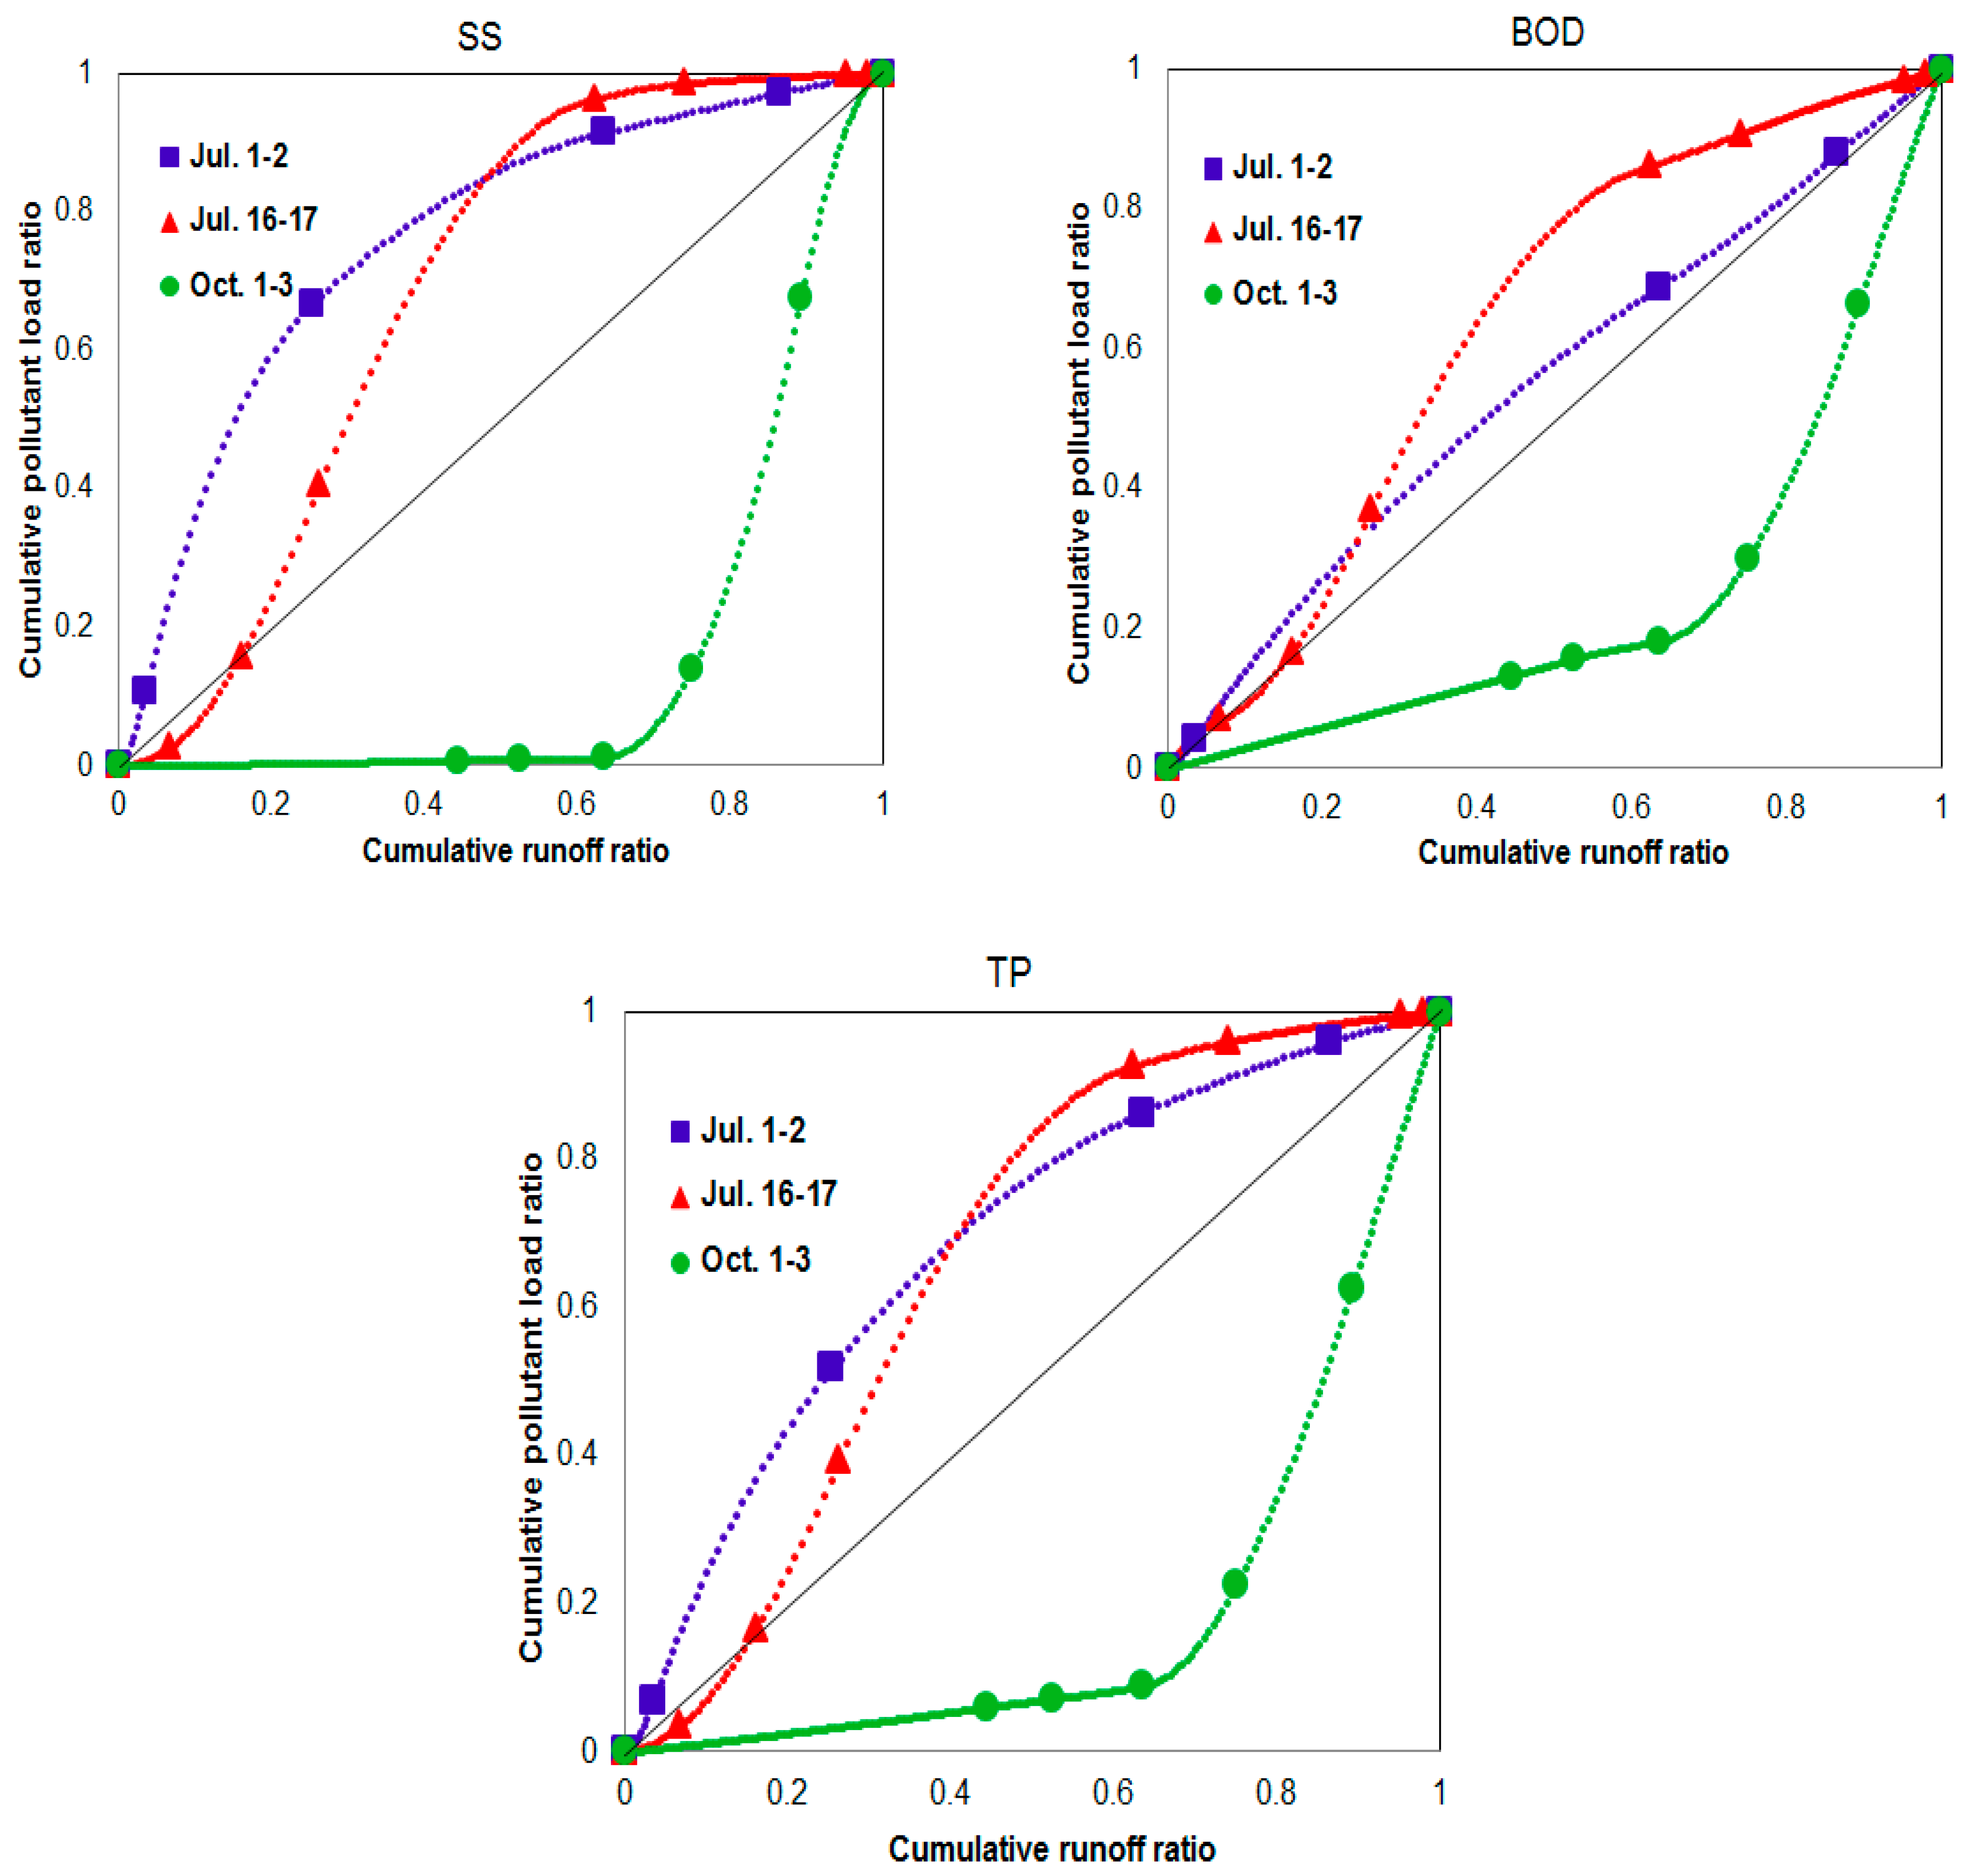
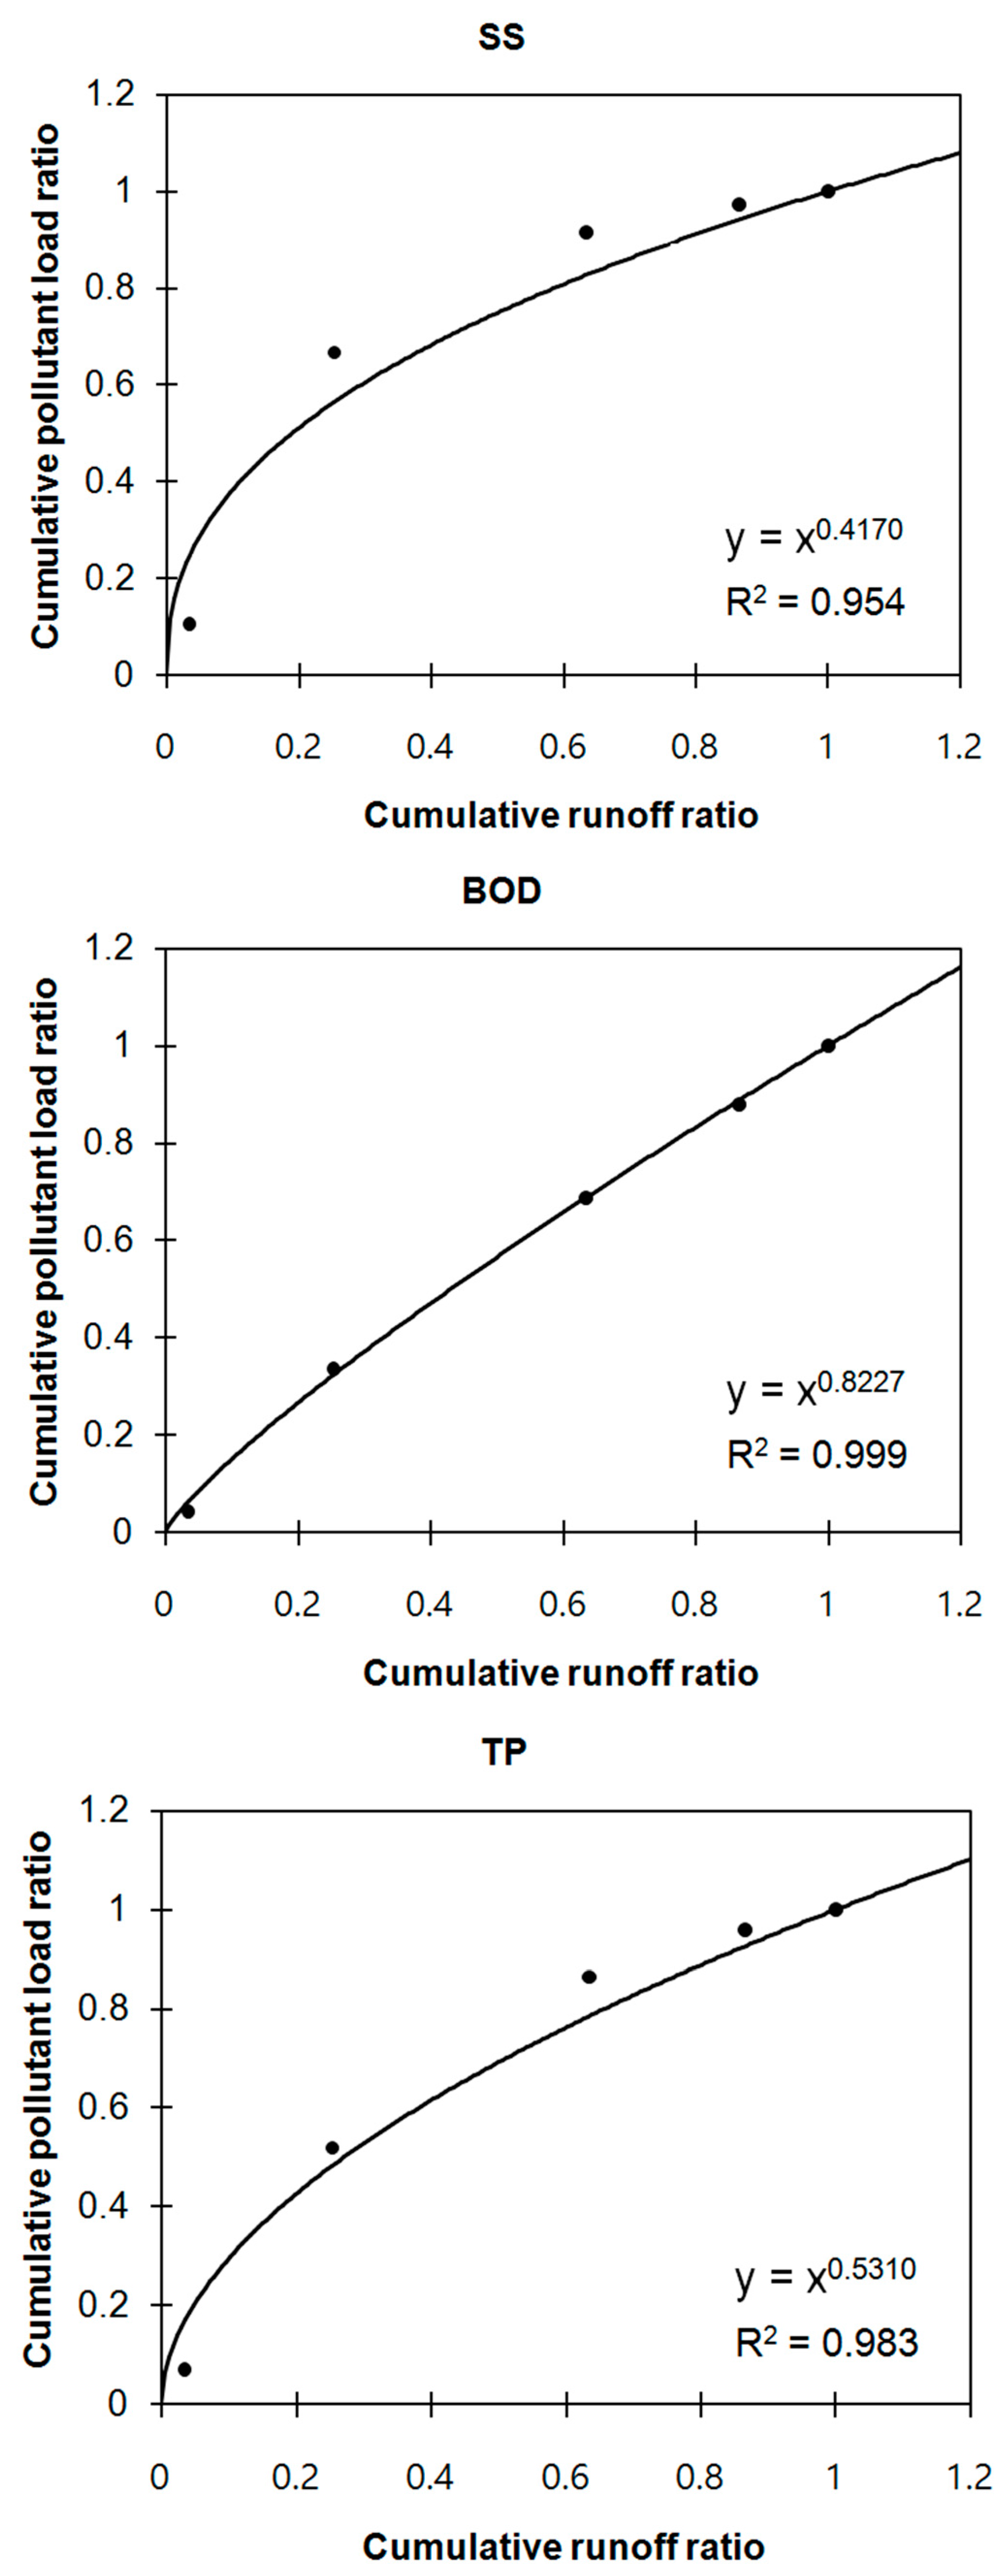
V) curves of the SS and TP from Jungjohangcheon were drawn and indicate a first flush based on the number of data points falling above the straight line at a slope of 1 (
Figure 6). In Naedongcheon (the upper part of the Mandae area) and Jungjohangcheon (the upper part of the Jaun area), the first flush is indicated by the SS, TP and BOD values. Although the first flush mostly occurs during storm events in highly paved watersheds in urban and mixed land use areas [
14,
17,
23], the first flush phenomenon was identified in the agricultural region of this study, where excessive soil erosion occurs. The shape of the
M(
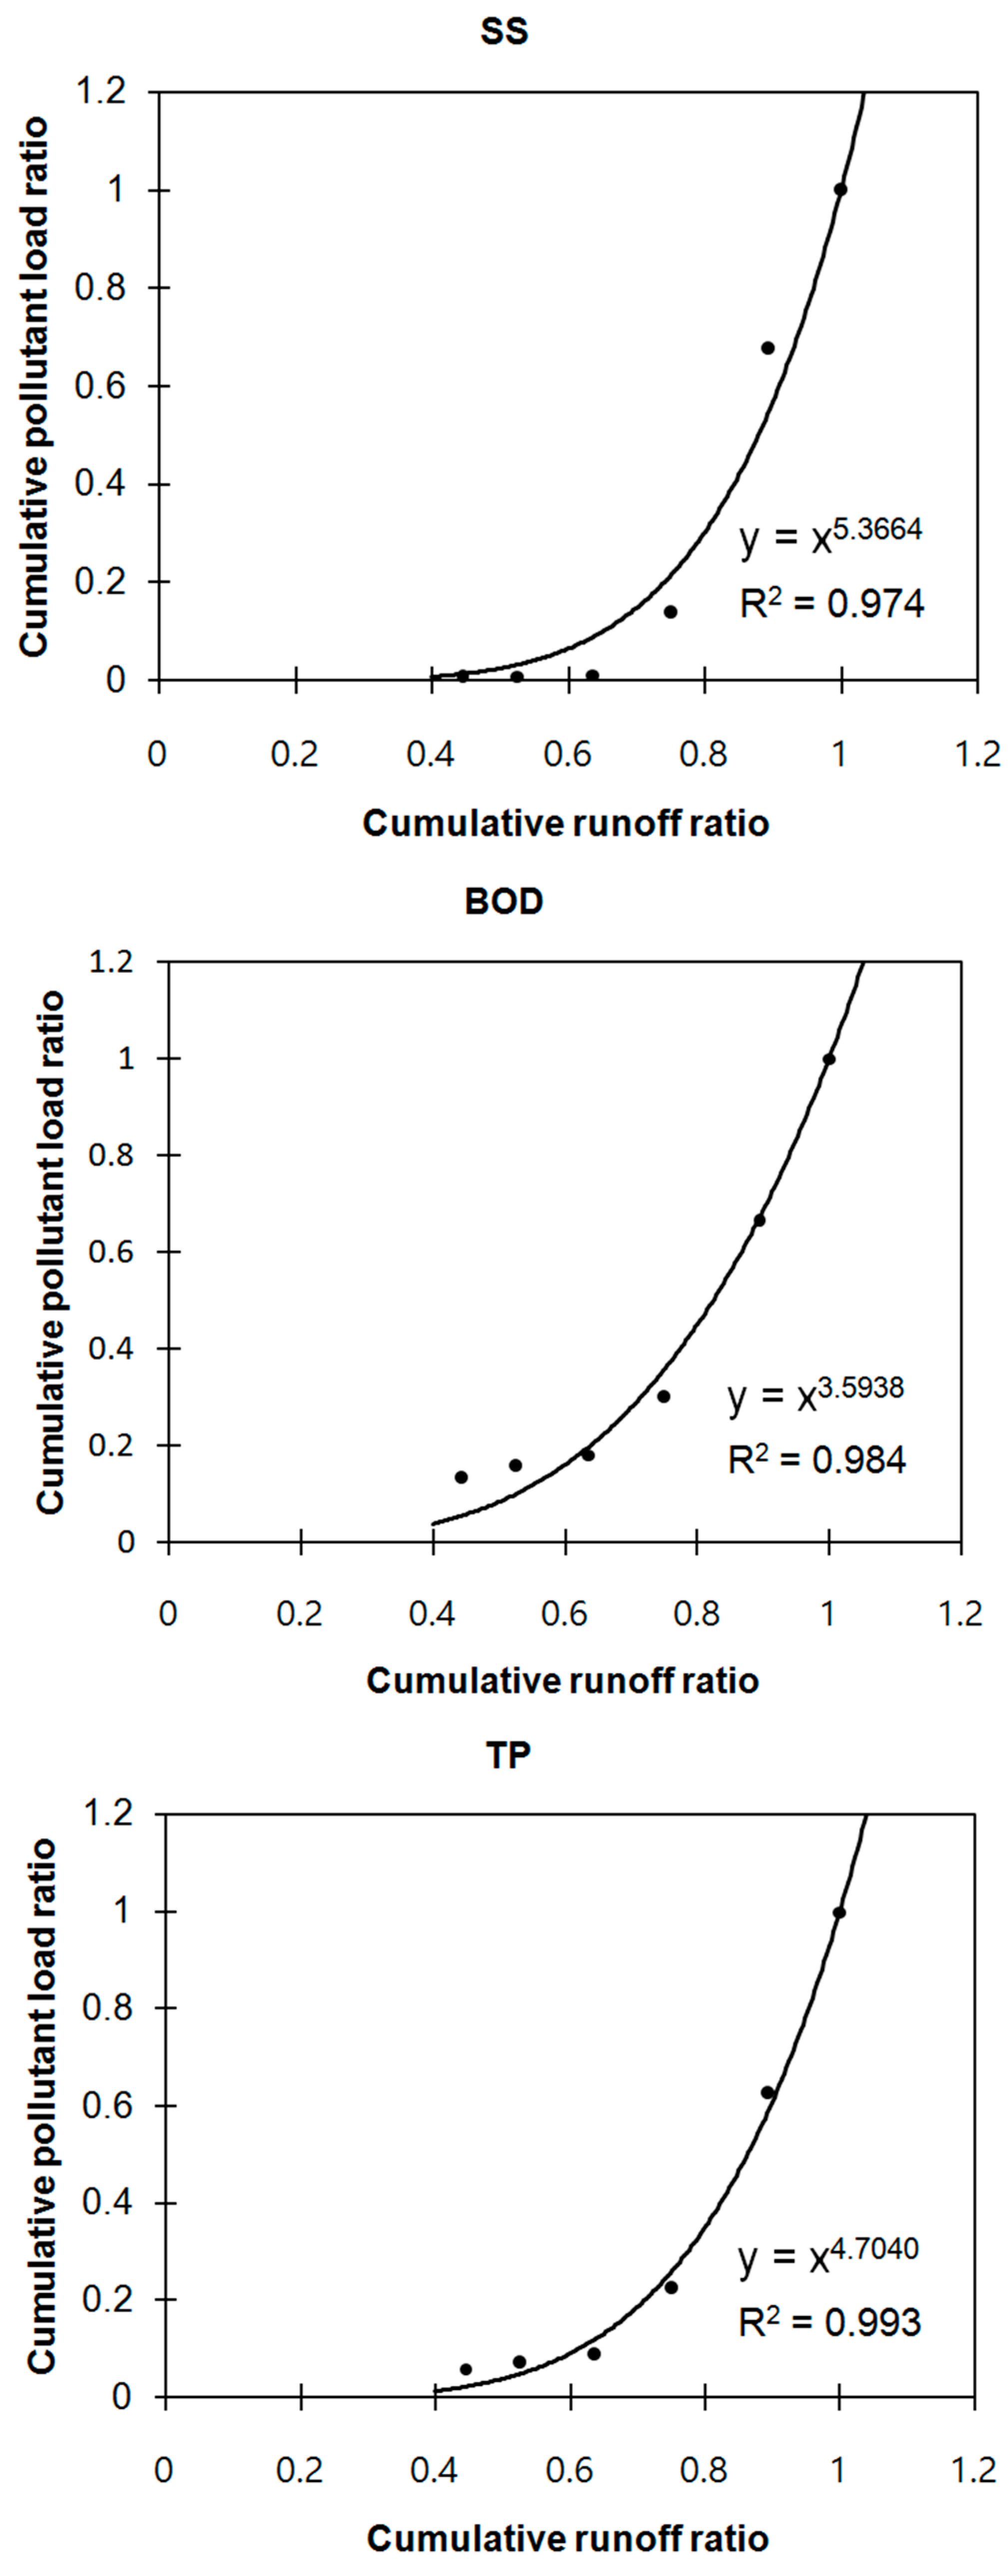
V) curve of the rainfall event occurring on 1–3 October in Jungjohangcheon is concave (
Figure 6) because the rainfall intensity was high at the final stage of rainfall.
One of the advantages of using the function formula is that the occurrence and degree of the first flush can be easily detected and characterized by the function coefficients, which can be used to compare the results of different studies to obtain a general understanding of the phenomenon [
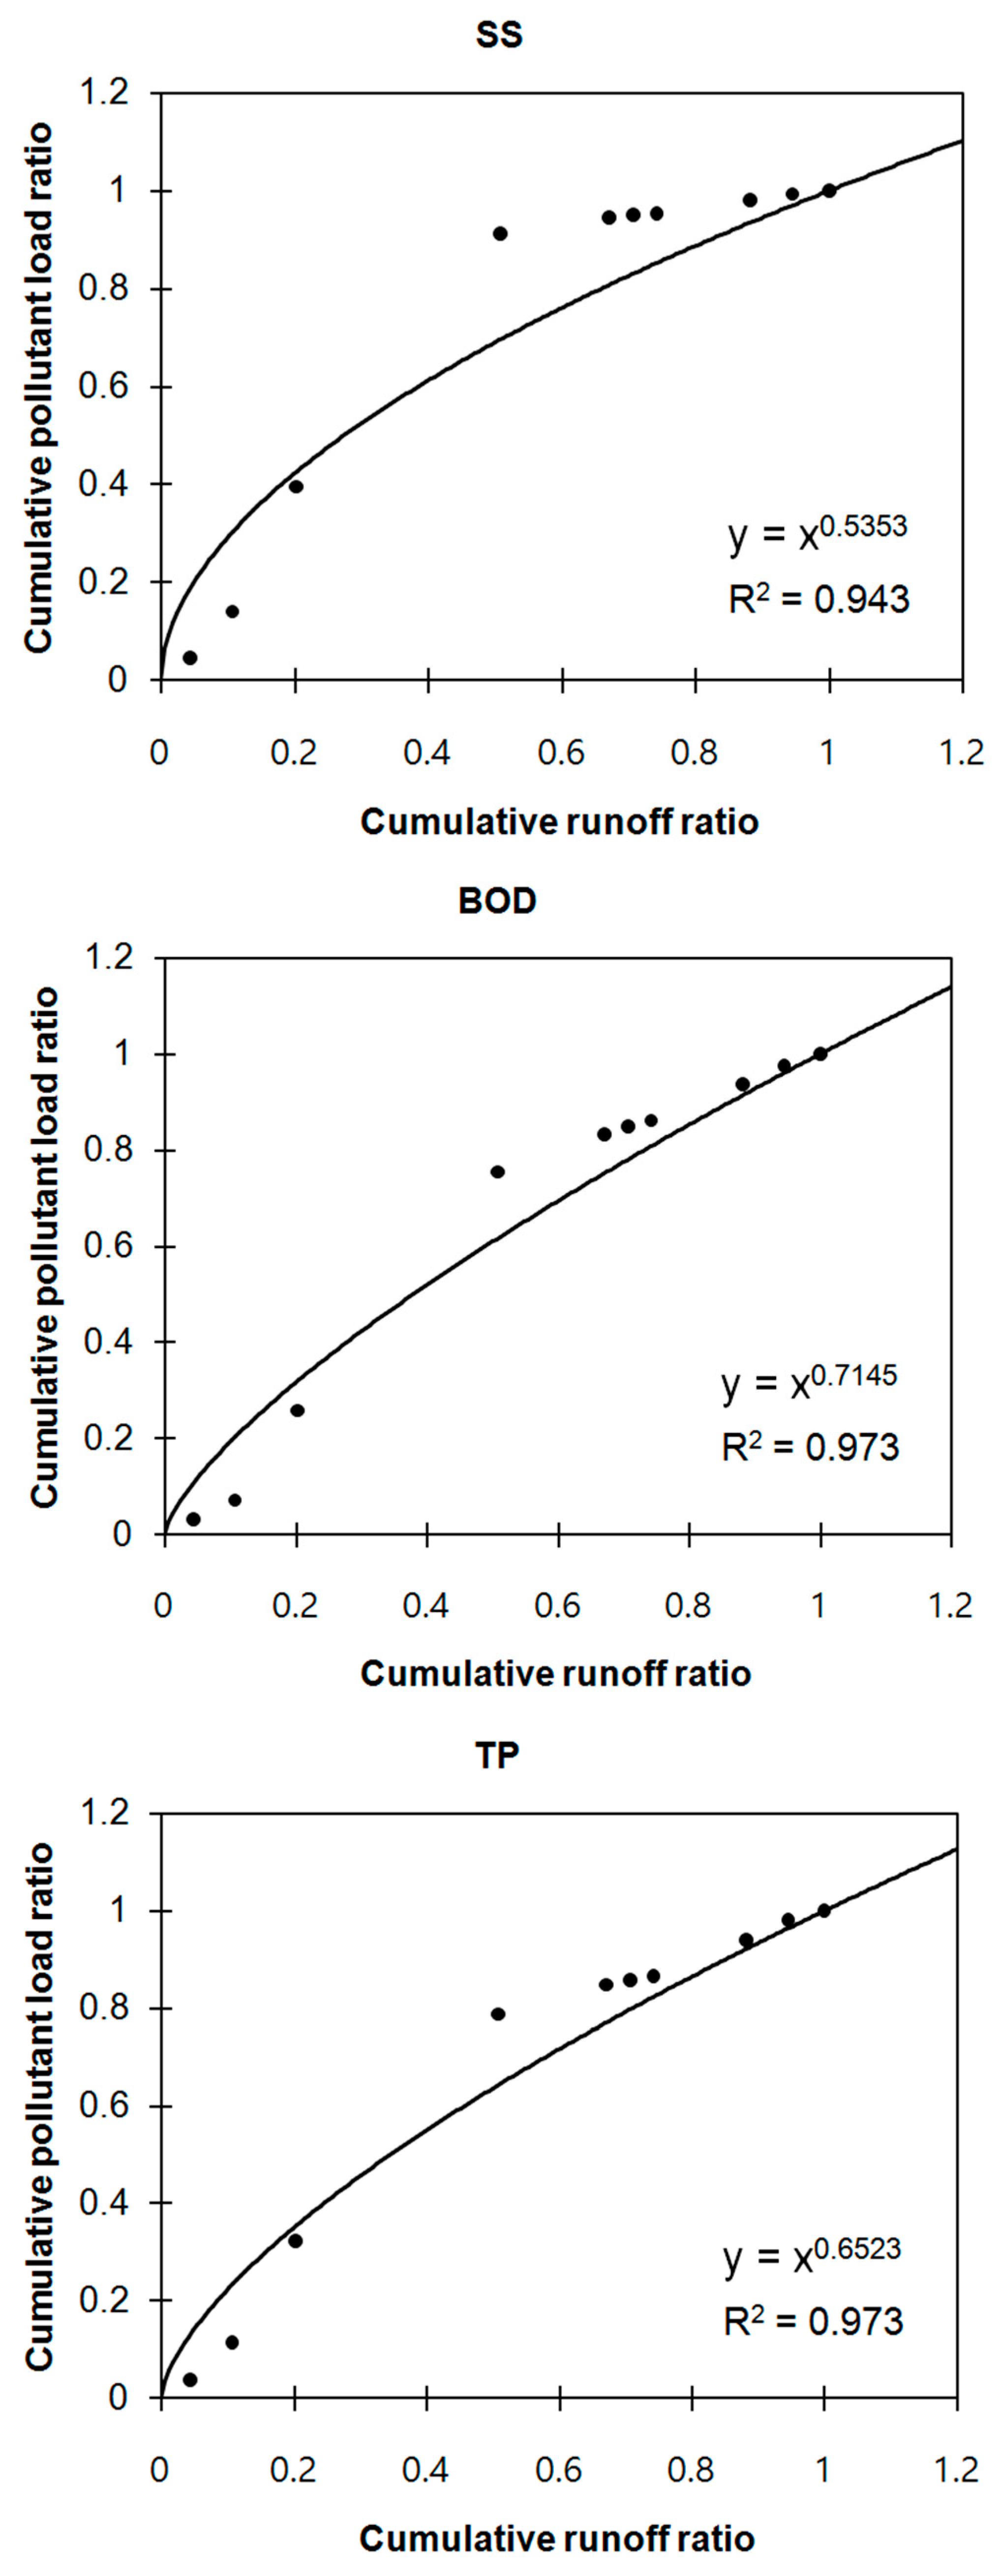
23]. When the nonlinear regression models using the power function (
Figure 7,
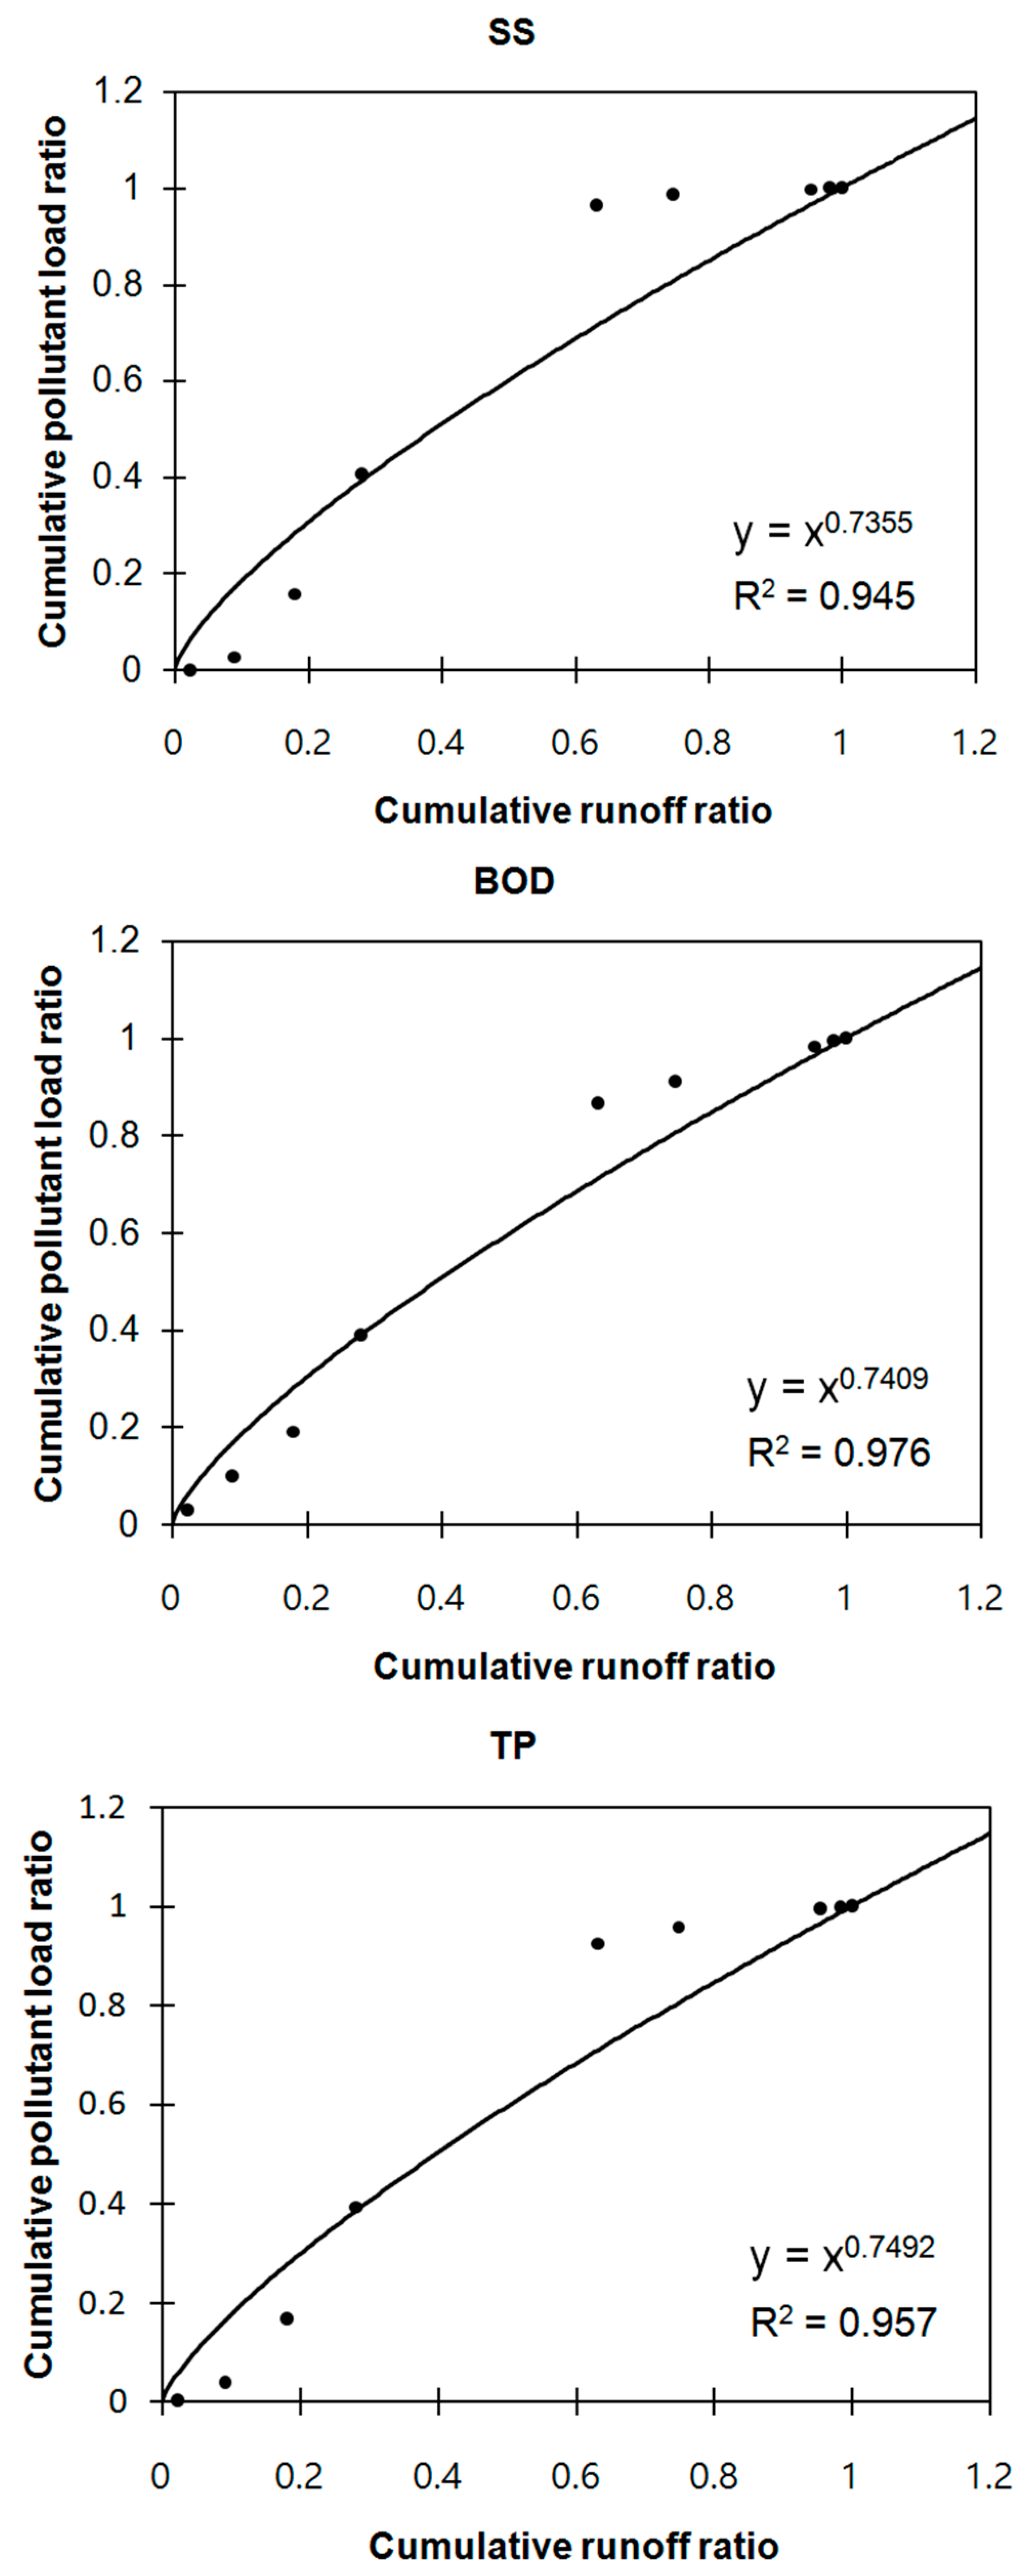
Figure 8,
Figure 9,
Figure 10 and
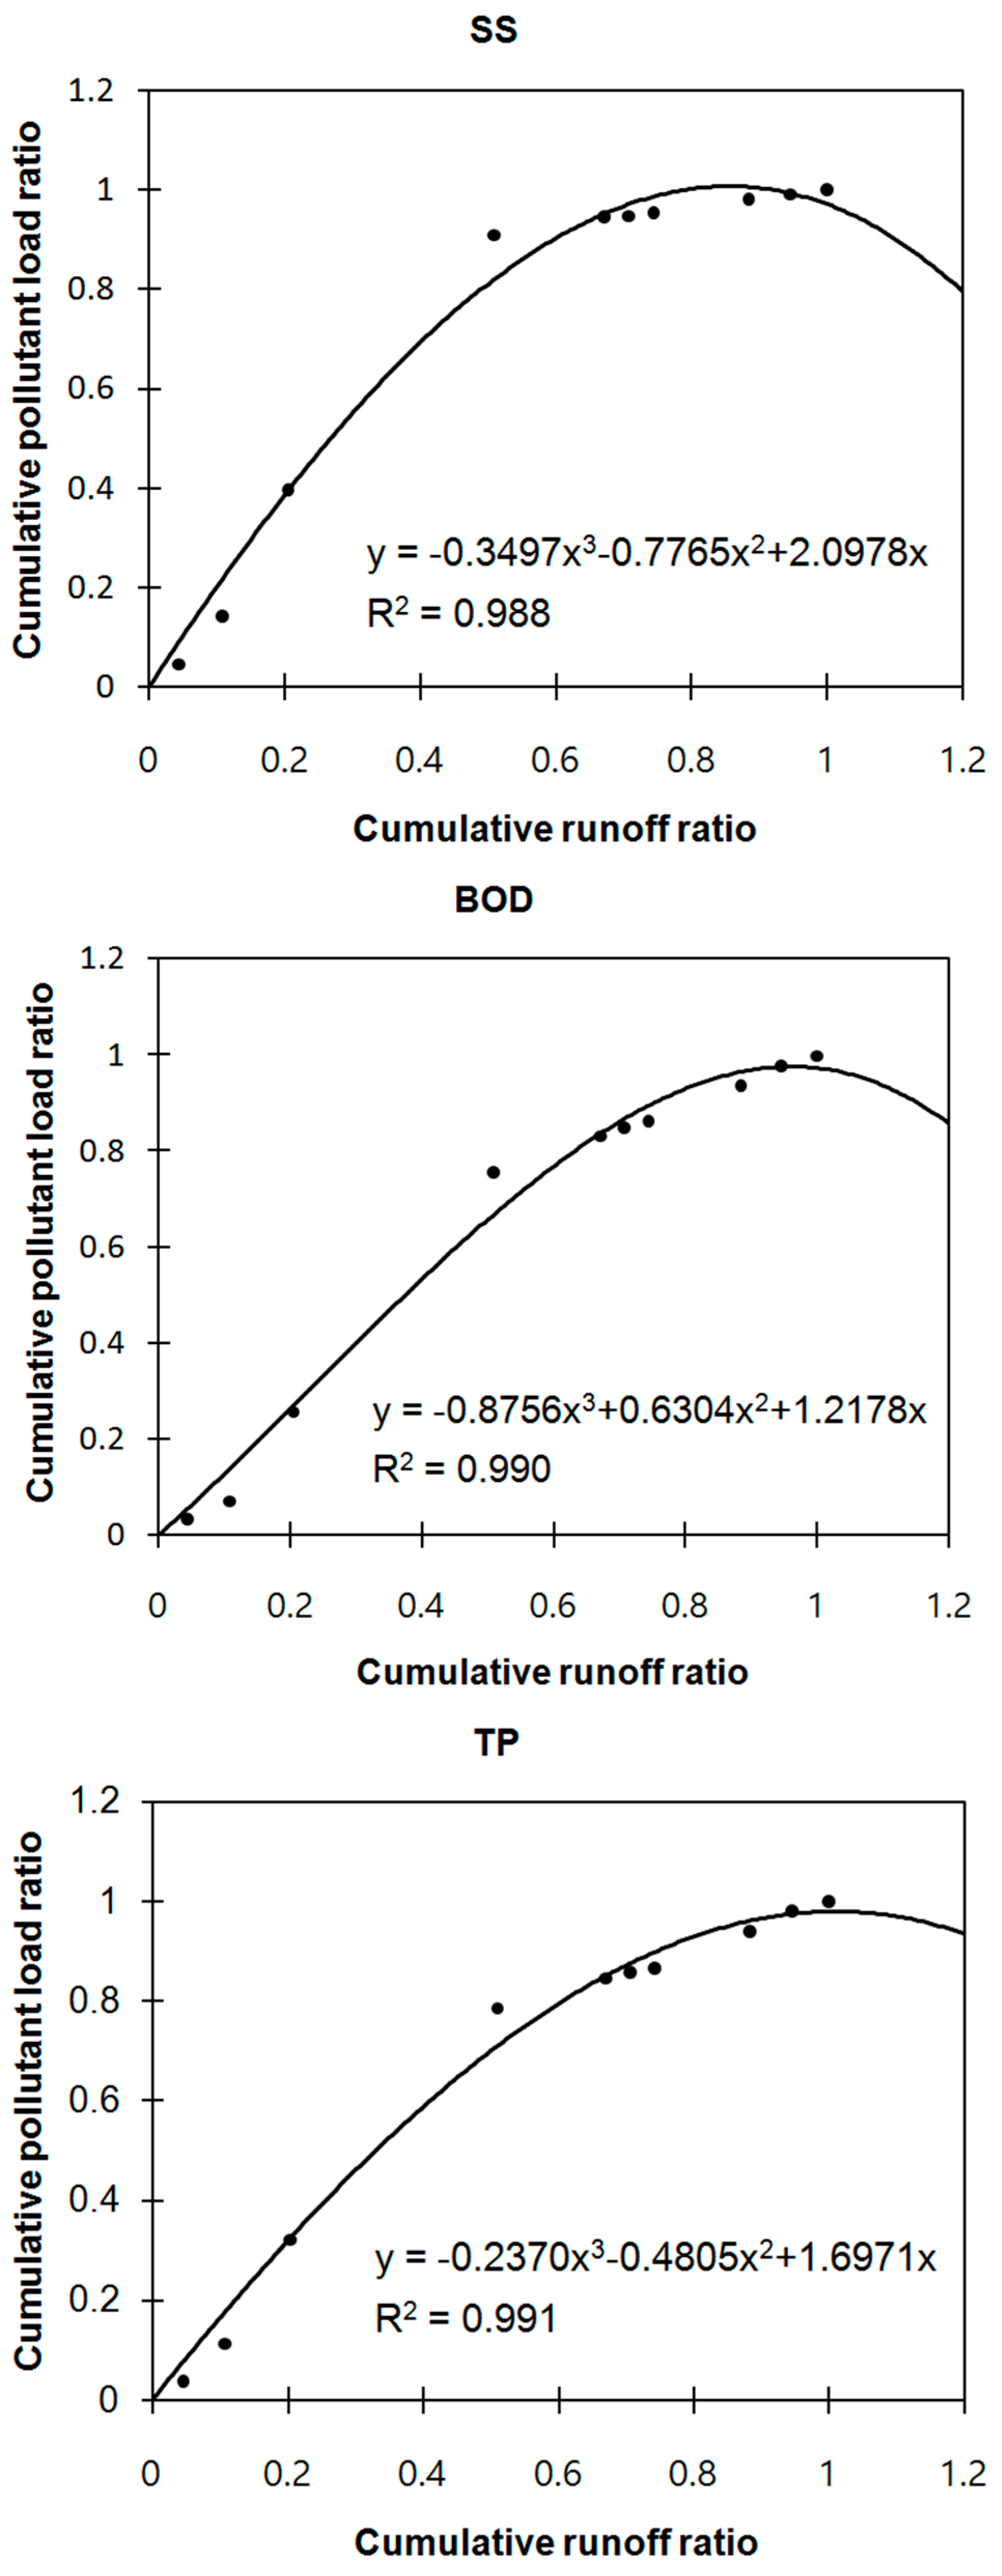
Figure 11) and third-degree polynomial function (
Figure 12) are compared, the performance of the third-degree polynomial function is slightly better than that of the power function, as shown in
Table 5. The performance of the regression model was evaluated using the coefficient of determination (
R2) and the root mean square error (RMSE). For the power function, the
R2 of 16–17 July at Naedongcheon ranged from 0.943 to 0.973, and for the third-degree polynomial function, the
R2 values ranged from 0.988 to 0.991. The RMSE values of the third-degree polynomial function (0.045–0.052) are lower than those of the power function (0.079–0.125).
Figure 12 presents the
M(
V) curve fitting using a third-degree polynomial function. The cumulative pollutant load ratio should increase to 1.0 until the cumulative runoff volume ratio reaches 1.0. However, the last section of the mass-volume data of
Figure 12 shows that the value of the cumulative pollutant load ratio decreases. In the case of
M(
V) curve fitting using the power function, the cumulative pollutant load ratio gradually increases and a limited difference is observed in the performance of the regression model compared with the third-degree polynomial function.
In this study, the first flush phenomenon was analyzed with a regression model using the power function.
Table 5 shows that the
R2 values ranged from 0.922 to 0.999 and the RMSE values ranged from 0.012 to 0.149, which indicates a good performance of the regression models. In the
M(
V) curve fitting with the power function, the tendency for a strong first flush effect was observed when coefficient
a decreased to less than 1.0. Further regression curves are substantially above the 45° line in
Figure 7,
Figure 8,
Figure 9 and
Figure 10, and coefficient
a in
Table 5 is decreased. Thus, the strength of the first flush can be interpreted with coefficient
a of the regression model using the power function. Coefficient
a in
Table 5 indicates that a relatively strong first flush occurred because of the SS discharge of Jungjohangcheon and Naedongcheon, and a partial first flush occurred because of the TP and BOD discharge.
The FF
30 from four rainfall events for a highly urbanized area in China, which had a drainage area of 115–218 ha, a percentage of urban area of 62.5–90.1%, and a rainfall depth of 6.3–57.8 mm, ranged from 0.189 to 0.614 (COD, NH
3–N, TN, TP, SS, and BOD
5) (Ma et al., 2011). In addition, for an urban area with a catchment area of 480 ha, an impervious surfaces ratio of 85%, and mixed discharge of stormwater runoff and untreated wastewater, the FF
30 from 8 rainfall events was 52.2–72.1% for total SS (TSS), 53.0–65.3% for COD, 40.4–50.6% for TN, and 45.8–63.2% for TP [
21].
A significant first flush is assumed to occur if at least 80% of the total pollutant mass is transported in the first 30% of the volume discharged during rainfall events (i.e., a 30/80 first flush) [
12]. However, Sansalone and Buchberger [
31] proposed a 25/50 first flush. In both cases, these values are generally used for concentrated gutter flow where the first flush effect was assumed to be strong [
12].
The significance and the characteristics of first flushes in medium-sized agricultural catchments on the French Mediterranean coast were investigated. The highest FF
25 value of the agricultural catchments for a flood was 0.72, and it was calculated using the TSS value. Vorreiter and Hickey [
32] defined a first flush at a FF
25 value greater than 0.4–0.6. The FF
25 for a weak flood is approximately 42% according to the TSS value, which still meets the criteria of Vorreiter and Hickey [
22,
32].
The FF
30 and FF
25 values were estimated based on the five events in Naedongcheon and Jungjohangcheon and are shown in
Table 5. Among the five FF
25 values for the SS values in
Table 5, three FF
25 values (0.40, 0.44, and 0.67) meet the criteria of a first flush (FF
25 0.4). The FF
30 values in
Table 5 are inversely proportional to coefficient
a values of the regression model. Parameter
a of the SS load from 1–2 July at Jungjohangcheon (0.417) is the lowest among the coefficient
a values in
Table 5, and the FF
30 of the SS load for the same event (0.708) is the highest among all FF
30 values. However, the coefficient
a of the SS load from 1 to 3 October at Jungjohangcheon (5.366) is the highest among the coefficient
a values shown in
Table 5, and the FF
30 value of the SS load for the same event (0.005) is the lowest among all FF
30 values.
3.1.3. EMC and Pollutant Loads per Unit Area
As shown in
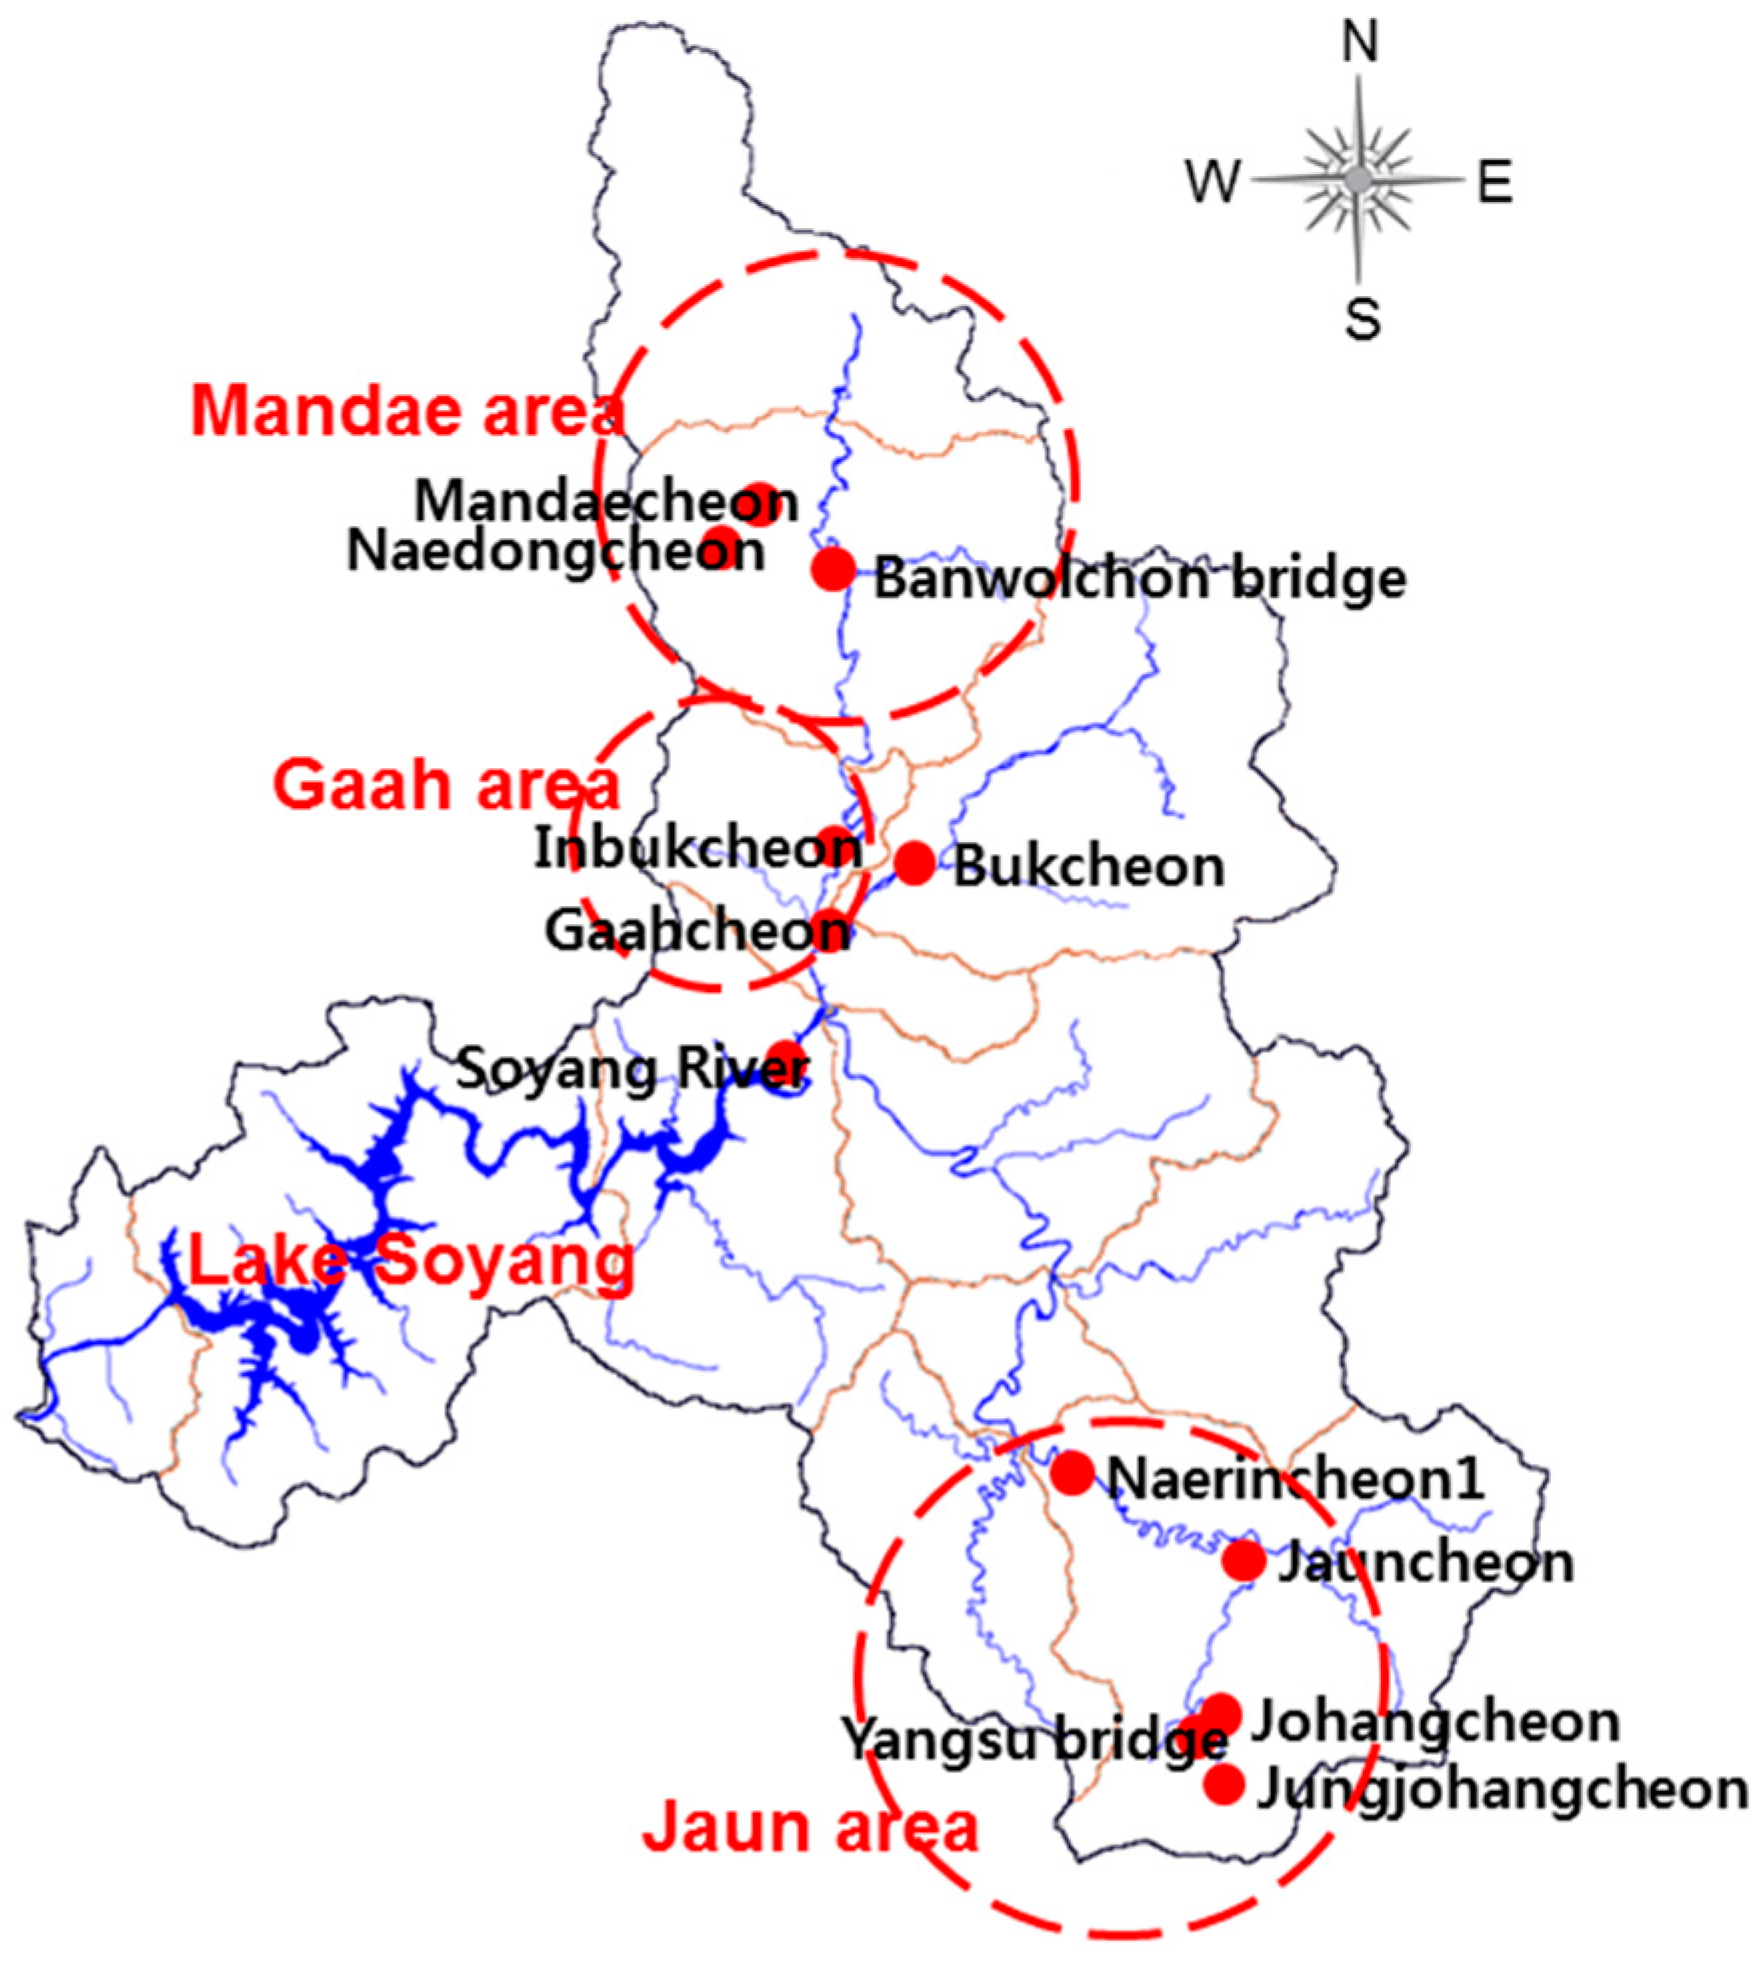
Table 6, the EMC values for 1–2 July from the Jaun area points (
Figure 1) indicate that the highest SS values occur in Jungjohangcheon, whereas the EMC gradually reduces as the flow continues downstream through Johangcheon to the lower part of Jauncheon. The remaining water quality parameters do not show specific trends. The EMC values for 16–17 July from the points in the Mandae area (
Figure 1) indicate that the SS is highest in Naedongcheon. The EMC during a rainfall event gradually decreases as the flow continues through Mandaecheon and Inbukcheon downstream. Although the Soyang River point is mostly in the downstream part of the study area, on 3 October 2016, two samples from the Soyang River point have an SS concentration over 200 mg/L. The EMC of the SS loads in the storm event from 1 October to 3 October 2017 is atypically high because of construction work near the survey point.
In the Mandae area (
Figure 1), the SS pollutant loads per unit area is the largest in Naedongcheon, which is the point furthest upstream, and decreases with the flow towards Mandaecheon and Inbukcheon (
Table 7). The TN, TP, and TOC pollutant loads are higher in the upper part and also display declining trends with flow downstream. In the Jaun area (
Figure 1), the SS pollutant load per unit area is not always highest at the Jungjohangcheon point, with variation observed among the rainfall events. The loads of the pollutants other than SS do not show specific trends.
The Mandaecheon sub-basin has the highest sediment yields among the Soyang River sub-basin, and it consists of 27.7% agricultural land. The remaining non-agricultural land is composed of 20.7% forest area, 51.6% residential land, and other areas. The agricultural land consists of 75% dry field areas. The Mandae area is a dense highland field area and represents a major sediment runoff source. Large amounts of pollutants are discharged into the river because the agricultural population in this area is larger than those of the other areas and because military units are also in this area. Thus, the EMC and pollutant load per unit area for the SS and TP in the Mandaecheon and Naedongcheon sub-basin areas are higher than those of the other areas.
