Article

Generalized Storage–Yield–Reliability Relationships for Analysing Shopping Centre Rainwater Harvesting Systems

1
School of Civil and Environmental Engineering, University of the Witwatersrand, Johannesburg 2050, South Africa
2
Arup Consulting, Johannesburg 2076, South Africa
3
Knight Piesold Consulting Engineers, Johannesburg 2128, South Africa
*
Author to whom correspondence should be addressed.
Water 2017, 9(10), 771; https://doi.org/10.3390/w9100771
Submission received: 11 August 2017 / Revised: 27 September 2017 / Accepted: 30 September 2017 / Published: 10 October 2017

Abstract

:
The objective of this study was to develop guidelines for analysing rainwater harvesting (RWH) systems of shopping centres in South Africa. A model consisting of three dimensionless relationships relating rainwater supply and demand to storage capacity, yield and reliability was formulated. Data from daily simulation of potential RWH systems of 19 shopping were used to obtain the relationships. The simulations revealed within-year storage behaviour with considerable variation of annual yield. By applying the Weibull plotting position formula, yield–reliability relationships were derived. The aim to maximize yield and reliability whilst minimizing storage identified Pareto-optimal combinations of the three variables and these combinations were used to develop two dimensionless relationships. An additional relationship based on the dependence of the slope of the yield–reliability plots on yield was formulated to enable analysis of hydrologically non-optimal systems. Verification tests using four RWH systems obtained results that matched those from simulation and the model could therefore be applied for RWH feasibility analysis and preliminary design. This study highlights the need to incorporate inter-annual variability in RWH analysis and shows how reliability can be used to quantify this. This study further demonstrates how reliability can be fully integrated into regression relationships for generalized RWH analysis.

1. Introduction

The escalating global demand on finite water resources is of great concern [1] and is likely to constrain future economic growth and development [2]. Diverse approaches to deal with this challenge are applied in different regions of the world including rolling water resources planning [3]. With large population growth and imprudent water use habits, there is an ever-increasing demand for water in urban areas [4] and rainwater harvesting (RWH) could significantly complement centralized urban water supply [5]. Although RWH life cycle cost analyses (LCCA) sometimes obtain long payback periods [6,7,8], water supply is subsided in many regions of the world [9,10,11] and the tariffs used in RWH LCCA are likely to be lower than the actual costs of centralized water supply. Rebates are provided in some cities for installation of rainwater harvesting systems [6] indicating that RWH systems are valuable water sources. RWH systems provide other benefits such as stormwater attenuation [12] and also reduce water supply energy usage [13] and carbon footprint [5]. RWH could also lead to a feeling of independence from centralized water supply [9]. Although rainwater sometimes fails to meet drinking water standards [14,15,16,17,18], the quality of rainwater is usually superior to that from surface water and groundwater that may have been contaminated [19]. Sazakli et al. [20] report that rainwater from rooftops generally meets international drinking water quality standards. Rainwater is always soft unlike groundwater and can therefore be readily used for laundry and in hot water systems [5].
South Africa is a water-scarce country with a mean annual precipitation (MAP) of 465 mm which is unevenly distributed in time and space. In South Africa, RWH is given credence as a valuable water source [3]. Mwenge Kahinda et al. [21] inform that over 26,500 rural households in South Africa use rooftop rainwater harvesting as the main source of drinking water. RWH has also been implemented in urban areas and, in one project, this led to a 10% reduction in bulk water demand for 500 low-income households [3]. Ndiritu et al. [22] analysed the rainwater harvesting potential of 32 schools in South Africa and found that, in every year, between 42 and 132 days of the daily school demand could be provided at a reliability of 90%. As there are many shopping centres in South Africa (stated as 1785 with areas larger than 2000 m2 in 2010 [23]), the potential contribution of shopping centre RWH systems to water security could be significant. RWH is being promoted as a green building technology [24] and unpublished information reveals increased installation of RWH systems for buildings and other structures with large roofs. Since no guidelines for the hydrologic analysis of shopping centre RWH systems in South Africa were found in the literature, this study set out to formulate them. The aim was to obtain generalized guidelines that would be applicable for RWH feasibility analysis and preliminary design. This would help to forestall wrong investment decisions and inappropriate sizing of RWH systems.
Comprehensive models for detailed RWH analysis have been developed [5,25] and Campisano et al. [9] provide a review of many others. Acquiring detailed models may however not be free and applying them is likely to take more time than using simple generalized models. Generalized models are applicable for regional assessment of RWH potential [26] and may be preferred to detailed ones especially where time and other resources are scarce. Generalized RWH storage–yield–reliability relationships have been developed in other regions of the world [26,27,28] as regression equations of dimensionless ratios of the variables involved (with few exceptions). In three recent studies [26,27,28], the data for generalizing were obtained from multiple simulations of RWH systems. In these studies, the regression equations were developed at specified reliabilities and reliability itself was not included as a variable in the equations. The dimensionless ratios that have been applied are the yield, the demand and the storage fraction. The yield fraction has been defined as the ratio of yield to demand and the demand fraction as the ratio of demand to supply [26,27,28]. The storage fraction has been specified as storage capacity divided by annual rainfall volume [26,28] or as this ratio multiplied by the ratio of rain days to dry days [27]. For RWH analysis, reliability has been commonly defined as volumetric reliability (volume supplied to that demanded over the simulation period) [6,28,29,30,31] or as the ratio of days of full supply to the total days of simulation [26]. However, volumetric reliability does not capture inter-annual variability of rainfall, and statistical analyses of the yield (or volumetric reliabilities) obtained in each year of simulation have been used to incorporate this variability [25,27]. The effect of inter-annual rainfall variability has also been assessed by analysing RWH performance for dry, normal and wet years [29] or for a typical dry year [32]. Since South Africa experiences large inter-annual variability of rainfall [3], the RWH guidelines to be developed in the current study needed to incorporate inter-annual rainfall variability and to also fully integrate reliability (the quantifier of variability) into the regression equations of the model.

2. Materials and Methods

A dependable generalized model needs to be based on the expected characteristics and performance of actual RWH systems. Since no long-term data on installed RWH system behaviour were available, daily time-step simulation was used to provide empirical data for development of the generalized model—an approach that has been used in other generalization studies [26,27,28]. The generalized model was formulated by developing regression equations using data from the simulation of 19 potential RWH systems located in four South African provinces. Verification was then done by comparing results from the model with those from simulation. Four potential RWH systems located far from those used in model formulation (in four other provinces) were used for verification. A case study RWH design and assessment of a single shopping centre was then used to illustrate the application of the model.

2.1. Selection and Acquisition of Data

Rainfall distribution in South Africa exhibits high temporal and spatial variability. Robust generalized model development therefore needs to be based on long rainfall time series from different regions zones. Additionally, the guidelines also need to be applicable to the all classes of shopping centres. Prinsloo [33] classified shopping centres according to their floor area as: Neighbourhood centres (5000–12,000 m2), Community centres (12,000–30,000 m2), Large community/small regional centres (30,000–50,000 m2), Regional centres (50,000–100,000 m2) or Super regional centres (>100,000 m2). For the development of the model, it is decided to select one shopping centre from each category from four South African provinces (Kwa Zulu Natal, Gauteng, Limpopo and Western Cape). Selecting five shopping centre categories in four regions would provide 20 shopping centres but, since no super regional centre is located in Limpopo, a total of 19 shopping centres are therefore selected. For model verification, two regional and two small regional centres located in four other provinces (North West (NW), Eastern Cape (EC), Free State (FS) and Mpumalanga (MP) provinces) are used. All the selected shopping centres are located in cities.
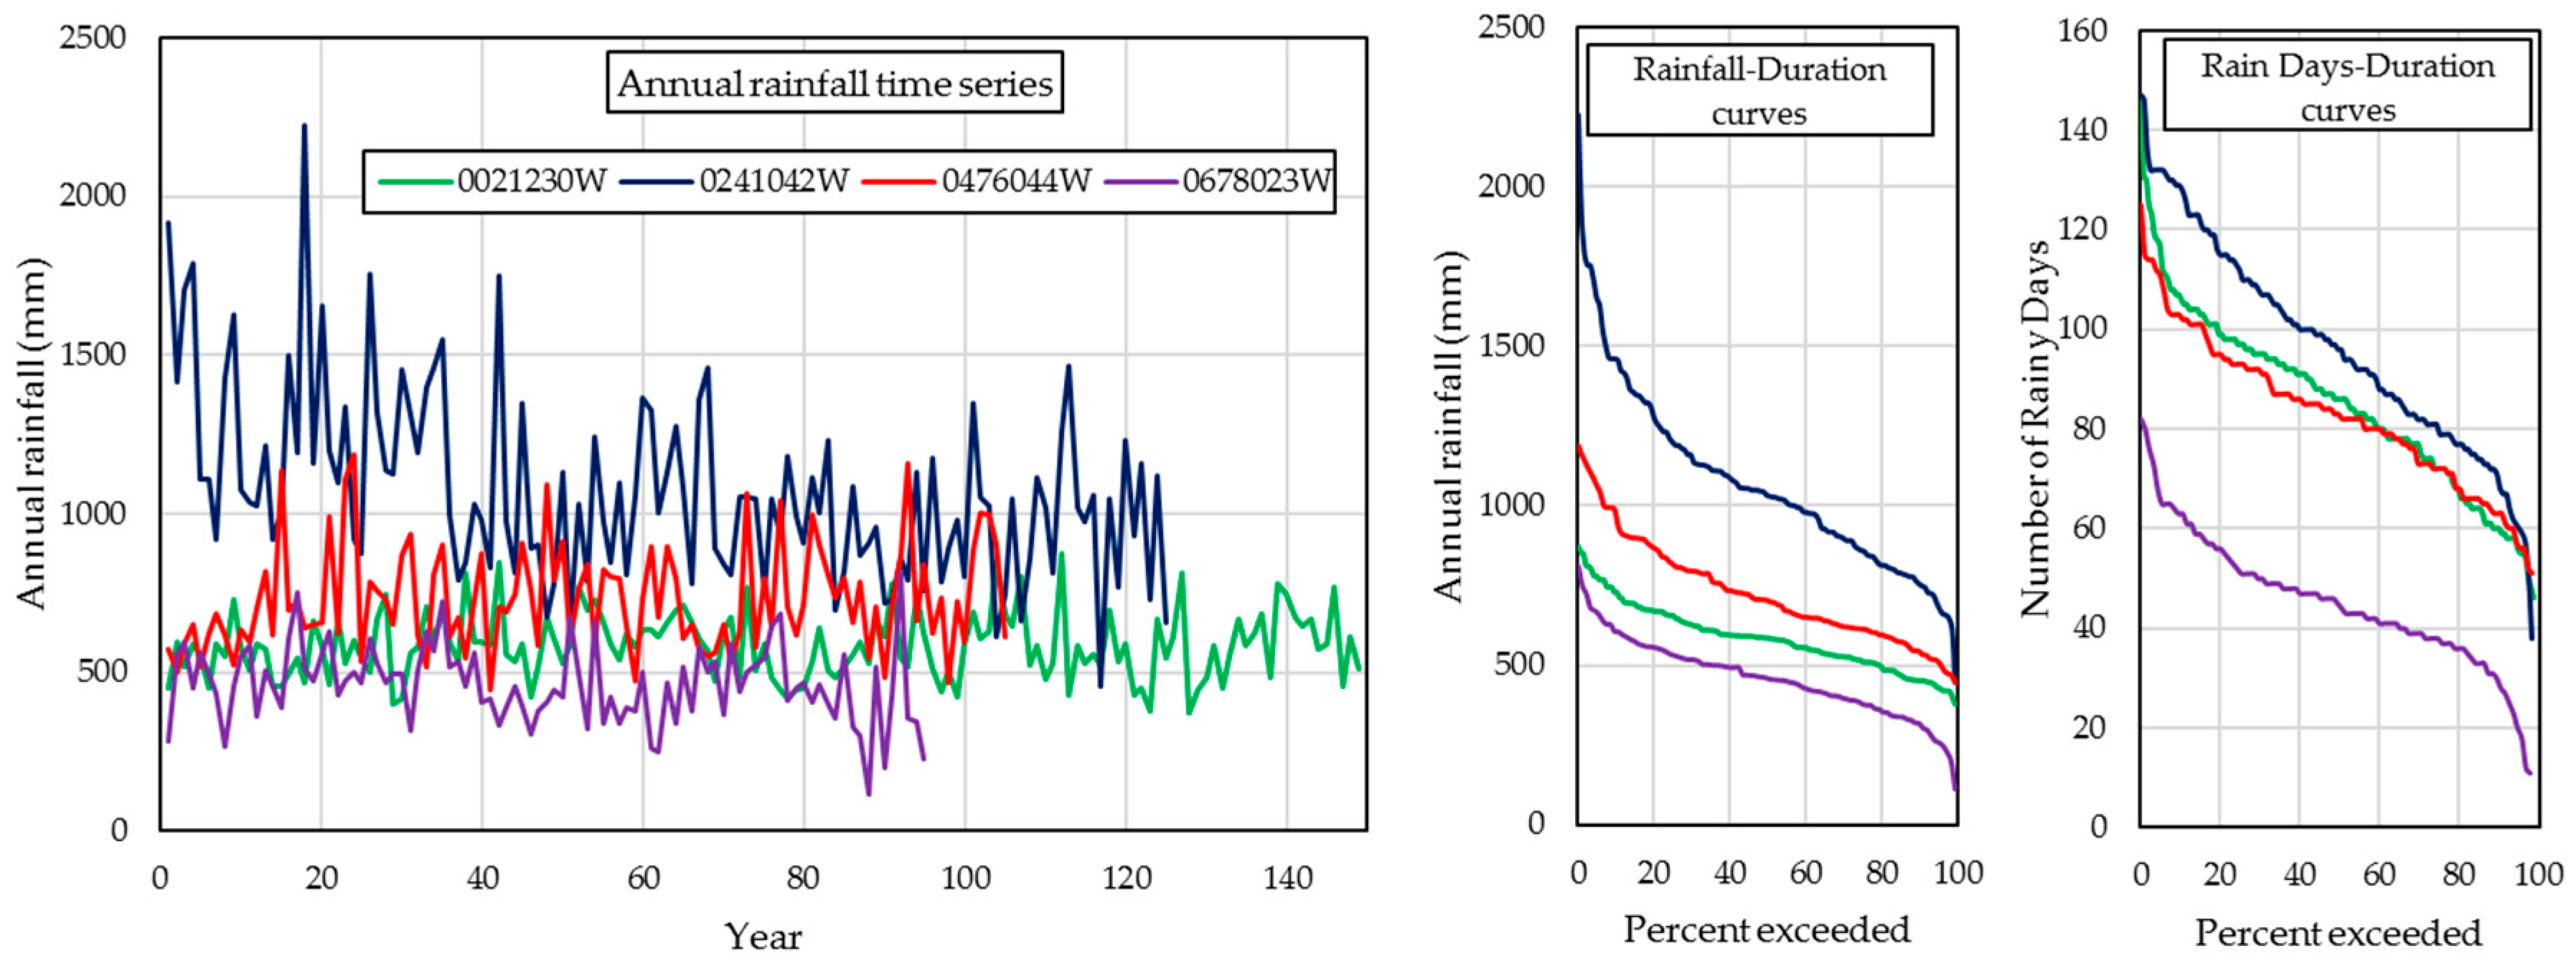
The rainfall database developed by Lynch [34] is used to find the rain gauge station with a long and reliable daily rainfall record closest to each shopping centre. Table 1 shows the shopping centres selected for analysis, the respective rain gauge stations and the distances from the shopping centres to the rain gauge stations. Table 2 provides additional information on the selected rainfall stations. The average length of data is 117 years with 67% of this consisting of observed measurements. The rest of the data were in-filled using Expectation Maximization, Median ratio or the Inverse distance weighting method in the development of the database [34]. As Table 2 shows, a small proportion of the unobserved data could not be in-filled and was categorized as missing. Lynch [34] did not provide quantitative information on the possible errors in the observed data and from infilling but informed that the data had been checked for consistency. Graphical plots of the selected data for the current study revealed only one inconsistency (for site 0436495 W) and 16 years of questionable data (that was all patched) was discarded. Figure 1 shows the locations of the rainfall stations used in model development and verification. Figure 2 shows the annual time series, rainfall–duration and rain days–duration curves for representative rainfall stations and highlights the large temporal variability of annual rainfall in various regions of South Africa.
No information on demand was availed by the shopping centres and CSIR [35] proposed a demand of 4 m3/m2 of floor area/year for South Africa. A study on 40 shopping centres of varying sizes in Western Australia [36] obtained highest demands of 2.828, 3.141, 1.347, and 1.383 m3/m2/per year for neighbourhood centres, large community/small regional centres, regional centres, and super regional centres, respectively. Since these demands were based on detailed field measurements and the demands in Western Australian malls are not likely to be substantially different from those in South Africa, they were adopted for analysis in this study. For community centres, the average overall demand of 2.18 m3/m2/per year obtained by Saunders [36] was adopted. It was assumed that the RWH systems would supply non-potable water use (cooling towers for air conditioning, toilets, urinals and cleaning) which was assumed as 45% of the total demand as found by Saunders [36]. Daily demand on weekends was assumed to be twice that on weekdays and the monthly demand for December was assumed to be twice the demand in the other months of the year.

2.2. Simulation Analysis

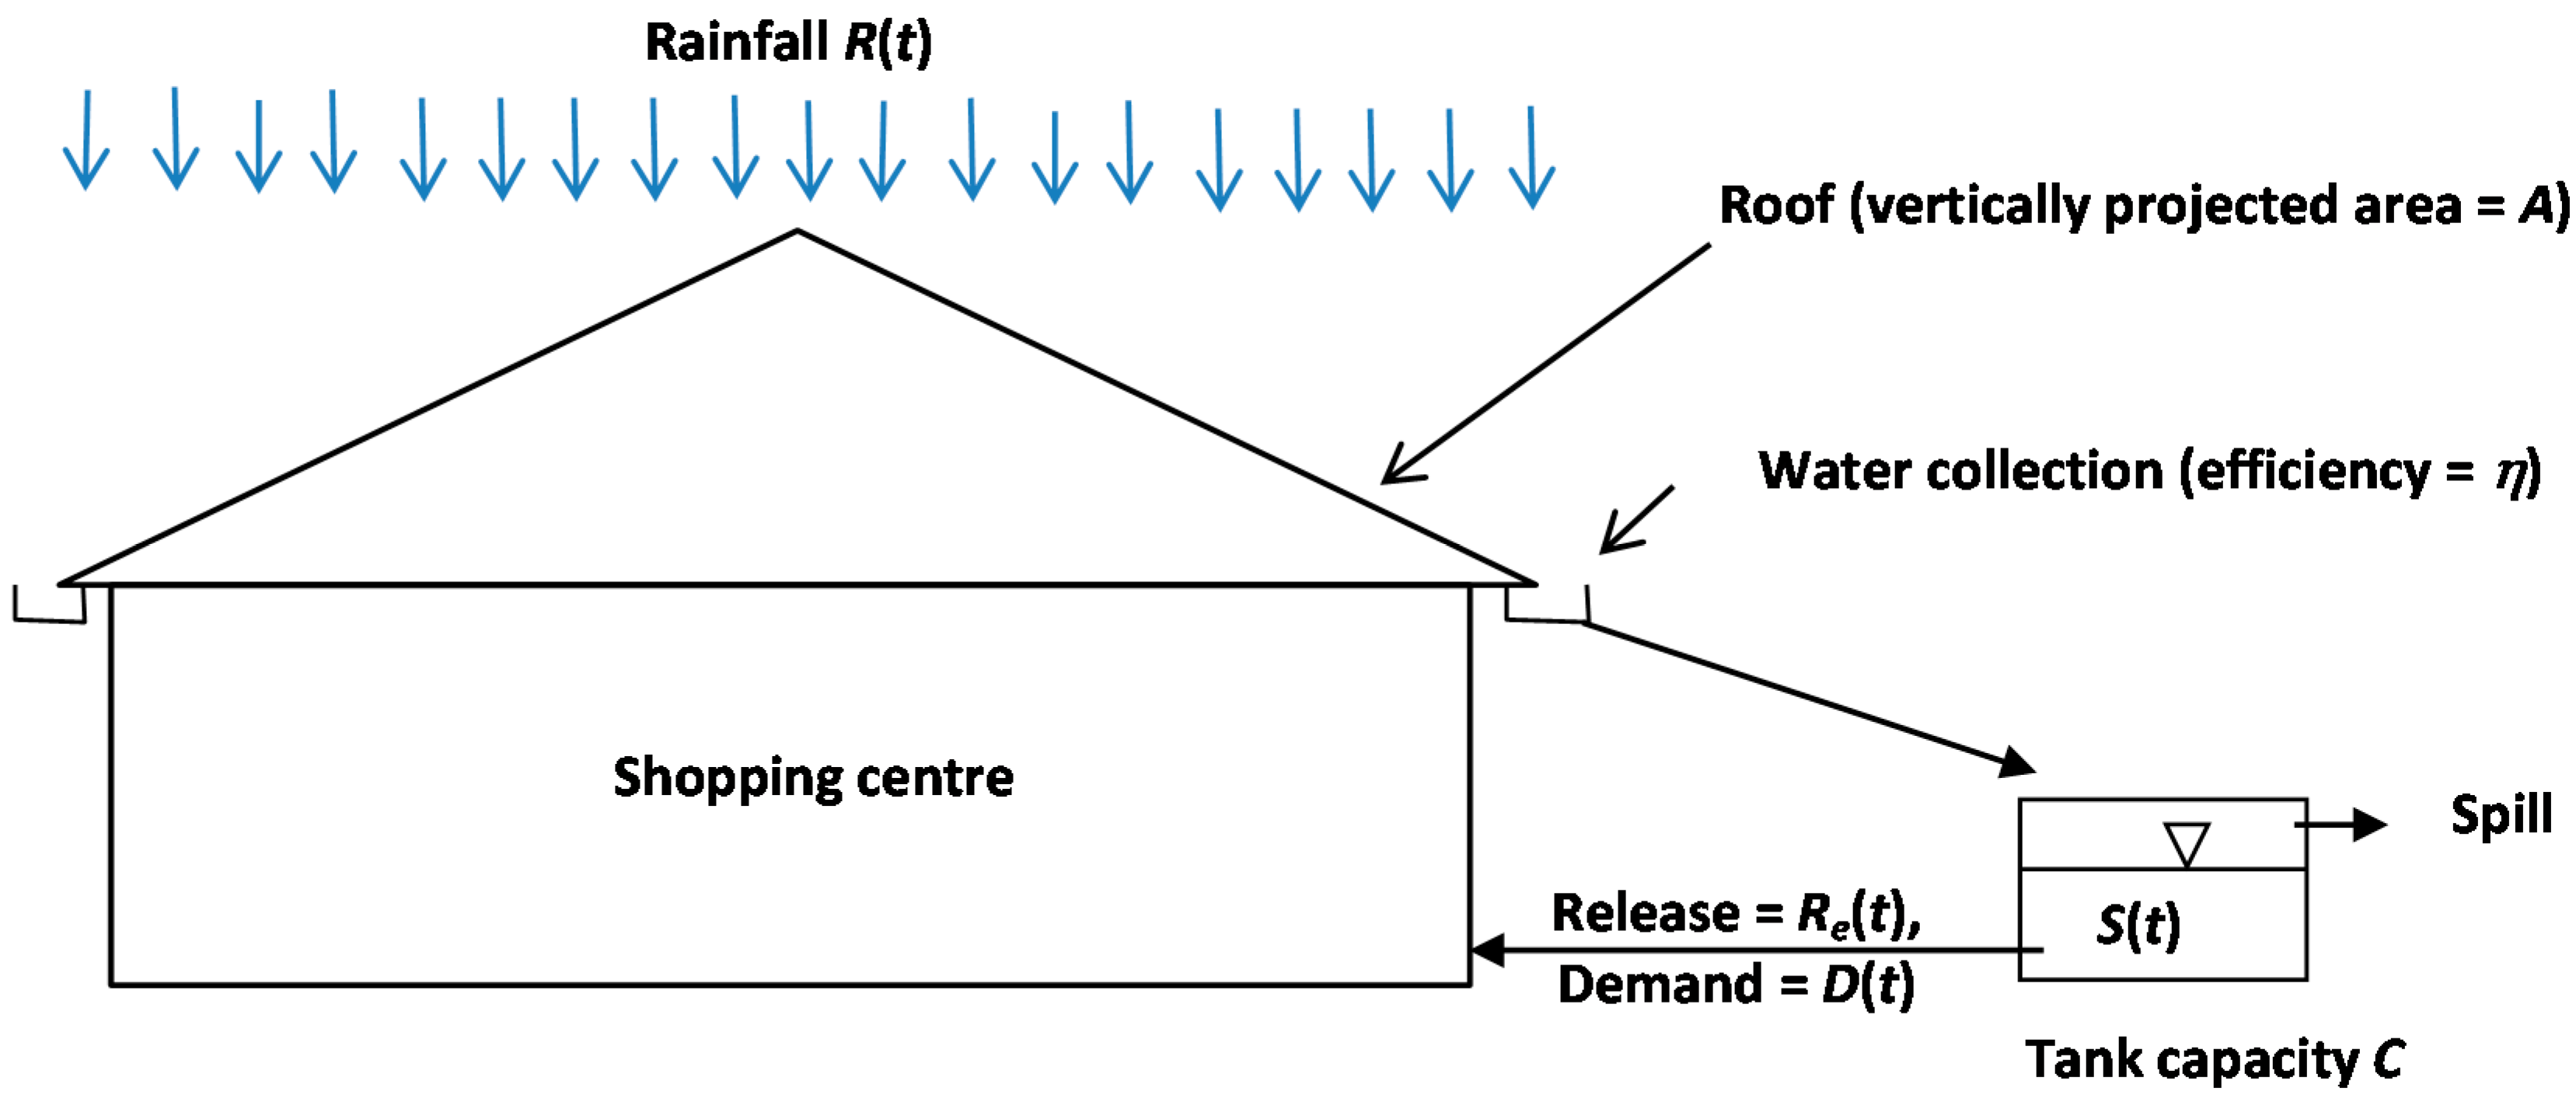
Daily time step simulation of RWH systems has been used to provide data for generalizing storage–yield–reliability relationships [26,27,28] and for other analyses [22,37,38,39,40]. Simulation also forms the basis of most RWH modelling tools [9]. A typical roof RWH system consists of a roof catchment, a conveyance arrangement, a storage, a conduit to the demand and an opening for spillage. A RWH system could also include a first flush device [41] or a water filtration mechanism [42]. Rain falling on the roof catchment is conveyed in to the storage and this water becomes available to supply the demand. The storage spills if the inflow exceeds the outflow while the storage is full. The water balance fluxes of RWH systems are sub-daily but a daily analysis has been found to be sufficiently accurate [43]. Figure 3 show the components of a RWH system as implemented here, and Equations (1) and (2) describe the yield-after-spillage mass balance computations that were applied.
R e ( t ) = D ( t )   i f   S ( t ) D ( t ) S ( t )   i f   S ( t ) < D ( t )
S ( t + 1 ) = m i n   C R e ( t ) S ( t ) + η R ( t ) A R e ( t )
where Re(t) is the volume of water released to meet the demand in period t, D(t) is the demand in period t, S(t) is the volume of water in storage at the start of period t, C is the live storage capacity of the tank, η is the water collection efficiency, R(t) is the rainfall intensity in period t and A is the vertical projection of the effective roof area.
The simulation analysis does not explicitly model first-flush, evaporation and other losses, and it is assumed that these could be adequately effected in the selection of the water collection efficiency. This approach has been used by Berwanger and Ghisi [44] and Melville-Shreeve et al. [45] inform that a constant first-flush loss of 5 L/day could be applied for a typical UK house. Water collection efficiencies of 80 and 82% have been obtained from field experiments in South Africa [46] and Taiwan [30]. An efficiency of 80%, which has been used in other studies [22,44,47], is adopted.

2.3. Formulating Generalized Storage–Yield–Reliability Relationships

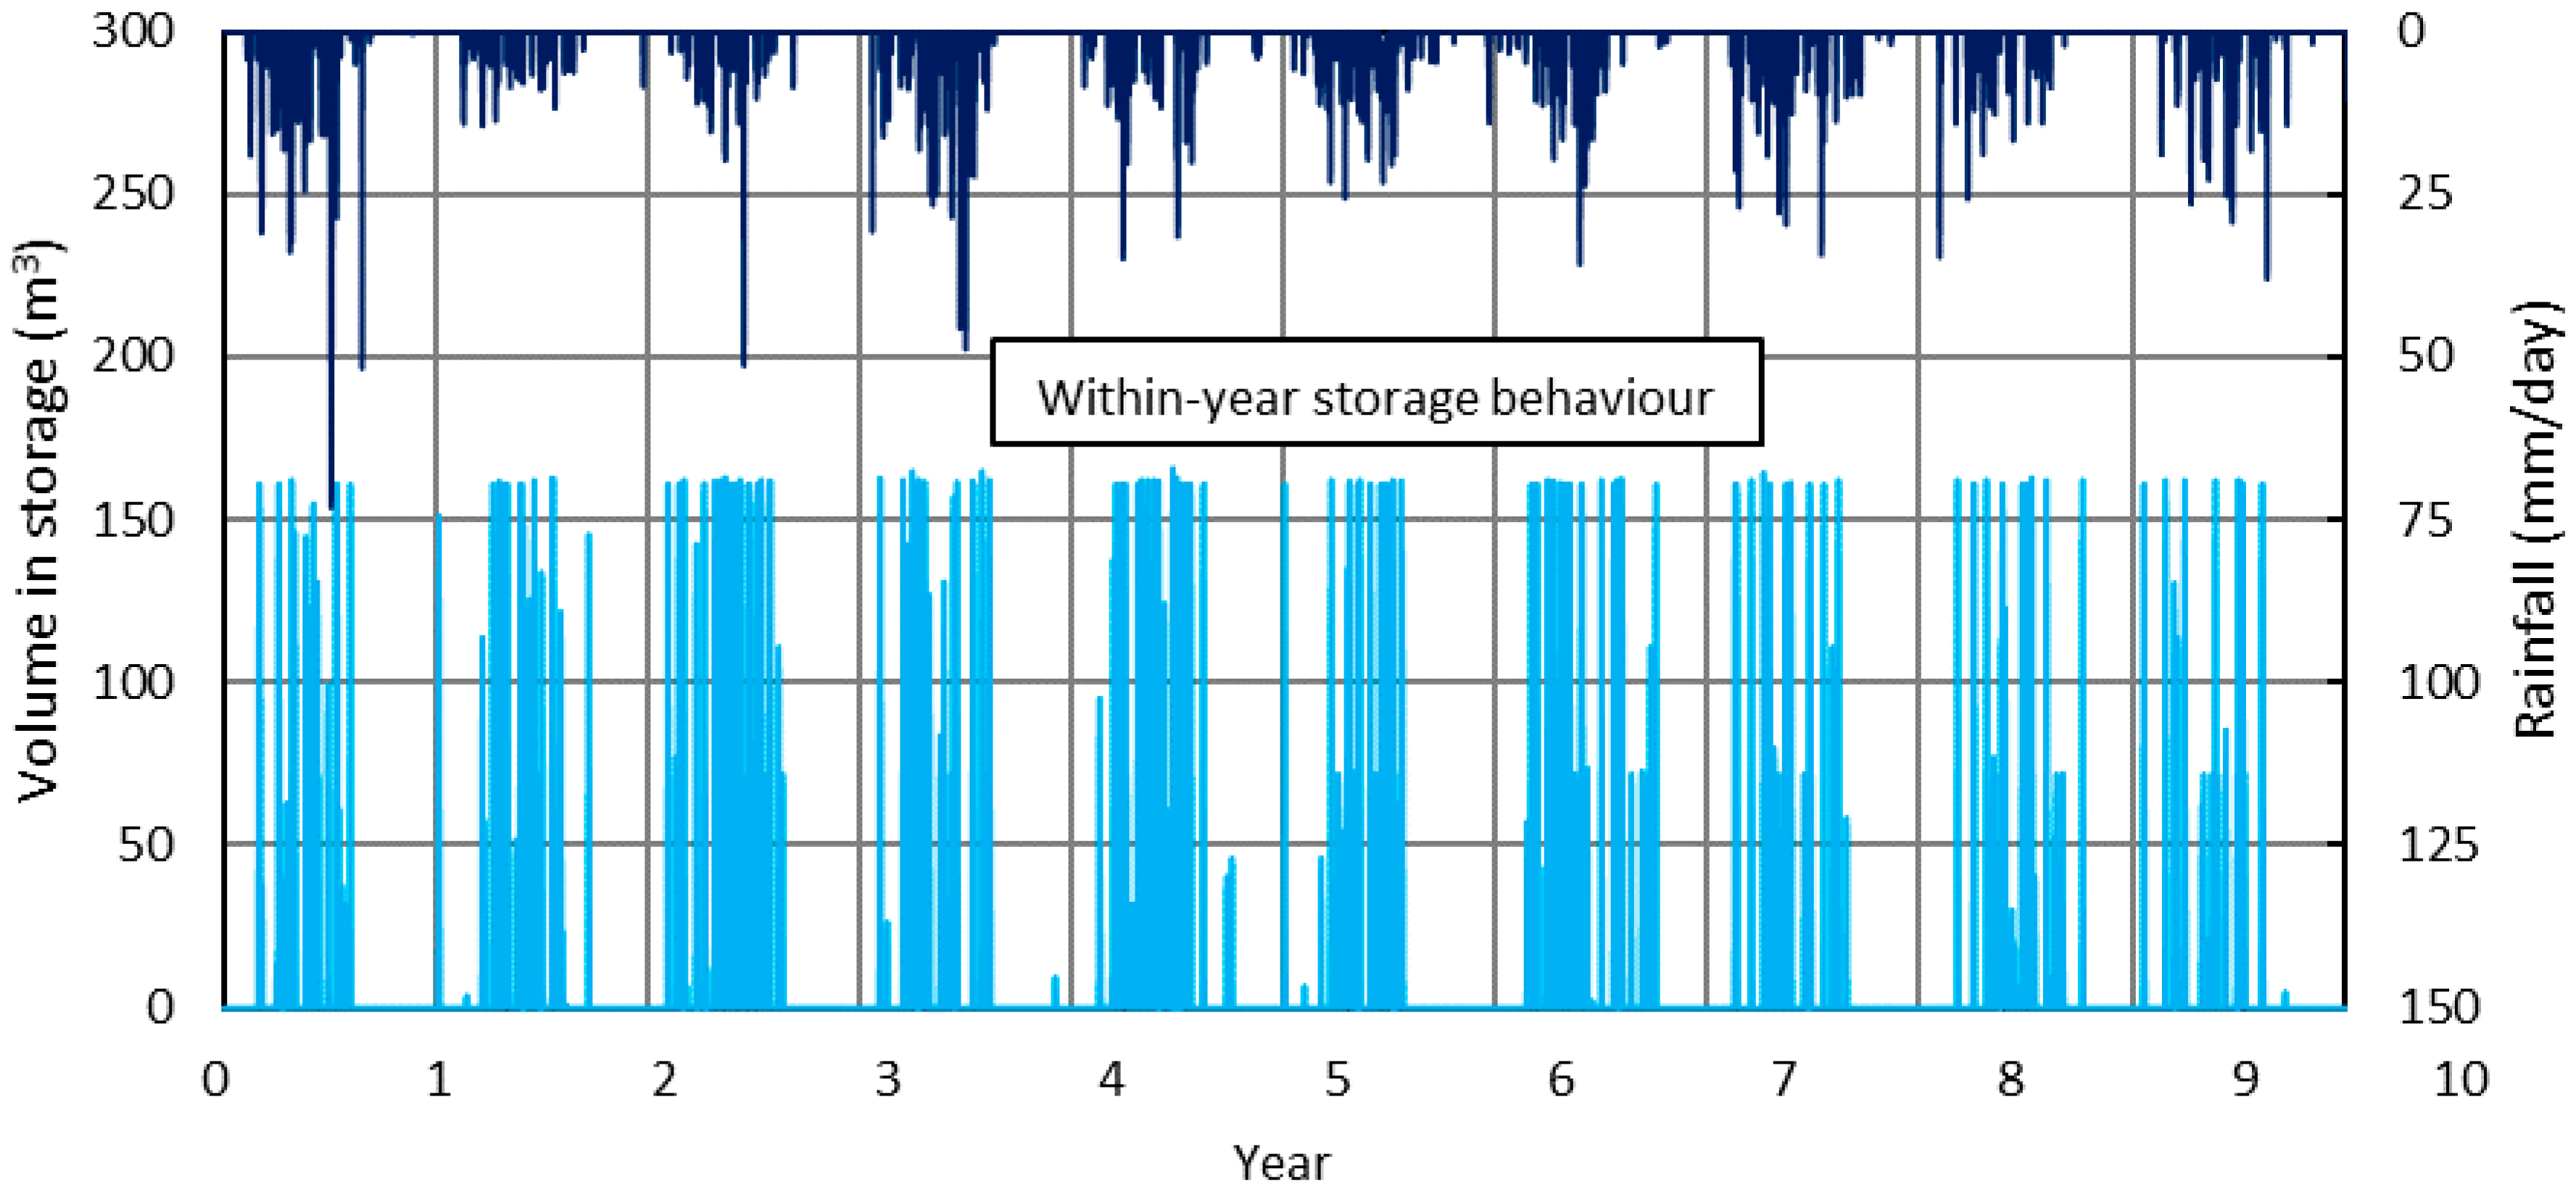
The formulation of the generalized relationships is carried out intuitively and iteratively using the data from the simulation and graphical presentation of simulation results. Regression analysis on spreadsheet is used to help obtain robust relationships. Trial simulation runs revealed that the RWH systems mainly exhibited within-year storage behaviour (Figure 4) with the storage emptying in all (or most) of the years during the dry seasons. For three shopping centres (Gateway, Liberty and Phoenix) where the supply to demand ratio exceeds unity, over-year storage behaviour occurred if large storages were used. Reliability-based analysis for over-year storage is well developed and widely applied in South Africa [48,49,50] and it is decided to confine the current analysis to within-year storage behaviour. This is accomplished by reducing the effective roof areas for the three centres (Table 1) to obtain supply to demand ratios less than unity.
The number of days that the RWH system fully supplied the demand in a given year is used as a practical measure of within-year yield. The yield ratio could also be specified as the proportion of the year for which demand is met. As expected, the number of days of full supply in each year varies highly given the high inter-annual rainfall variability (Figure 2). This confirms the need to include reliability (exceedance probability) of the days of supply in the formulation. To determine the reliabilities, an empirical plotting position approach is preferred to a subjectively selected probability distribution. Several plotting position formulae including the Weibull formula [51] and the alternatives proposed by Cunnane [52] are tried and all give similar exceedance probabilities. The Weibull formula is considered to have a better theoretical basis than other plotting position formulae [53] and is selected. The numbers of days of full supply in each year are ranked in descending order the exceedance probability is obtained as:
p = m / ( n + 1 )
where p is the exceedance probability (reliability) of the days of full supply ranked m, and n is the total number of years of simulation.
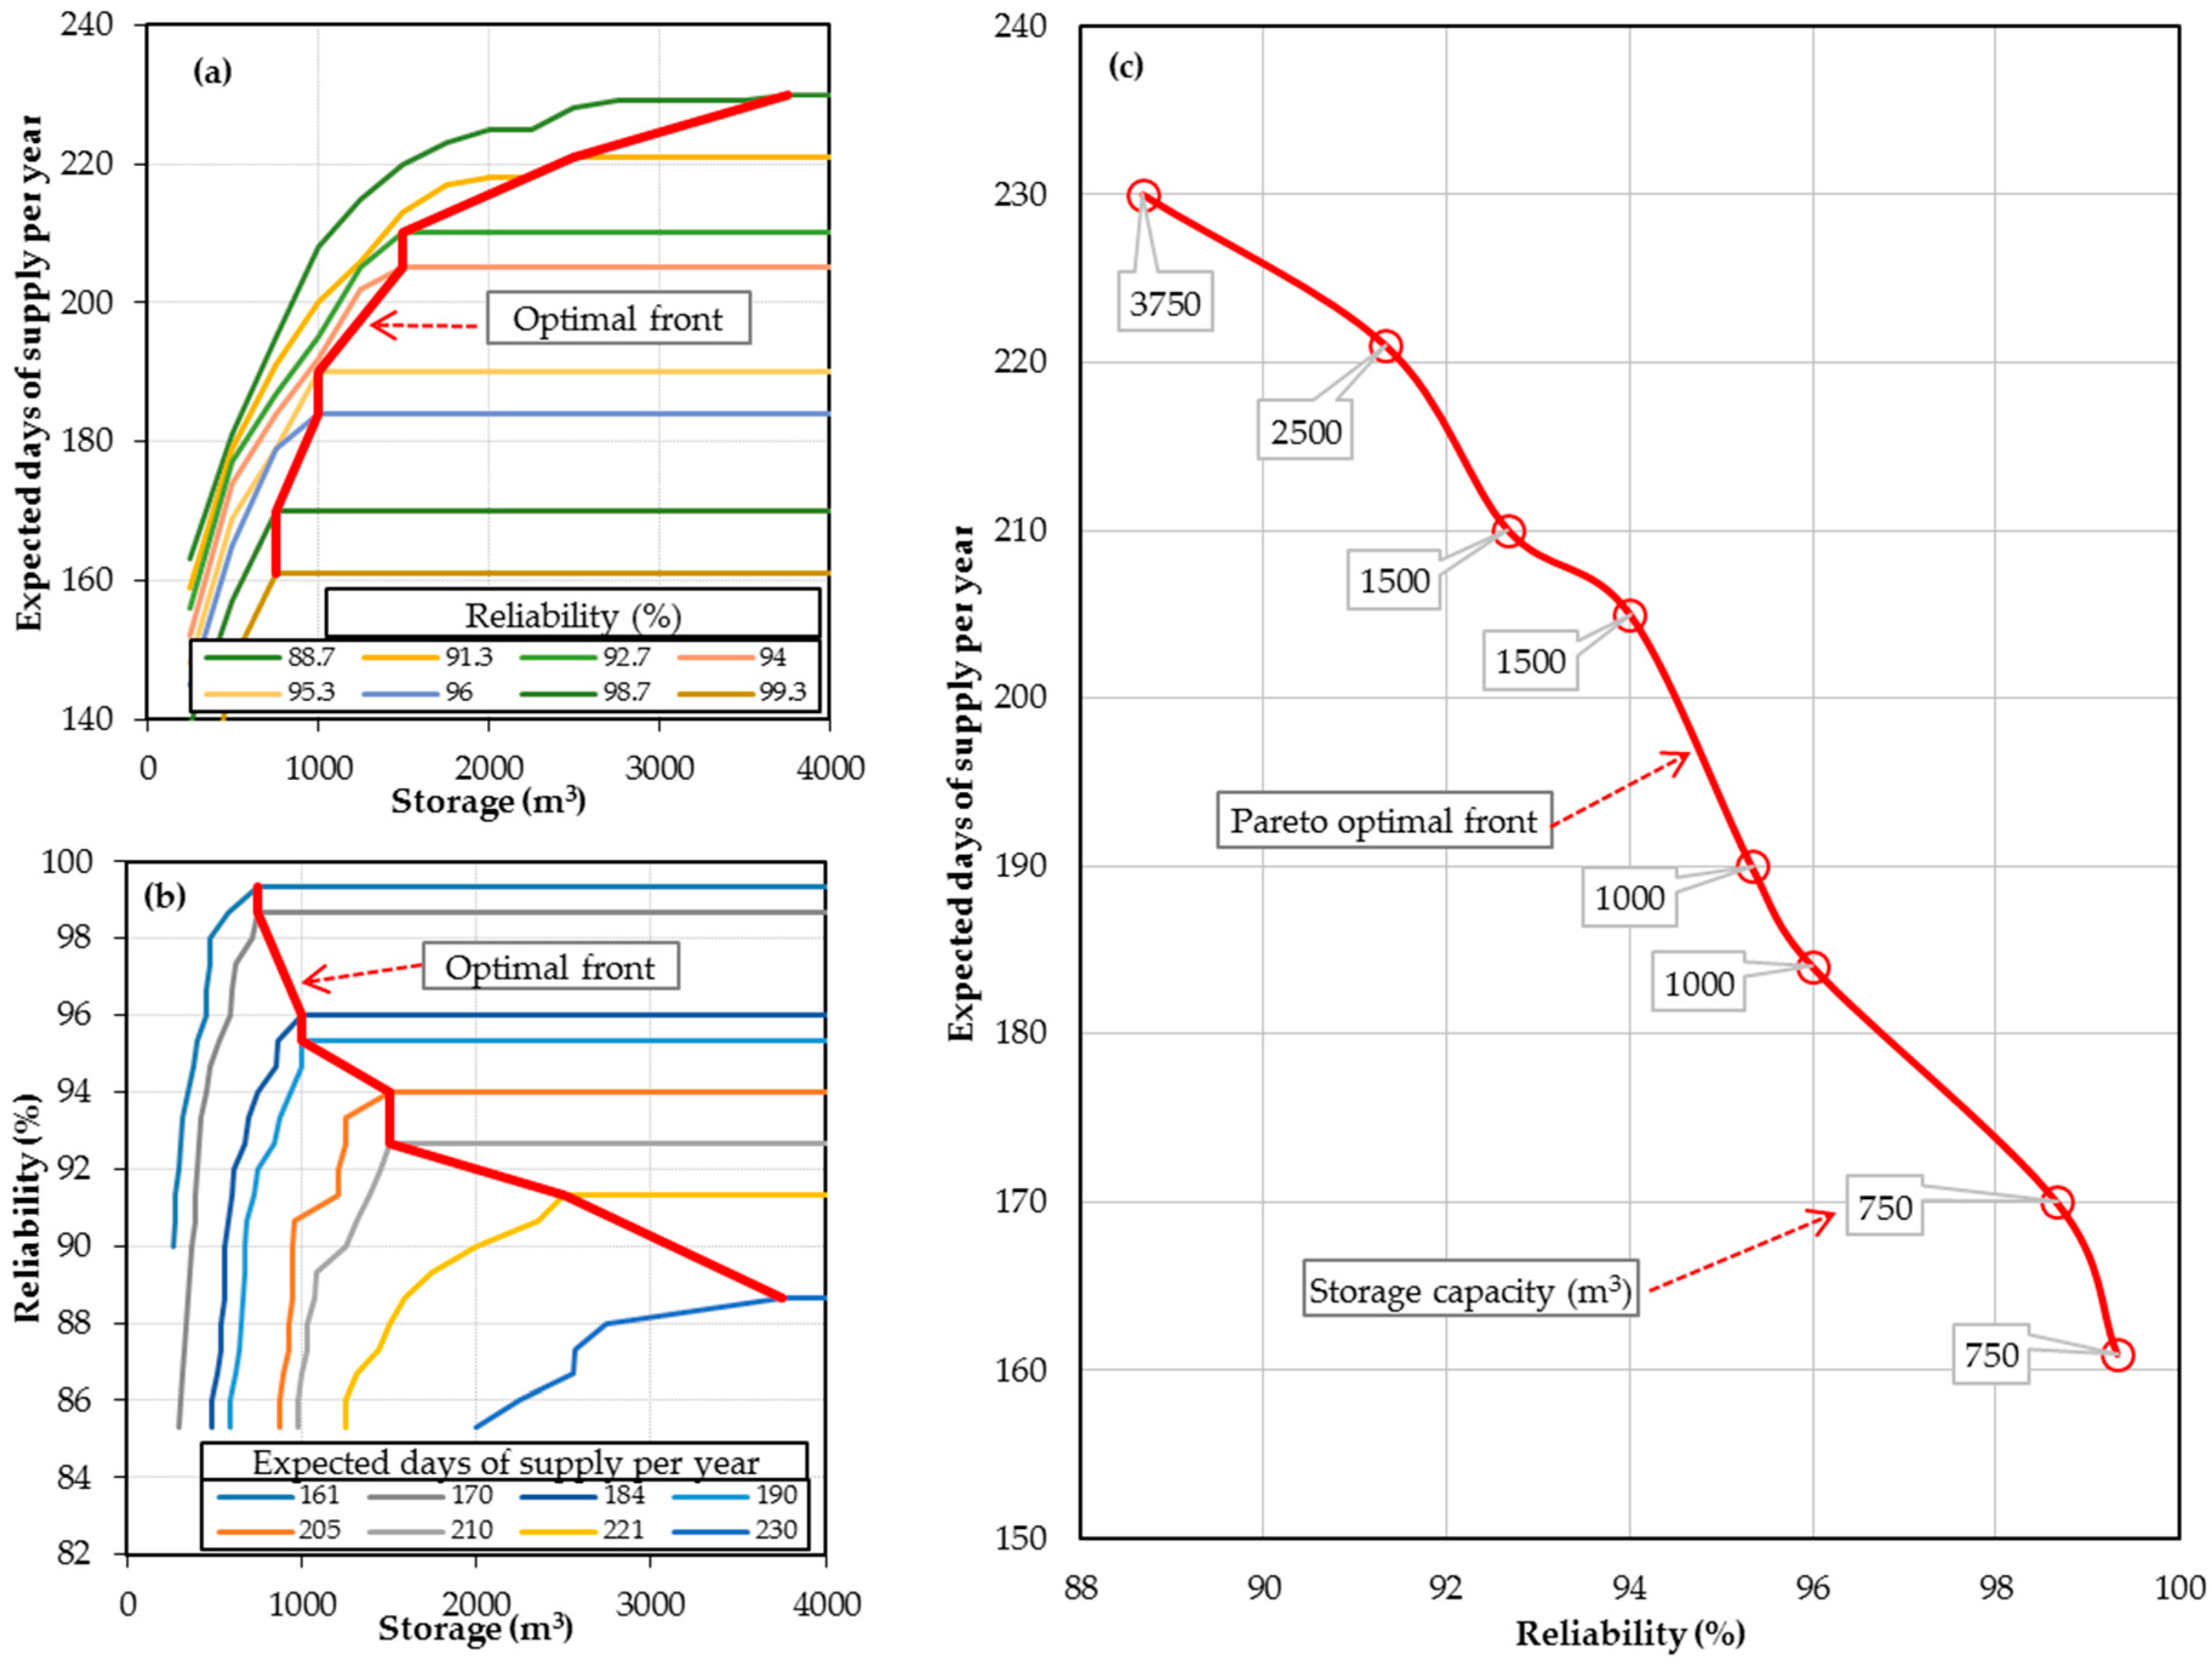
Resource optimization is a common objective of water resource design and operation including RWH [9,27,30,54]. Minimizing life-cycle cost is often the RWH optimization objective although yield maximization for set levels of reliability has also been used [25]. Yield and reliability considerations are some of the main basis for planning and operational decisions for reservoir systems in South Africa [48]. For this study, it is decided to develop guidelines that would maximize RWH yield and reliability but also enable analysis of non-optimal systems. Maximization of both yield and reliability are conflicting objectives because the yield that a system can provide at low reliabilities cannot be achieved at much higher reliabilities. The generalization therefore needed to use Pareto-optimal data relating to these two objectives. Trial simulation runs revealed that, for specified reliabilities, the yield could be increased by increasing storage up to a limit (Figure 5a). Beyond this, the yield could only be increased by reducing the reliability. Likewise, for specified yields (the number of days that demand is met in a year), the reliability could be increased by increasing storage up to a limit (Figure 5b). Beyond this, increasing reliability could only be achieved by a reduction in yield. The sets of yield, reliability and storage at which these limits occurred were concurrent and defined a Pareto front (Figure 5c) between yield and reliability. All combinations of storage, yield and reliability at the Pareto front were considered as hydrologically optimum.
Simulations were carried out for increasing tank sizes until the yield levelled off to the highest value for a range of reliabilities in order to locate the Pareto front. Probabilistic water resource systems analysis in South Africa applies reliabilities in the range 90–99% [48] and this study applied a slightly wider range of 85–99%.
Dimensionless ratios now needed to be defined from the Pareto optimal data. It was perceived that working with dimension ratios defined so as to take values not exceeding unity (1.0) could help obtain stable relationships. Generalized relationships between the supply to demand ratio (Equation (4)) and proportion of days supplied per year (Equation (5)) had been obtained for school RWH systems in South Africa [22] and these two ratios were adopted here. Although storage fraction has been defined as the ratio of storage to rainfall volume previously [26,27,28], the storage at the Pareto front was expected to relate more to the demand than to rainfall. This is because “providing water” is perceived as a more active role of storage than “receiving rainfall”. The storage ratio was therefore defined as the ratio of storage to annual demand (Equation (6)). The search for relationships between SP-r and the other two dimensionless ratios was then carried out by regression analysis. This was done for reliabilities of 85%, 90%, 95%, 98% and 99%. To incorporate reliability into the regression equations, additional regression analysis seeking to define the parameters of the regression equations as functions of reliability was carried out.
R S D =   η   A   P ¯ D t ¯
S P r = N r 365.25
R T D r = C r   D t ¯ × 365.25
where RSD is the ratio of average supply to average demand, η is the efficiency of rainwater collection into storage, A is the vertical projection of the roof area, P ¯ is the average daily rainfall, D t ¯ is the average daily demand, r is the reliability of supply, SP-r is proportion of the year fully supplied, Nr is the expected number of days that the demand is fully met in a year at reliability r, RTD-r is the ratio of storage capacity at reliability r to the volume of annual demand, and Cr is the storage capacity that is optimal at reliability r.
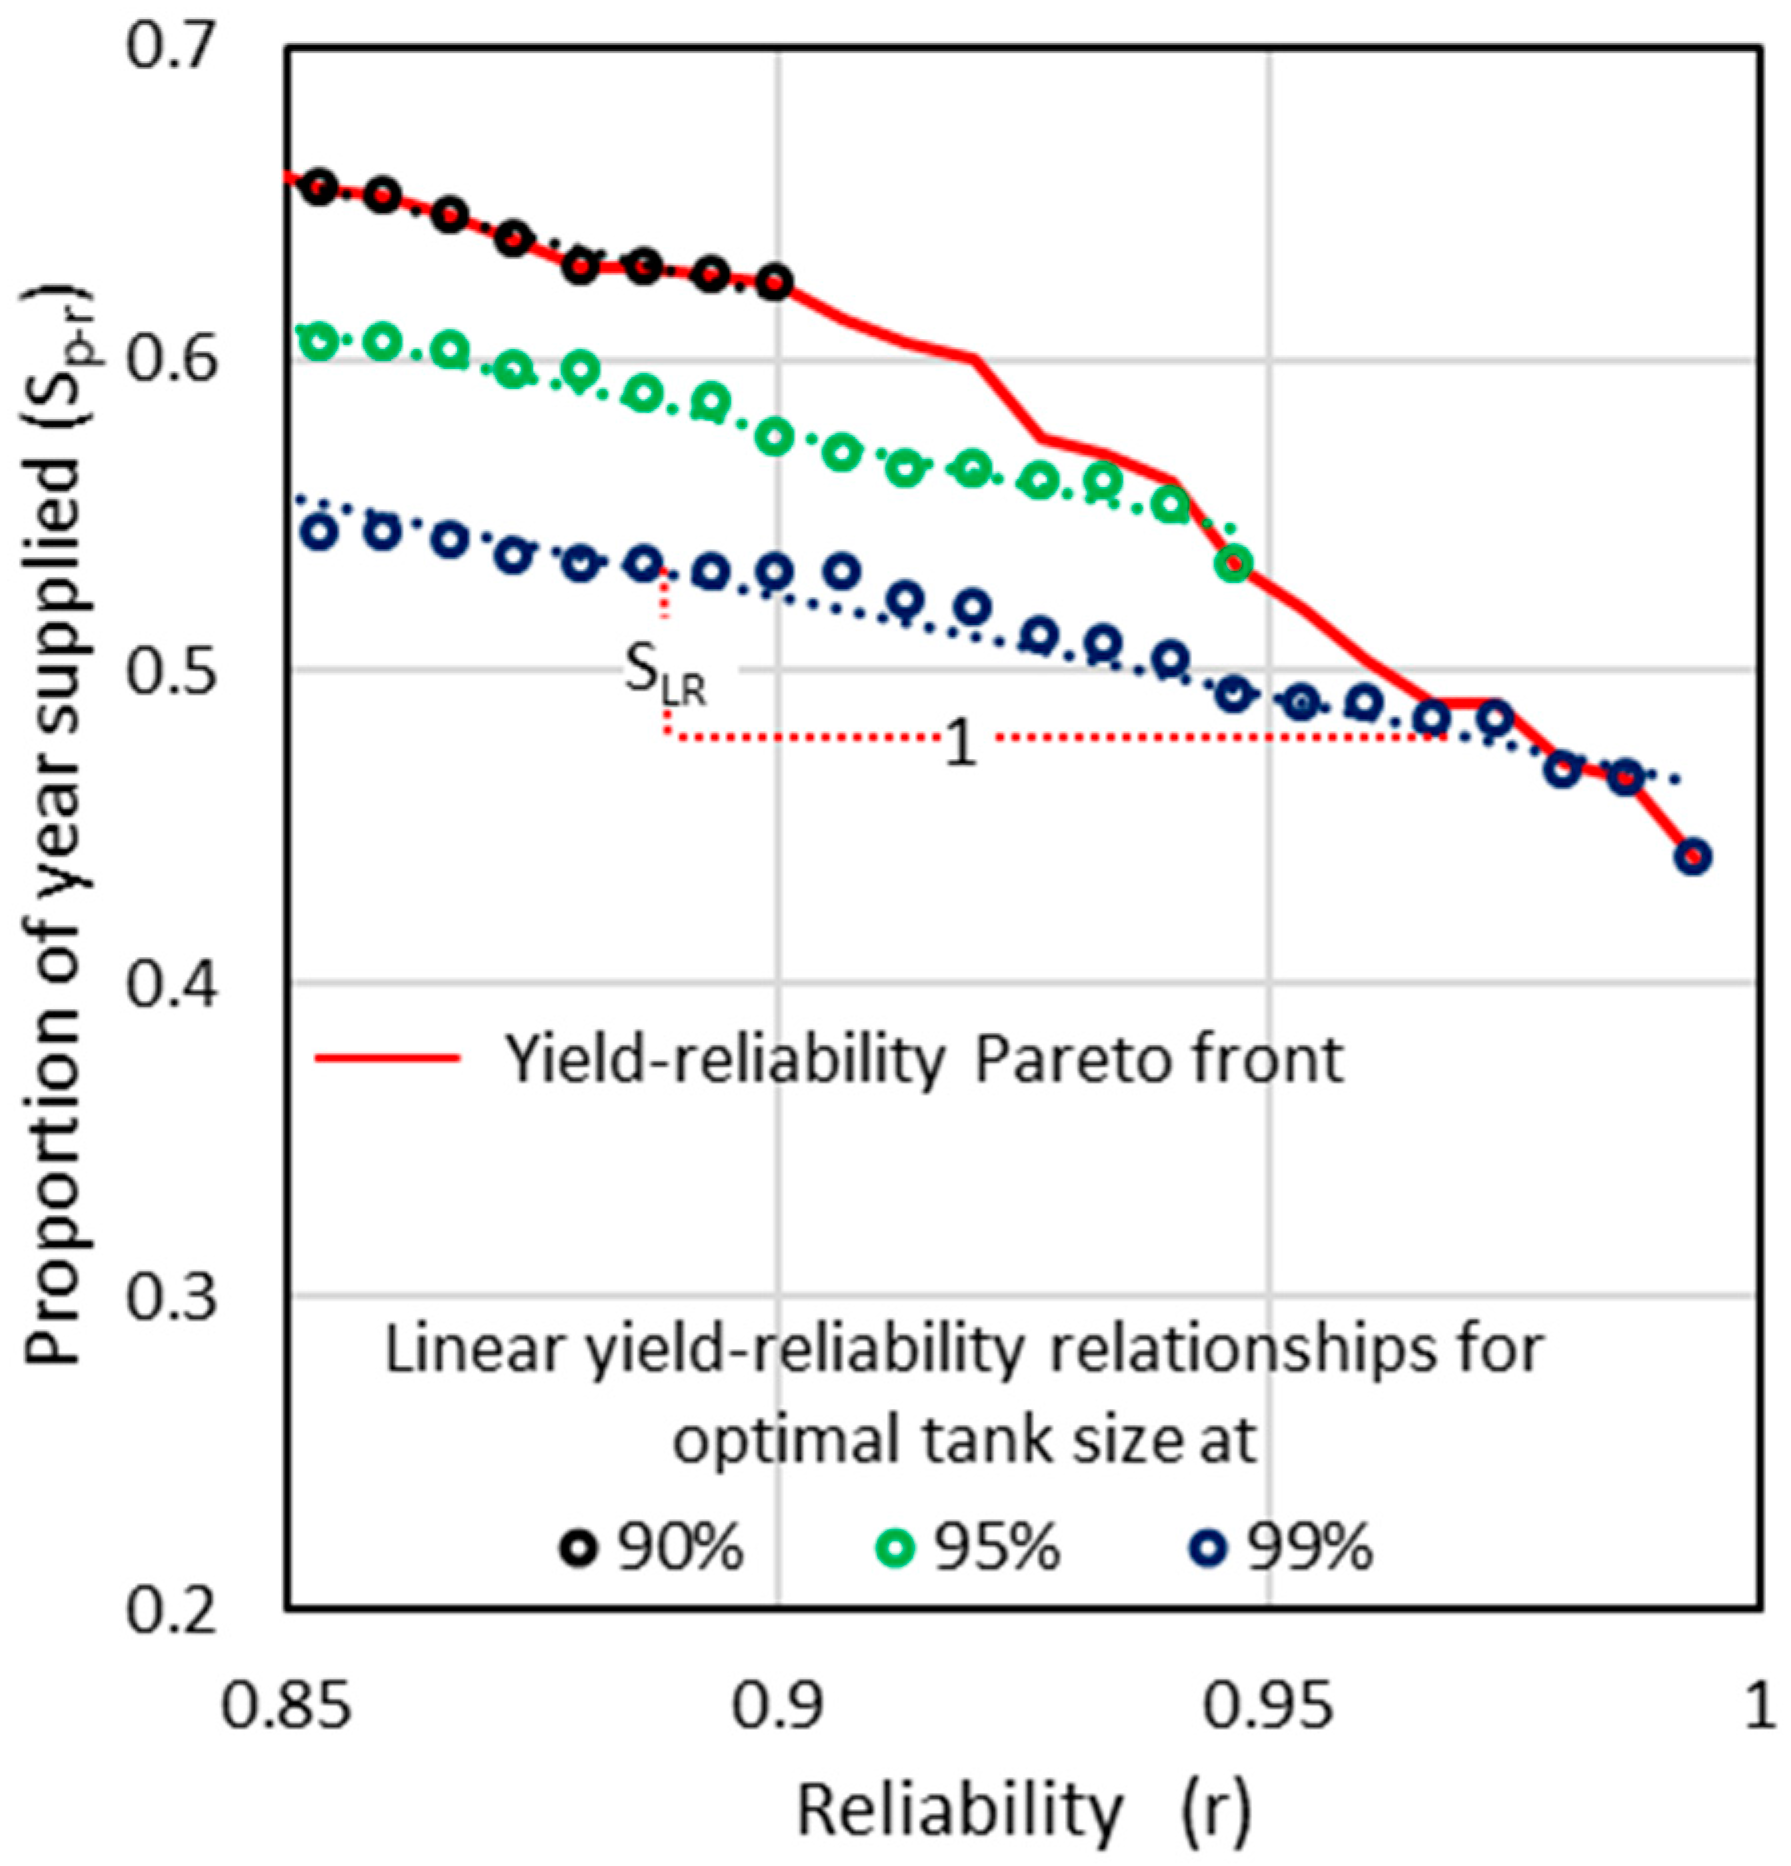
The generalization analysis described so far used data obtained at the Pareto front and would therefore be applicable to hydrologically optimal systems. In reality, a potential RHW user may be constrained financially [6,21], by availability of space [9] and by other factors. Furthermore, even if an optimal system were initially installed, changes in demand or supply would render it non-optimal. There was therefore the need to formulate generalization for the analysis of hydrologically non-optimal systems. Graphical plots between yield and reliability for the 85–99% range of reliabilities were found to be approximately linear for a given storage (Figure 6) and these slopes generally increased as the proportion of year supplied (SP-r) increased.
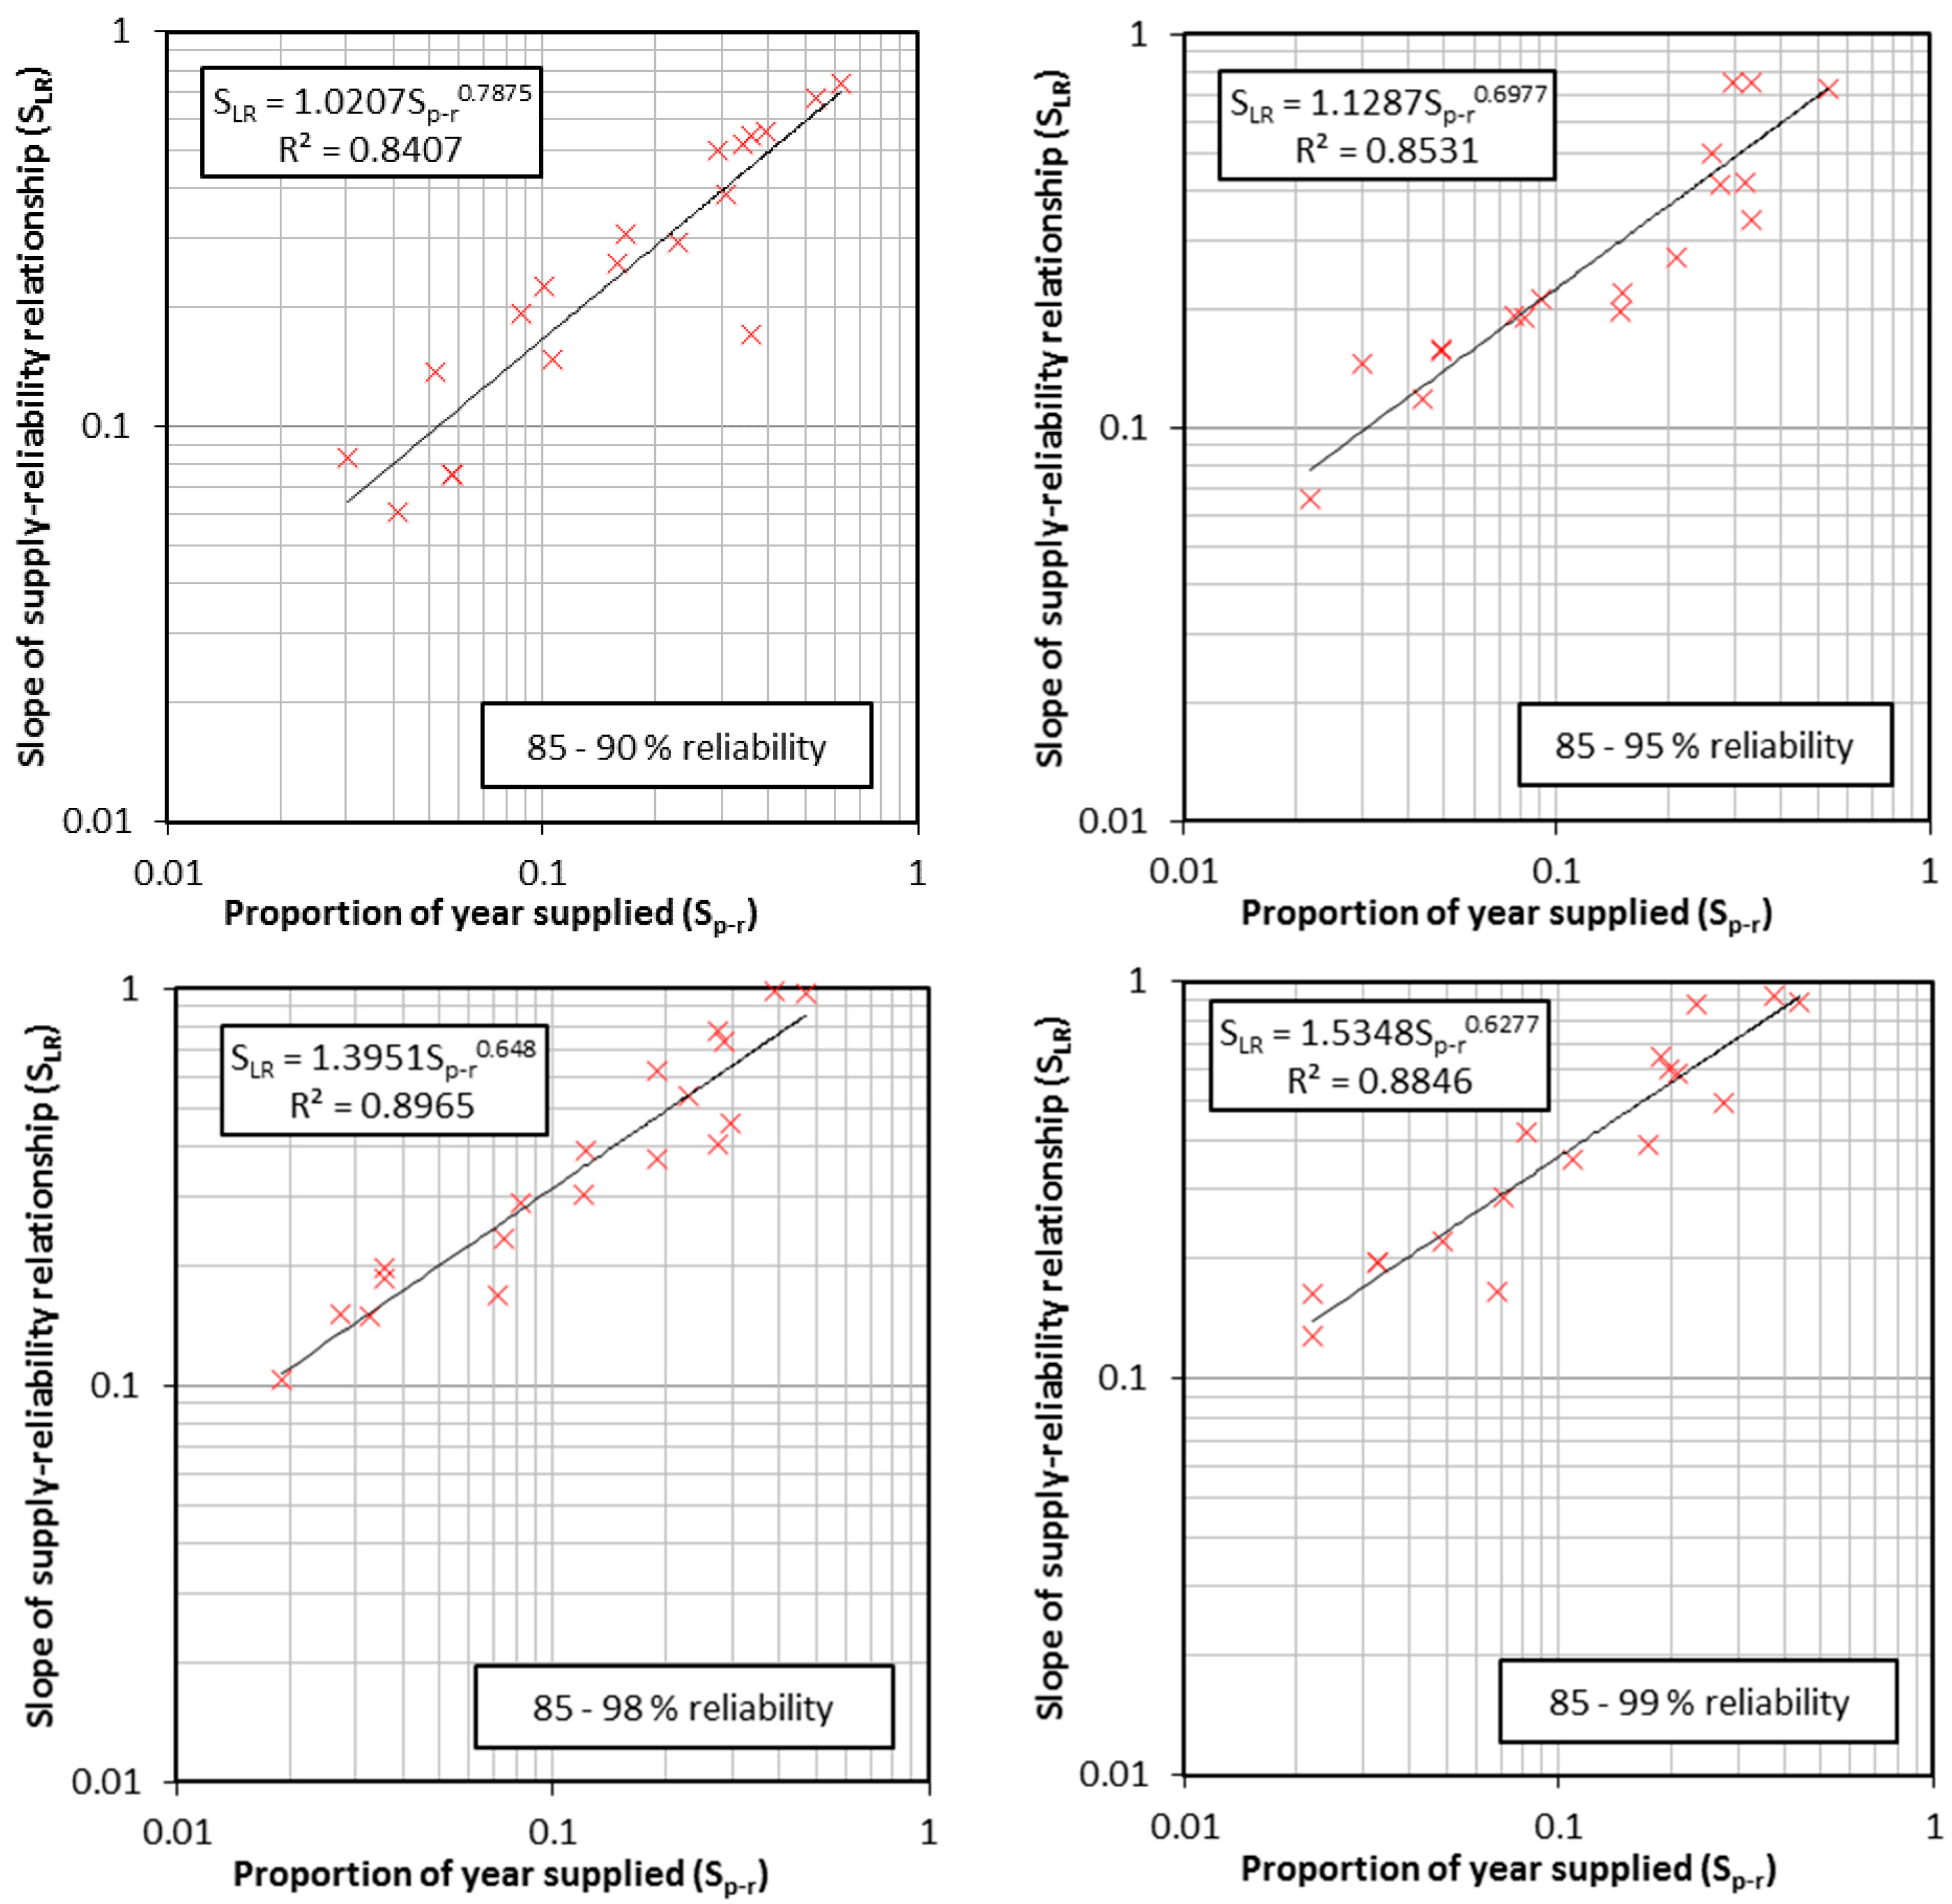
The search for a relationship between the slope of this line (SLR in Figure 6) and SP-r was then carried out, as this would extend the generalization to the non-optimal space below the Pareto front. Slopes SLR were therefore obtained for four ranges of reliability: 85–90%, 85–95%, 85–98% and 85–99% for the simulation runs of all 19 shopping centres using least squares fitting. Regression analysis between SLR and SP-r was used to search for a generalized relationship.

3. Results

3.1. Simulation Analysis

Table 3 presents the results of the hydrologically optimum combinations of storage and yield for five levels of reliability. At 85% reliability, the number of days of full supply per year varies from 12 to 243 days, while the storage capacities range from 130 to 32,000 m3. At 99% reliability, the respective ranges are 6–161 days per year and 90–6000 m3. From a hydrological perspective, RWH could be a viable source of water for some but not all the shopping centres. This viability could however be constrained by the high cost and space required to install large storages.

3.2. Generalized Storage–Yield–Reliability Relationships

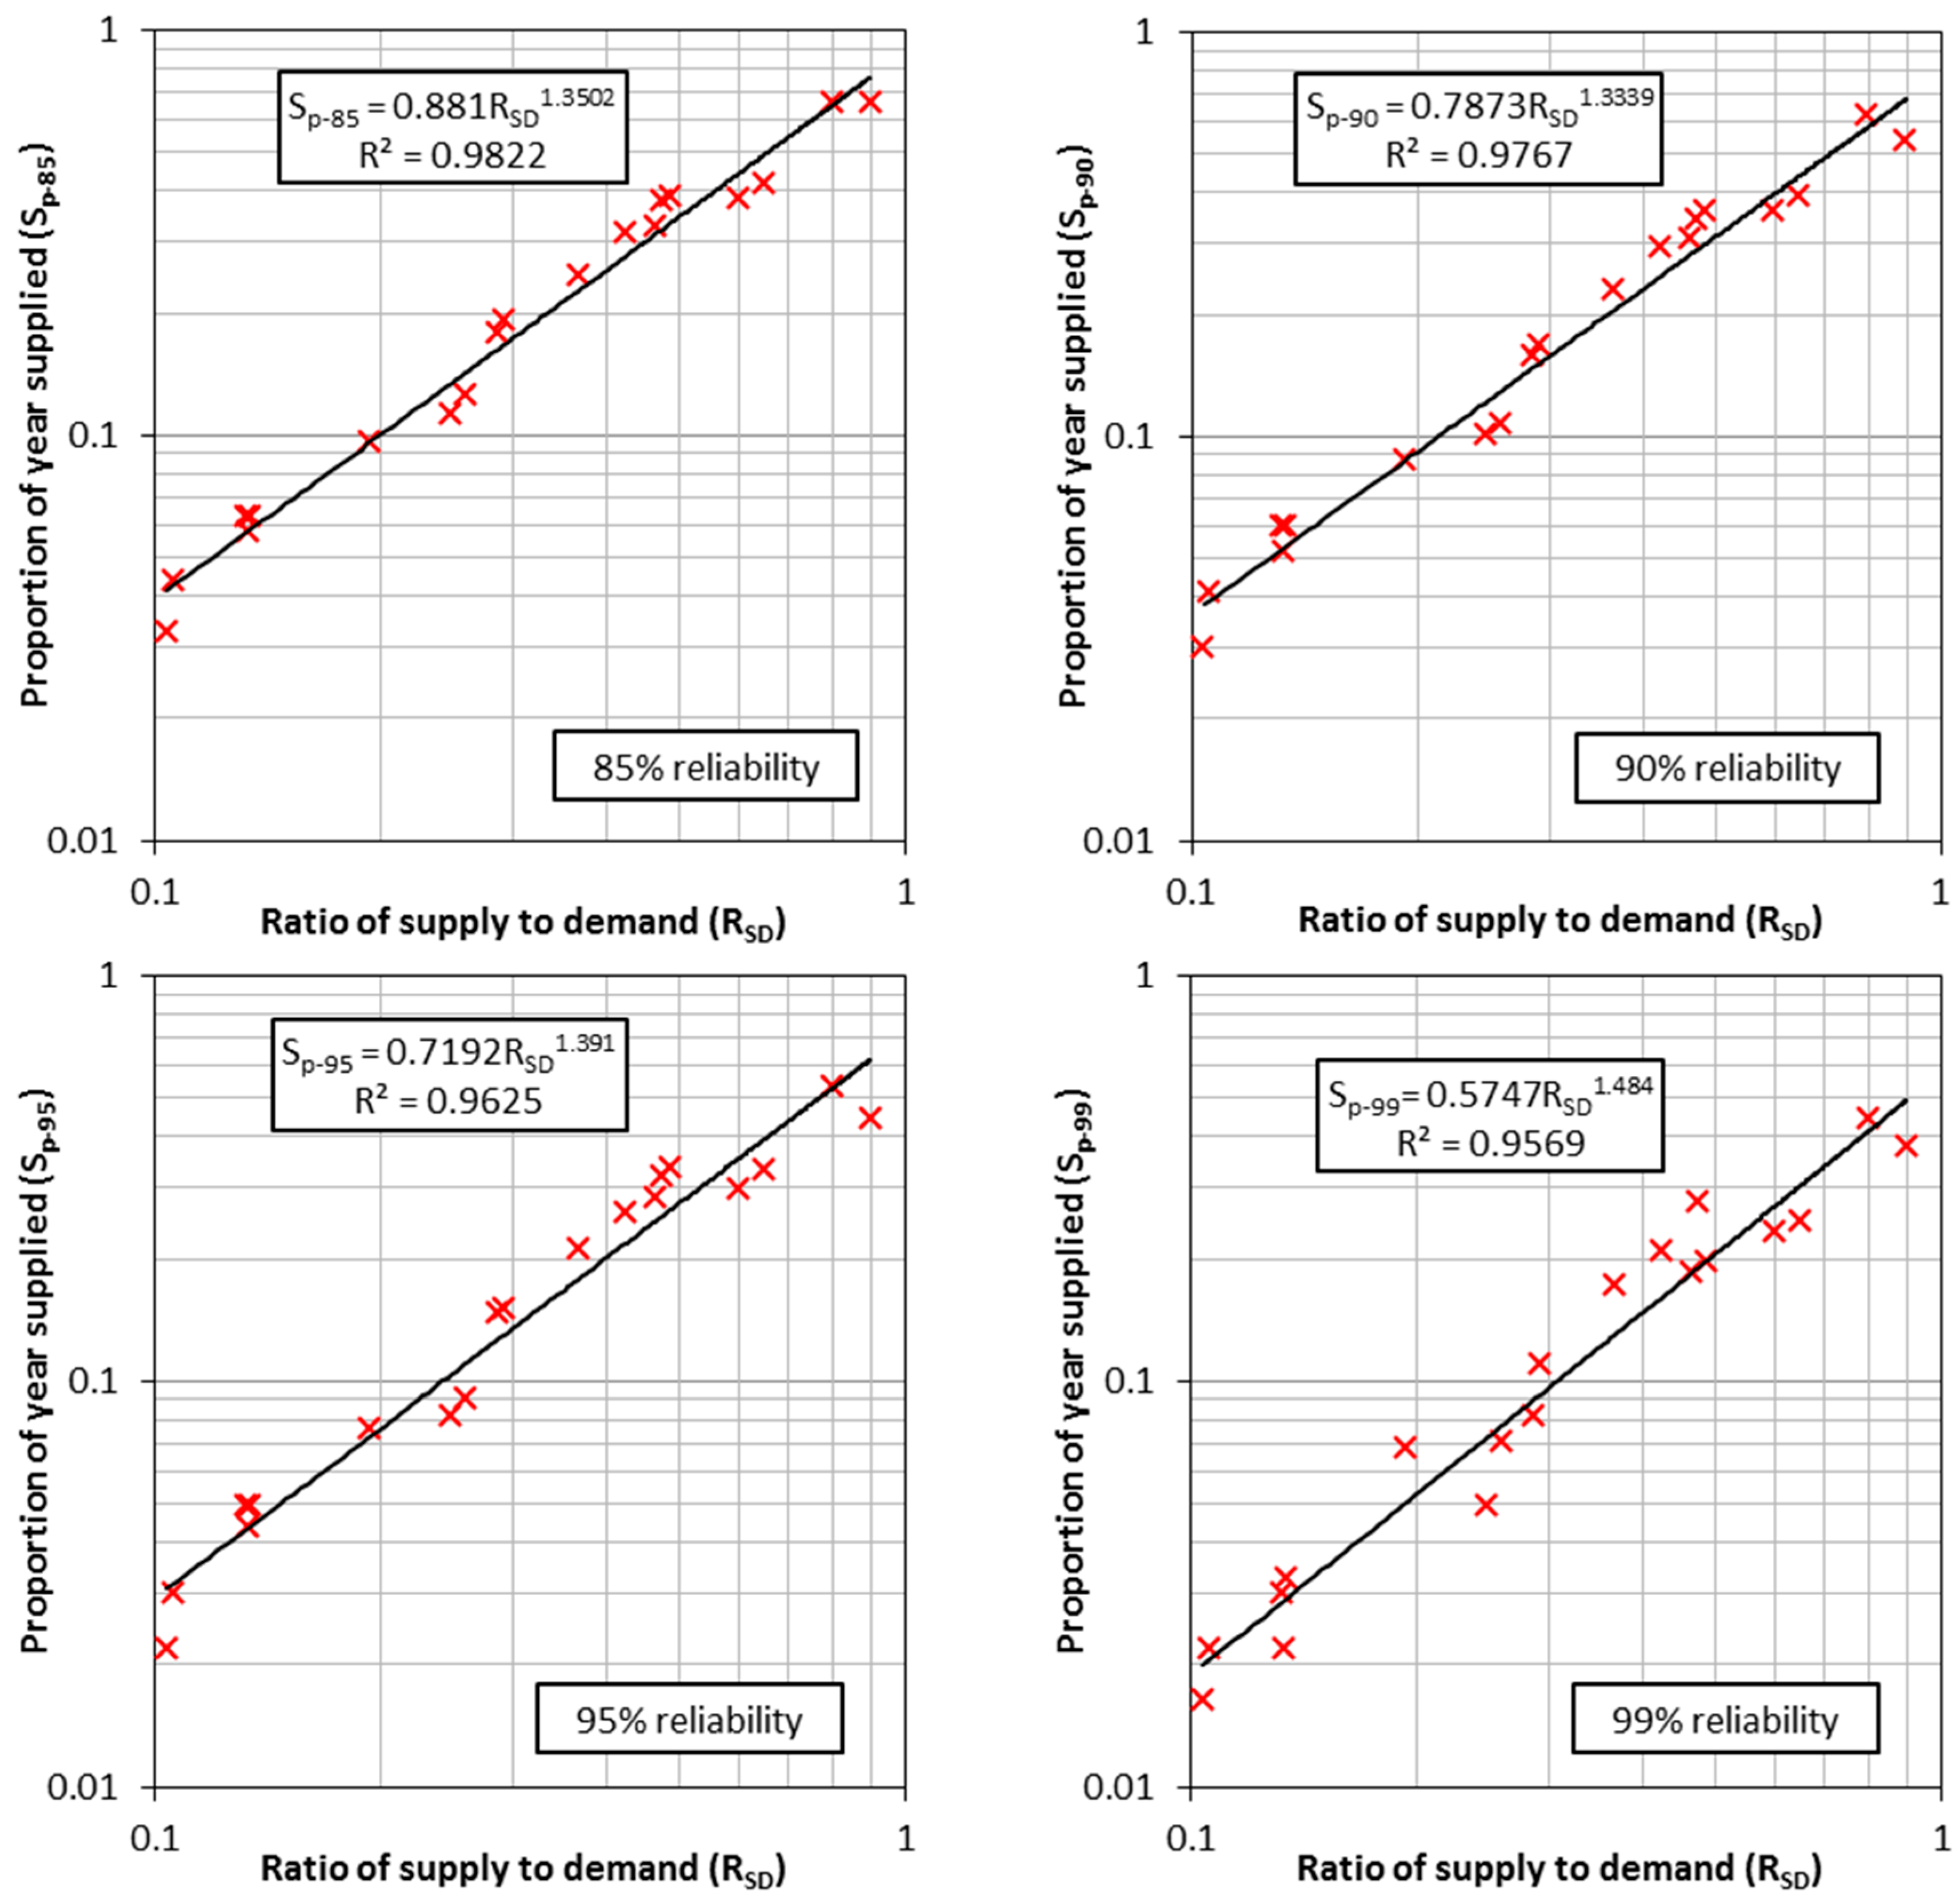
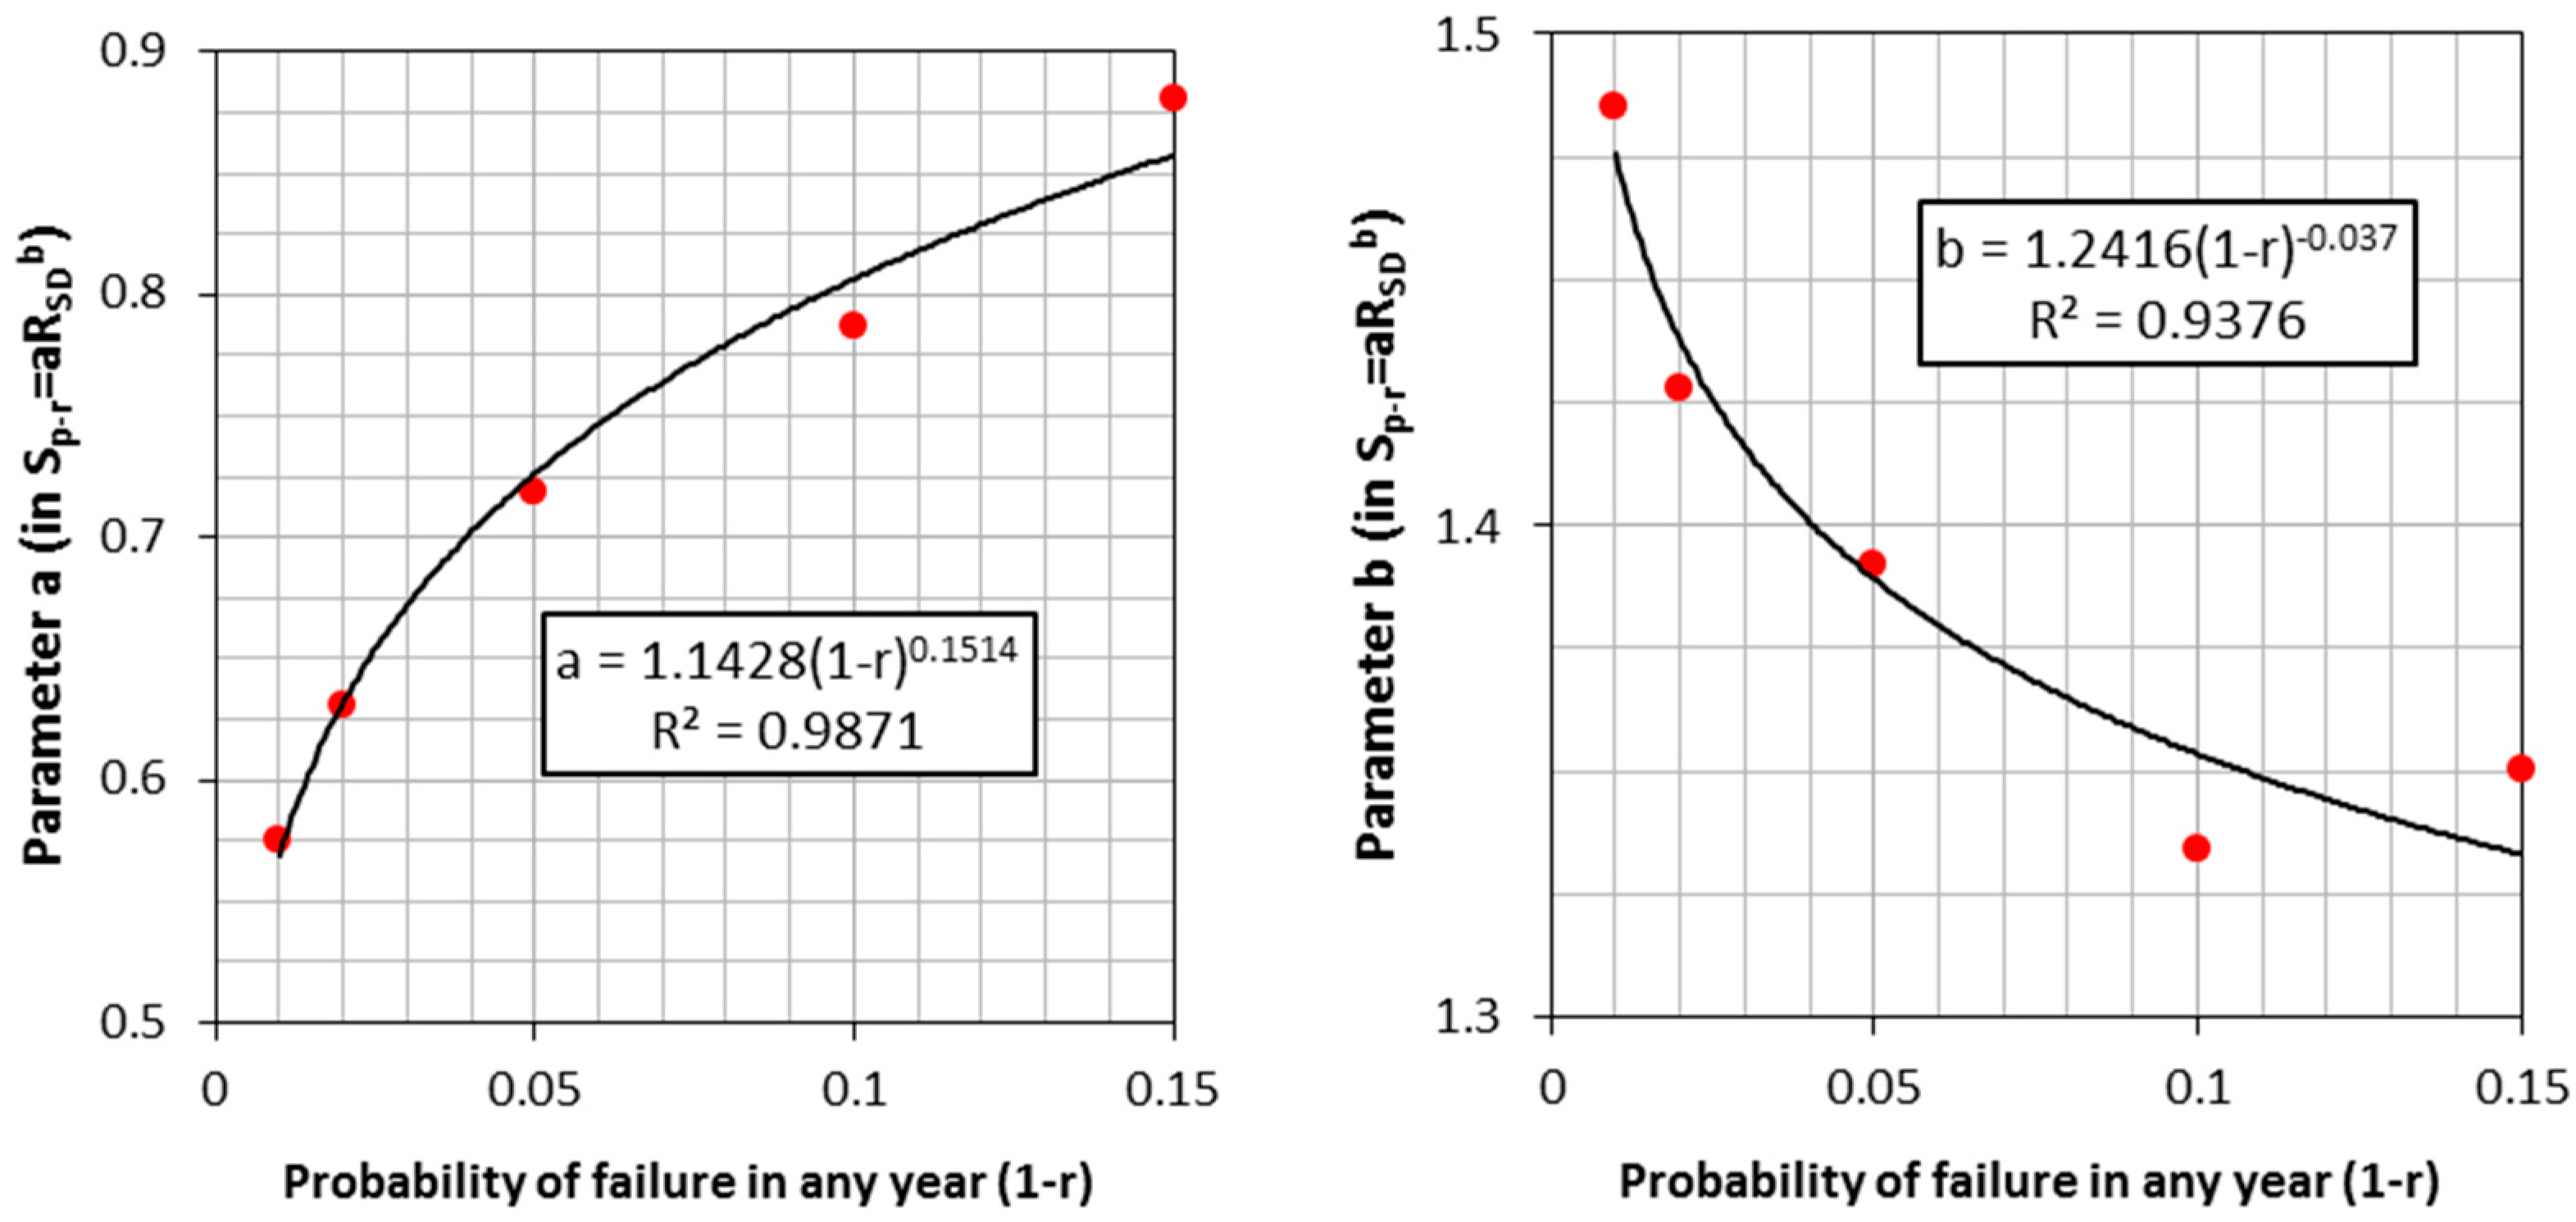
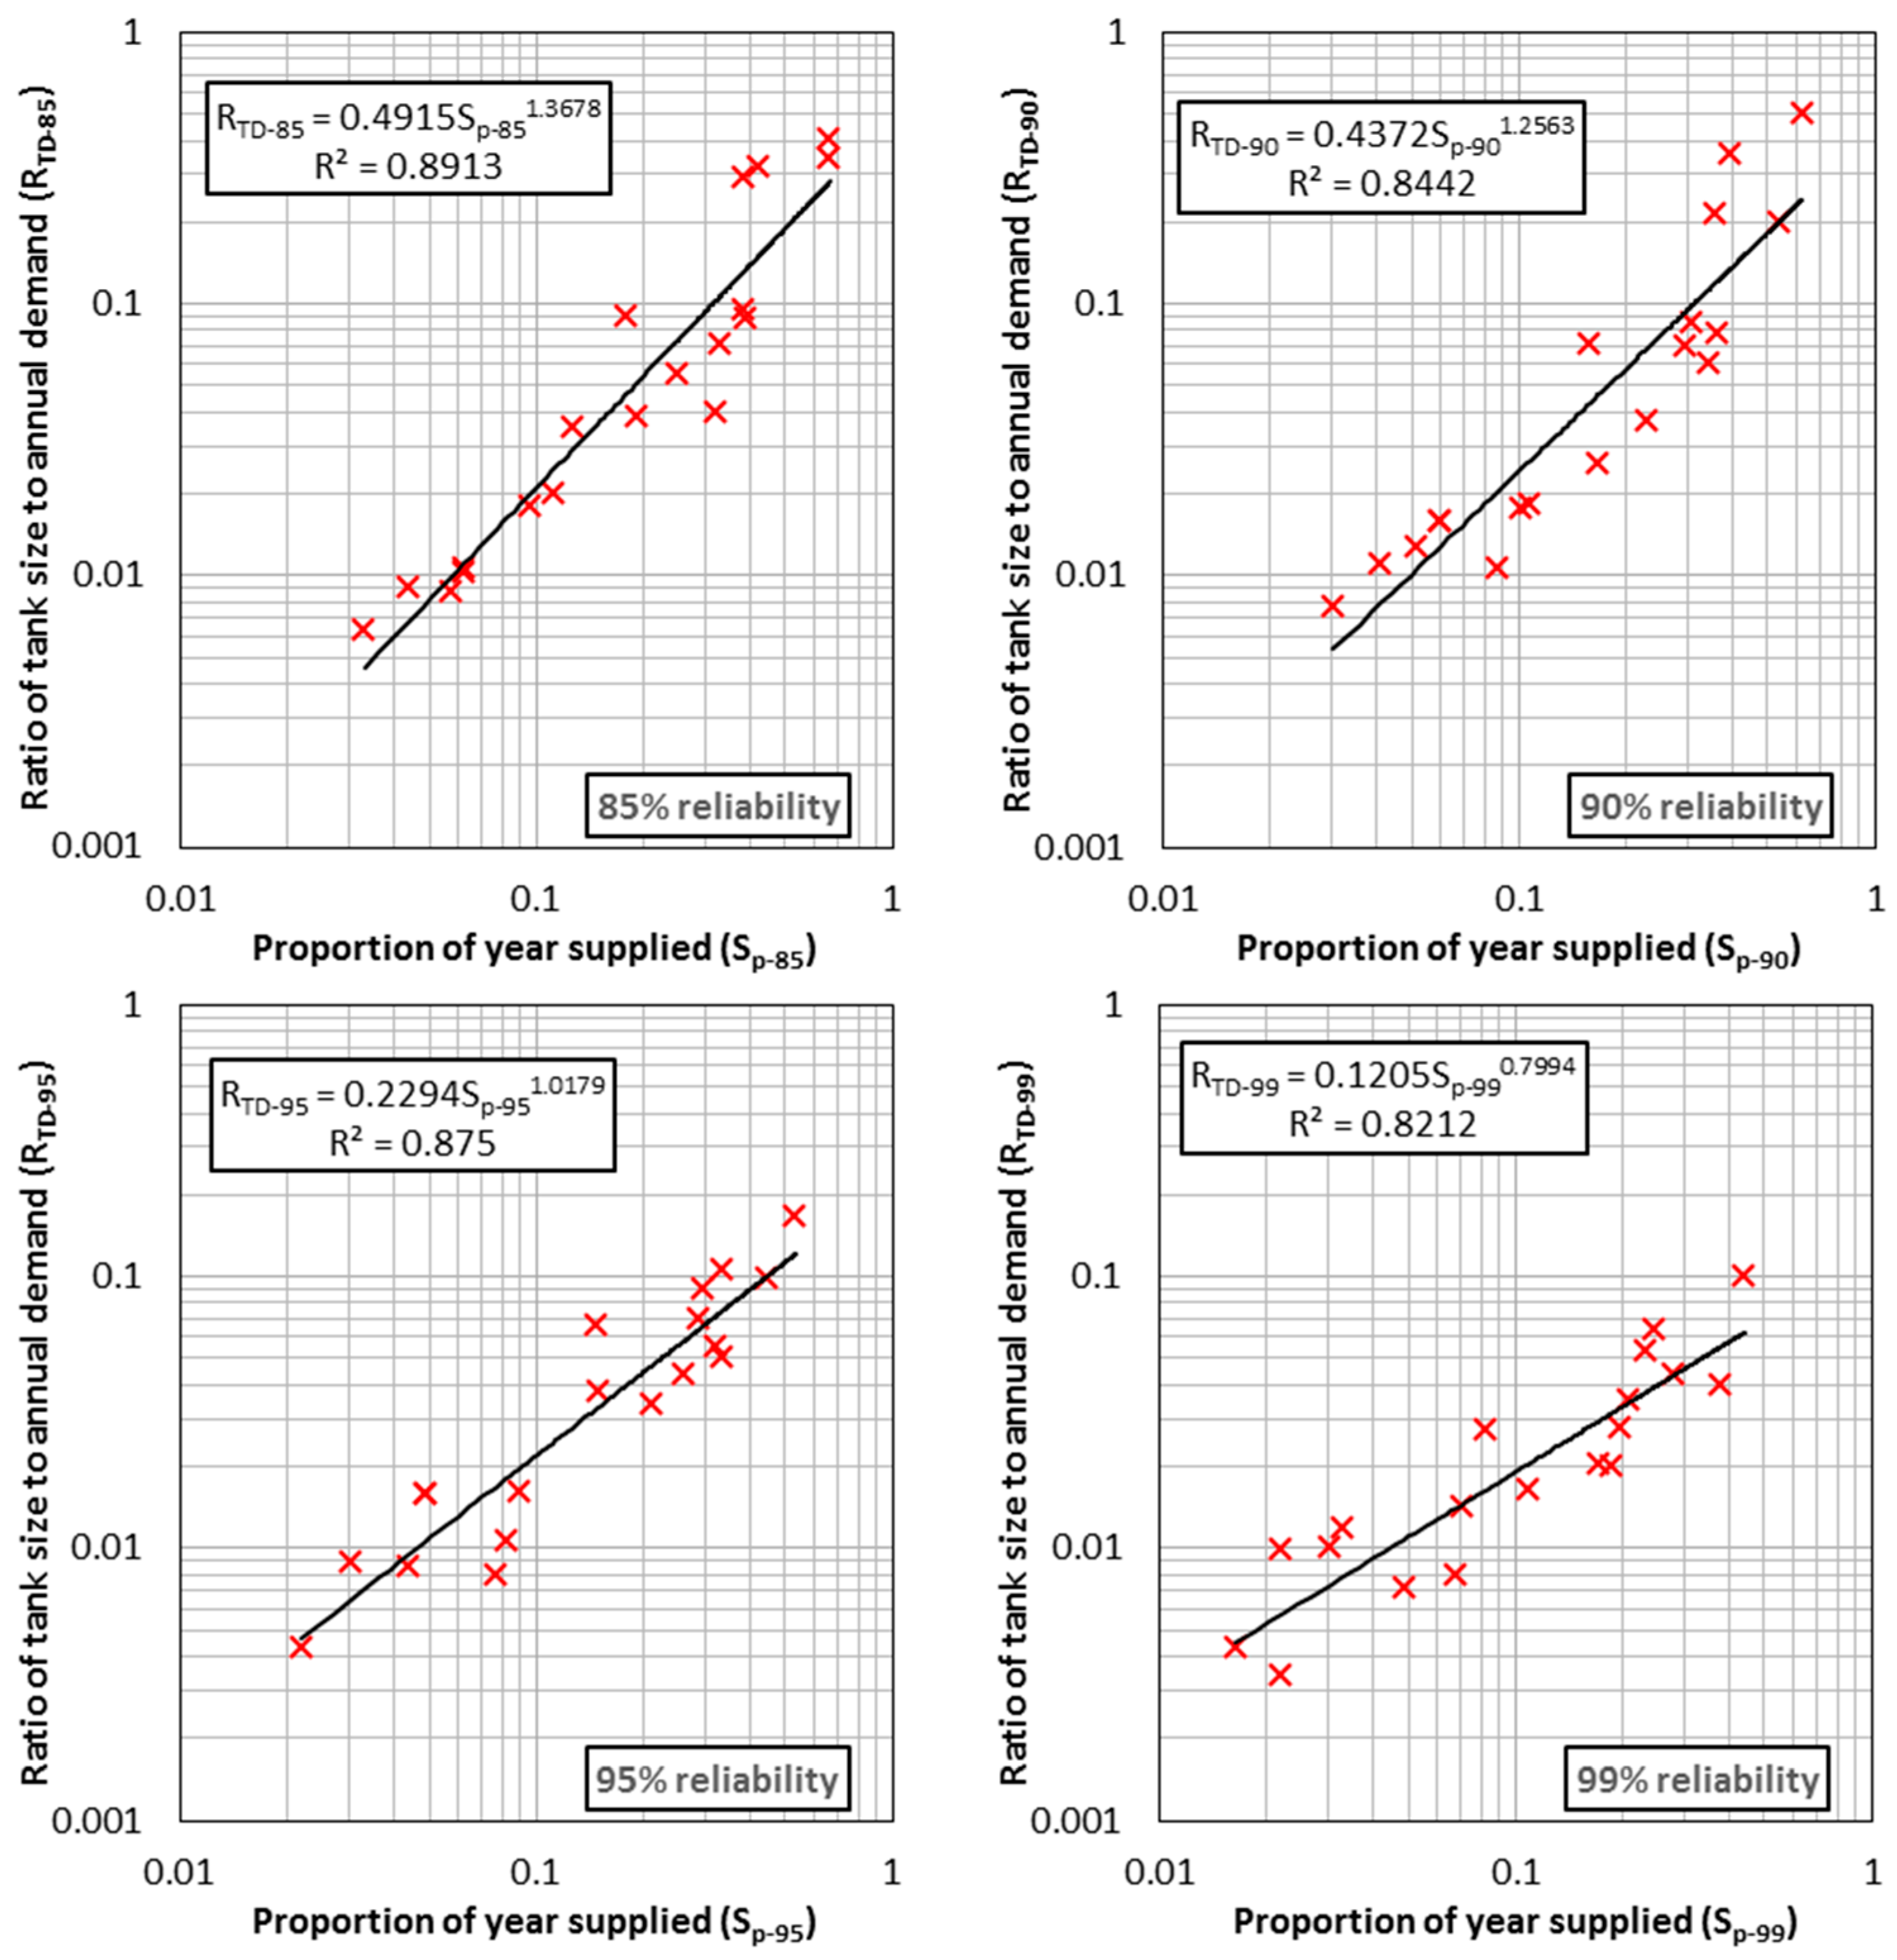
The non-linear power law model was found to fit the relationships between RSD and SP-r best at the five reliabilities of 85%, 90%, 95%, 98% and 99%. Figure 7 shows the fits for four of these. Figure 8 shows the relationships between the parameters of the power law models and reliability. These models are themselves highly correlated power law models. Figure 9 and Figure 10 show the respective relationships between SP-r and RTD-r and the parameters of the power models with reliability. The correlations between SP-r and RTD-r were lower than those between RSD and SP-r but they were still considered satisfactory. The generalized models of the RWH system could therefore be summarized as:
S p r = a R S D b   a = 1.1428 ( 1 r ) 0.1514   b = 1.2416 ( 1 r ) 0.037   0.85 r 0.99
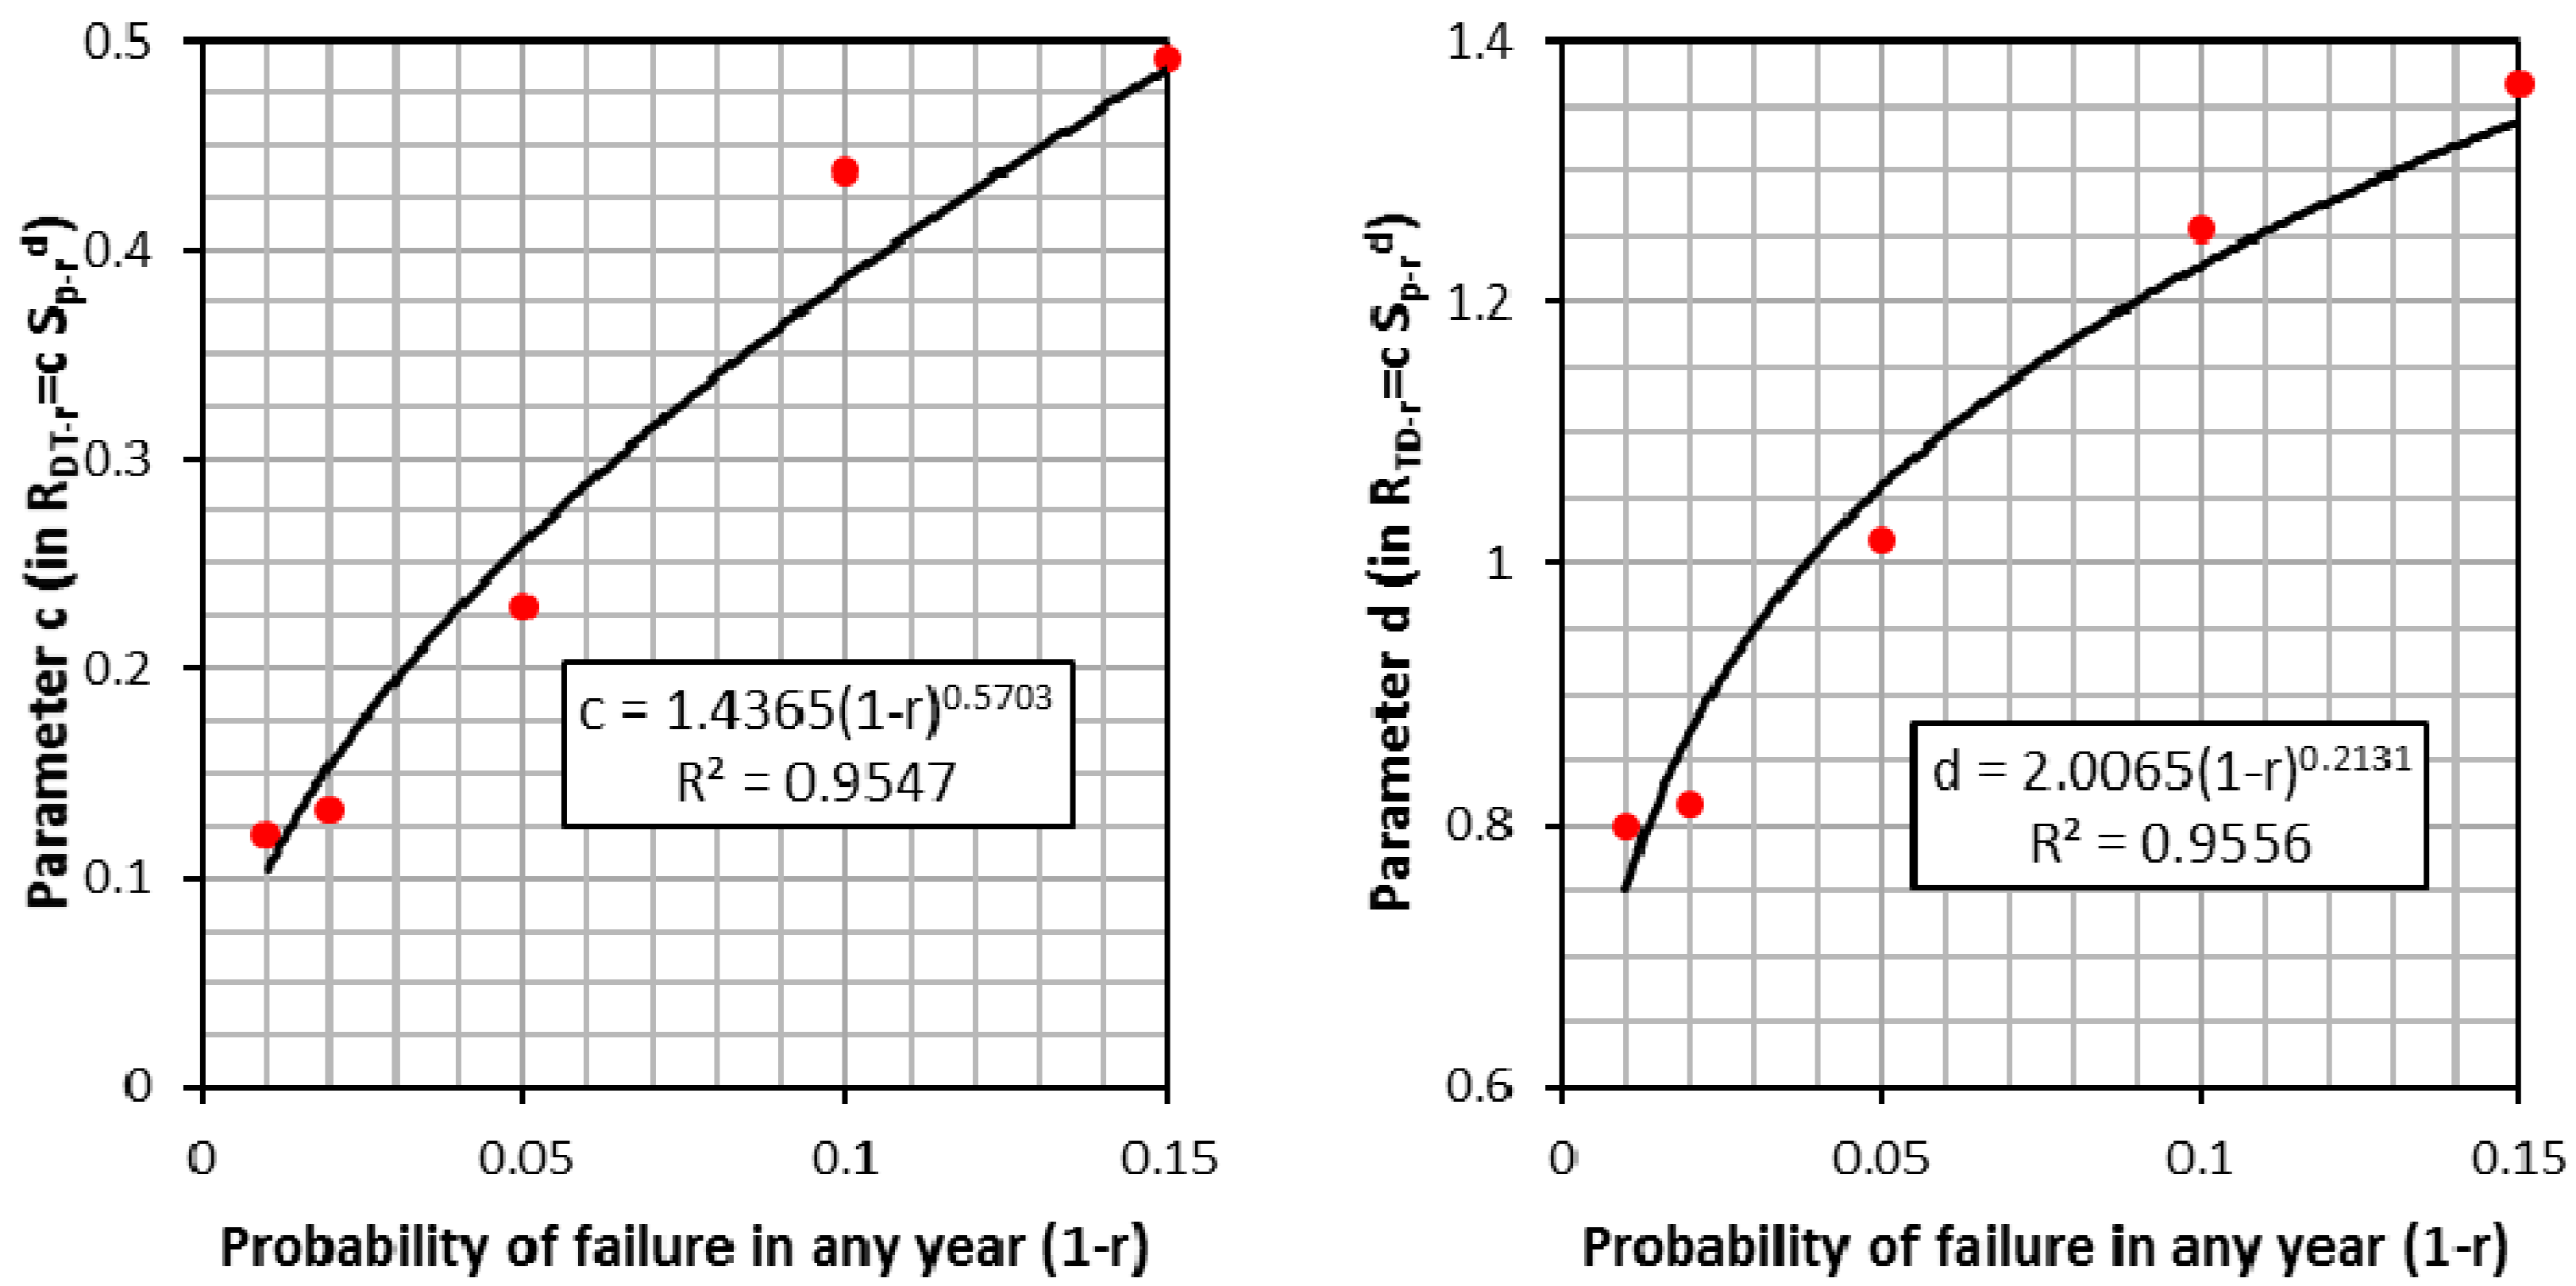
R T D r = c S p r d   c = 1.4365 ( 1 r ) 0.5703   d = 2.0065 ( 1 r ) 0.2131   0.85 r 0.99
where SP-r is proportion of the year fully supplied at reliability r, RSD is the ratio of average supply to average demand, RTD-r is the ratio of storage capacity at reliability r to the volume of annual demand, a and c are coefficients, and b and d are indices of the regression models.
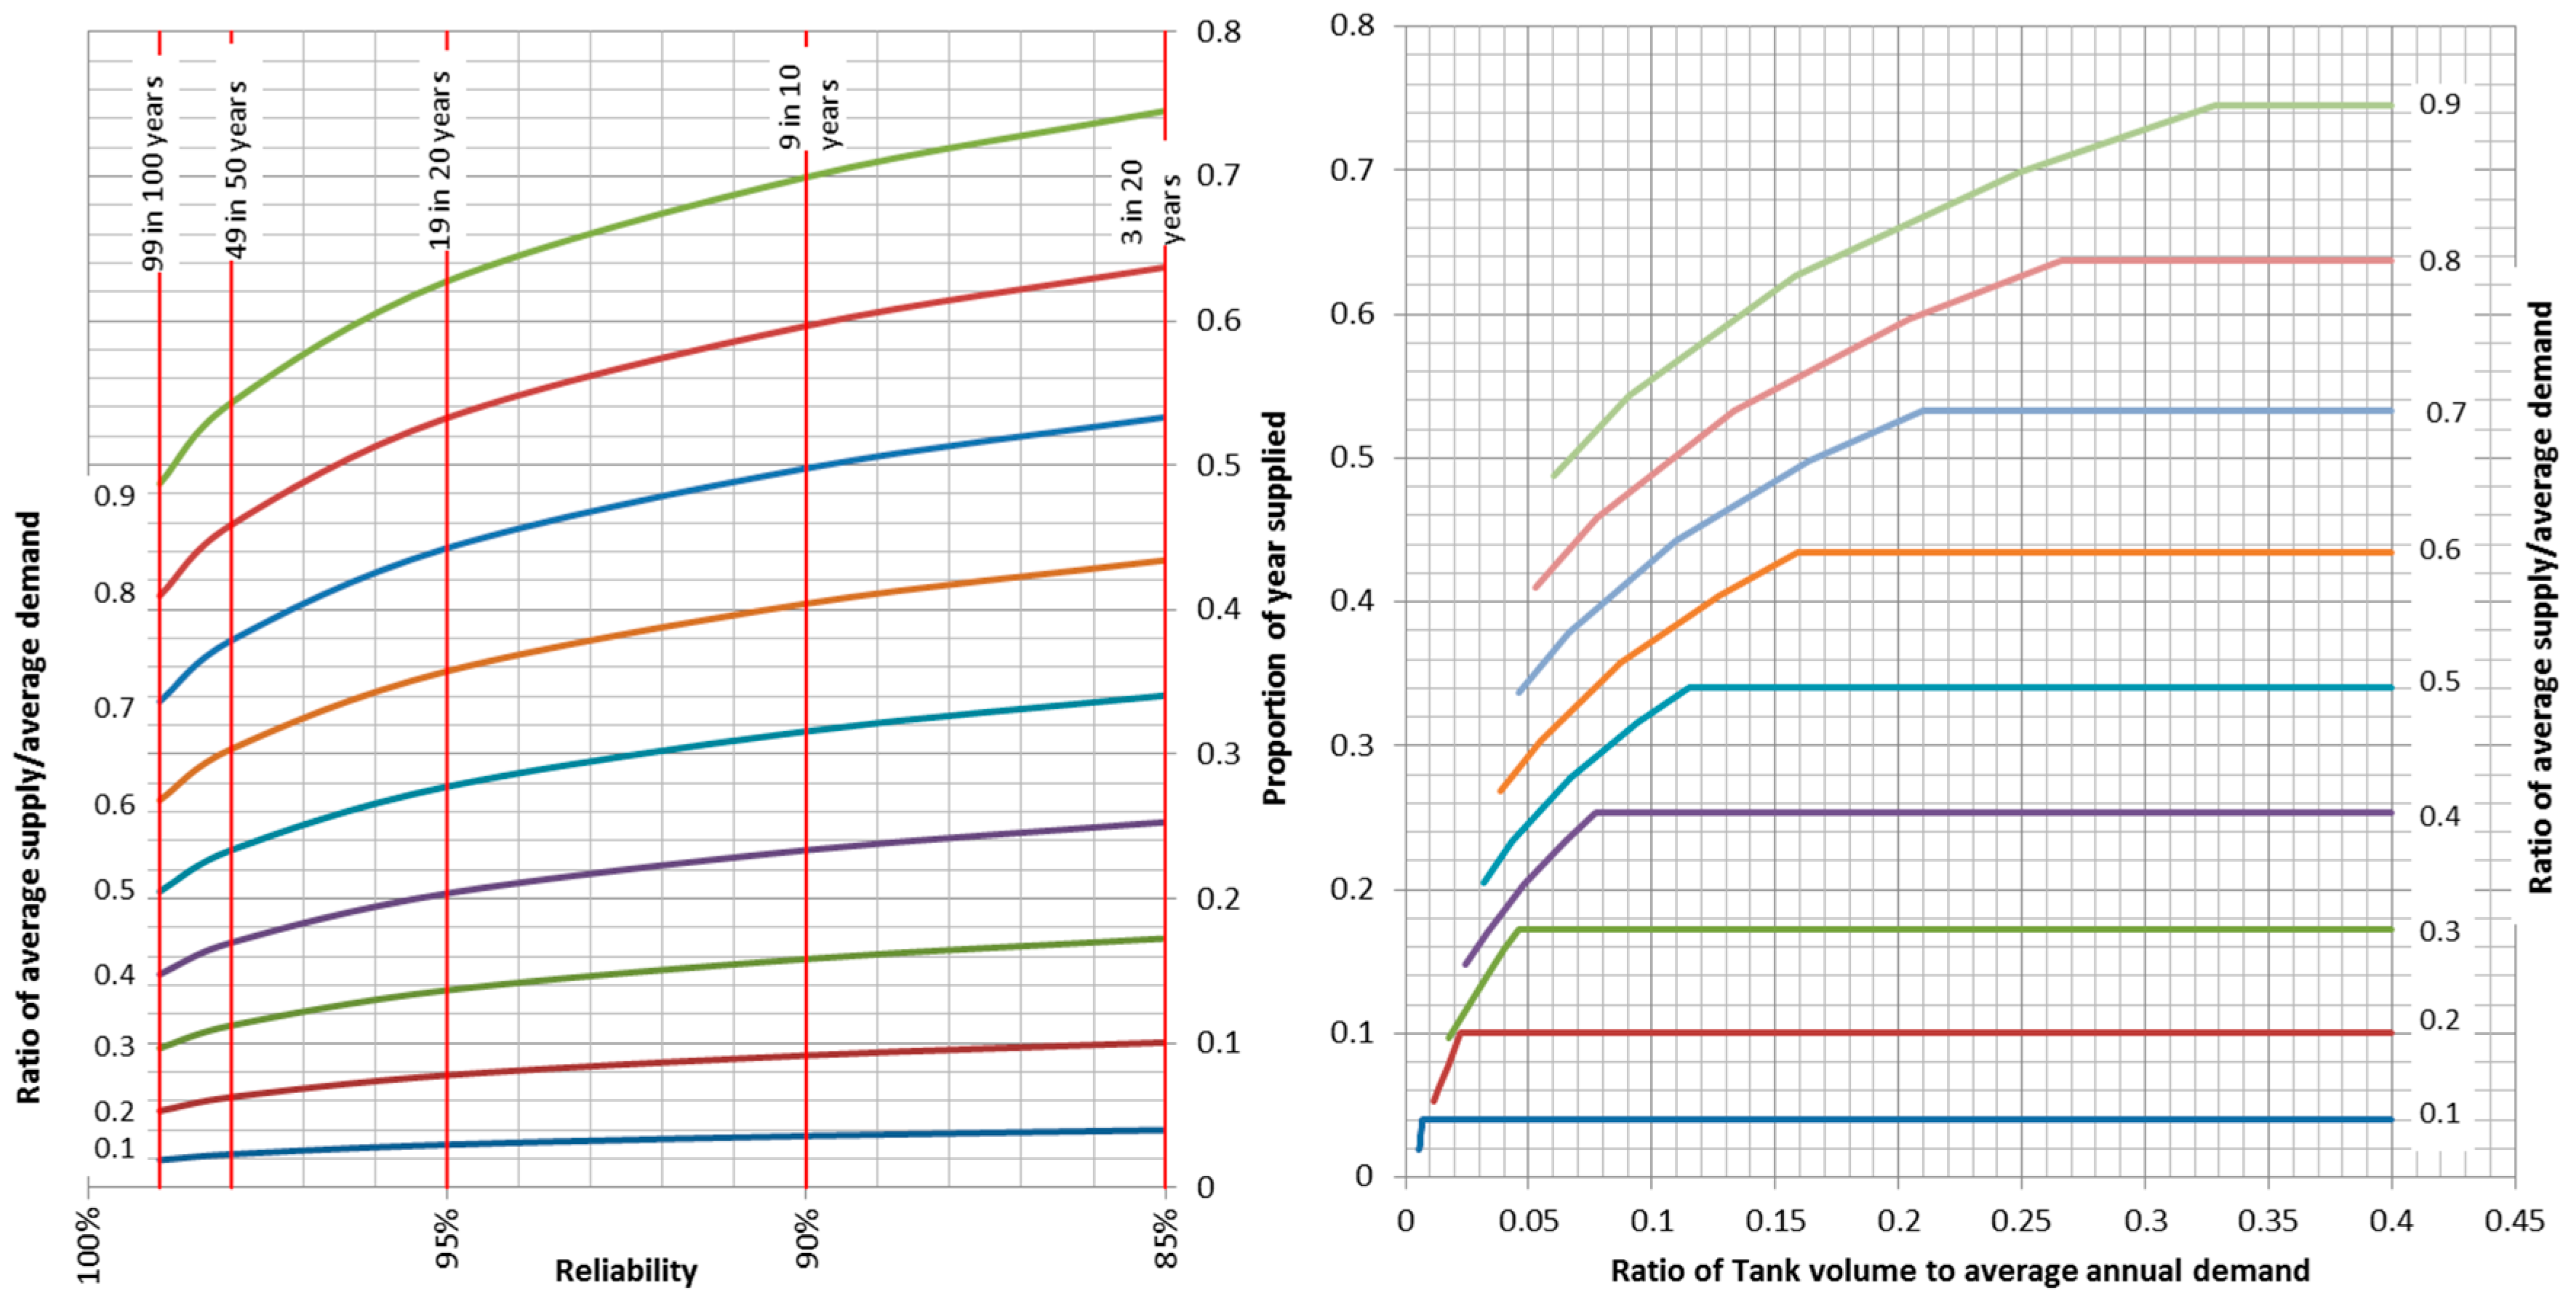
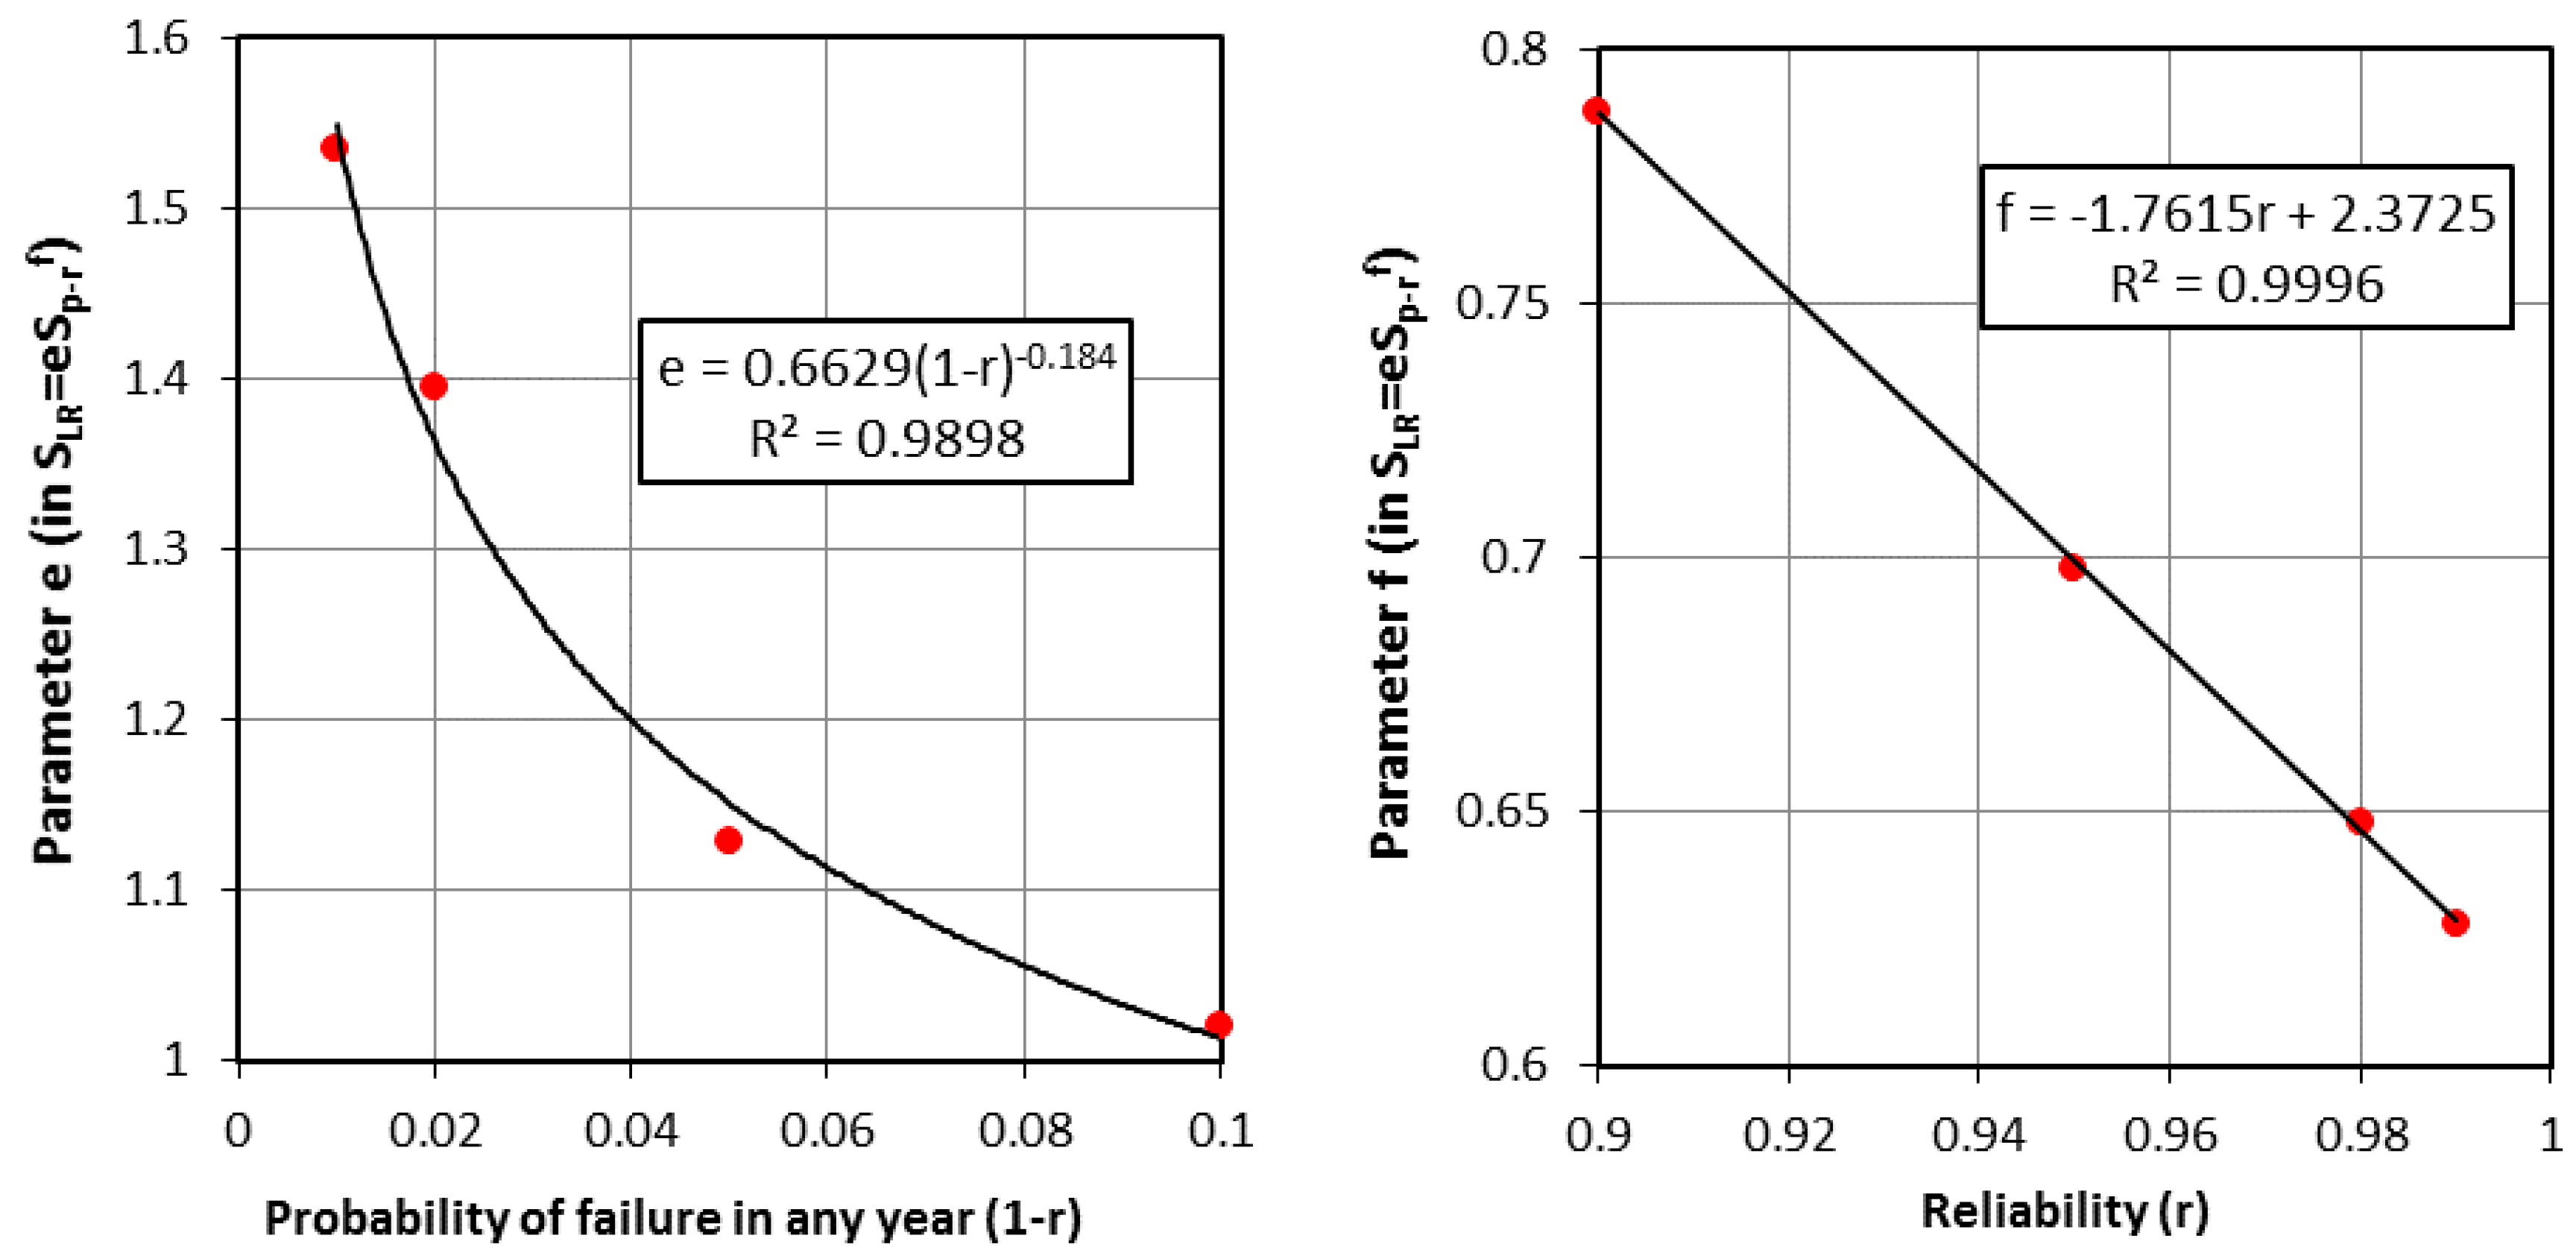
These equations and their graphical form in Figure 11 can be used to size hydrologically optimum RWH systems and to assess existing hydrologically optimum ones. For the generalization to be applicable to hydrologically non-optimal systems, a relationship between slope SLR (Figure 6) and SP-r needs to be found. Figure 12 shows the best fitting power law models between the SLR and Sp-r while Figure 13 shows the relationships obtained between the parameters of the power law model and the reliability at the Pareto front. The generalized model for the slope is defined as:
S L R = e S p r f   e = 0.6629 ( 1 r ) 0.184   f = 1.7615 r + 2.3725   0.85 r 0.99
where SLR is the slope of the yield–reliability plot, SP-r is proportion of the year fully supplied at reliability r, e is a coefficient, and f an index of the regression model.
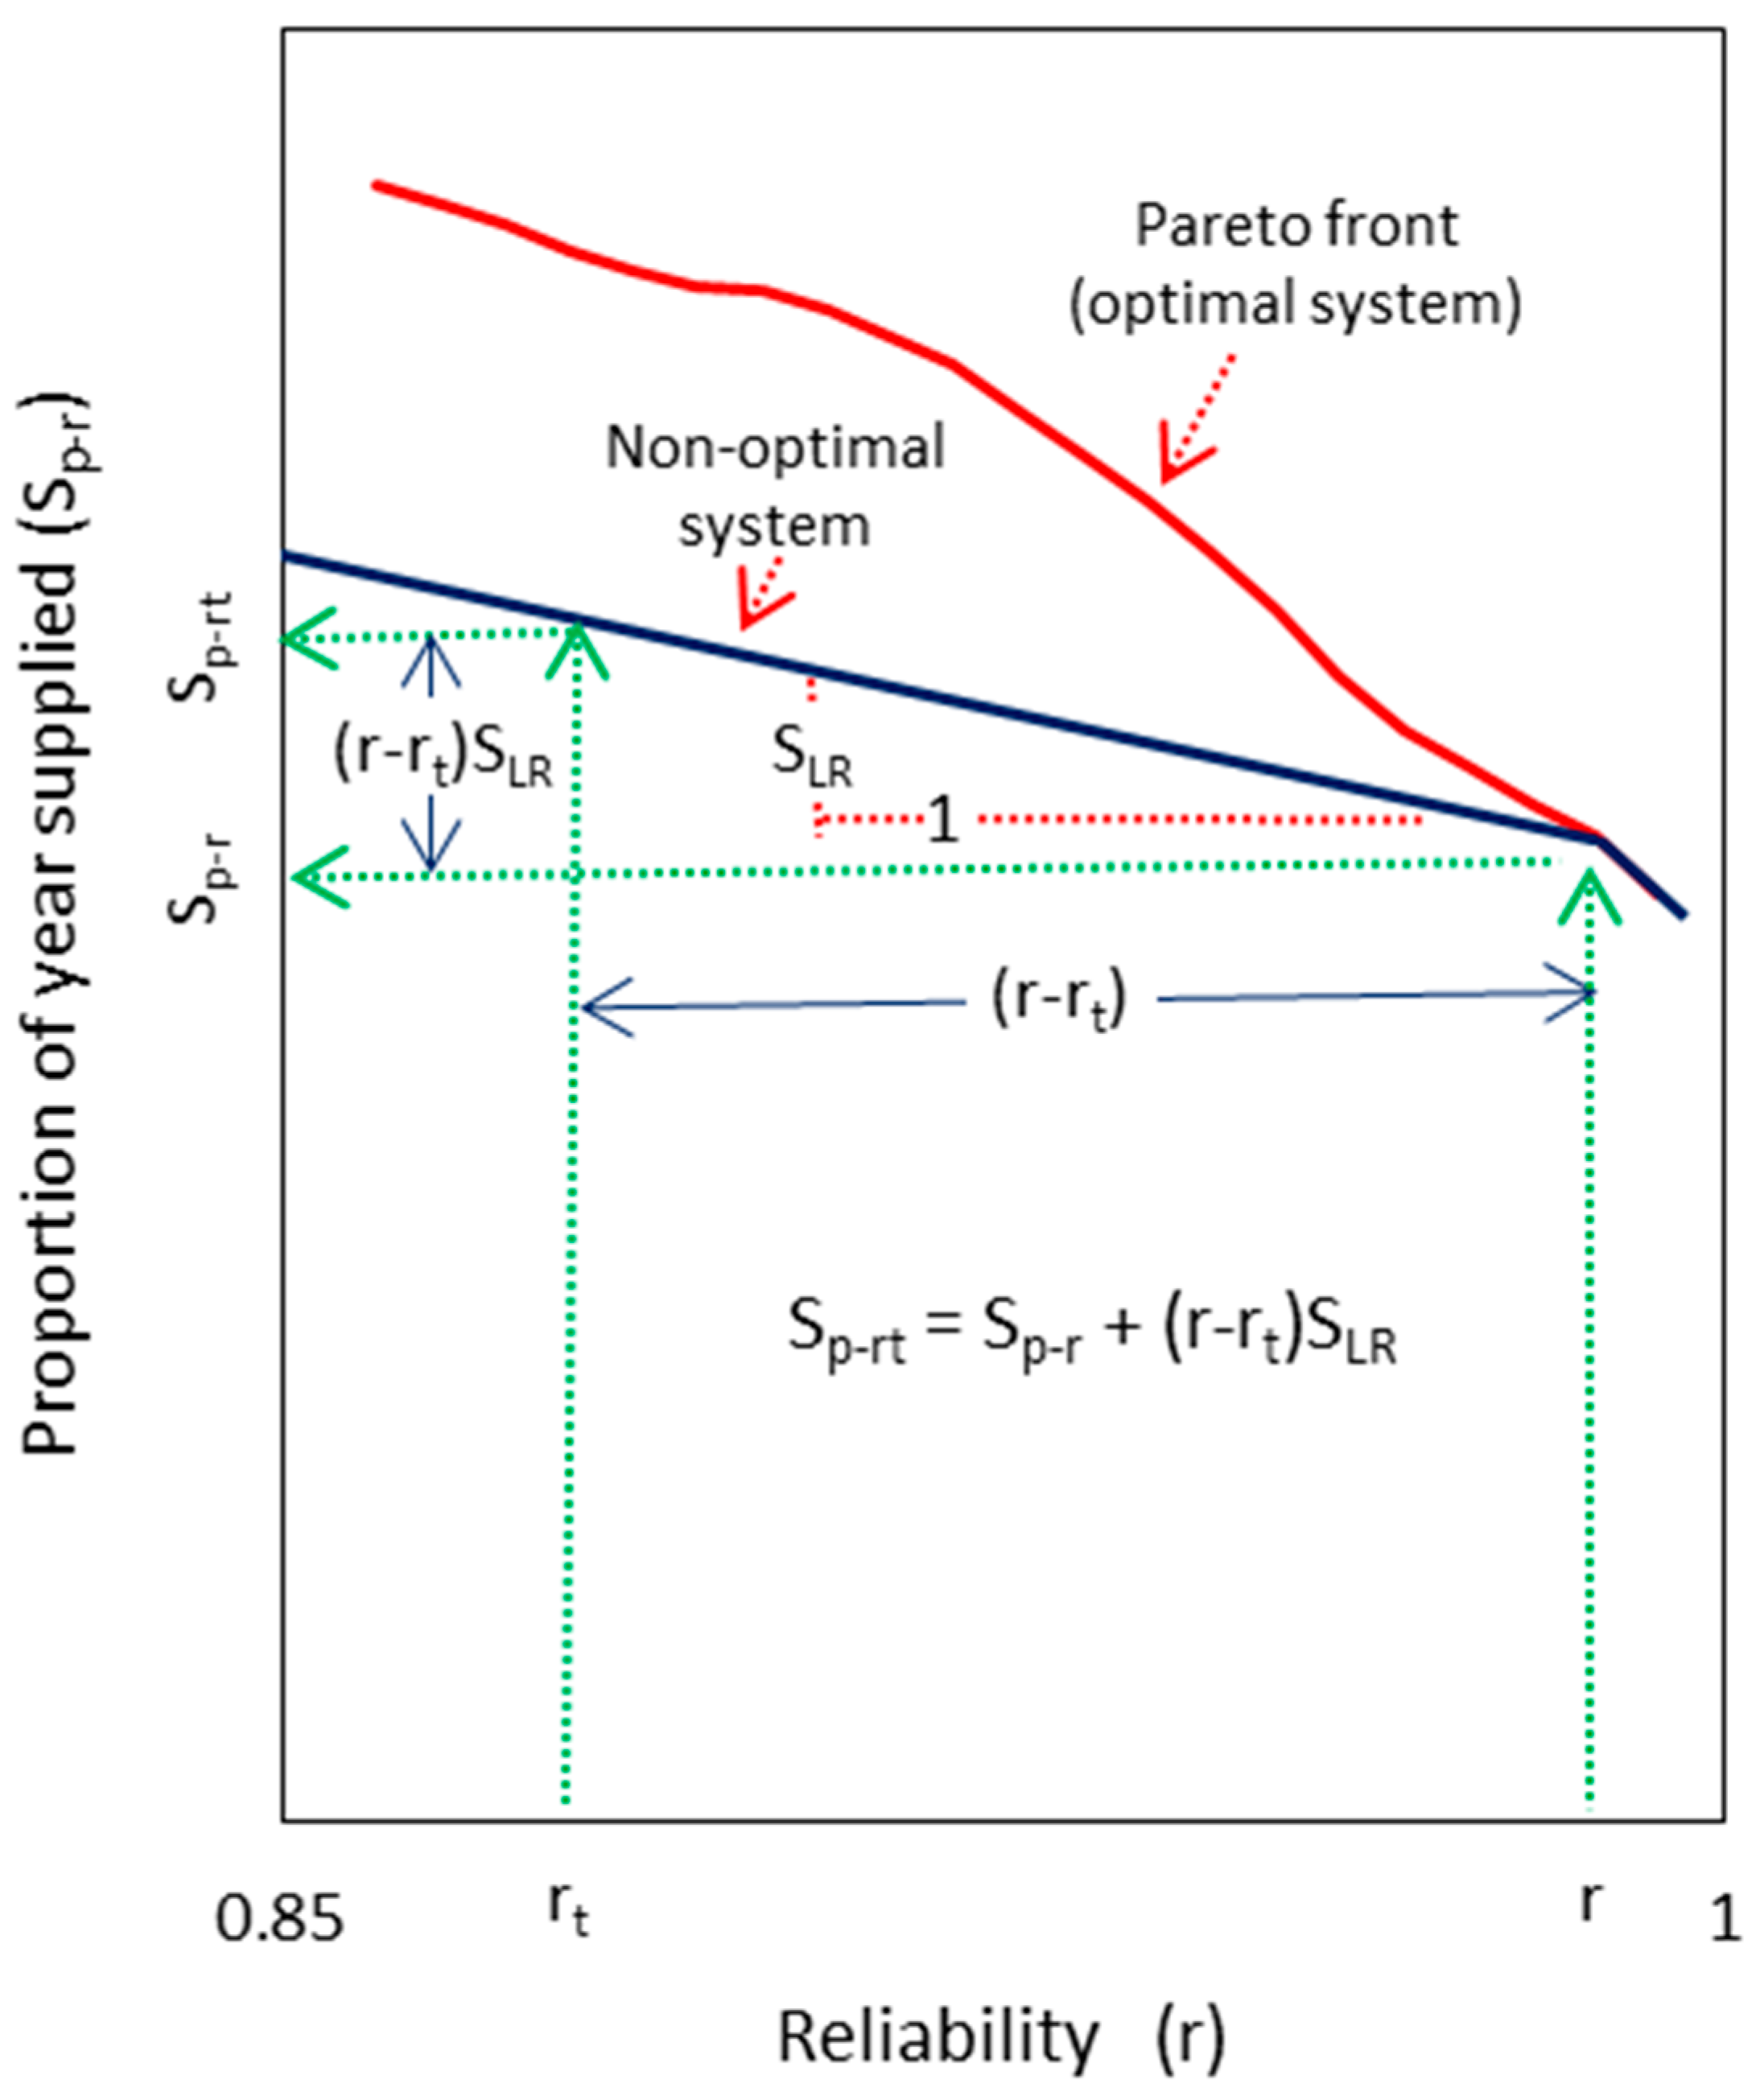
The generalized slope (SLR) is now applied to obtain the yield–reliability relationship below the Pareto front, as illustrated on Figure 14. For a RWH system whose storage is optimal at reliability r, the yield (proportion of year supplied) for reliability rt is obtained as:
S p r t = S p r + ( r r t ) S L R   r r t
where Sp-rt is the proportion of full supply for reliability rt, r is the reliability at the Pareto front and SLR is the slope of the yield–reliability plot for the storage capacity that is optimal (located at the Pareto front) for reliability r.

3.3. Verification of Generalized Model

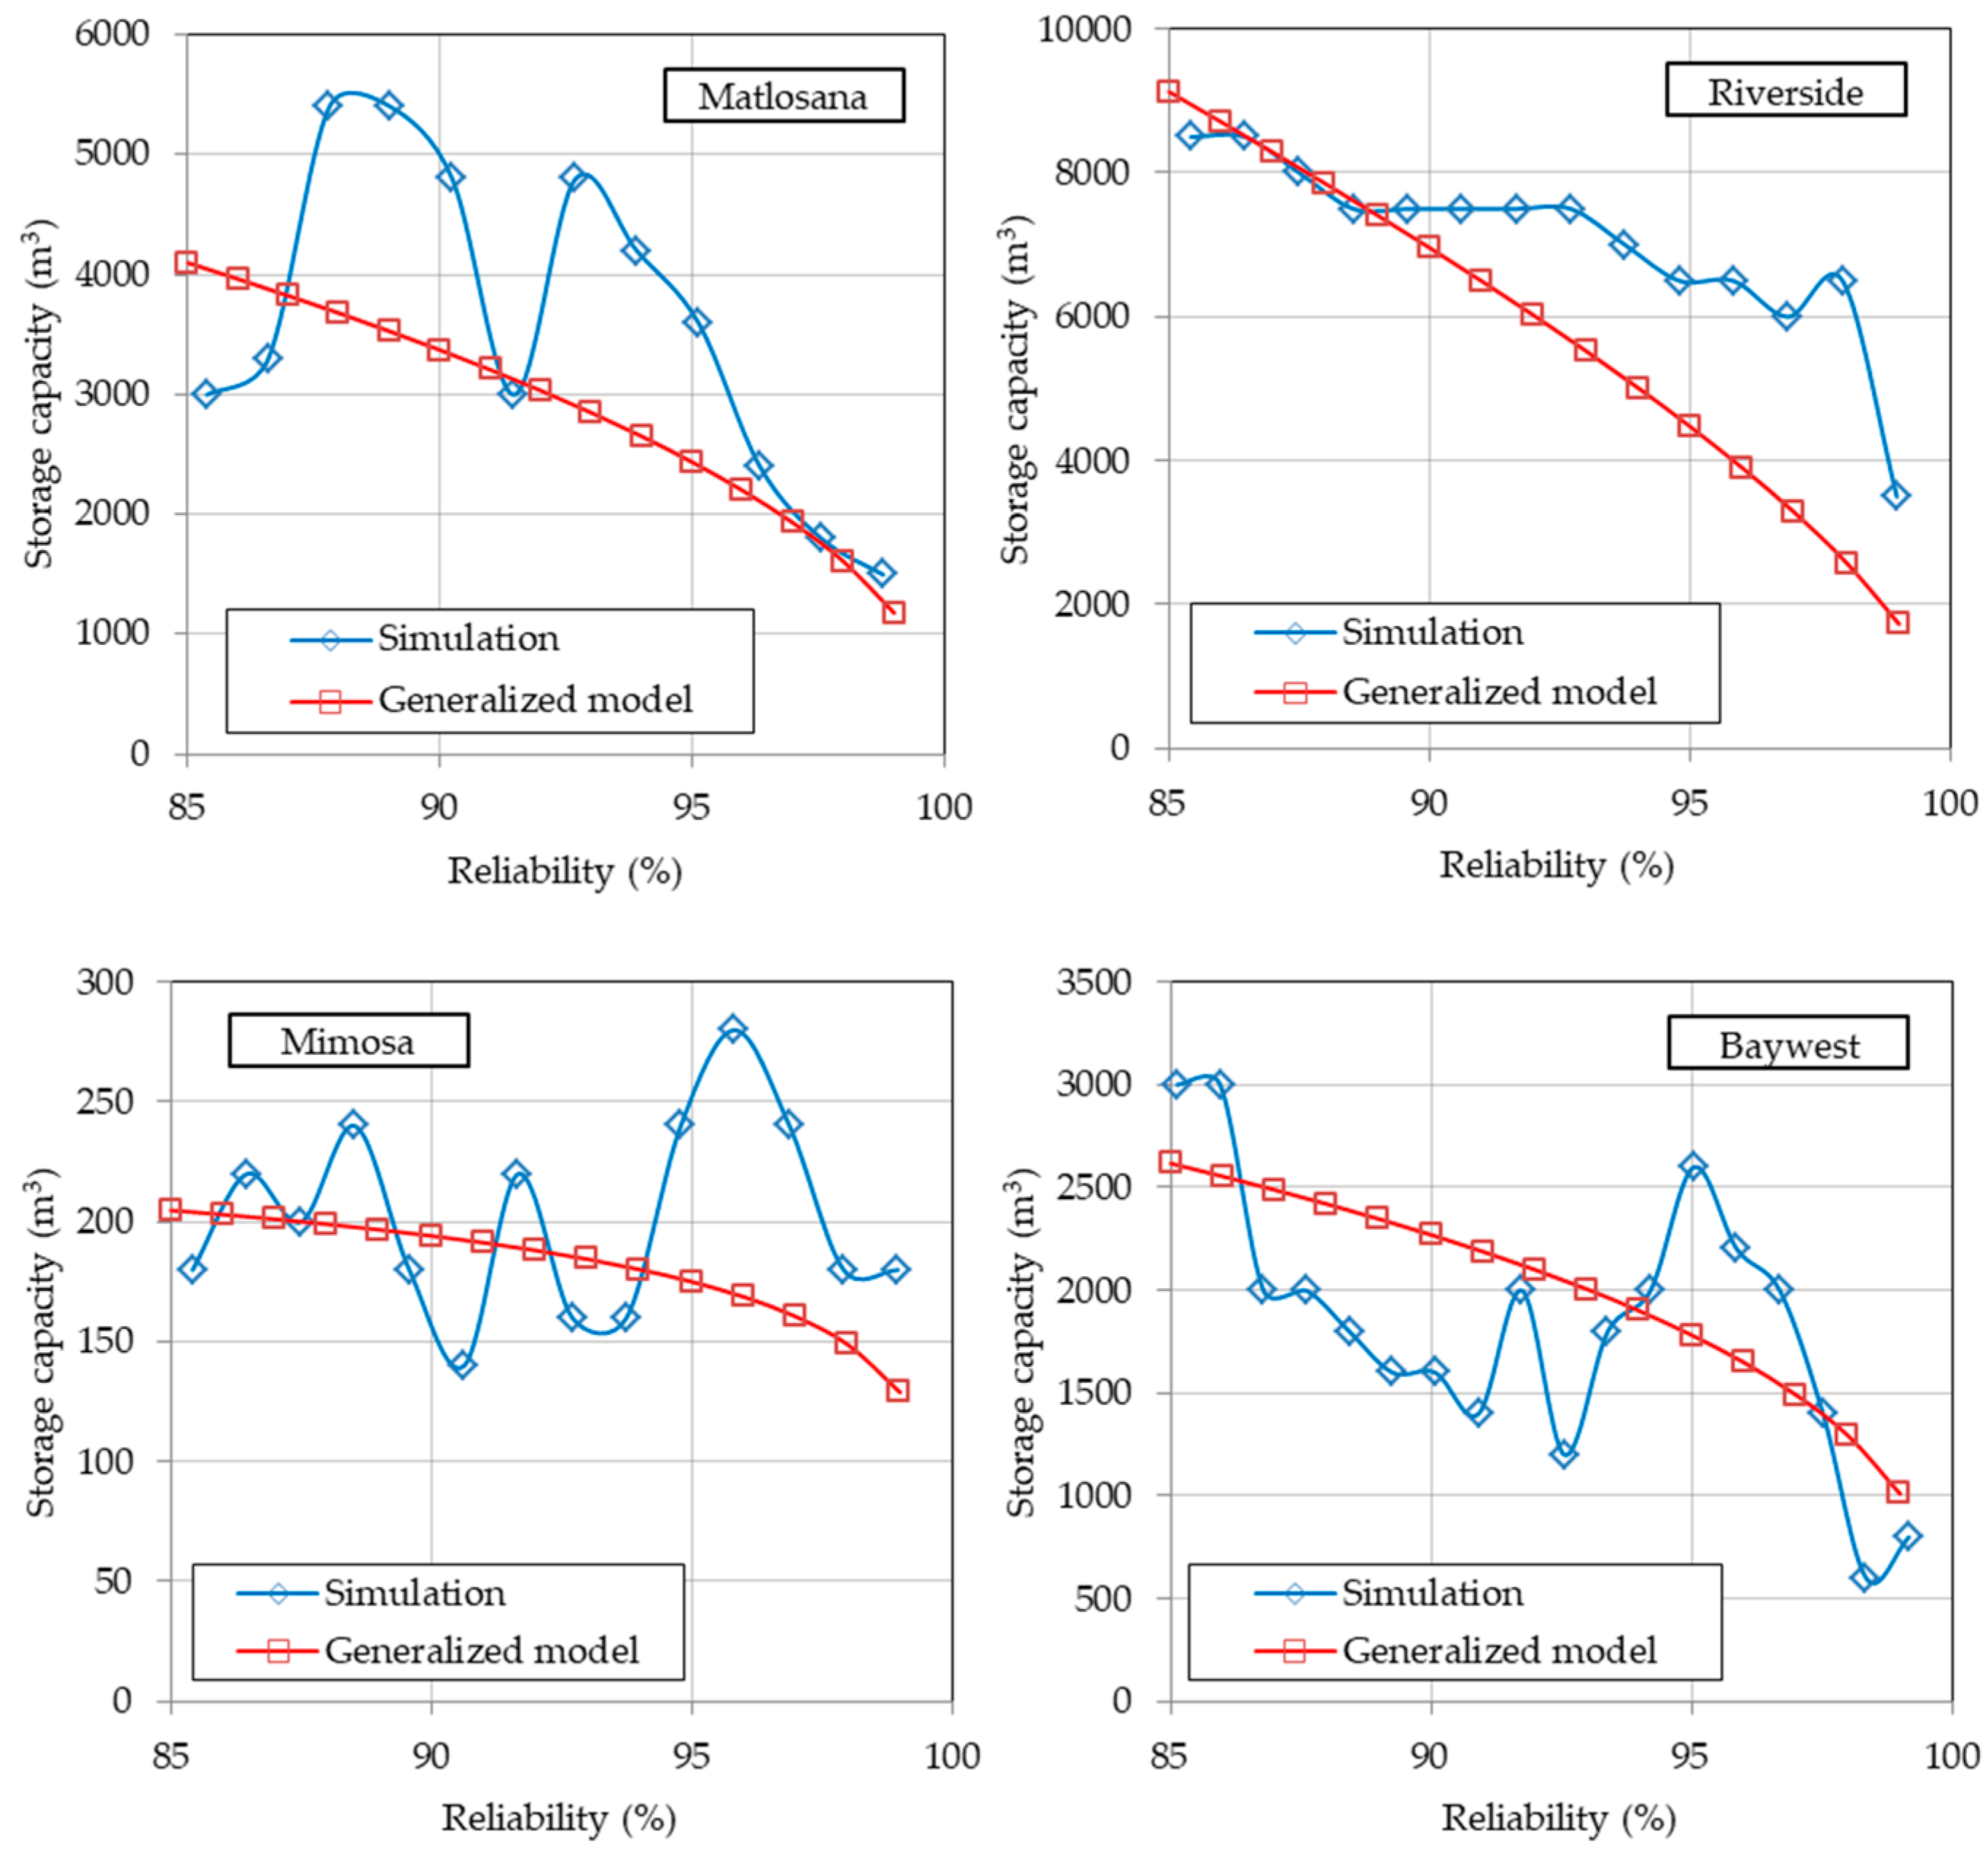
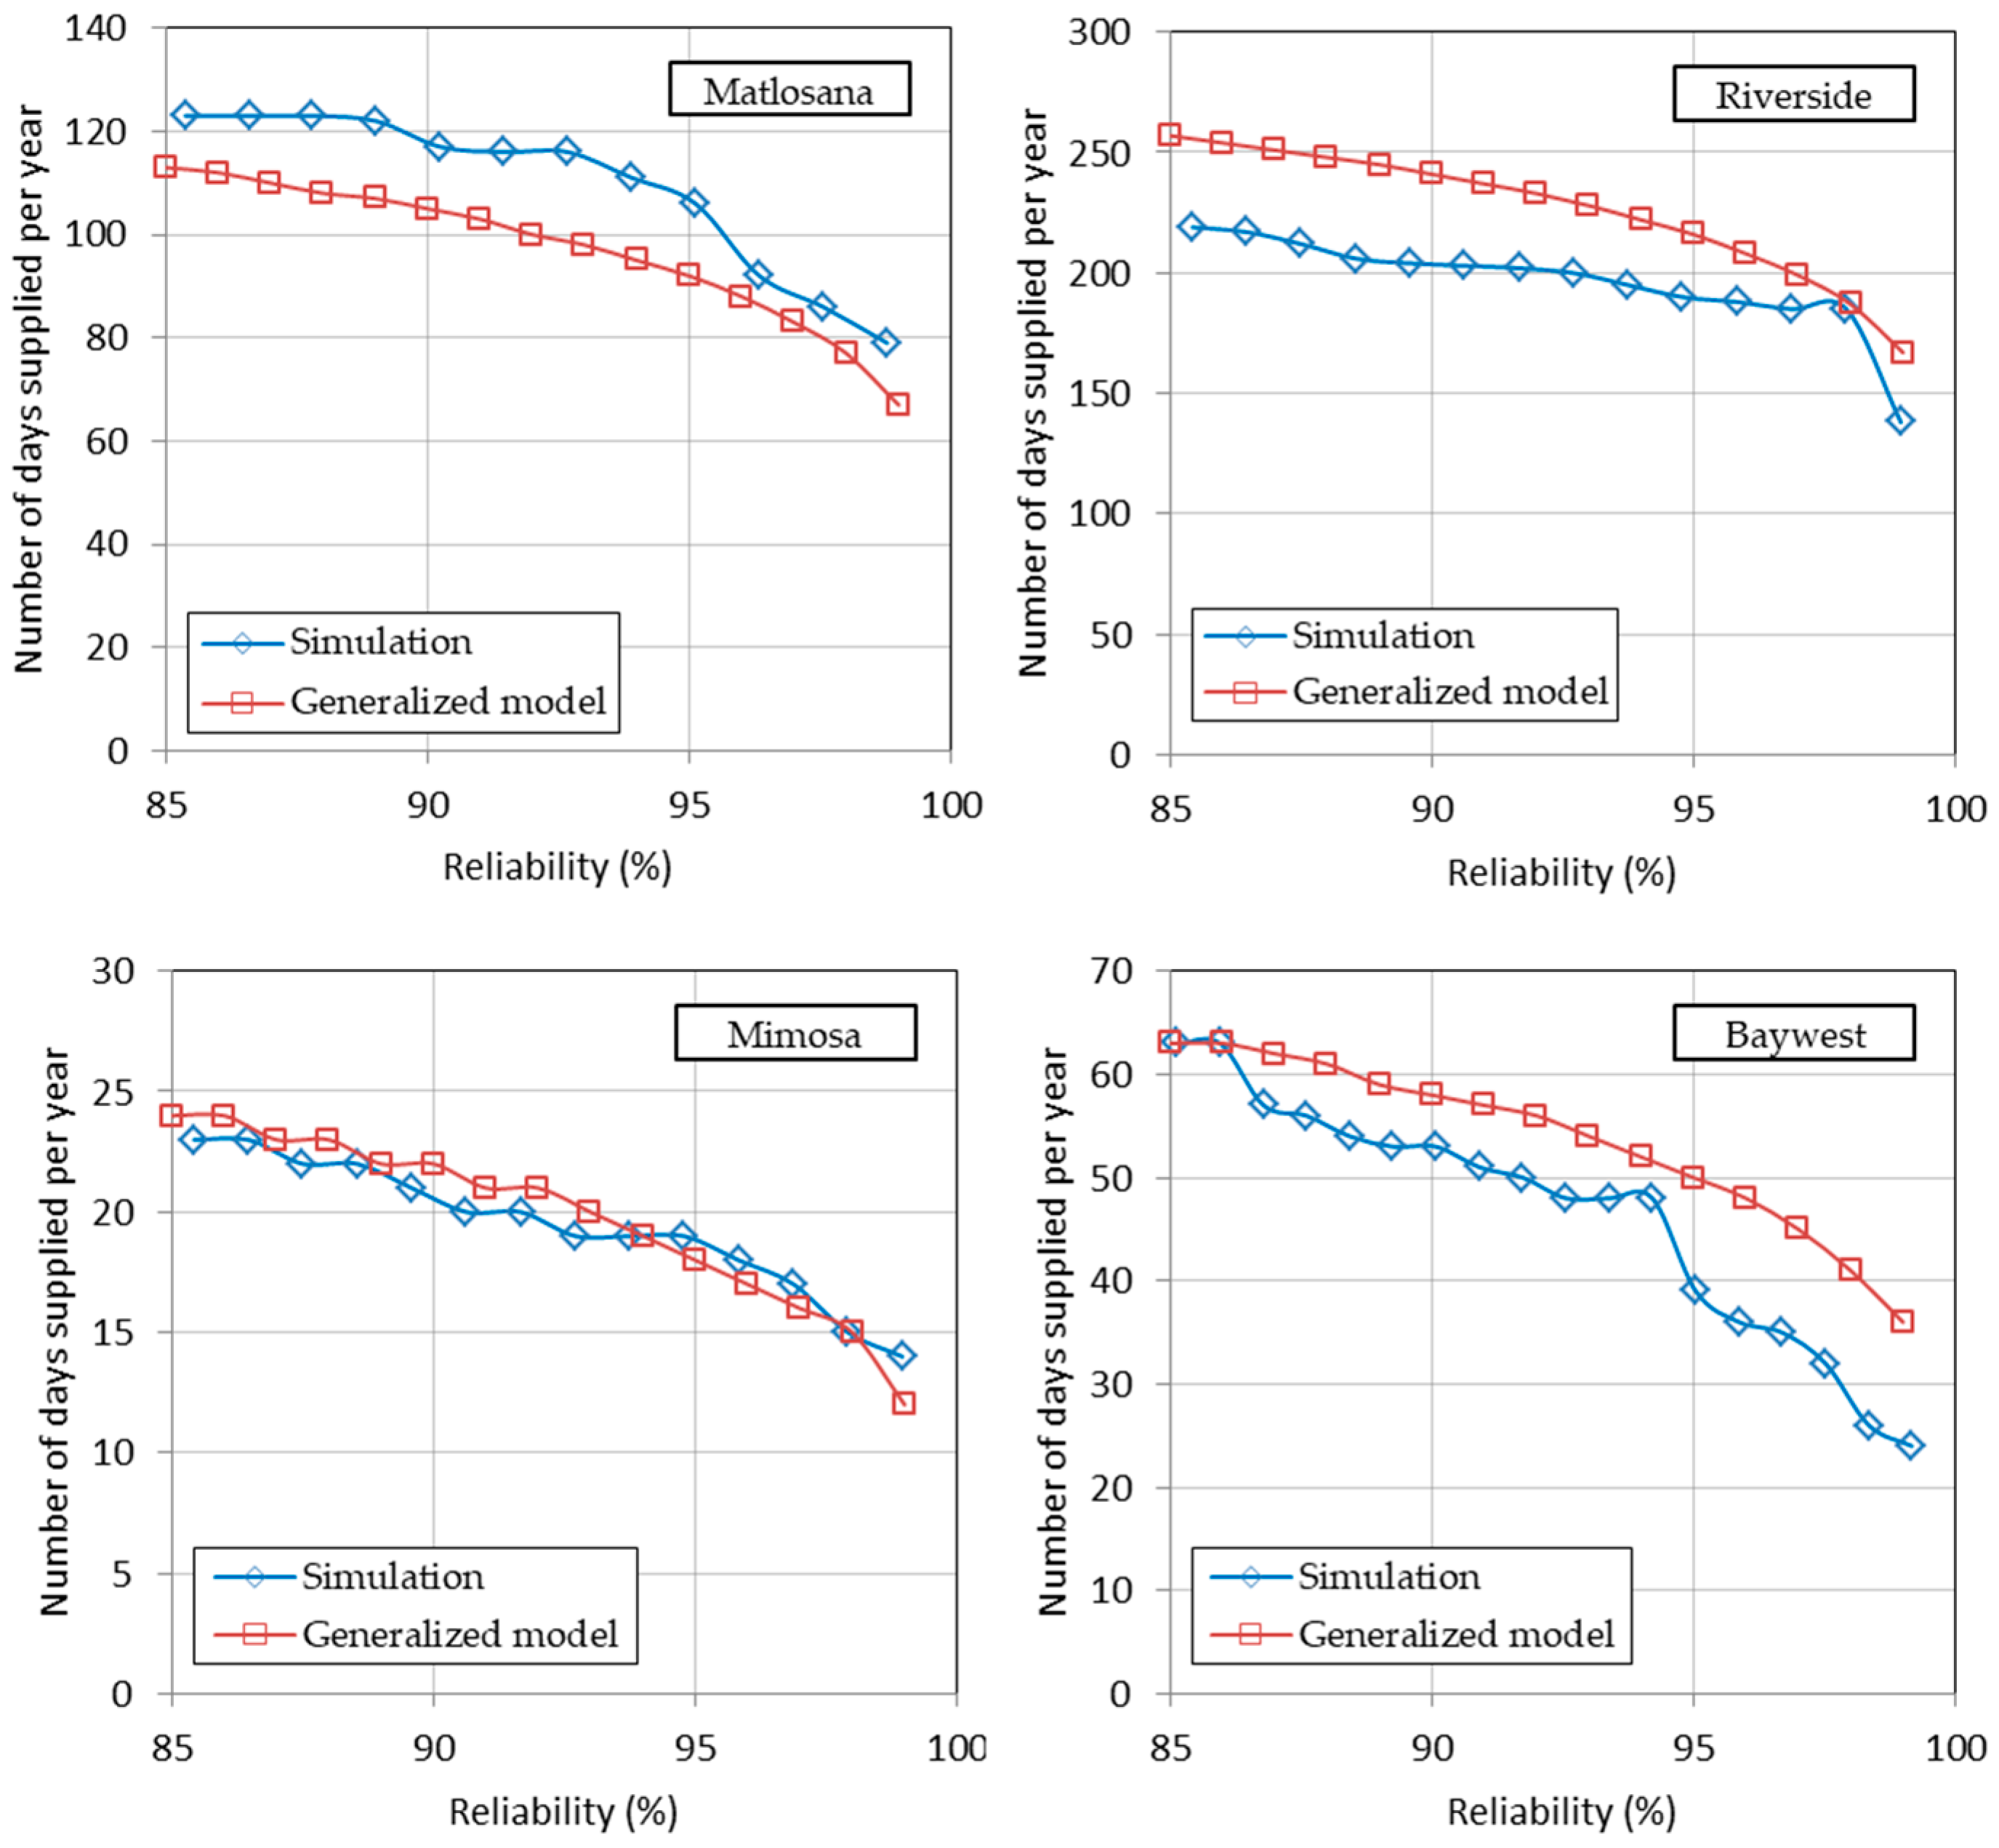
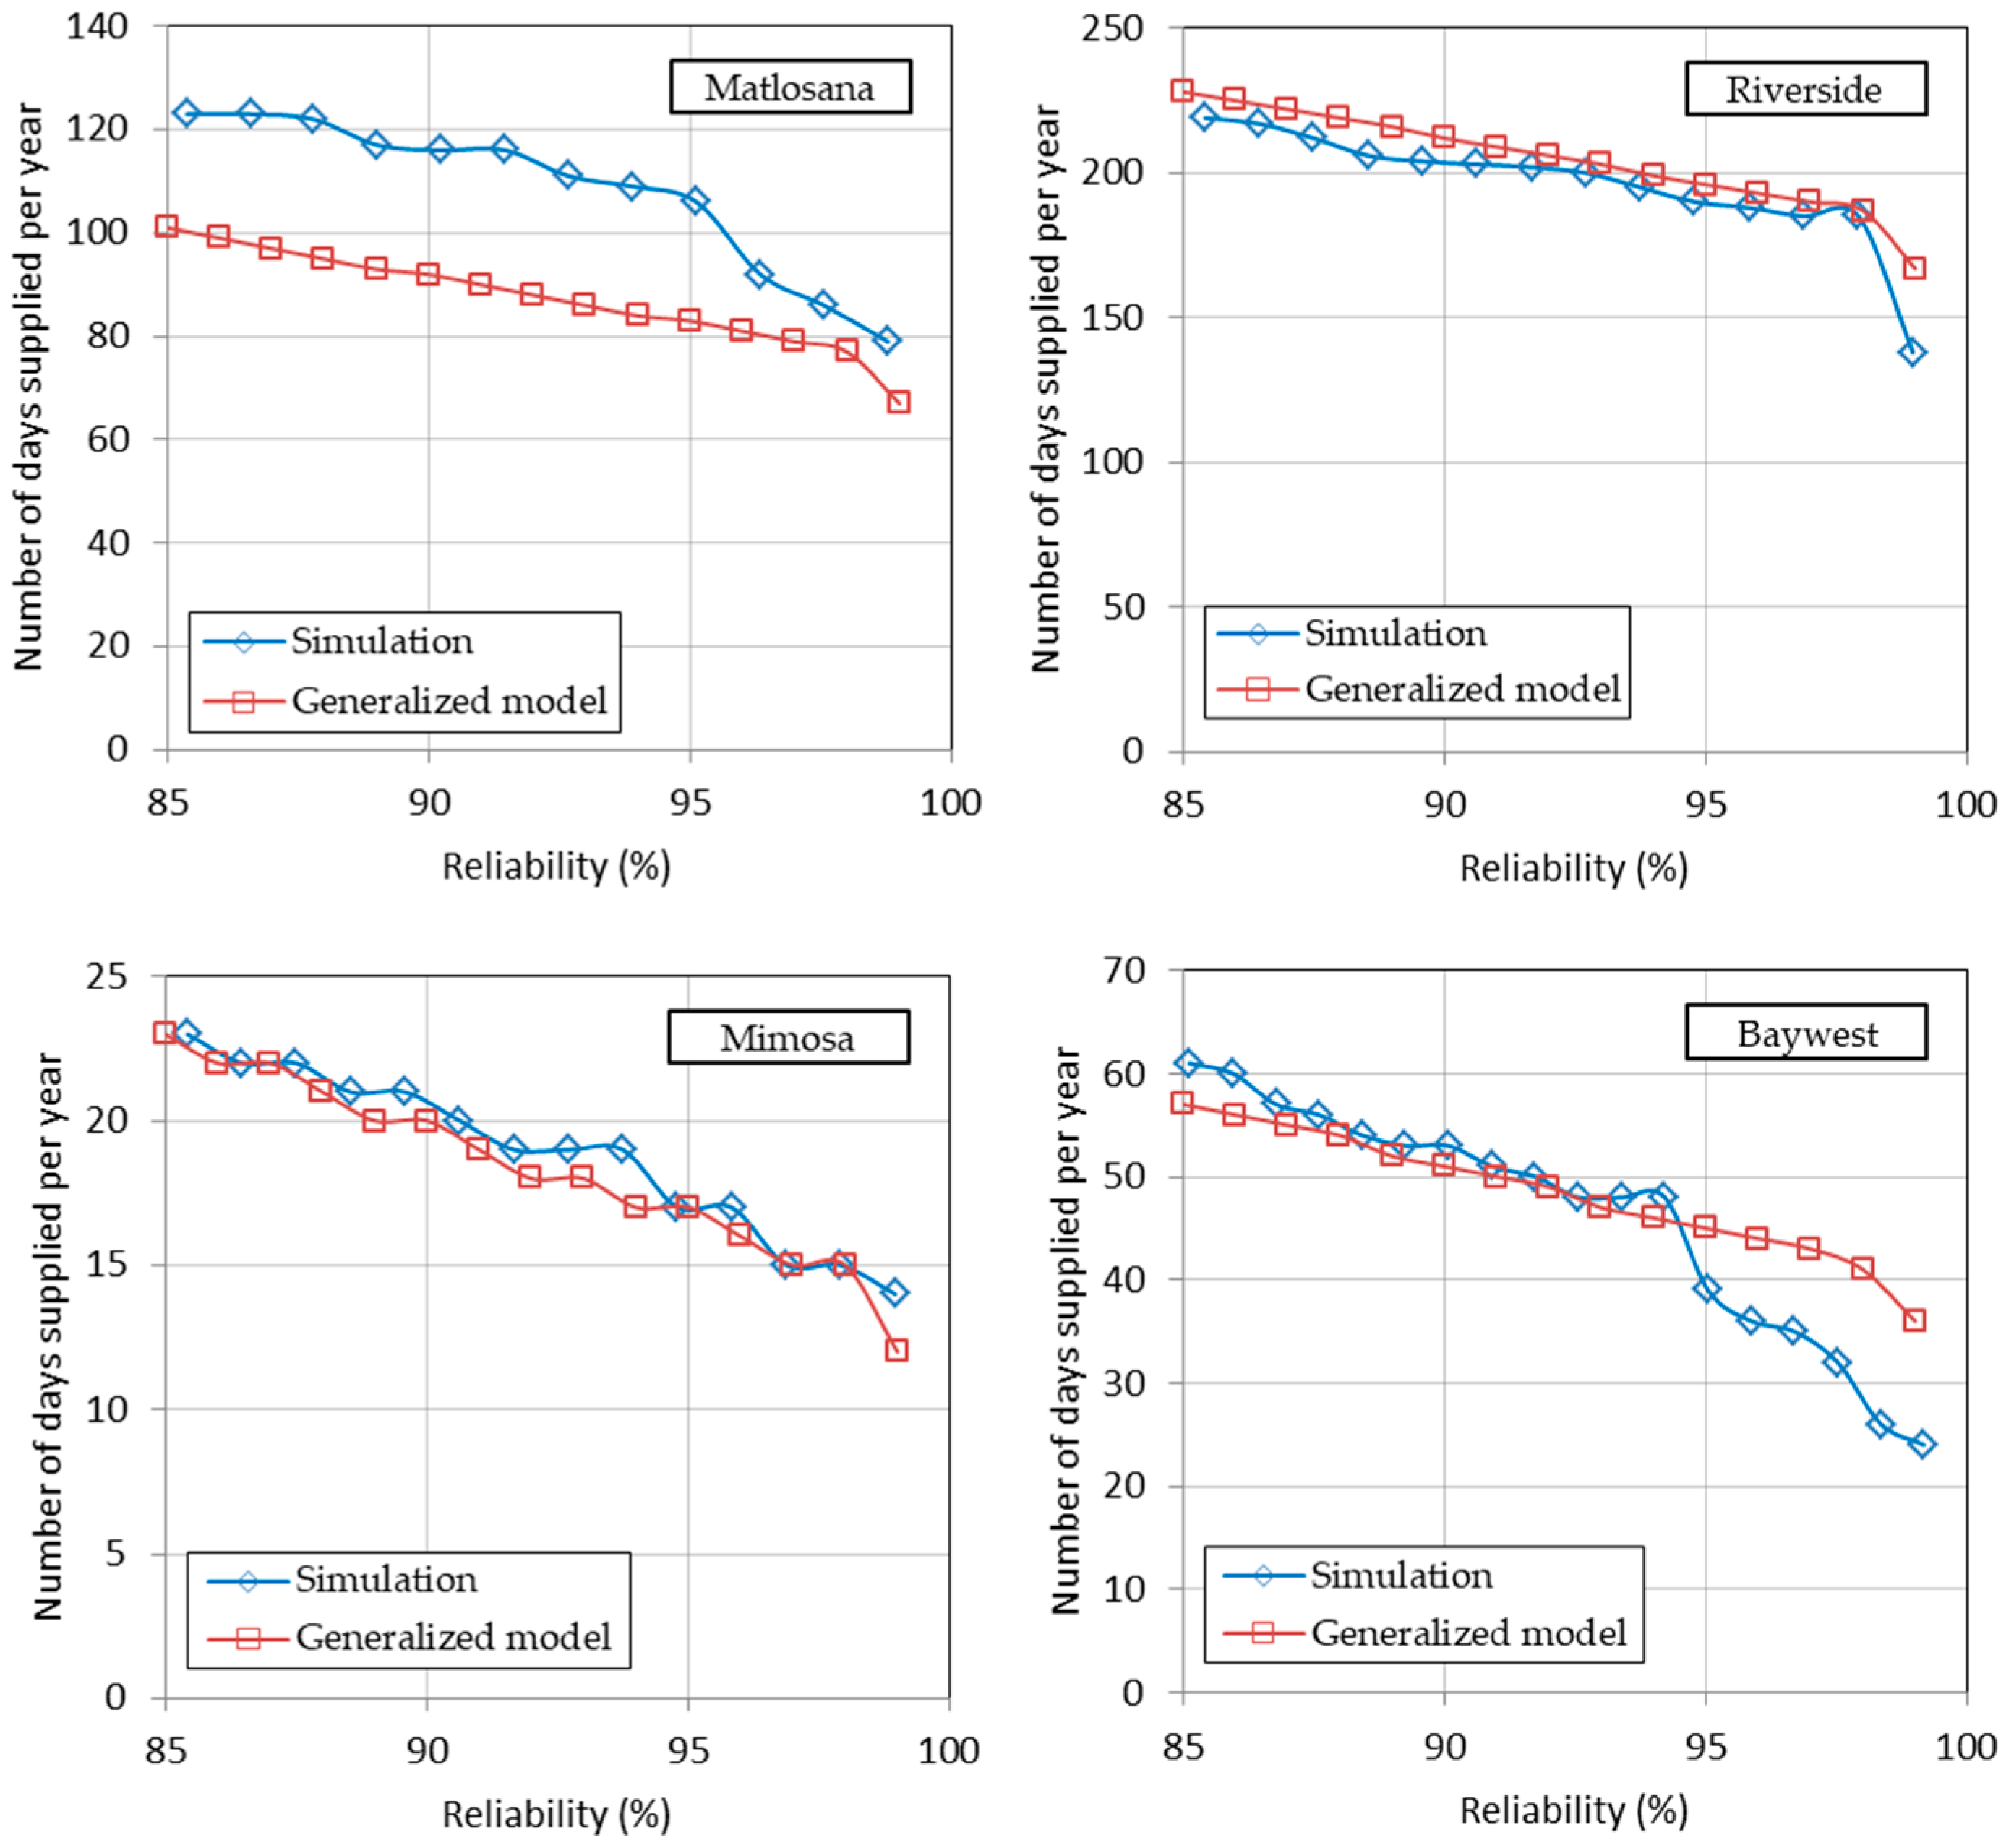
The verification of the model involved comparison of the storage–yield–reliability relationships from the generalized model with those from daily RWH simulation. This was done using RWH systems located in different provinces and far from those used in model formulation (Figure 1). The effective roof area of one of the systems (Matlosana mall) was reduced from the estimated 50,100 to 40,000 m3 to diversify the supply to demand (RSD) ratios to use in verification. With this change, the supply to demand ratios were 0.146, 0.302, 0.698 and 0.862, respectively, for Mimosa, Baywest, Matlosana and Riverside mall. Figure 15 and Figure 16 compare the simulated and modelled storage–reliability and the yield–reliability relationships for hydrologically optimum configurations of the four RWH systems. The storages obtained as optimal at 98% reliability by the generalized model were then used to verify the modelling of hydrologically non-optimal systems. Simulation was carried out using these storages and the resulting yield–reliability plots were compared with those from the generalized model. These yield–reliability plots are compared on Figure 17. Figure 15, Figure 16 and Figure 17 reveal satisfactory verification performance of the generalized model. Figure 15 also indicates that the generalizing could probably be used to smooth the large scatter of the simulated storage–reliability relationships.

4. Case Study: RWH System for Maponya Mall

Maponya mall is a regional shopping centre located in Soweto, Johannesburg. It has a retail area of 70,000 m2 and a roof area of 60,000 m2. The generalized model was used to determine the hydrologically optimum RWH storage to supply the non-potable demand at 95% reliability. The probable change in the performance of this system due to climate change was then assessed. Daily rainfall was sourced from Lynch [34] and gauging station 0475736 W located 1.90 km from the mall provided 107 years of daily rainfalls. Overall, 72.5% of the rainfall was observed, 23.9% was patched and 3.6% could not be patched and was classified as missing. The station has an MAP of 655 mm/year. This would increase to 753 mm/year assuming the projected 18% increase in rainfall for Johannesburg in the climatic “near-future” (2046–2065) [55]. The current average temperature of Johannesburg is 16 °C and is projected to increase by an average of 2.4 °C in the “near future” [55]. Unpublished analysis by the first author shows that HVAC (air conditioning) water demand in Johannesburg varies in direct proportion to the temperature (expressed in °C). The 2.4 °C rise in temperature would therefore increase the HVAC demand by 15%. Assuming that HVAC demand takes 64% of the non-potable demand, as found by Saunders [36], the total non-potable water demand currently estimated as 0.606 m3/m2/year would increase to 0.665 m3/m2/year in the climatic “near future”.
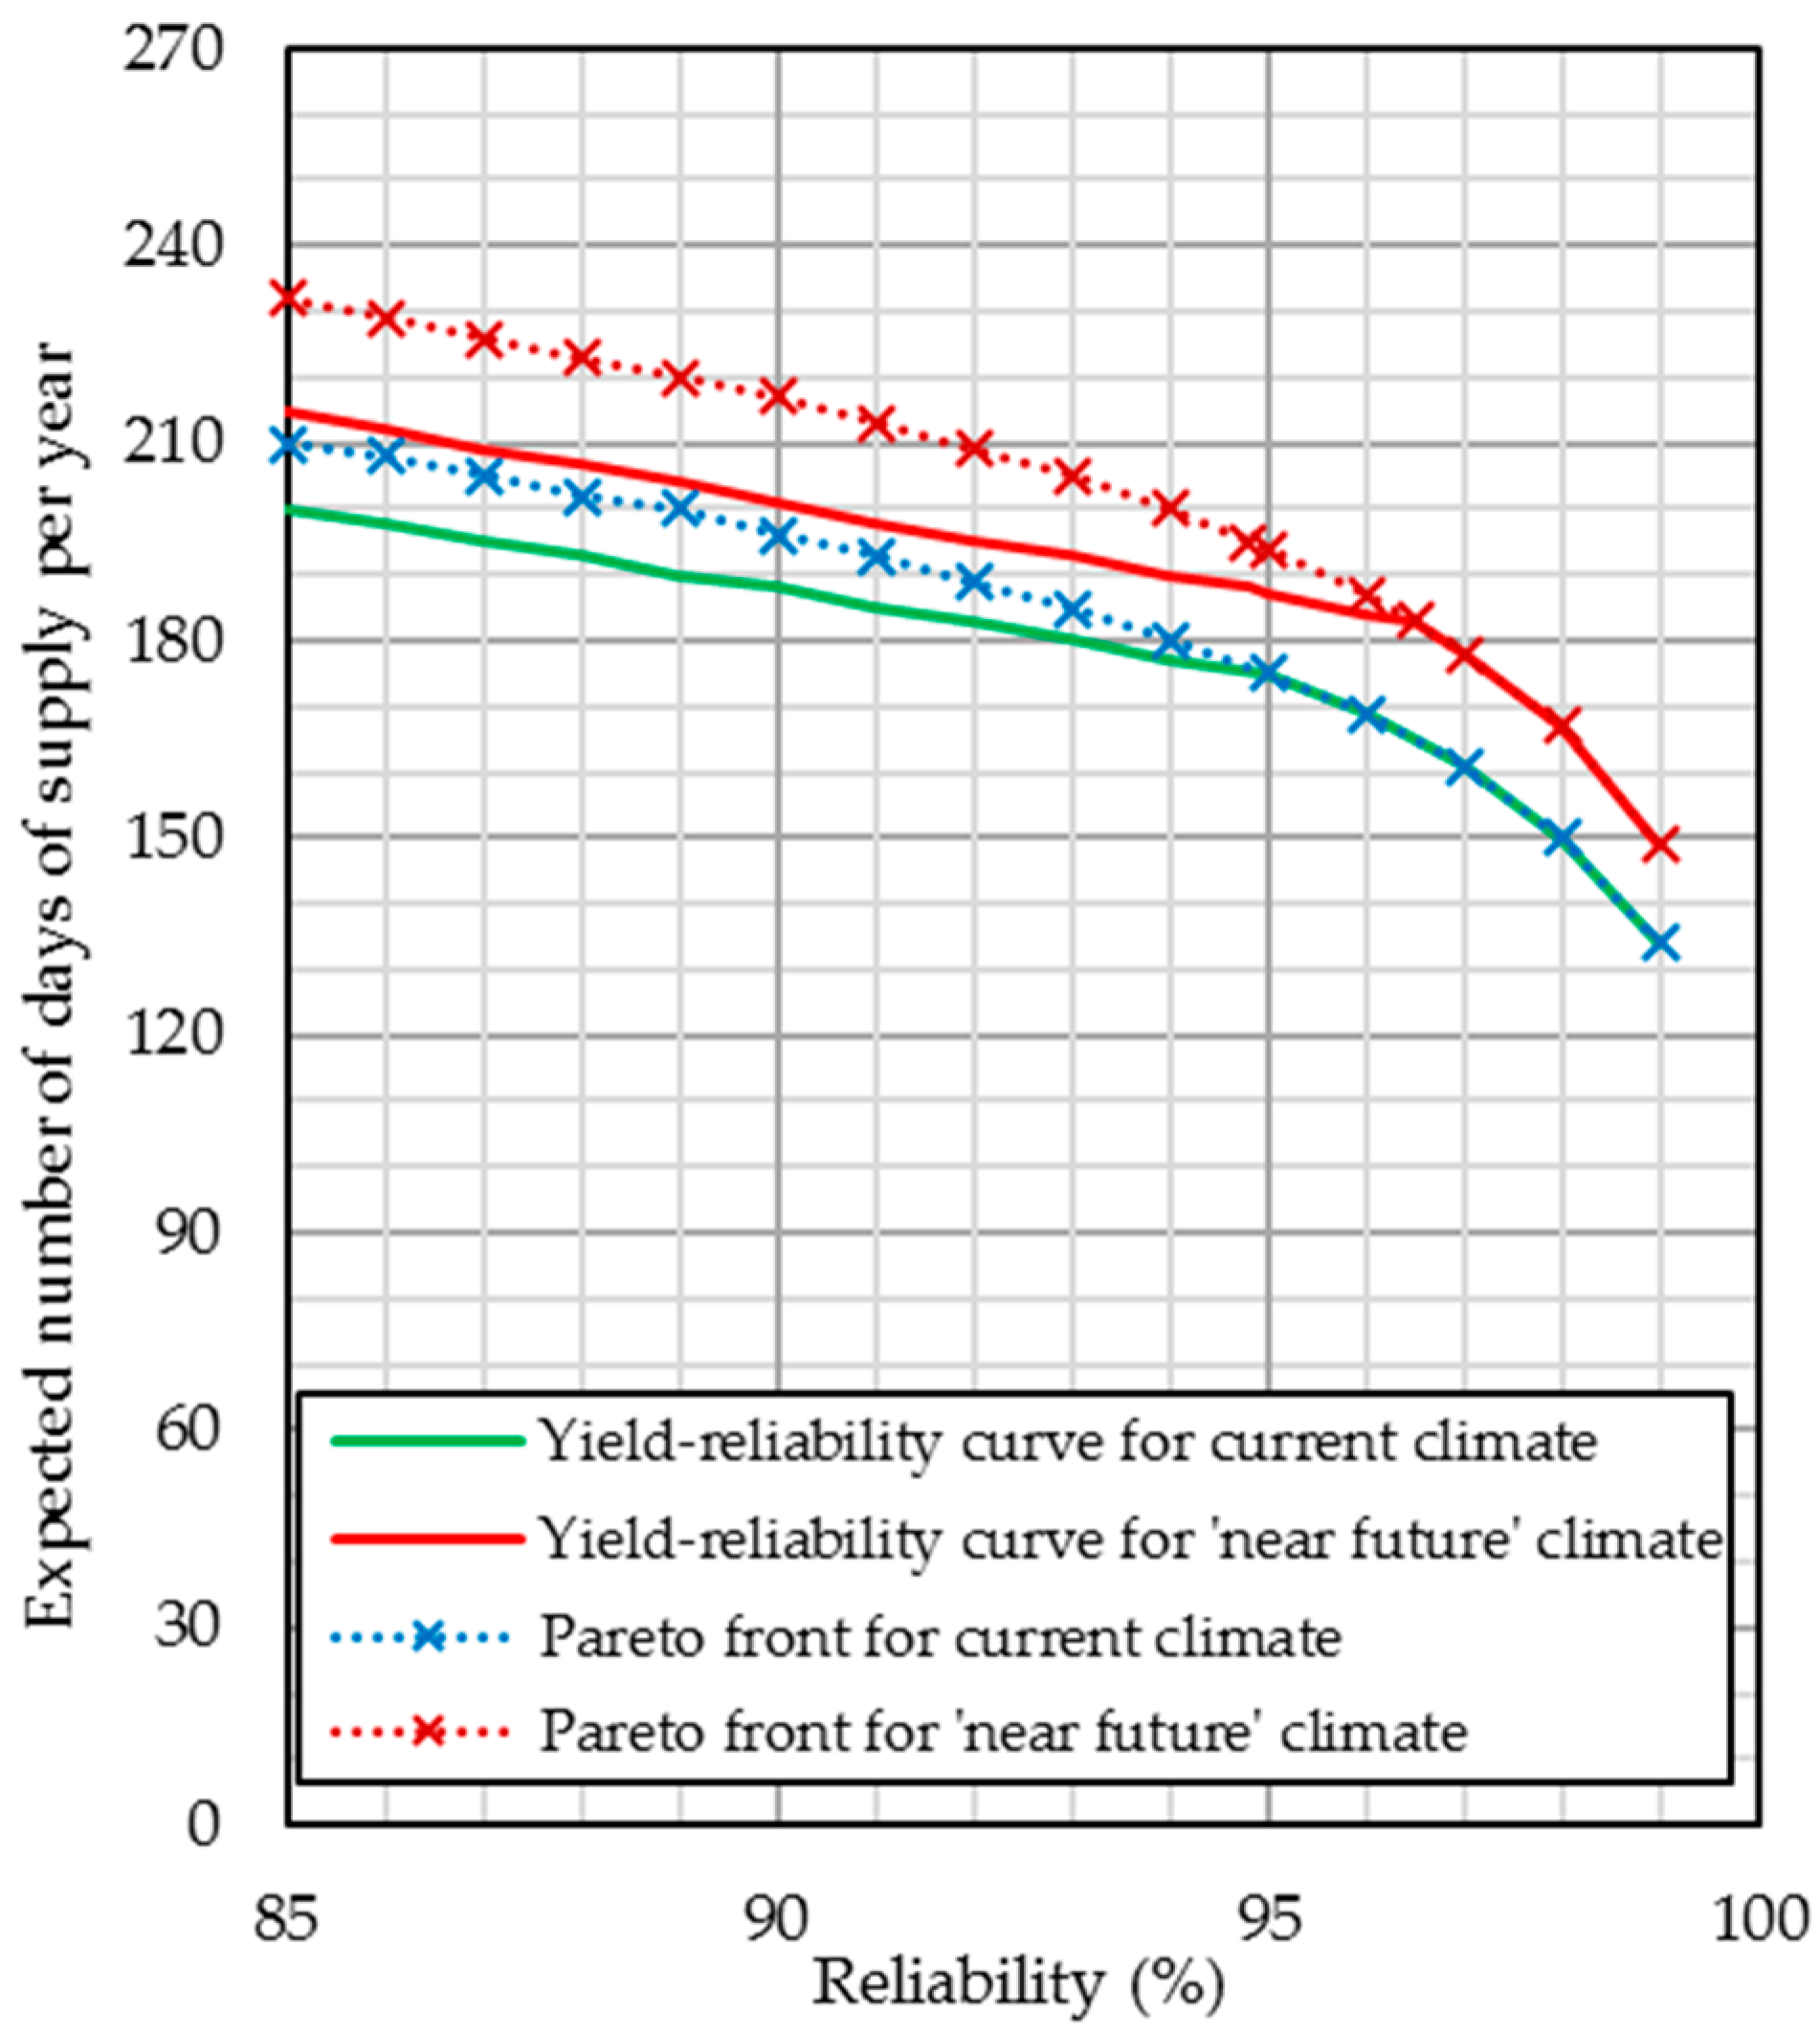
The supply to demand ratio (RSD) for the current climate is obtained as 0.741 using Equation (4). By using Equation (8), a proportion of full supply (SP-95) of 0.479 is obtained for a reliability of 95%. By Equation (5), the expected number of days of full supply (Nr) is obtained as 175 days per year at 95% reliability. Using Equation (9), the ratio of storage capacity to annual demand (RTD-95) comes to 0.119 and the storage capacity (Cr) is then obtained as 5062 m3 by Equation (6).
For the climatic “near future” the new ratio of supply to demand ratio (RSD) is 0.797 (Equation (4)) and the new storage to annual demand ratio (RDR-r) is 0.109 (Equation (6)). Because the supply and demand have changed, the capacity (5062 m3) that was hydrologically optimal at 95% reliability is now optimal at some other reliability. This new reliability is obtained by setting RSD as 0.797 in Equation (8) and RTD-r as 0.109 in Equation (9), and then determining r simultaneously using both equations. This obtains a reliability (r) of 0.965 (96.5%). The proportion of year supplied SP-96.5 comes to 0.500 (Equation (8)) obtaining an expected full supply of 183 days per year at 96.5% reliability (Equation (5)). At reliabilities exceeding 96.5%, the proportion of year supplied (SP-r) is obtained using Equation (8) and, at lower reliabilities, Equations (10) and (11) are used to obtain SP-rt. The yield–reliability relationships for the current and the climatic “near future” are shown on Figure 18.

5. Discussion and Conclusions

This study aimed to develop guidelines for sizing and the assessing the rainwater harvesting (RWH) potential of shopping centres in South Africa as none of these were known to exist. A generalized model has been developed using data from the simulation of potential RWH systems of 19 shopping centres. The 19 centres are located in four South African provinces and verification of the model has been done using four RWH systems located in four other provinces. The generalized model consists of three regression equations of dimensionless ratios. These ratios are derived from the variables that characterize RWH systems and are defined as: the supply to demand ratio, the yield ratio, the storage capacity to annual demand ratio, and reliability. The yield was defined as proportion of the year that the RWH system meets the demand and reliability was defined as the probability that this yield would be met in any year of the operational life of the system. These definitions enabled inter-annual variability of rainfall to be integrated into the model and the Weibull plotting position formula was used to determine the probabilities of exceedance of yield.
Maximizing yield and reliability is a common objective of storage design and, in this study, a hydrologically optimum system was considered as one that maximizes yield and reliability with minimum storage. Since maximizing both yield and reliability are conflicting objectives, the Pareto front of the two objectives was used to identify hydrologically optimum combinations of yield, reliability and storage. These data were then used to formulate two of the three regression equations of the model. One equation is between the supply to demand ratio, the yield ratio and reliability. The other is between the ratio of optimal tank size to annual demand, the yield ratio and reliability. RWH systems may however not be hydrologically optimum as financial considerations and space limitations often constrain design. Furthermore, the rainwater collection area is likely to be set and use of commercially available tanks may be more economical than on-site construction of storage. To enable the design and analysis of hydrologically non-optimal systems, an additional regression equation was formulated. This equation expresses the slope of the yield–reliability plot as a function of the optimal yield for a specified storage. All the model fits have high correlation coefficients that exceed 0.8 and average 0.92. The generalized model is found to perform well in verification for both hydrologically optimum and non-optimum systems (Figure 15, Figure 16 and Figure 17). A case study RWH design using the generalized model is carried out for Maponya mall, a regional shopping centre located in Soweto, Johannesburg. The case study includes an assessment of the effect of the projected climate change in the “near future” (2046–2065) on the performance of the RWH system.
In contrast to several RWH generalization studies [26,28,31,43], within-year yield and inter-annual variability have been incorporated comprehensively into the modelling here. The generalization by Compisano and Modica [27] however also included probability of exceedance considerations in the generalization. Several generalization studies [26,27,28,31,43] have obtained relationships at specified reliabilities while the model developed here includes reliability as a variable within the regression equations—an aspect that improves its applicability. The model has very low data requirements and uses mean annual precipitation (MAP) as the only hydrological input. The satisfactory verification results, low data requirements and the high level of model parsimony are considered as indicators of appropriate choice and combination of variables and. apt selection of regression equations. In its current form, the generalized model is considered applicable for feasibility analysis and preliminary design of RWH systems but not as a replacement of detailed analysis.
For the future, generalization with a larger number of rainfall stations could obtain more dependable relationships that include statistical confidence intervals. The influence of the distribution of demand within the year could be investigated and first-flush losses could also be included explicitly. Although the simplicity of the current model is favourable, it is probable that use of additional rainfall statistics (as done in other studies [26,27]) could improve modelling performance. This aspect will therefore be pursued in the future.

Author Contributions

J.N. conceived the concepts; J.N., M.G. and Y.M. designed the experiments; J.N., Y.M. and M.G. performed the experiments; J.N., M.G. and Y.M. analysed the data; and J.N. wrote the paper.

Conflicts of Interest

The authors declare no conflicts of interest.

References

  1. United Nations Educational, Scientific and Cultural Organization (UNESCO). The United Nations World Water Development Report 3: Water in a Changing World; United Nations Educational, Scientific and Cultural Organization: Paris, France, 2009. [Google Scholar]
  2. United Nations Educational, Scientific and Cultural Organization (UNESCO). World Water Development Report Volume 4: Managing Water under Uncertainty and RISK; United Nations Educational, Scientific and Cultural Organization: Paris, France, 2012; Volume 1. [Google Scholar]
  3. Department of Water Affairs. National Water Resource Strategy: South Africa; Department of Water Affairs: Pretoria, South Africa, 2013; 201p.
  4. O’Brien, O. Domestic Water Demand for Consumers with Rainwater Harvesting Systems. Master’s Thesis, Department of Civil Engineering, Division of Water and Environmental Engineering, Stellenbosch University, Stellenbosch, South Africa, 2014. [Google Scholar]
  5. Tito, M.P. Modelling and Sustainable Management of Rainwater Harvesting in Urban Systems. Ph.D. Thesis, Universitat Autònoma de Barcelona (UAB), Barcelona, Spain, 2012. [Google Scholar]
  6. Rahman, A.; Keane, J.; Imteaz, M.A. Rainwater harvesting in Greater Sydney: Water savings, reliability and economic benefits. Resour. Conserv. Recycl. 2012, 61, 16–21. [Google Scholar] [CrossRef]
  7. Ghisi, E.; Schondermark, P.N. Investment Feasibility Analysis of Rainwater Use in Residences. Water Resour. Manag. 2013, 27, 2555–2576. [Google Scholar] [CrossRef]
  8. Farreny, R.; Gabarrell, X.; Rieradevall, J. Cost-efficiency of rainwater harvesting strategies in dense Mediterranean neighbourhoods. Resour. Conserv. Recycl. 2011, 55, 686–694. [Google Scholar] [CrossRef]
  9. Campisano, A.; Butler, D.; Ward, S.; Burns, M.J.; Friedler, E.; DeBusk, K.; Fisher-Jeffes, L.N.; Ghisi, E.; Rahman, A.; Furumai, H.; et al. Urban rainwater harvesting systems: Research, implementation and future perspectives. Water Res. 2017, 115, 195–209. [Google Scholar] [CrossRef] [PubMed]
  10. Gupta, A.S. Cost Recovery in Urban Water Services: Select Experiences in Indian Cities; Water and Sanitation Program, World Bank: Washington, DC, USA, March 2011. [Google Scholar]
  11. Farolfi, S.; Gallego-Ayala, J. Domestic water access and pricing in urban areas of Mozambique: Between equity and cost recovery for the provision of a vital resource. Int. J. Water Resour. Dev. 2014, 30, 728–744. [Google Scholar] [CrossRef]
  12. Sample, D.J.; Liu, J. Optimizing rainwater harvesting systems for the dual purposes of water supply and runoff capture. J. Clean. Prod. 2014, 75, 174–194. [Google Scholar] [CrossRef]
  13. Chiu, Y.R.; Tsai, Y.L.; Chiang, Y.C. Designing rainwater harvesting systems cost-effectively in a urban water-energy saving scheme by using a GIS-simulation based design system. Water 2015, 7, 6285–6300. [Google Scholar] [CrossRef]
  14. Dobrowksy, P.H.; Mannel, D.; De Kwaadsteniet, M.; Prozesky, H.; Khan, W.; Cloete, T.E. Quality assessment and primary uses of harvested rainwater in Kleinmond, South Africa. Water SA 2014, 40, 401–406. [Google Scholar] [CrossRef]
  15. Abbott, S.E.; Douwes, J.; Caughley, B.P. A survey of the microbiological quality of roof-collected rainwater of private dwellings in New Zealand. N. Z. J. Environ. Health 2006, 29, 6–16. [Google Scholar]
  16. Evans, C.A.; Coombes, P.J.; Dunstan, R.H. Wind, rain and bacteria: The effect of weather on the microbial composition of roof-harvested rainwater. Water Res. 2006, 40, 37–44. [Google Scholar] [CrossRef] [PubMed]
  17. Chang, M.; McBroom, M.W.; Scott Beasley, R. Roofing as a source of nonpoint water pollution. J. Environ. Manag. 2004, 73, 307–315. [Google Scholar] [CrossRef] [PubMed]
  18. Evison, L.; Sunna, N. Microbial regrowth in household water storage tanks. J. Am. Water Work Assoc. 2001, 93, 85–94. [Google Scholar]
  19. Van der Sterren, M.; Rahman, A.; Dennis, G.R. Quality and Quantity Monitoring of Five Rainwater Tanks in Western Sydney, Australia. J. Environ. Eng. 2013, 139, 332–340. [Google Scholar] [CrossRef]
  20. Sazakli, E.; Alexopoulos, A.; Leotsinidis, M. Rainwater harvesting, quality assessment and utilization in Kefalonia Island, Greece. Water Res. 2007, 41, 2039–2047. [Google Scholar] [CrossRef] [PubMed]
  21. Mwenge Kahinda, J.; Taigbenu, A.E. Rainwater harvesting in South Africa: Challenges and opportunities. Phys. Chem. Earth 2011, 36, 968–976. [Google Scholar] [CrossRef]
  22. Ndiritu, J.G.; McCarthy, S.; Tshirangwana, N. Probabilistic assessment of the rainwater harvesting potential of schools in South Africa. Proc. Int. Assoc. Hydrol. Sci. 2014, 364, 435–440. [Google Scholar] [CrossRef]
  23. Prinsloo, D.A. Classification and Hierarchy of Retail Facilities in South Africa; Urban Studies: Johannesburg, South Africa, 2010; 76p. [Google Scholar]
  24. Green Building Council of South Africa. Green Star South Africa: Office V1.1 Technical Manual; Green Building Council of South Africa: Cape Town, South Africa, 2014. [Google Scholar]
  25. Fonseca, C.R.; Hidalgo, V.; Díaz-Delgado, C.; Vilchis-Francés, A.Y.; Gallego, I. Design of optimal tank size for rainwater harvesting systems through use of a web application and geo-referenced rainfall patterns. J. Clean. Prod. 2017, 145, 323–335. [Google Scholar] [CrossRef]
  26. Hanson, L.S.; Vogel, R.M. Generalized storage-reliability-yield relationships for rainwater harvesting systems. Environ. Res. Lett. 2014, 9. [Google Scholar] [CrossRef]
  27. Campisano, A.; Modica, C. Optimal sizing of storage tanks for domestic rainwater harvesting in Sicily. Resour. Conserv. Recycl. 2012, 63, 9–16. [Google Scholar] [CrossRef]
  28. Liaw, C.H.; Chiang, Y.C. Dimensionless analysis for designing domestic rainwater harvesting systems at the regional level in Northern Taiwan. Water 2014, 6, 3913–3933. [Google Scholar] [CrossRef]
  29. Imteaz, M.A.; Ahsan, A.; Shanableh, A. Reliability analysis of rainwater tanks using daily water balance model: Variations within a large city. Resour. Conserv. Recycl. 2013, 77, 37–43. [Google Scholar] [CrossRef]
  30. Liaw, C.; Tsai, Y. Optimum Storage Volume of Rooftop Rain Water Harvesting Systems for Domestic Use. J. Am. Water Resour. Assoc. 2004, 901–912. [Google Scholar] [CrossRef]
  31. Notaro, V.; Liuzzo, L.; Freni, G. Reliability Analysis of Rainwater Harvesting Systems in Southern Italy. Procedia Eng. 2016, 162, 373–380. [Google Scholar] [CrossRef]
  32. Imteaz, M.A.; Adeboye, O.B.; Rayburg, S.; Shanableh, A. Rainwater harvesting potential for southwest Nigeria using daily water balance model. Resour. Conserv. Recycl. 2012, 62, 51–55. [Google Scholar] [CrossRef]
  33. Prinsloo, D.A. Benchmarking the South African Shopping Centre Industry International and Local Trends; South African Council of Shopping Centres, Shopping Centre Directory: Gauteng, South Africa, 2013. [Google Scholar]
  34. Lynch, S. The Development of a Raster Database of Annual, Monthly and Daily Rainfall for Southern Africa; WRC Report No. 1156/0/1; Water Research Commission: Pretoria, Southern Africa, 2003. [Google Scholar]
  35. Council for Science and Industiral Research. Guidelines for Human Settlement Plannning and Design; Council for Science and Industiral Research: New Delhi, Delhi, 2005; Volume 2. [Google Scholar]
  36. Saunders, A. Shopping Centre Water Efficiency Report; HFM Asset Management: Perth, Australia, 2012. [Google Scholar]
  37. Santos, C.; Taveira-Pinto, F. Analysis of different criteria to size rainwater storage tanks using detailed methods. Resour. Conserv. Recycl. 2013, 71, 1–6. [Google Scholar] [CrossRef]
  38. Ndiritu, J.; Odiyo, J.O.; Makungo, R.; Ntuli, C.; Mwaka, B. Yield-reliability analysis for rural domestic water supply from combined rainwater harvesting and run-of-river abstraction. Hydrol. Sci. J. 2011, 56, 238–248. [Google Scholar] [CrossRef]
  39. Ward, S.; Memon, F.A.; Butler, D. Rainwater harvesting: Model-based design evaluation. Water Sci. Technol. 2010, 61, 85–96. [Google Scholar] [CrossRef] [PubMed]
  40. Su, M.D.; Lin, C.H.; Chang, L.F.; Kang, J.L.; Lin, M.C. A probabilistic approach to rainwater harvesting systems design and evaluation. Resour. Conserv. Recycl. 2009, 53, 393–399. [Google Scholar] [CrossRef]
  41. Yaziz, M.I.; Gunting, H.; Sapari, N.; Ghazali, A.W. Variations in rainwater quality from roof catchments. Water Res. 1989, 23, 761–765. [Google Scholar] [CrossRef]
  42. Silva Vieira, A.; Weeber, M.; Ghisi, E. Self-cleaning filtration: A novel concept for rainwater harvesting systems. Resour. Conserv. Recycl. 2013, 78, 67–73. [Google Scholar] [CrossRef]
  43. Fewkes, A. Modelling the performance of rainwater collection systems: Towards a generalised approach. Urban Water. 2000, 1, 323–333. [Google Scholar] [CrossRef]
  44. Berwanger, H.; Ghisi, E. Investment feasibility analysis of rainwater harvesting in the city of Itapiranga, Brazil. Int. J. Sustain. Hum. Dev. 2014, 2, 104–114. [Google Scholar]
  45. Melville-Shreeve, P.; Ward, S.; Butler, D. Rainwater harvesting typologies for UK houses: A multi criteria analysis of system configurations. Water 2016, 8. [Google Scholar] [CrossRef] [Green Version]
  46. Mashau, F. Rainwater Harvesting for Multiple Uses in Siloam Village of Limpopo Province, South Africa; Unpublished Honours Research Dissertation; University of Venda: Thohoyandou, South Africa, 2006. [Google Scholar]
  47. Ghisi, E.; Tavares, D.D.F.; Rocha, V.L. Rainwater harvesting in petrol stations in Brasília: Potential for potable water savings and investment feasibility analysis. Resour. Conserv. Recycl. 2009, 54, 79–85. [Google Scholar] [CrossRef]
  48. Basson, M.S.; Allen, R.B.; Pegram, G.G.S.; Van Rooyen, J. Probabilistic Management of Water Resource and Hydropower Systems; Water Resources Publications: Littleton, CO, USA, 1994. [Google Scholar]
  49. Basson, M.S.; van Rooyen, J.A. Practical Application of Probabilistic Approaches to the Management of Water Resource Systems. J. Hydrol. 2001, 241, 53–61. [Google Scholar] [CrossRef]
  50. Ndiritu, J.; Odiyo, J.; Makungo, R.; Mwaka, B.; Mthethwa, N.; Ntuli, C.; Andanje, A. Development of probabilistic operating rules for Hluhluwe Dam, South Africa. Phys. Chem. Earth 2017, 100, 343–352. [Google Scholar] [CrossRef]
  51. Weibull, W. A statistical theory of strength of materials. Ing. Vetensk. Akad. Handl. 1939, 151, 1–45. [Google Scholar]
  52. Cunnane, C. Unbiased plotting positions—A review. J. Hydrol. 1978, 37, 205–222. [Google Scholar] [CrossRef]
  53. Makkonen, L. Plotting positions in extreme value analysis. J. Appl. Meteorol. Climatol. 2006, 45, 334–340. [Google Scholar] [CrossRef]
  54. Imteaz, M.A.; Shanableh, A.; Rahman, A.; Ahsan, A. Optimisation of rainwater tank design from large roofs: A case study in Melbourne, Australia. Resour. Conserv. Recycl. 2011, 55, 1022–1029. [Google Scholar] [CrossRef]
  55. City of Johannesburg. Climate Change Adaptation Plan; City of Johannesburg: Johannesburg, South Africa, 2009. [Google Scholar]
Figure 1. Location of selected rainfall stations.
Water 09 00771 g001
Figure 2. Time series, Rainfall–Duration and Rain Days–Duration curves of annual rainfall.
Water 09 00771 g002
Figure 3. Rainwater harvesting system simulation components.
Water 09 00771 g003
Figure 4. Illustration of within-year storage behaviour.
Water 09 00771 g004
Figure 5. Illustration of the hydrologic optimality of storage, yield and reliability using the Capricon Square RWH system.
Water 09 00771 g005
Figure 6. Linear yield–reliability plots for specified tank size.
Water 09 00771 g006
Figure 7. Generalized relationships among supply, demand and level of supply.
Water 09 00771 g007
Figure 8. Relationships between supply level and supply-to-demand ratio model parameters with reliability.
Water 09 00771 g008
Figure 9. Generalized relationships among level of supply, demand and tank size.
Water 09 00771 g009
Figure 10. Relationships between tank size are demand ratio model parameters with reliability.
Water 09 00771 g010
Figure 11. Charts of generalized model for analysing hydrologically optimal RWH systems.
Water 09 00771 g011
Figure 12. Relationships between reliability-level of supply slope and proportion of supply.
Water 09 00771 g012
Figure 13. Relationship between parameters of slope-supply level model and reliability.
Water 09 00771 g013
Figure 14. Illustration of yield–reliability modelling for non-optimal RWH systems.
Water 09 00771 g014
Figure 15. Generalized model and daily simulation storage–reliability relationships.
Water 09 00771 g015
Figure 16. Generalized model and simulation yield–reliability relationships for hydrologically optimal systems.
Water 09 00771 g016
Figure 17. Generalized model and simulation yield–reliability relationships for hydrologically non-optimal systems.
Water 09 00771 g017
Figure 18. Maponya mall RWH system yield–reliability relationships for current and the climatic “near future” condition.
Water 09 00771 g018
Table 1. Selected shopping centres and rainfall stations.
RegionMallRetail Area (m2)Roof Area (m2)Rainfall Station No.Distance from Mall (km)
GautengSandton City128,00083,4720476093 W6.67
South Gate Mall89,70045,3490476044 W6.24
Norwood Mall32,34432,1940476129 W0.43
Braamfontein Centre21,30934160475881 W0.97
Grayston Centre500041980476093 W5.68
Cape TownCanal Walk141,00026,0820020896 W4.38
Tygervally Centre90,00055,4030021230 W4.74
Willow Bridge40,05123,3900021230 W3.95
Howard Centre15,00014,0520021055 w2.88
Capricon Square588963740020839 W13.11
LimpopoMall of the North75,00035,1990678023 W1.26
Savanah Mall37,00017,8800677834 W2.15
Limpopo Mall27,76674460677834 W1.81
Cycad Shopping Centre12,00052670677834 W0.94
Kwa Zulu NatalGateway Mall180,000123,498/73,313 *0241103 W0.97
Liberty Midlands Mall75,00074,702/55,241 *0239605 P3.21
Musgrave Centre39,88620,0580240738 W8.36
Phoenix Plaza24,16229,307/18,070 *0241042 W2.72
Granada Square581820970241103 W2.15
NWMatlosana65,00050,100/40,000 !0436495 W8.03
FSMimosa25,00052970261368 W2.30
MPRiverside49,52945,0000556088 W9.02
ECBaywest90,00045,3510035209 W14.85
Note: * Reduced area to ensure within-year storage behaviour, centres in italics were used for model verification; ! Reduced area to diversify supply to demand ratios in verification.
Table 2. Rainfall station information.
Rainfall Station No.MAP (mm/Year)Length of Data (Years)Percentage of Observed of DataPercentage of In-Filled DataPercentage of Missing Data
0476093 W55210755.240.93.9
0476044 W72710775.720.43.9
0476129 W75210773.722.43.9
0475881 W78810784.411.73.9
0020896 W56314944.354.71.0
0021230 W58615047.852.10.1
0021055 W48314960.638.41.0
0020839 W118314944.454.61.0
0678023 W4649683.116.90.0
0677834 W4859692.97.10.0
0241103 W114412559.637.52.9
0239605 P92510767.931.20.9
0240738 W87612745.752.41.9
0241042 W107212549.148.02.9
0436495 W5888297.92.10.0
0556088 W7189869.430.60.0
0261368 W5509791.98.10.0
0035209 W59012454.045.80.2
Note: Rainfall stations in italics were used for model verification.
Table 3. Yield and storage capacities of hydrologically optimum systems at various reliabilities.
Shopping CentreReliability (%)8590959899
South GateYield *14213212210172
Storage **47504250275015001500
BraamfonteinYield1211876
Storage1301609013090
GraystonYield7061554540
Storage240165240150105
NorwoodYield116107958476
Storage18003200200016001600
SandtonYield1201121046968
Storage68006800560020001600
CapriconYield242228195172161
Storage3000375012501000750
HowardYield9184776963
Storage800550500350300
Willow BridgeYield3532282625
Storage1000600450450450
Tyger ValleyYield139125117108101
Storage51003300300024002400
Canal WalkYield211916128
Storage7501125750450300
Mall of NorthYield6558544430
Storage40003250300020001250
SavanahYield2322181311
Storage525825825525525
LimpopoYield161511108
Storage240300240390270
CycadYield2322181312
Storage160240240160180
Gateway-Reduced areaYield14013110810185
Storage32,00024,00010,00080006000
Liberty-reduced areaYield243196162142138
Storage15,3009000450027001800
MusgraveYield4137302718
Storage11001000600600400
Phoenix-reduced areaYield15314312110490
Storage75008500250015001500
GranadaYield4639332726
Storage25513512090105
Note: * expected number of days of full supply per year; ** Storage capacity (m3).