
Tracing Nitrate-Nitrogen Sources and Modifications in a Stream Impacted by Various Land Uses, South Portugal


Abstract
:1. Introduction
2. Methodology
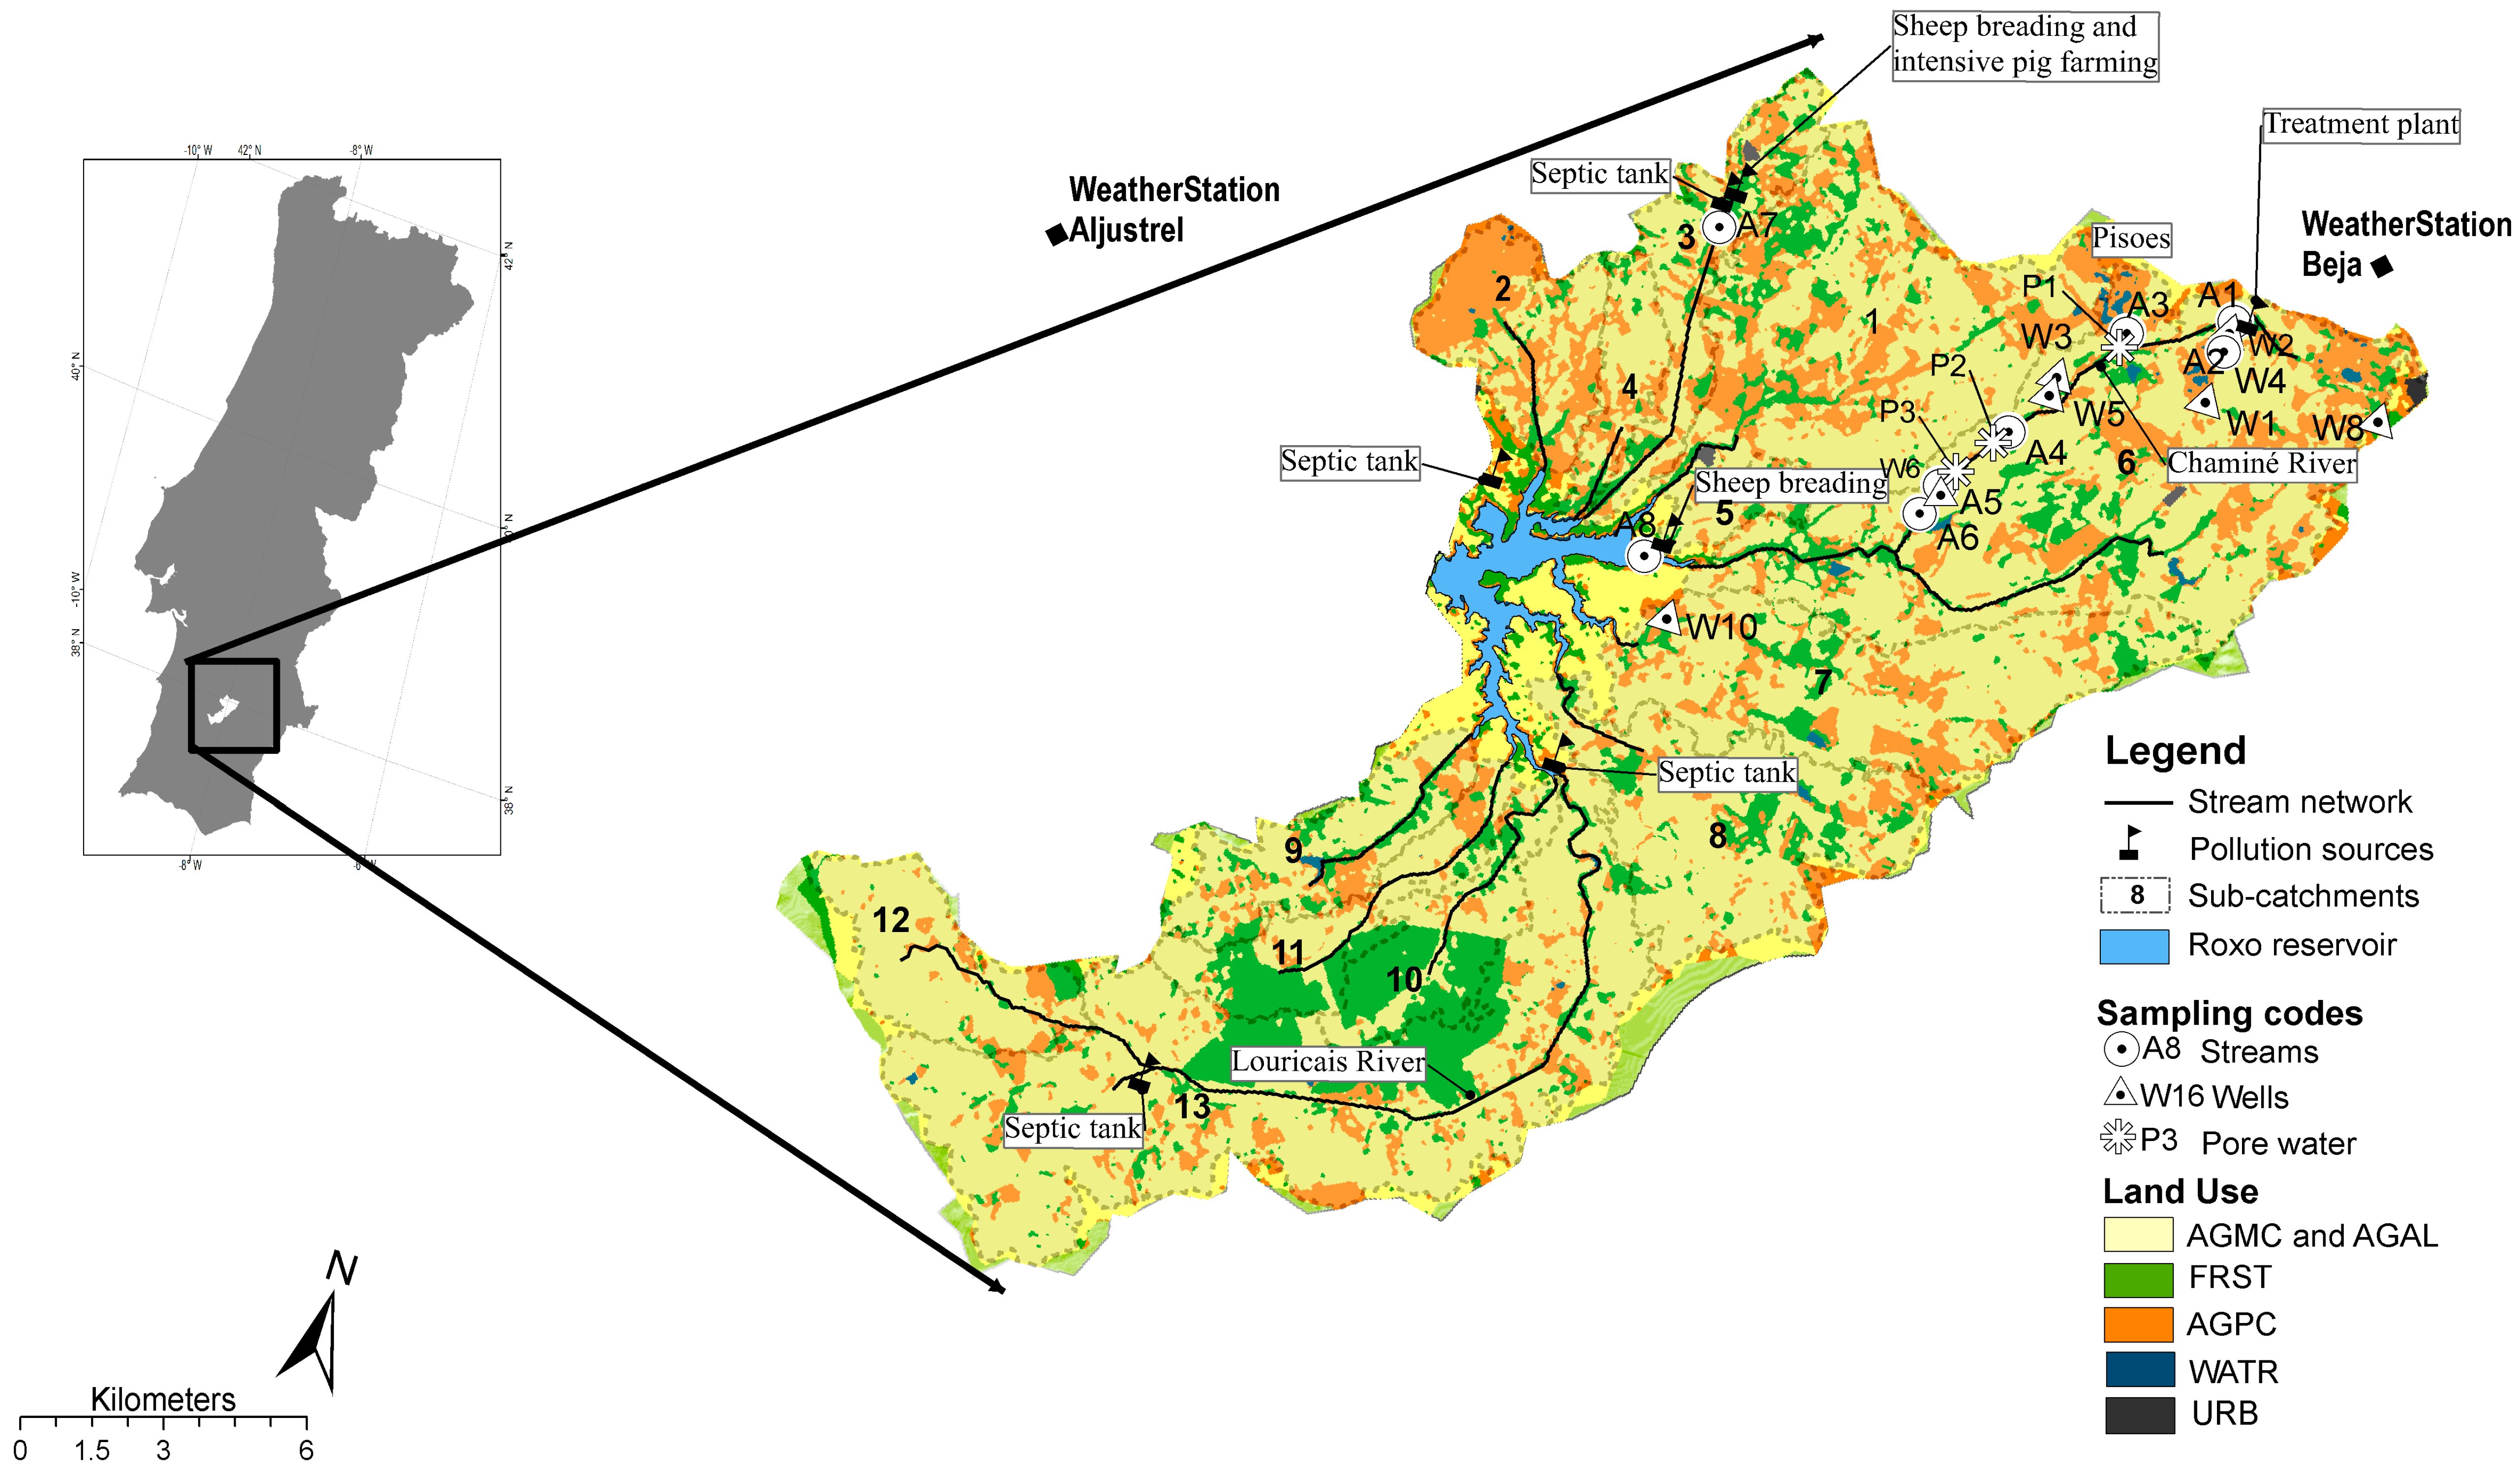
2.1. Study Area
2.2. Water Sampling
2.3. Stable Isotope Calculations
2.4. Reactive Transport Model
3. Results
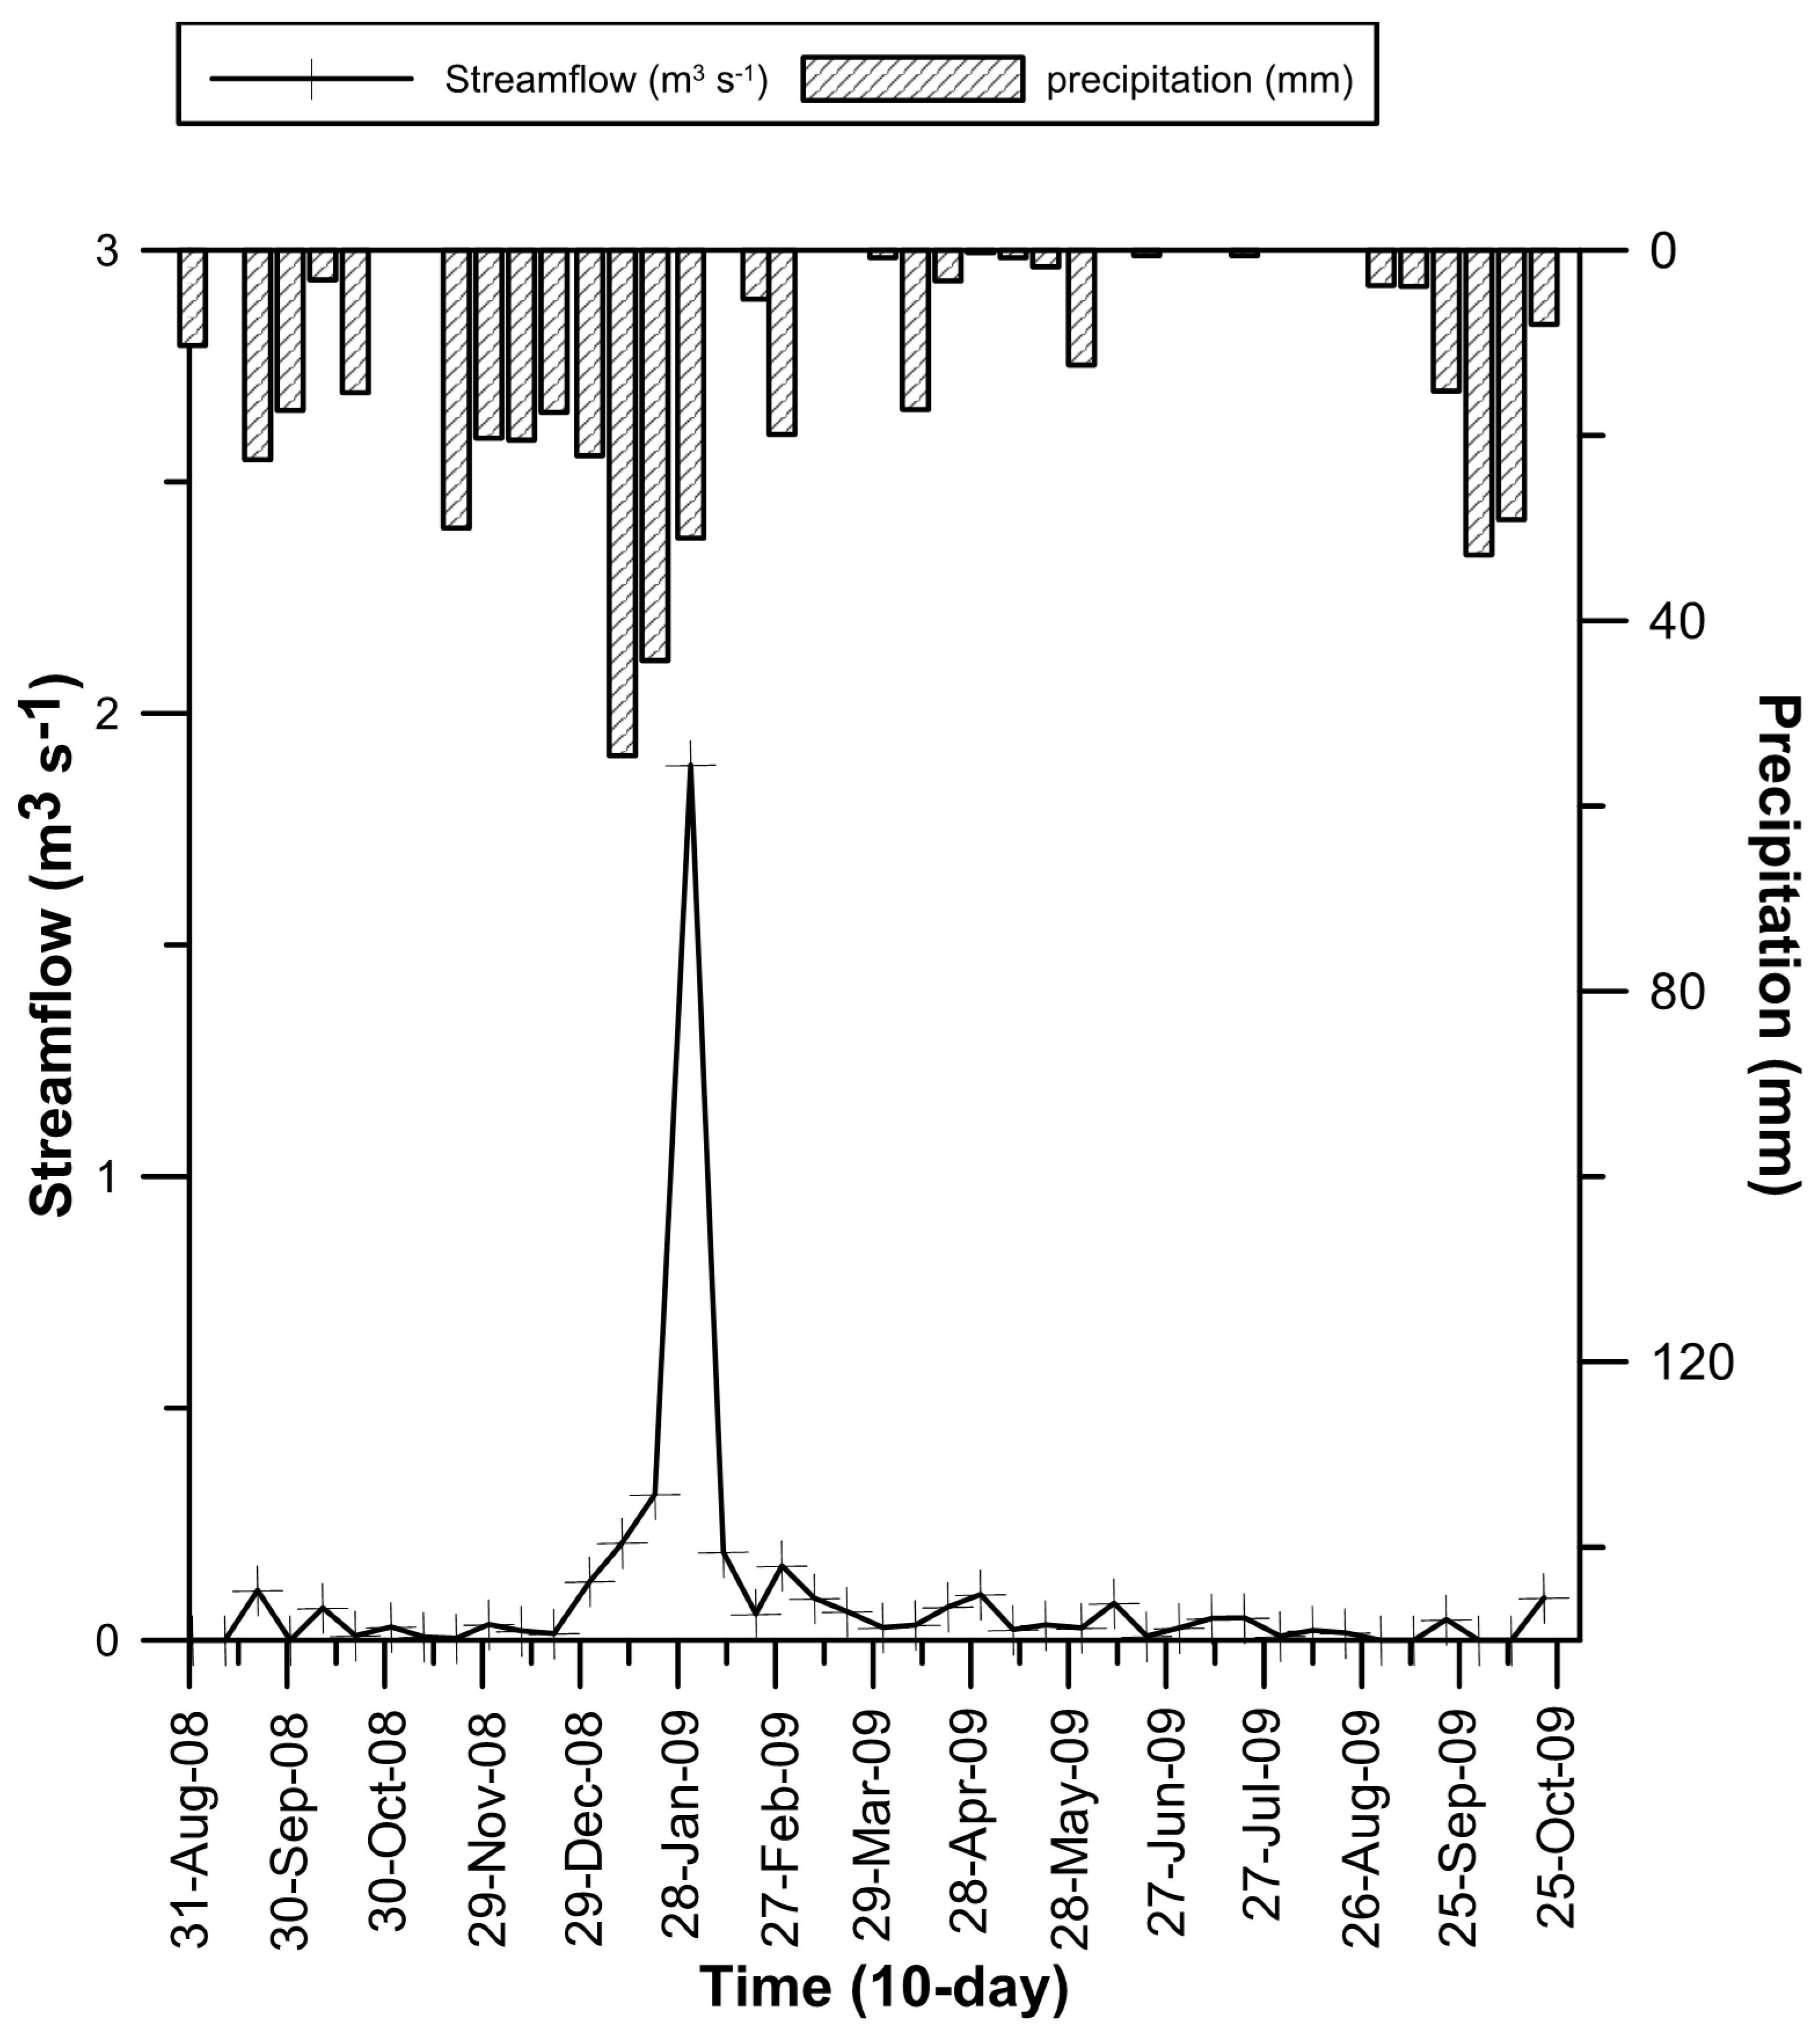
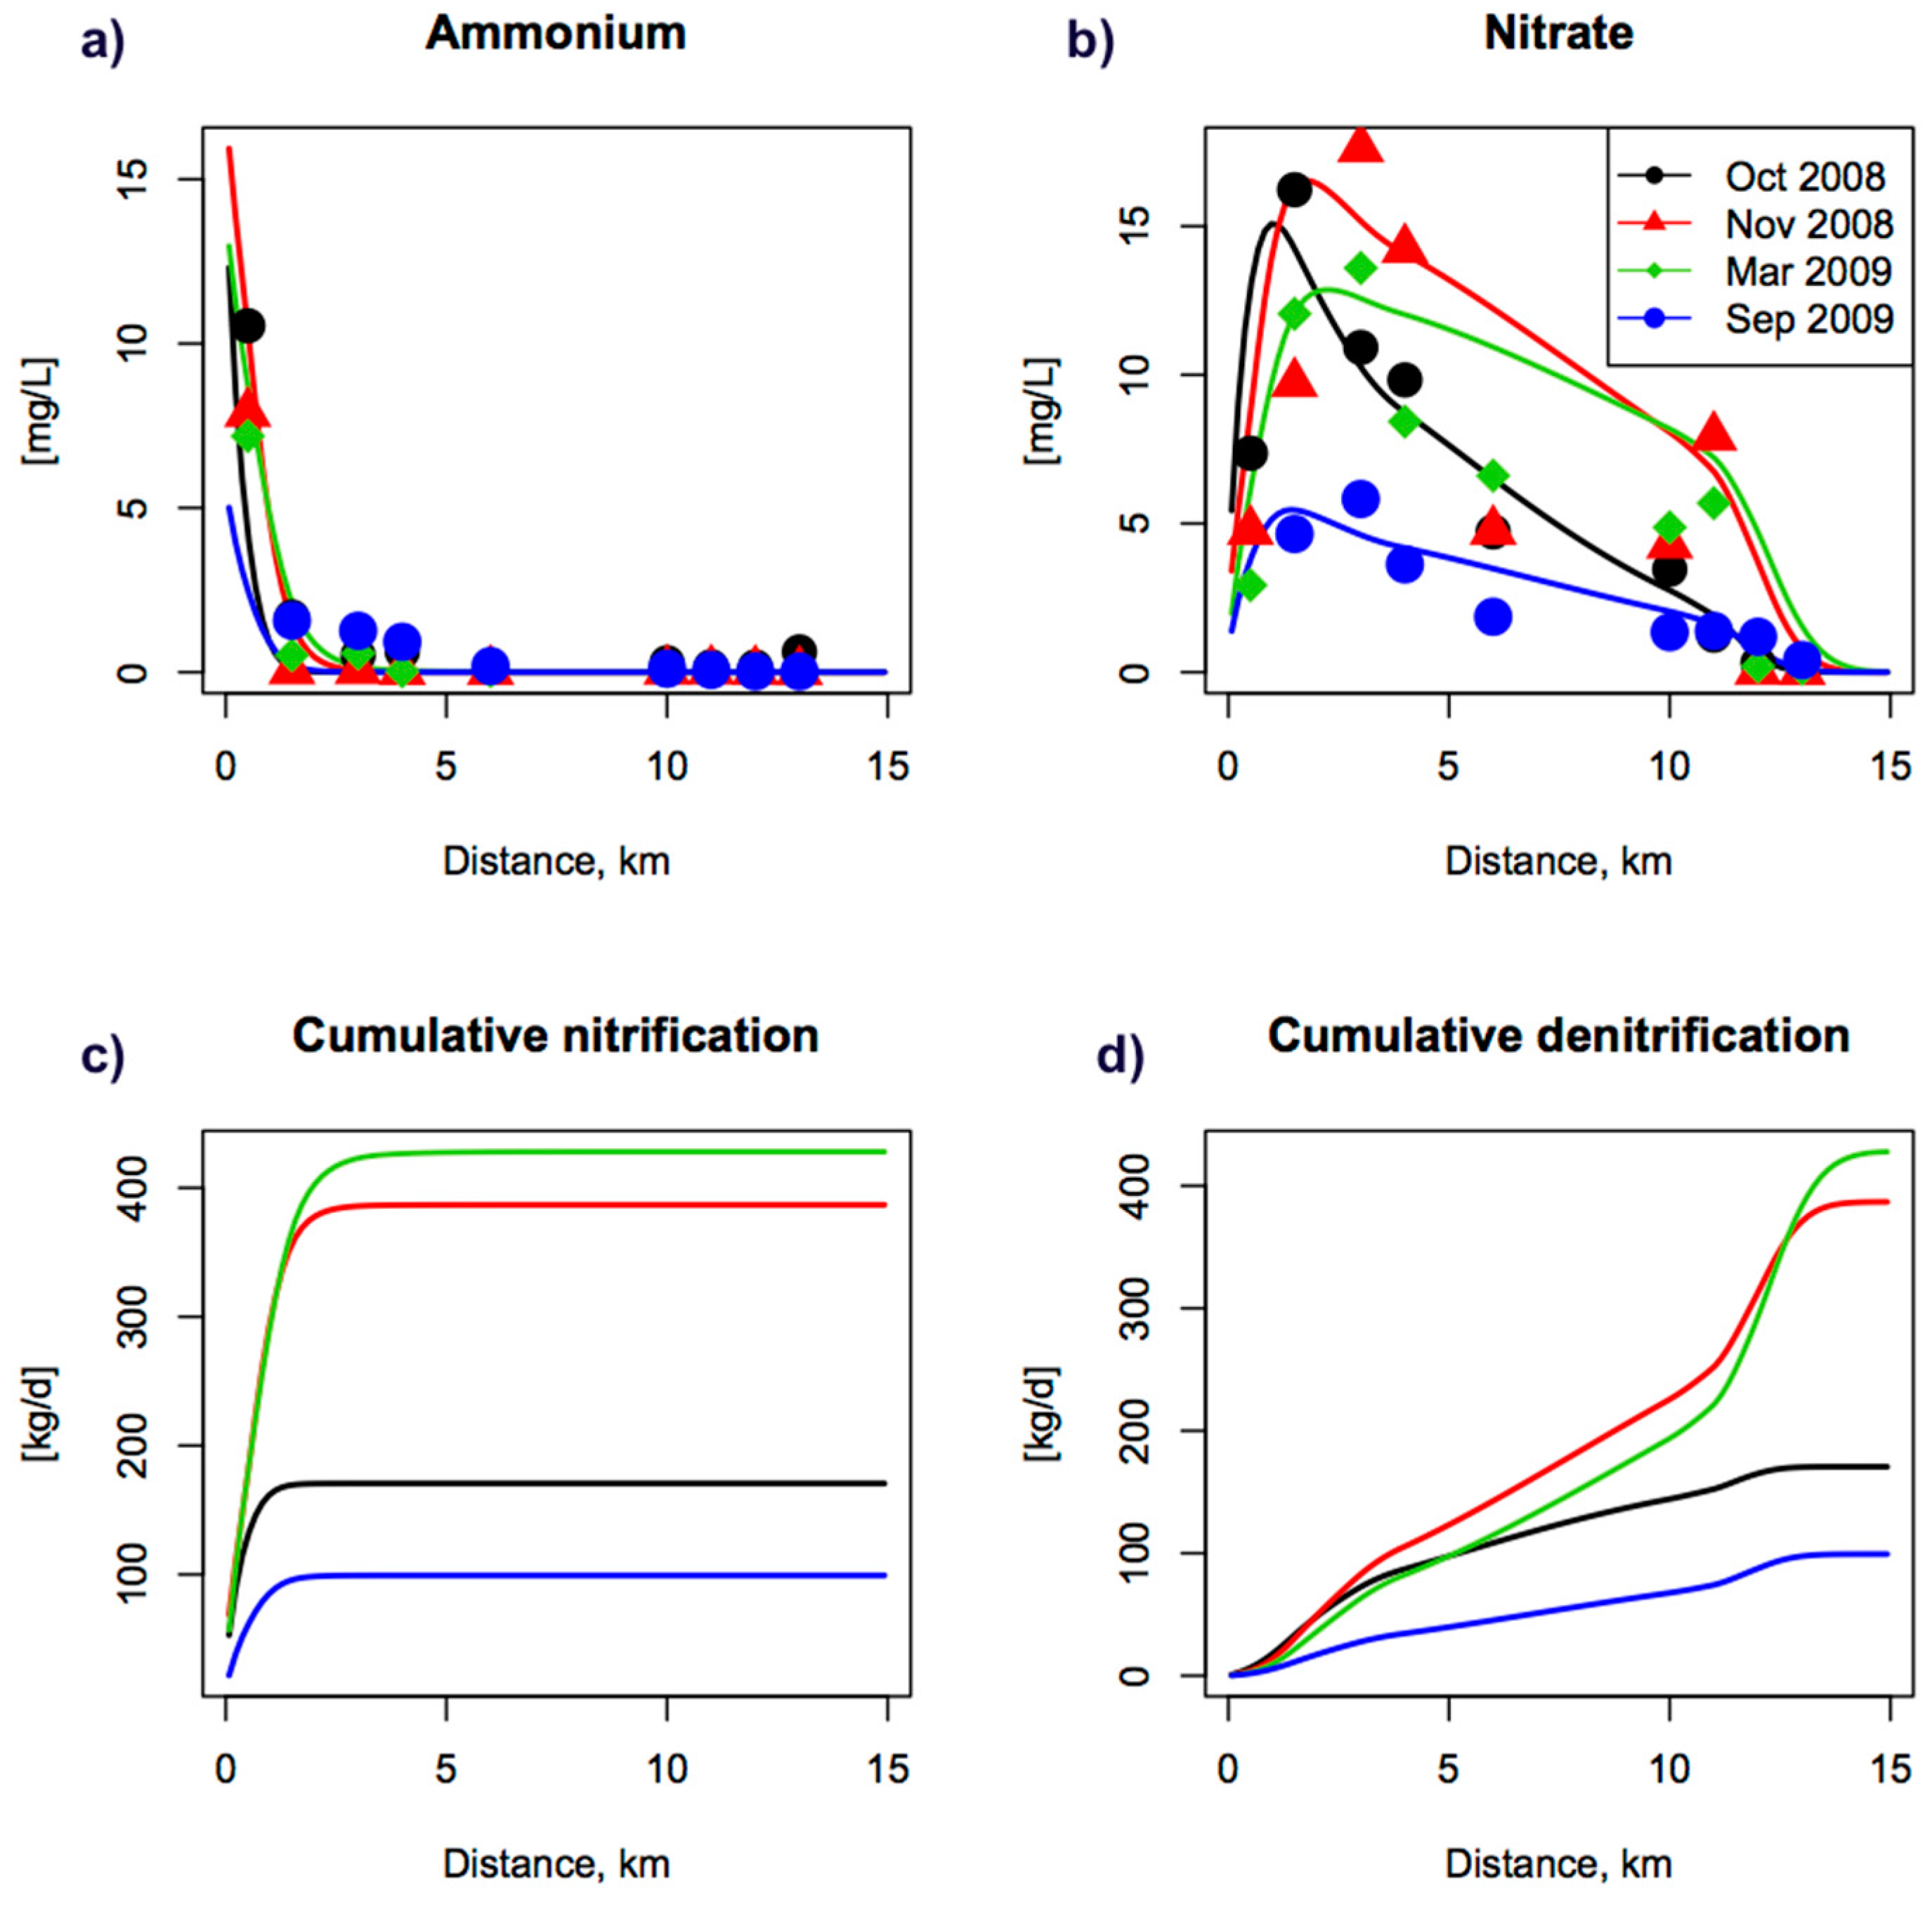
3.1. Solutes and Reactive Transport Modelling
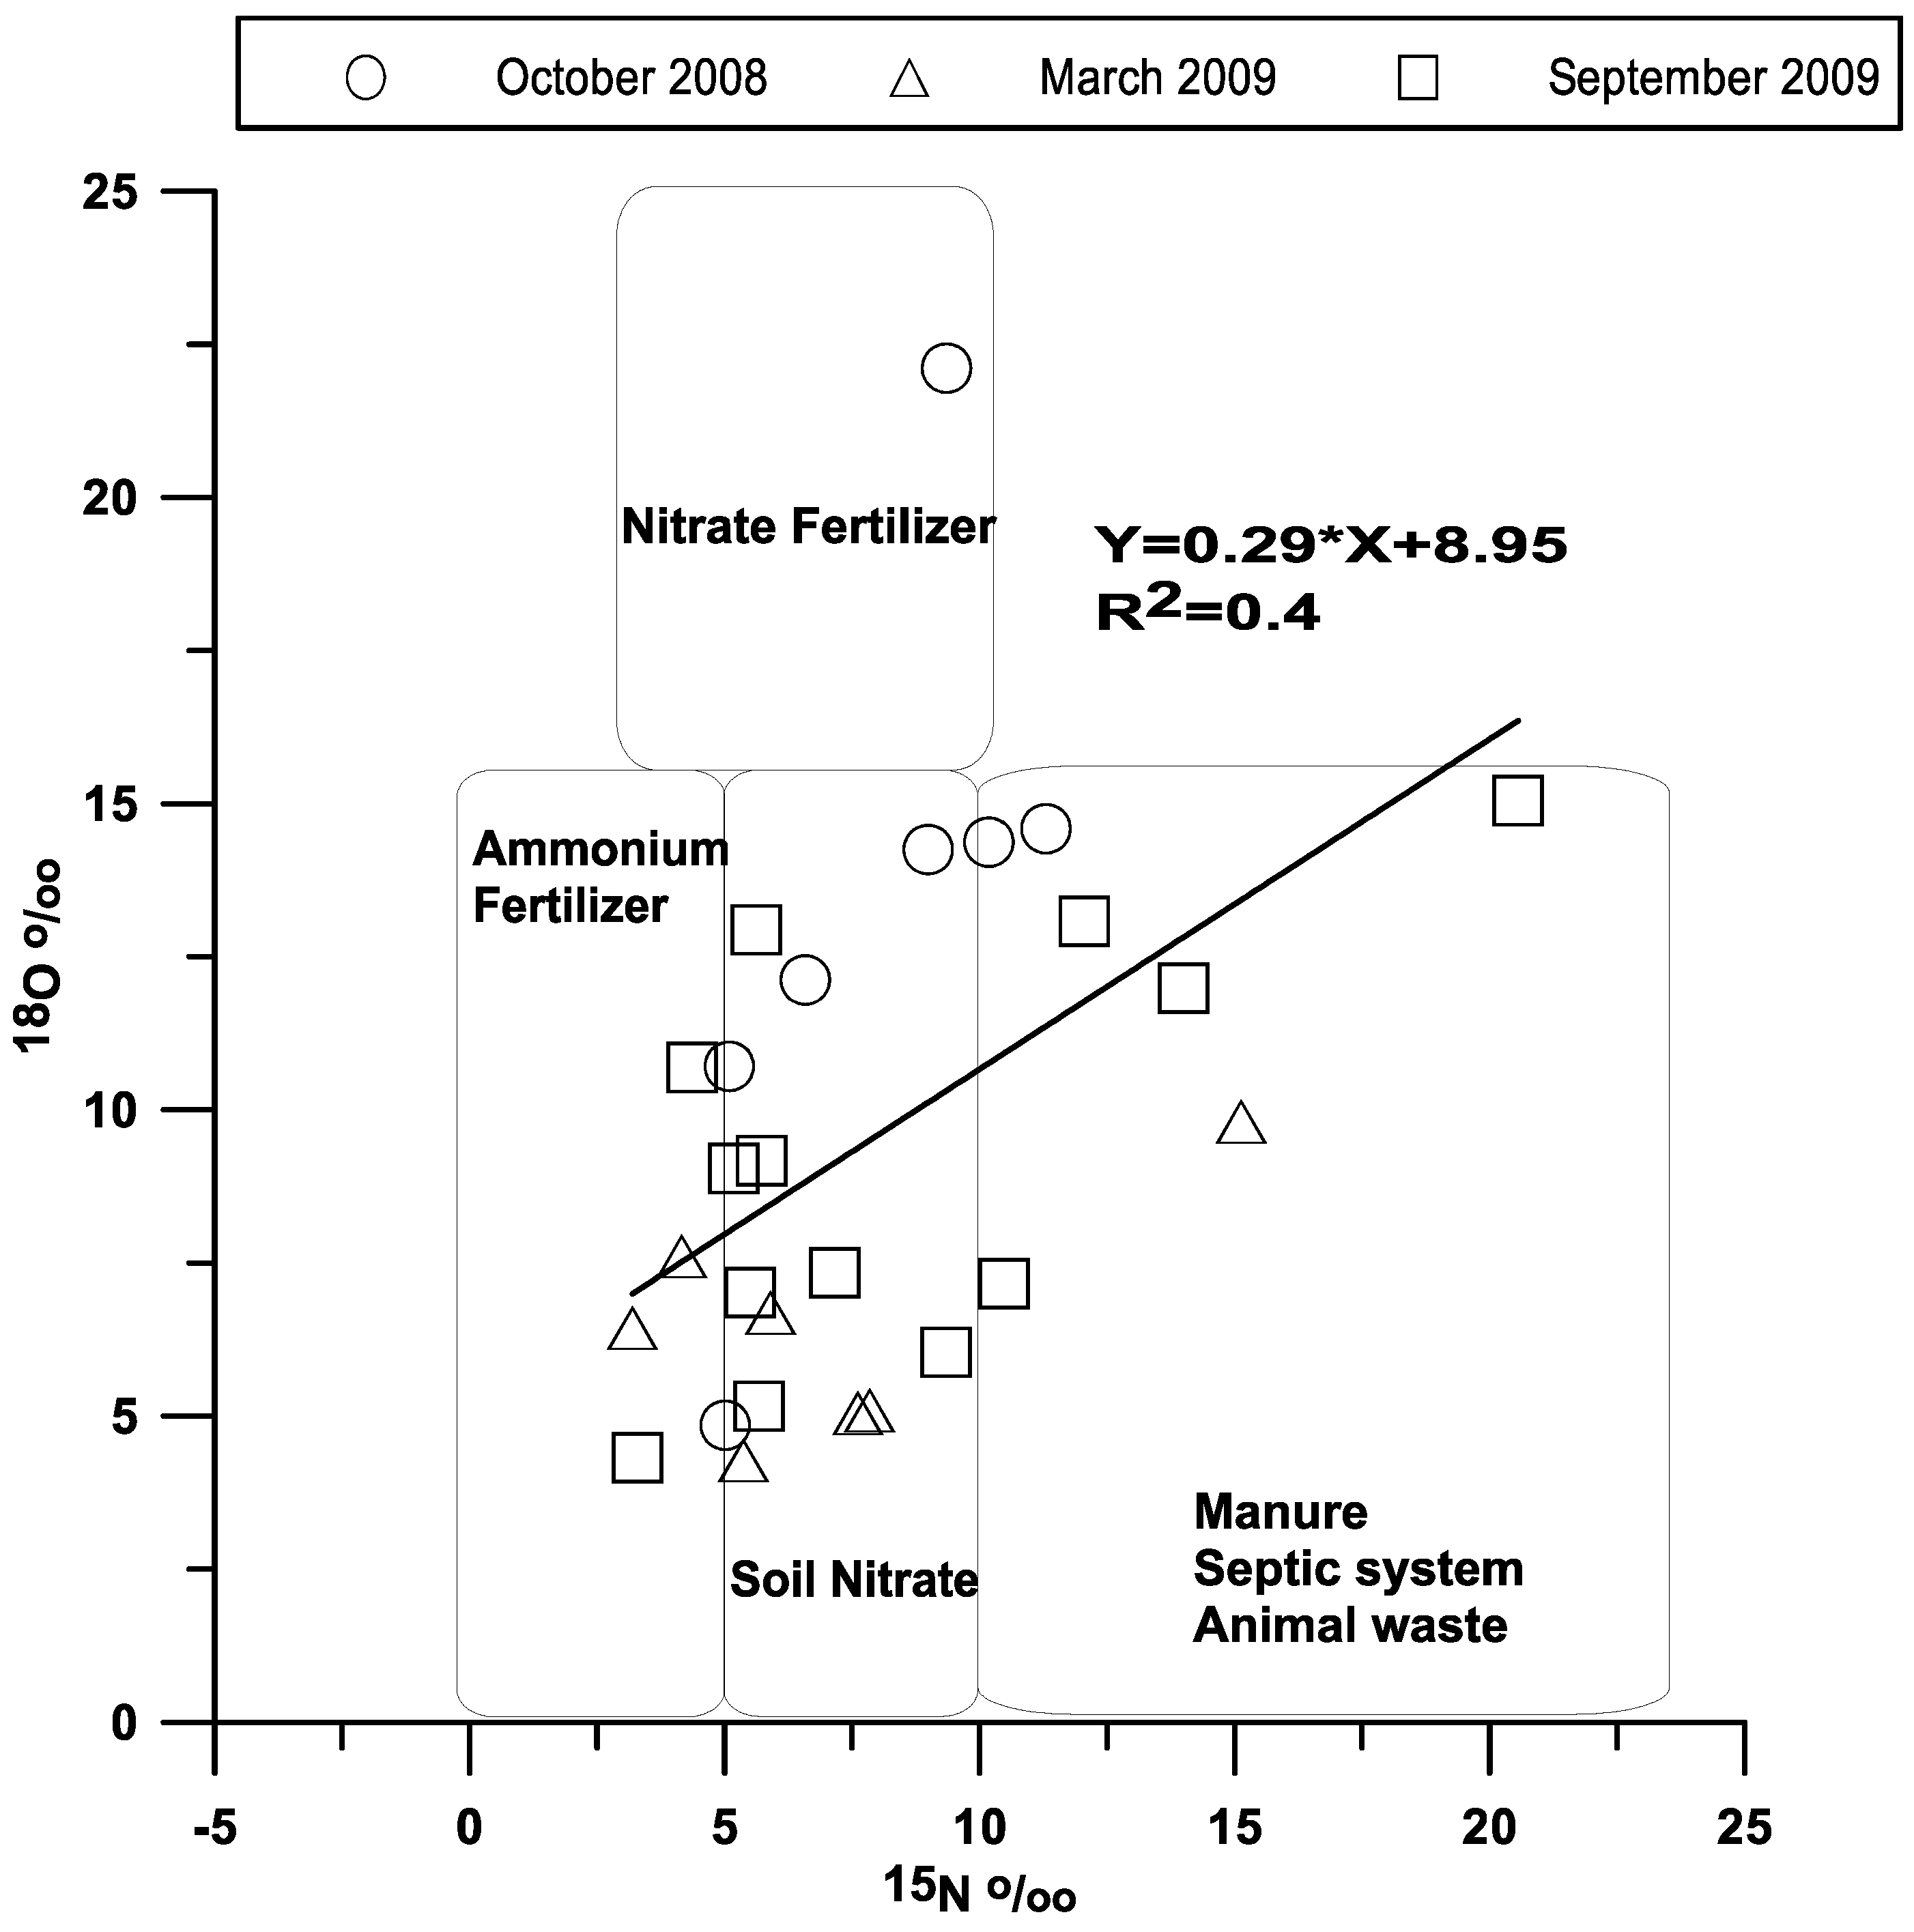
3.2. Sources of Nitrate-Nitrogen in Stream Surface Waters
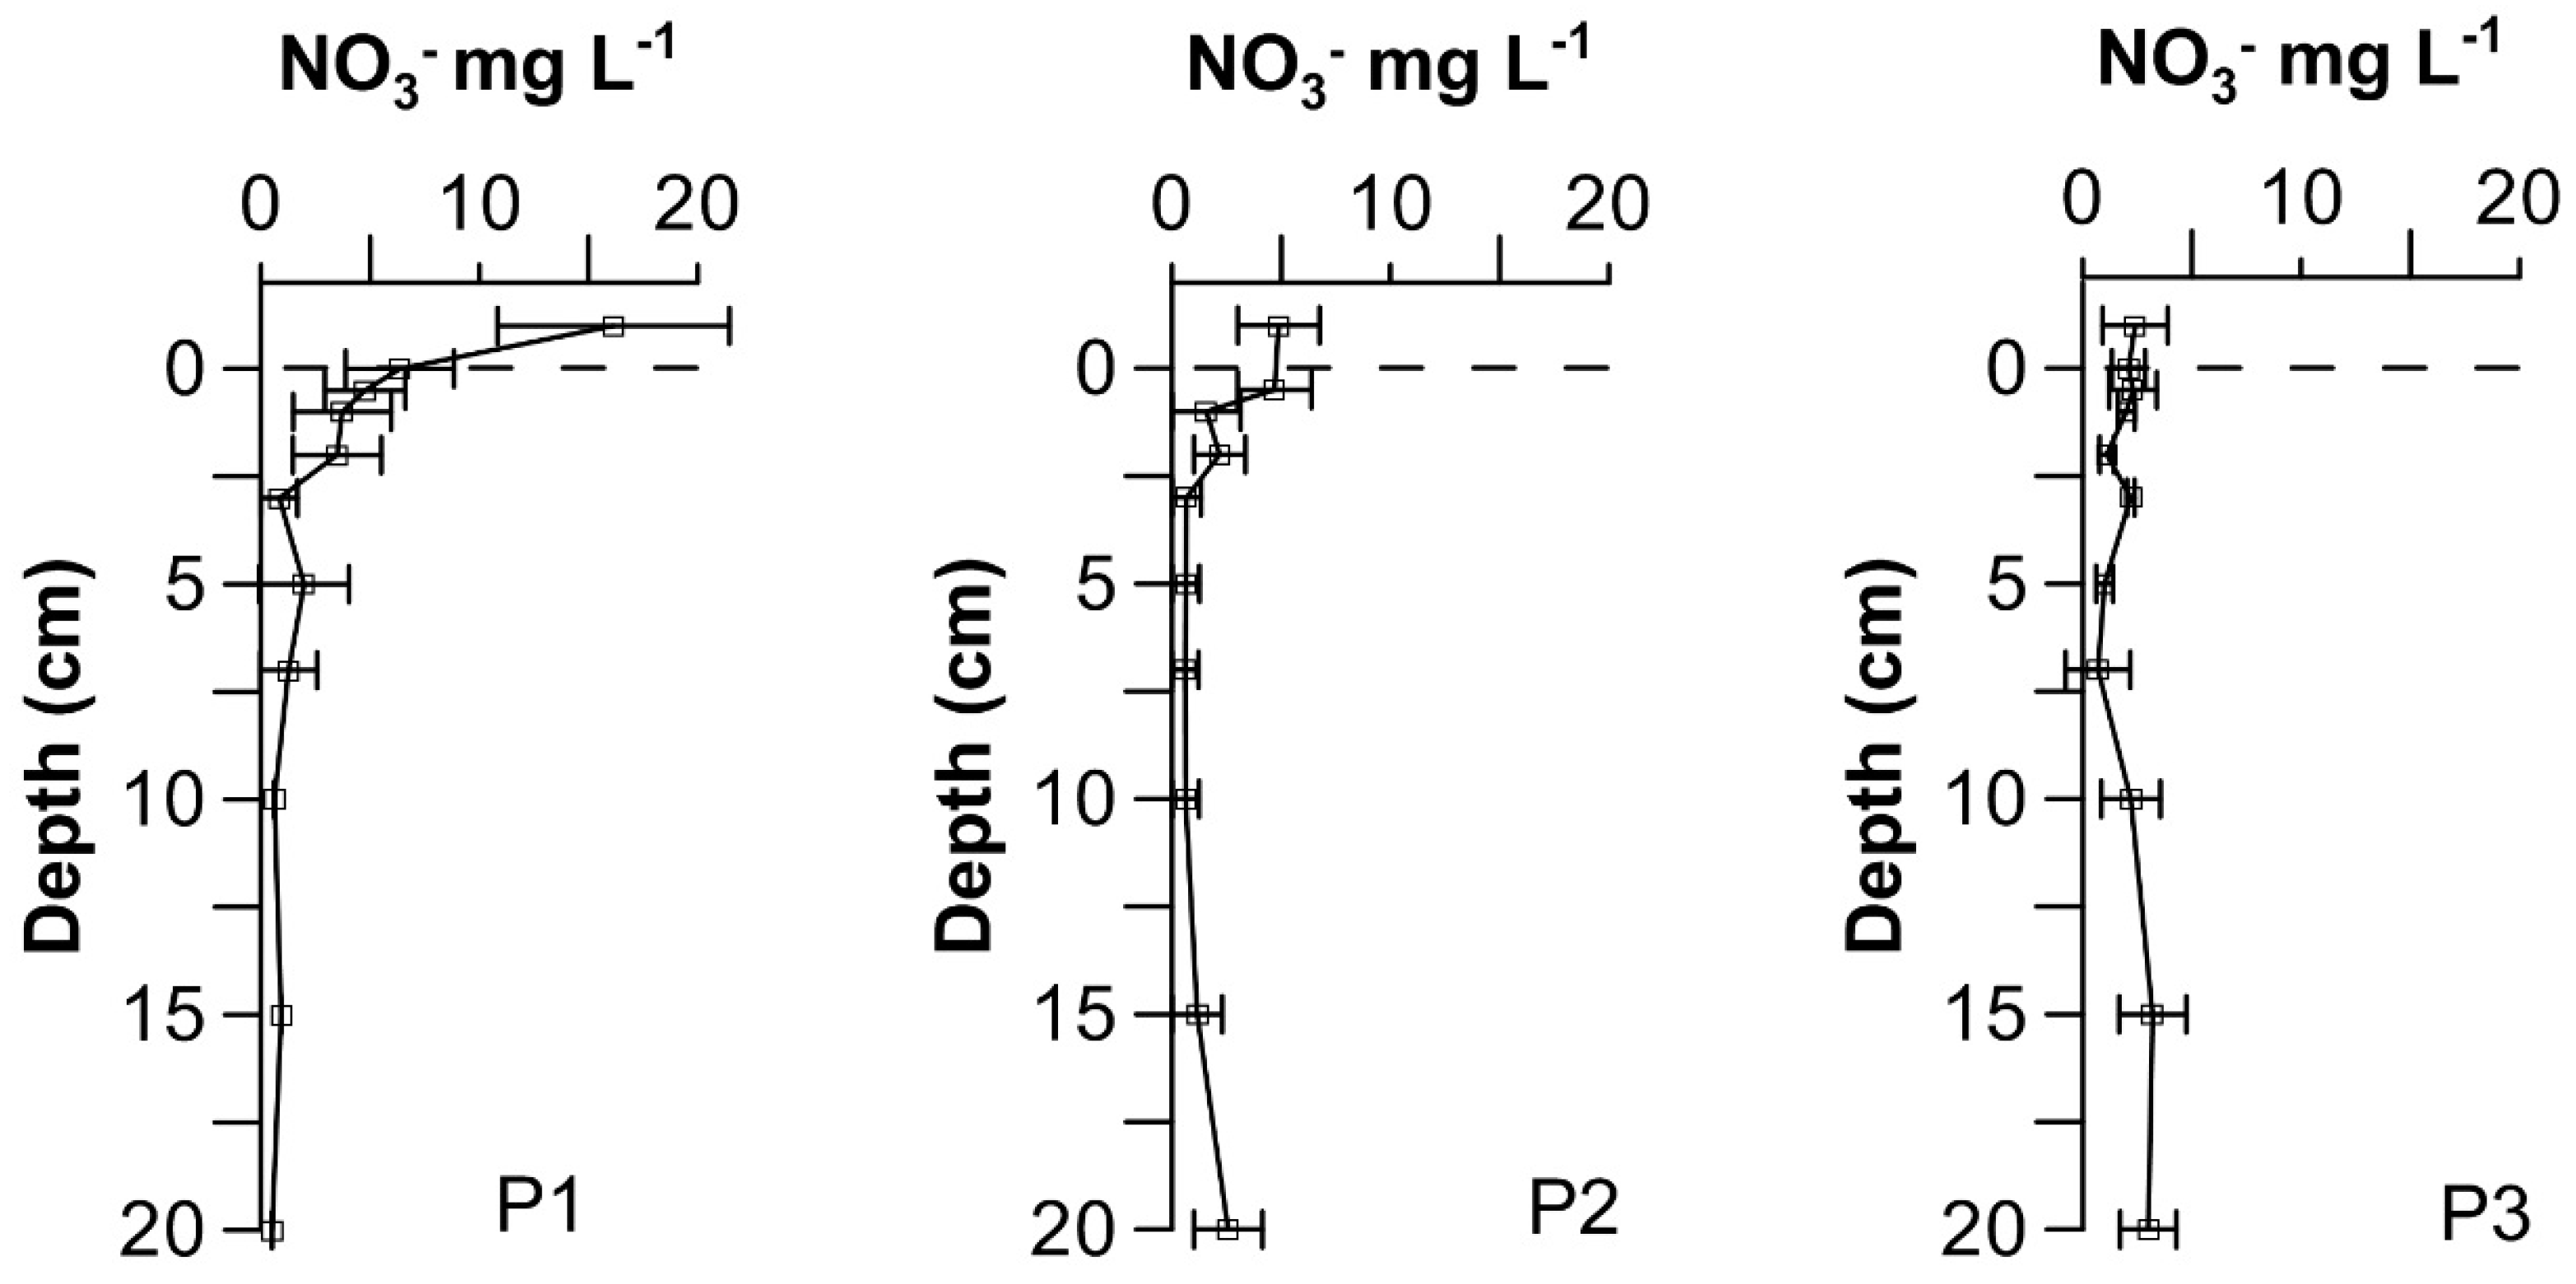
3.3. NO3-N Distribution in the Pore Waters
4. Discussion
4.1. Inorganic N in Surface Waters
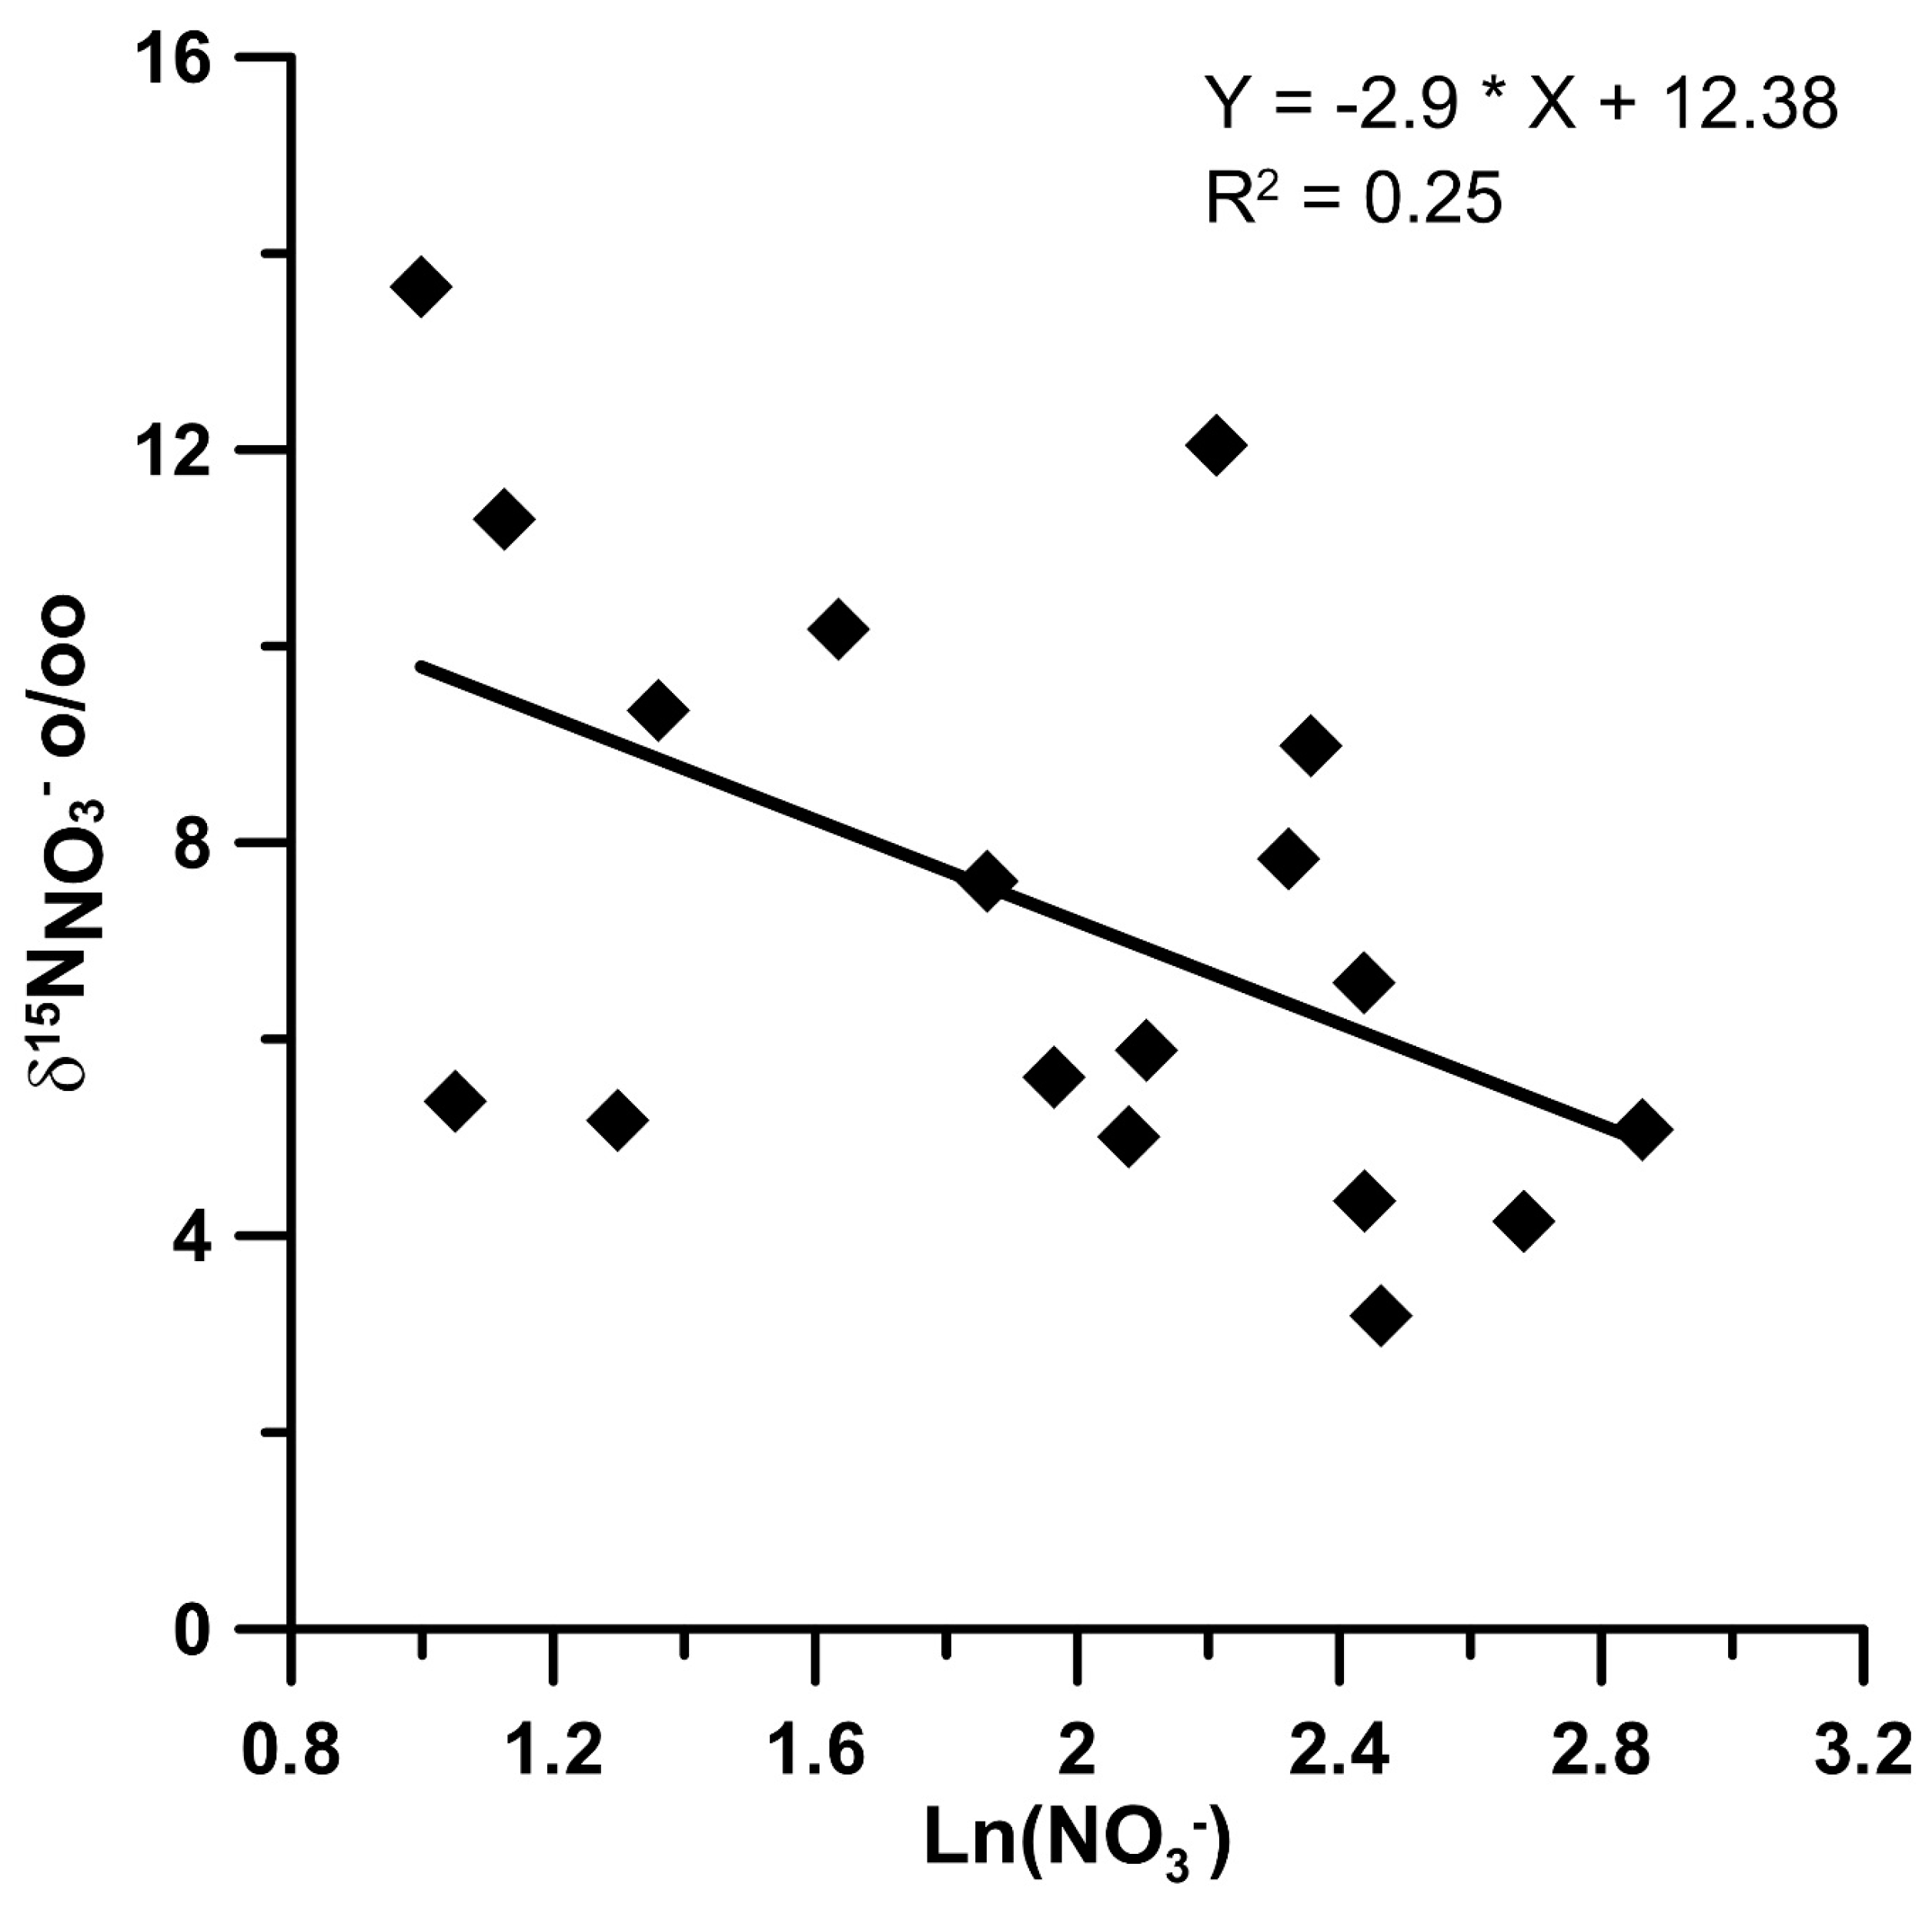
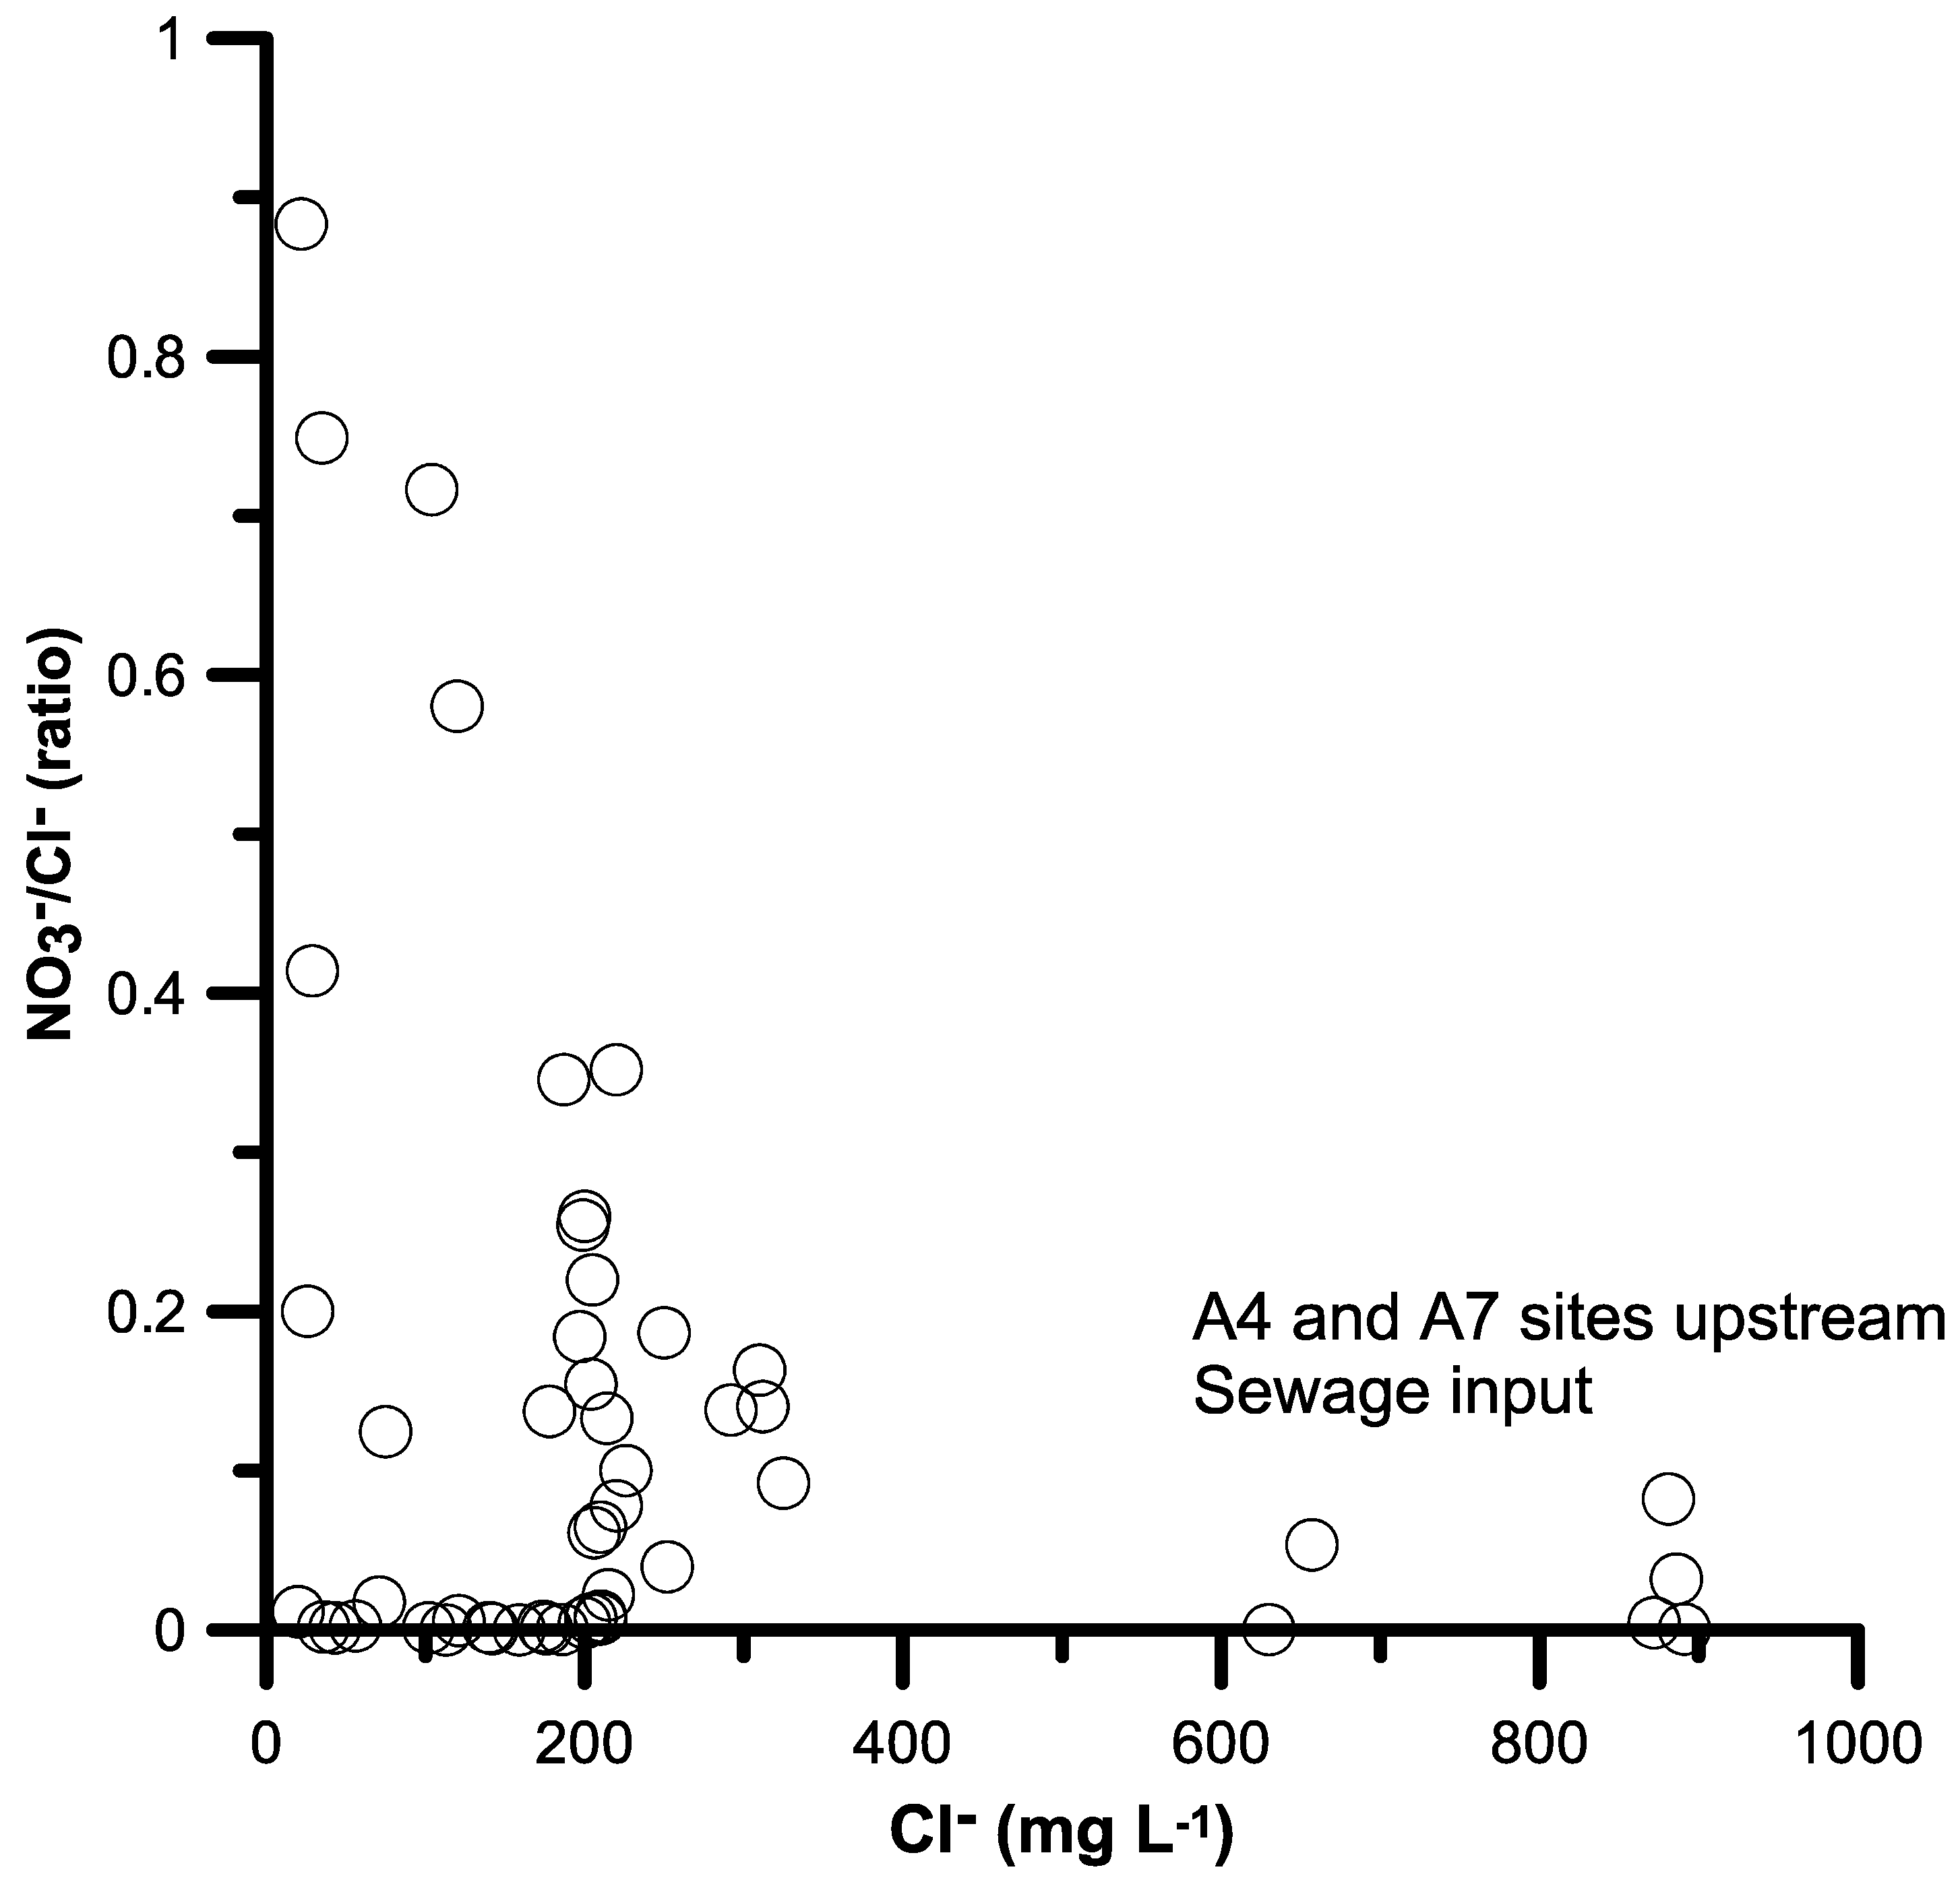
4.2. Nitrate Sources through Isotopic Composition in Stream Waters and Wells
4.3. Nitrate in the Sediment Pore Waters
5. Conclusions
Acknowledgments
Author Contributions
Conflicts of Interest
References
- Gilles, J. Nitrogen study fertilizes fears of pollution. Nature 2005, 433, 791. [Google Scholar] [CrossRef] [PubMed]
- UNEP. Reactive Nitrogen in the Environment. Available online: http://www.unep.org/pdf/dtie/Reactive_Nitrogen.pdf (accessed on 16 June 2012).
- GANE. Global Enrichment Factor. Available online: http://www.nerc.ac.uk/research/programmes/gane/ (accessed on 6 September 2005).
- Groffman, P.; Davidson, E.A.; Seitzinger, S. New approaches to modeling denitrification. Biogeochemistry 2009, 93, 1–5. [Google Scholar] [CrossRef]
- NinE. Nitrogen in Europe. Available online: http://www.nine-esf.org/?q=node/205 (accessed on 4 September 2010).
- NinE-ENA. European Nitrogen Assessment. Available online: http://www.nine-esf.org/node/204 (accessed on 4 September 2010).
- Vitousek, P.M.; Aber, J.D.; Howarth, R.W.; Likens, G.E.; Mat-son, P.A.; Schindler, D.W.; Schlesinger, W.H.; Tilman, D.G. Alteration of the global nitrogen cycle: Sources and consequences. Ecol. Appl. 1997, 7, 737–750. [Google Scholar] [CrossRef]
- Lohse, K.A.; Sanderman, J.; Amundson, R. Identifying sources and processes influencing nitrogen export to a small stream using dual isotopes of nitrate. Water Resour. Res. 2013, 49, 5715–5731. [Google Scholar] [CrossRef]
- McClain, M.E.; Boyer, E.W.; Dent, C.L.; Gergel, S.E.; Grimm, N.B.; Groffman, P.M.; Hart, S.C.; Harvey, J.W.; Johnston, C.A.; Mayorga, E.; et al. Biogeochemical hot spots and hot moments at the interface of terrestrial and aquatic ecosystems. Ecosystems 2003, 6, 301–312. [Google Scholar] [CrossRef]
- Ashkenas, L.R.; Johnson, S.L.; Gregory, S.V.; Tank, J.L.; Wollheim, W.M. A stable isotope tracer study of nitrogen uptake and transformation in an old-growth forest stream. Ecology 2004, 85, 1725–1739. [Google Scholar] [CrossRef]
- Devol, A.H. Denitrification including anammox. In Nitrogen in the Marine Environment; Capone, D., Carpenter, E., Mullholland, M., Bronk, D., Eds.; Elsevier: Amsterdam, The Netherlands, 2008; pp. 263–302. [Google Scholar]
- Wexler, S.K.; Hiscock, K.M.; Dennis, P.F. Catchment-Scale Quantification of Hyporheic Denitrification Using an Isotopic and Solute Flux Approach. Environ. Sci. Technol. 2011, 45, 3967–3973. [Google Scholar] [CrossRef] [PubMed]
- Cabana, G.; Rasmussen, J. Comparison of aquatic food chains using nitrogen isotopes. Proc. Natl. Acad. Sci. USA 1996, 93, 10844–10847. [Google Scholar] [CrossRef] [PubMed]
- Lake, J.L.; McKinney, R.A.; Osterman, F.A.; Pruell, R.J.; Kiddon, J.; Ryba, S.A.; Libby, A.D. Stable nitrogen isotopes as indicators of anthropogenic activities in small freshwater systems. Can. J. Fish. Aquat. Sci. 2001, 58, 870–878. [Google Scholar] [CrossRef]
- Peyrard, D.; Delmotte, S.; Sauvage, S.; Namour, P.; Gerino, M.; Vervier, P.; Sanchez-Perez, J.M. Longitudinal transformation of nitrogen and carbon in the hyporheic zone of an N-rich stream: A combined modelling and field study. Phys. Chem. Earth 2011, 36, 599–611. [Google Scholar] [CrossRef]
- Kendall, C.; McDonnell, J.J. Isotope Tracers in Catchment Hydrology; Elsevier Science: New York, NY, USA, 1998; p. 839. [Google Scholar]
- Pintar, M.; Bolta, S.V.; Lobnik, F. Nitrogen isotope enrichment factor as an indicator of denitrification potential in top and subsoil in the Apače Valley, Slovenia. Soil Res. 2008, 46, 719–726. [Google Scholar] [CrossRef]
- Mariotti, A.; Germon, J.C.; Hubert, P.; Kaiser, P.; Letolle, R.; Tardieux, A.; Tardieux, P. Experimental determination of nitrogen kinetic isotope fractionation: Some principles, illustration for the denitrification and nitrification processes. Plant Soil 1981, 62, 413–430. [Google Scholar] [CrossRef]
- Sǿvik, A.K.; Mǿrkved, P.T. Use of stable nitrogen isotope fractionation to estimate denitrification in small constructed wetlands treating agricultural runoff. Sci. Total Environ. 2008, 392, 157–165. [Google Scholar] [CrossRef] [PubMed]
- Xue, D.; Botte, J.; De Baets, B.; Accoe, F.; Nestler, A.; Taylor, P.; Van Cleemput, O.; Berglund, M.; Boeckx, P. Present limitations and future prospects of stable isotope methods for nitrate source identification in surface- and groundwater. Water Res. 2009, 43, 1159–1170. [Google Scholar] [CrossRef] [PubMed]
- Butturini, A.; Bernal, S.; Sabater, S.; Sabater, F. The influence of riparian-hyporheic zone on the hydrological responses in an intermittent stream. Hydrol. Earth Syst. Sci. Discuss. 2002, 6, 515–526. [Google Scholar] [CrossRef]
- Piña-Ochoa, E.; Høgslund, S.; Geslin, E.; Cedhagen, T.; Revsbech, N.P.; Nielsen, L.P.; Schweizer, M.; Jorissen, F.; Rysgaard, S.; Risgaard-Petersen, N. Widespread occurrence of nitrate storage and denitrification among Foraminifera and Gromiida. Proc. Natl. Acad. Sci. USA 2006, 19, 1148–1153. [Google Scholar] [CrossRef] [PubMed]
- Valério, E.; Faria, N.; Paulino, S.; Pereira, P. Seasonal variation of phytoplankton and cyanobacteria composition and associated microcystins in six Portuguese freshwater reservoirs. Ann. Limnol. Int. J. Limnol. 2008, 44, 189–196. [Google Scholar] [CrossRef]
- Otero, N.; Menció, A.; Torrentó, C.; Soler, A.; Mas-Pla, J. Multi-isotopic and hydrogeological methods applied to monitoring groundwater nitrate attenuation in a regional aquifer system (Osona, NE Spain). In Water Pollution in Natural Porous Media at Different Scales; Candela, L., Vadillo, I., Aagaard, P., Bedbur, E., Trevisan, M., Vanclooster, M., Viotti, P., López-Geta, J.A., Eds.; IGME: Madrid, Spain, 2007; pp. 203–209. [Google Scholar]
- Sen, P.; Gieske, A. Use of GIS and remote sensing in identifying recharge zones in an arid catchment: A case study of Roxo river basin, Portugal. J. Nepal Geol. Soc. 2005, 31, 25–32. [Google Scholar]
- Gamises, F. The Study of Spatial and Temporal Aspects of Denitrification Processes in Roxo Catchment, Portugal. Master’s Thesis, ITC/University of Twente, Enschede, The Netherlands, 2009; p. 76. [Google Scholar]
- Paralta, E.A.; Oliveira, M.M. Assessing and Modelling Hard Rock Aquifer Recharge Based on Complementary Methodologies—A Case Study in the Gabbros of Beja, Aquifer System (South Portugal). In Proceedings of the 2nd Workshop of the Iberian Regional Working Group on Hardrock Hydrogeology, Évora, Portugal, 18–21 May 2005; p. 15.
- ABROXO. Meteorological Data of Roxo Reservoir Station; Technical Bulletin; Association of Water Users of Roxo: Beja, Portugal, 2009. (In Portuguese) [Google Scholar]
- Yevenes, M.A.; Mannaerts, C.M. Seasonal and land use impacts on the nitrate budget and export of a mesoscale catchment in Southern Portugal. Agric. Water Manag. 2011, 102, 54–65. [Google Scholar] [CrossRef]
- Varela, M.; Centro Operayivo e de Tecnologia de Regadio, COTR, Beja, Portugal; Nobre, R.; Escola Agraria do Beja, Portugal. Nitrogen fertilization for agricultural crops in Roxo catchment. 10 October 2008. [Google Scholar]
- Nunes, M.E.; Paralta, E.; Cunha, M.C.; Ribeiro, L. Groundwater network optimization with missing data. Water Resour. Res. 2004, 40, W02406. [Google Scholar] [CrossRef]
- Seeberg-Elverfeldt, J.; Schlüter, M.; Feseker, T.; Kölling, M. Rhizon sampling of porewaters near the sediment-water interface of aquatic systems. Limnol. Oceanogr. Meth. 2005, 3, 361–371. [Google Scholar] [CrossRef]
- Casciotti, K.L.; Sigman, D.M.; Hastings, M.G.; Bohlke, J.K.; Hilkert, A. Measurement of the oxygen isotopic composition of nitrate in seawater and freshwater using the denitrifier method. Anal. Chem. 2002, 74, 4905–4912. [Google Scholar] [CrossRef] [PubMed]
- Mariotti, A. Natural N-15 abundance measurements and atmospheric nitrogen standard calibration. Nature 1984, 311, 251–252. [Google Scholar] [CrossRef]
- Böttcher, J.; Strebel, O.; Voerkelius, S.; Schmidt, H.L. Using isotope fractionation of nitrate-nitrogen and nitrate-oxygen for evaluation of microbial denitrification in a sandy aquifer. J. Hydrol. 1990, 114, 413–424. [Google Scholar] [CrossRef]
- Lehmann, M.; Reichert, S.; Bernasconi, M.; Barbieri, A.; Mckenzie, J. Modelling nitrogen and oxygen isotope fractionation during denitrification in a lacustrine redox-transition zone. Geochim. Cosmochim. Acta 2003, 67, 2529–2542. [Google Scholar] [CrossRef]
- Chen, F.; Jia, G.; Chen, J. Nitrate sources and watershed denitrification inferred from nitrate dual isotopes in the Beijiang River, South China. Biogeochemistry 2009, 94, 163–174. [Google Scholar] [CrossRef]
- R Development Core Team. Available online: http://www.r-project.org/ (accessed on 15 July 2009).
- Soetaert, K.; Meysman, F. Reactive transport in aquatic ecosystems: Rapid model prototyping in the open source software, R. J. Environ. Model. Softw. 2012, 32, 49–60. [Google Scholar] [CrossRef]
- Soetaert, K.; Herman, P.M.J. A Practical Guide to Ecological Modelling. Using R as a Simulation Platform; Springer: Berlin, Germany, 2009. [Google Scholar]
- Alexander, R.B.; Böhlke, J.K.; Boyer, E.W.; David, M.B.; Harvey, J.W.; Mulholland, P.J.; Seitzinger, S.P.; Tobias, C.R.; Tonitto, C.; Wollheim, W.M. Dynamic modeling of nitrogen losses in river networks unravels the coupled effects of hydrological and biogeochemical processes. Biogeochemistry 2009. [Google Scholar] [CrossRef]
- Panno, S.V.; Kelly, W.R.; Martinsek, A.T.; Hackley, K.C. Estimating background and threshold nitrate concentrations using probability graphs. Ground Water 2006, 44, 697–709. [Google Scholar] [CrossRef] [PubMed]
- Vithanage, I. Analysis of Nutrient Dynamics in Roxo Catchment Using Remote Sensing Data and Numerical Modeling. Master’s Thesis, ITC/University of Twente, Enschede, The Netherlands, 2009; p. 103. [Google Scholar]
- Soetaert, K.; Herman, P.M.J.; Middelburg, J.J. A model of early diagenetic processes from the shelf to abyssal depths. Geochim. Cosmochim. Acta 1996, 60, 1019–l040. [Google Scholar] [CrossRef]
- Aravena, R.; Robertson, W.D. Use of multiple isotope tracers to evaluate denitrification in ground water: Study of nitrate from a large-flux septic system plume. Ground Water 1998, 36, 975–982. [Google Scholar] [CrossRef]
- Vander Zanden, M.J.; Vadeboncoeur, Y.; Diebel, M.W.; Jeppesen, E. Primary consumer stable nitrogen isotopes as indicators of nutrient source. Environ. Sci. Technol. 2005, 39, 7509–7515. [Google Scholar] [CrossRef] [PubMed]
- Brandes, J.A.; Devol, A.H. Isotopic fractionation of nitrogen and oxygen in coastal marine sediments. Geochim. Cosmochim. Acta 1997, 61, 1793–1801. [Google Scholar] [CrossRef]
- Mengis, M.; Schiff, S.L.; Harris, M.; English, M.C.; Aravena, R.; Elgood, R.J.; MacLean, A. Multiple geochemical and isotopic approaches for assessing groundwater NO3-elimination in a riparian zone. Ground Water 1999, 37, 448–457. [Google Scholar] [CrossRef]
- Lund, L.J.; Horne, A.J.; Williams, A.E. Estimating denitrification in a large constructed wetland using stable nitrogen isotopes. Ecol. Eng. 2000, 14, 67–76. [Google Scholar] [CrossRef]
- Sebilo, M.; Billen, G.; Grably, M.; Mariotti, A. Isotopic composition of nitrate-nitrogen as a marker of riparian and benthic denitrification at the scale of the whole Seine River system. Biogeochemistry 2003, 63, 35–51. [Google Scholar] [CrossRef]
- Mateus, M.; Almeida, C.; Brito, D.; Neves, R. From Eutrophic to Mesotrophic: Modelling Watershed Management Scenarios to Change the Trophic Status of a Reservoir. Int. J. Environ. Res. Public Health 2014, 11, 3015–3031. [Google Scholar] [CrossRef] [PubMed]
- Zeng, H.; Wu, J. Tracing the nitrate sources of the Yili River in the Taihu Lake Watershed: A dual isotope approach. Water 2015, 7, 188–201. [Google Scholar] [CrossRef]
- Eriksson, P.D. Interaction effects of flow velocity and oxygen metabolism on nitrification and denitrification in biofilms on submersed macrophytes. Biogeochemistry 2001, 55, 29–44. [Google Scholar] [CrossRef]
- Hedin, L.O.; von Fischer, J.C.; Ostrom, N.E.; Kennedy, B.P.; Brown, M.G.; Robertson, G.P. Thermodynamic constraints on nitrogen transformations and other biogeochemical processes at soil-stream inter-faces. Ecology 1998, 79, 684–703. [Google Scholar]


| Land Use | Crop Information | Total Area (%) | Fertilizer Use | Fertilizer Type or NPK | Amount | Timing Dates |
|---|---|---|---|---|---|---|
| Agricultural-arable land winter annual in rotation | Maize | 7.7 | Planting Boost Mid/maturing | 15-35-00 6-20-18 Nitro 32N | 100 300 400 | June–August |
| 5.4 | Planting Development | 20-20-00 Nitro 27 | 200 200 | June–August | ||
| 19.5 | Planting Development3 leaves stage | 10-30-00 Nitro 27 | 300 250 | Begin November January--February | ||
| Agricultural mixed crops | Summer annuals pasture, long fallow | 36.8 | – | – | – | – |
| Agricultural permanent crops | Olives Vineyards Cork oak | 7.2 1.8 6.6 | – | – | – | – |
| Water bodies | Ponds, reservoir (dam) | 3.0 | – | – | – | – |
| Seminatural vegetation forest land | Rangeland Shrubs eucalyptus, Pinus | 4.1 8.0 | – | – | – | – |
| Urban | Urban low density Urban high density | 0.10 0.15 | – | – | – | – |
| Element | October 2008 | November 2008 | March 2009 | September 2009 | ||||||||||||
|---|---|---|---|---|---|---|---|---|---|---|---|---|---|---|---|---|
| Max | Min | Average | SD | Max | Min | Average | SD | Max | Min | Average | SD | Max | Min | Average | SD | |
| Streams | ||||||||||||||||
| NO3 | 16.5 | 1.27 | 7.34 | 5.23 | 16.7 | 1.68 | 8.32 | 5.18 | 15.2 | 0.44 | 5.7 | 5.48 | 10 | 0.30 | 3.32 | 3.53 |
| NH4 | 10.7 | < | 1.2 | 3.6 | 10.9 | < | 2.3 | 2.9 | 45 | 0.05 | 3.9 | 11 | 0.45 | < | 0.2 | 0.15 |
| 15N | 11.3 | 3 | 7.5 | 2.9 | - | - | - | - | 15.1 | 3.2 | 7.0 | 3.9 | 13.7 | 4.4 | 7.8 | 4 |
| 18O | 31.1 | 4.9 | 15 | 7.8 | - | - | - | - | 9.8 | 4.3 | 6.4 | 1.9 | 13.1 | 9.1 | 11.2 | 1.8 |
| DO | 9.3 | 2.2 | 6.0 | 1.7 | 9.8 | 3.7 | 7.7 | 1.4 | 15.2 | 0.04 | 5.7 | 5.5 | 9.8 | 2.1 | 6.7 | 1.9 |
| T | 25.8 | 15.8 | 20.8 | 3.4 | 19.8 | 14.7 | 18.3 | 2.9 | 20 | 13 | 15.8 | 2.0 | 30.4 | 19.1 | 25.9 | 3.9 |
| EC | 2100 | 789 | 1432 | 483 | 1890 | 760 | 1340 | 384 | 1854 | 685 | 1190 | 291 | 3110 | 543 | 1390 | 676 |
| Wells | ||||||||||||||||
| NO3 | 20.2 | 1.7 | 10.3 | 8.2 | - | - | - | - | 25.5 | 2.2 | 9.8 | 8.6 | 18.2 | 0.03 | 6.8 | 8.4 |
| NH4 | 4.5 | 0 | 0.8 | 1.8 | - | - | - | - | 0.5 | 0.04 | 0.2 | 0.2 | 0.45 | 0 | 0.18 | 0.2 |
| 15N | - | - | - | - | - | - | - | - | 20.5 | 3.29 | 8.9 | 5.7 | 10.5 | 3.3 | 6.9 | 2.6 |
| 18O | - | - | - | - | - | - | - | - | 15.1 | 4.33 | 7.5 | 3.5 | 7.4 | 4.3 | 6.2 | 1.2 |
| DO | 9.3 | 3.4 | 5.9 | 2.2 | - | - | - | - | 25.5 | 2.21 | 9.8 | 8.6 | 8.3 | 4.5 | 6.2 | 1.5 |
| T | 23.5 | 19.7 | 21.4 | 1.6 | - | - | - | - | 18.5 | 14 | 16 | 1.5 | 24.4 | 20.8 | 21.9 | 1.7 |
| EC | 1626 | 507 | 873 | 389 | - | - | - | - | 996 | 664 | 848 | 108 | 996 | 664 | 832 | 110 |
© 2016 by the authors; licensee MDPI, Basel, Switzerland. This article is an open access article distributed under the terms and conditions of the Creative Commons Attribution (CC-BY) license (http://creativecommons.org/licenses/by/4.0/).
Share and Cite
Yevenes, M.A.; Soetaert, K.; Mannaerts, C.M. Tracing Nitrate-Nitrogen Sources and Modifications in a Stream Impacted by Various Land Uses, South Portugal. Water 2016, 8, 385. https://doi.org/10.3390/w8090385
Yevenes MA, Soetaert K, Mannaerts CM. Tracing Nitrate-Nitrogen Sources and Modifications in a Stream Impacted by Various Land Uses, South Portugal. Water. 2016; 8(9):385. https://doi.org/10.3390/w8090385
Chicago/Turabian StyleYevenes, Mariela A., Karline Soetaert, and Chris M. Mannaerts. 2016. "Tracing Nitrate-Nitrogen Sources and Modifications in a Stream Impacted by Various Land Uses, South Portugal" Water 8, no. 9: 385. https://doi.org/10.3390/w8090385
APA StyleYevenes, M. A., Soetaert, K., & Mannaerts, C. M. (2016). Tracing Nitrate-Nitrogen Sources and Modifications in a Stream Impacted by Various Land Uses, South Portugal. Water, 8(9), 385. https://doi.org/10.3390/w8090385