Abstract
Precipitation totals at annual and monthly scale are key elements affecting water availability for a number of human activities. Thus, the multi-year variability and probability distribution of precipitation form the basis information for water management and damage risk assessment (caused by drought and heavy rains). The main goal of this paper is to analyse the precipitation patterns and to determine the non-exceedance probability (p, %) of extreme monthly precipitation in the region influenced by lignite mining and dominated by traditional agricultural production. Monthly precipitation totals recorded in 1961–2010 at four weather stations close to the analysed region were examined, including comparative analysis of precipitation patterns between the stations. Different non-exceedance probability (p, %) was determined with focus on extreme precipitation. Annual and monthly precipitation was characterised by a large variation of values. Temporal variability was larger than the spatial variability. The highest average sums were registered in July and the lowest in February. Minimum monthly precipitation (<10 mm) were recorded between January and April, and in October at all four weather stations. Maximum totals, amounting to more than 200 mm, were noted in July. The largest share of absolute minimum and maximum monthly precipitation was recorded at the turn of 20th and 21st centuries. Temporal and spatial distribution of precipitation for very dry, abnormally dry and extremely dry months (p ≤ 20%) were characterised by lower dispersion of values compared with wet months (p ≥ 80%). The precipitation probability distribution at p ≤ 20% may be useful to determine agricultural drought risk assessment in the region. Monthly precipitation at p ≥ 80% may be the background for planning drainage system efficiency and assessment of flooding risk of lignite deposits.
1. Introduction
Extreme precipitation totals randomly occurring create climate-related hazards (e.g., surface water flooding, drought, etc.) in the areas that have become more vulnerable due to the environmental transformation accompanying different kinds of human activities, e.g., open-cast mining. One of the world’s largest fuel-energy complexes based on lignite is situated in central Poland. It consists of one of the Europe’s largest open-cast mines—the Lignite Mine Belchatow (LMB) and the nearby Belchatow power plant, the world’s largest lignite-fired plant. This region is mainly dominated by traditional agricultural production and the above-mentioned mining activities. These human activities are exposed to natural hazards caused by extreme precipitation events. Crop production is particularly vulnerable to abnormally low precipitation during the growing season resulting in yield reduction [1,2,3]. Open cast mining is vulnerable to high precipitation occurring within the year [4]. In Poland, the heavy rainfalls were 3rd (after floods and hurricanes) in the assessment of the risk from climate-related hazards with the evaluation of an average of 1.78 points (on a scale 0–3) for hard coal and lignite mines and 1.55 in mining communes areas [5].
Open-cast mining causes significant changes of hydrological conditions in the surrounding environment. For mining operations, the groundwater has to be kept beneath the deepest working level of the open-cast mine. The lowering of the groundwater level is ensured by water pumping. The different aquifers are hydrologically connected, thus high pumping rates of mining water over many years cause lowering of the groundwater table depth and disruption of the water balance of a large area. This was documented in Germany [6,7] and Poland [8,9,10,11]. These changes result in increasing of susceptibility of local communes and agricultural production in the region influenced by lignite mining industry to atmospheric droughts. Under these conditions, both the LMB and agriculture are forced to continuous improvement of their strategies to face the risk of the economic losses caused by both extreme precipitation and soil water resources shortages. The need for continuous improvement and evaluation of water management strategies on mining areas were pointed out by Zhang et al. [12]. The stable crop production requires also advanced strategies of water use due to climate changes [13] as well as changes in water and environmental protection laws. Precipitation totals for annual and monthly scale are key elements affecting water availability [14]. Thus, the detailed characteristic of precipitation in terms of the amount, the multi-year temporal variability and the probability distribution formed the basis of water management and damage risk assessment (caused by drought and heavy rains) in the open-cast mine and adjoining agricultural areas. Using this information for water management planning and damage risk assessment should also increase the capacity of local communities to cope with natural hazards.
Despite several analyses of precipitation in the areas impacted by the LMB [15,16,17,18], there is still a lack of complete analysis of the precipitation probability distribution.
The paper presents a case study for the LMB and adjoining areas precipitation distribution patterns as the background of the water management of the main water resources users: the lignite mine and agriculture.
The goals of the paper are:
- −
- to analyse of the multi-year precipitation patterns with main focus on extreme annual and monthly sum;
- −
- to specify the synoptic stations that are relatively close to the area influenced by open-cast mining and the availability of the long-term meteorological data series might represent pluvial conditions of the region under consideration; and
- −
- to determine the non-exceedance probability (p, %) of monthly precipitation at p ≥ 80% in terms of the LMB safety and p ≤ 20% due to the drought risk of agricultural areas located in the range of groundwater depression cone.
2. Study Area
The study area is located in the south of Lodzkie Voivodship in central Poland. It mainly covers the south-eastern part of the Szczercowska Valley (318.23) and the northern part of the Belchatowska Upland Plain (318.81) [19]. The Szczercow and Belchatow lignite deposits (2 billion Mg) are located in the Kleszczow Graben and extend latitudinally.
The LMB is able to extract 39 million Mg of lignite per year from the Belchatow and Szczercow deposits. The coal is supplied to the nearby Belchatow power plant, which generates a total of 4440 MW electric power, accounting for 20% of the total power generation of Poland [20].
The LMB, built in 1973 started, the operation of its large-diameter pumping wells system in 1975 to drain the lignite pit. This resulted in an on-going transformation of water conditions and formation of a large groundwater depression cone. The area and range of the cone have been varying in time depending on the progress of lignite exploitation. A significant impact was observed on the hydrological conditions in the surroundings six years after the pumping system had started to operate. In 1981, the groundwater depression cone was equal to 273 km2. During dewatering of the Belchatow deposit, its area amounted to around 635 km2 [8]. The range of the cone increased significantly in 1993, after the drainage of the Szczercow deposit began. During the simultaneous exploitation of both deposits the range of the cone was at its peak of 760 km2 [10]. Currently, it has been decreased systematically.
Deep and permanent groundwater depletion at the area affected by the pumping system resulted in decline of surface water and shallow ground water supplying hydrogenic and semi-hydrogenic habitats. These habitats are mainly used as permanent grasslands. The decline of feeding from groundwater occurred in some of the habitats used as arable lands as well. The soil’s water regime affected by the depression cone has changed from rainfall and groundwater feeding to only rainfall feeding, thus totally depending on precipitation patterns. Consequently, agricultural production became much more vulnerable to meteorological droughts than before.
According to our studies, the area of grasslands represents about 10% of the depression cone area, while arable lands comprise 3%. The agricultural production’s adaptability to the new hydrological conditions is limited due to lack of water resources for irrigation. Flood risk and soil waterlogging has also decreased in the valleys of local watercourses.
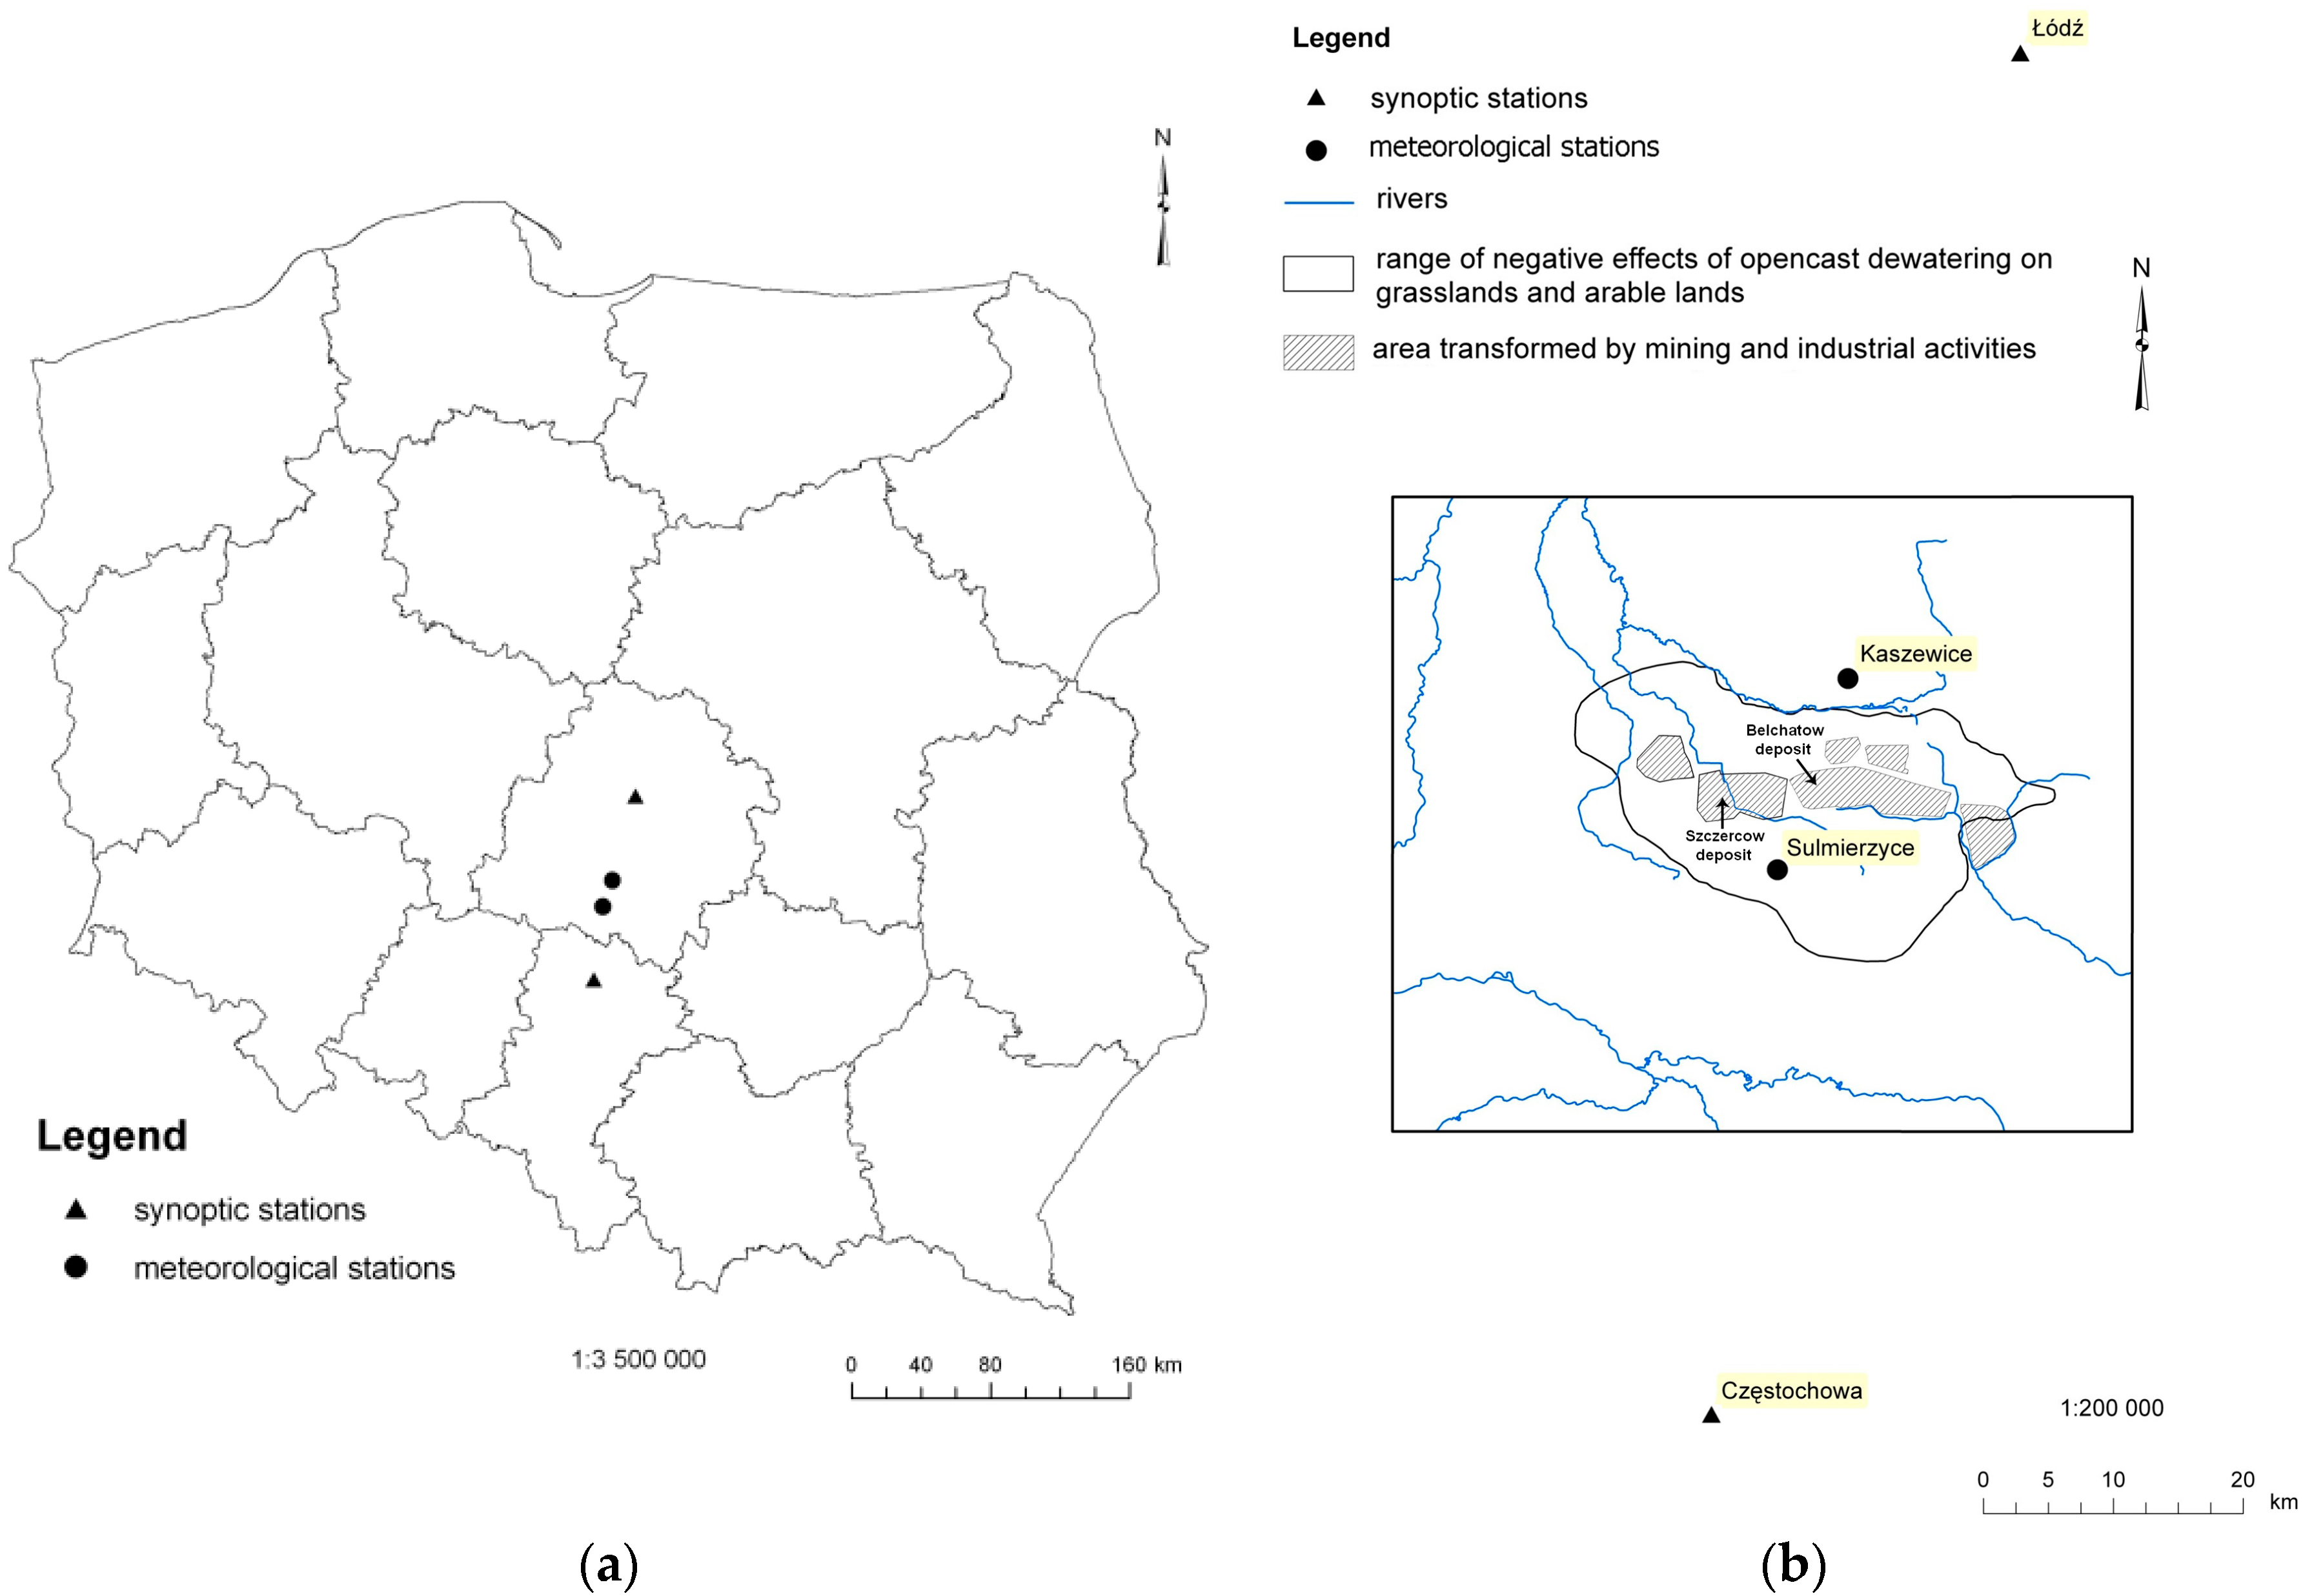
In this paper, “mining area” refers to the area under the direct mining activities (mine and power plant), whereas “the LMB impact area” refers to the region negatively affected by the groundwater depletion as specified by current range of depression cone (Figure 1).

Figure 1.
Location of the weather stations (a) and range of depression cone in 2015 (b) (source: own studies).
3. Materials and Methods
For the analysis of the pluvial conditions in the LMB impact area, we used multi-year data sets of monthly precipitation from the weather stations of the Institute of Meteorology and Water Management-National Research Institute (polish abbreviation: IMGW-PIB). The data included monthly precipitation totals registered in the years 1961–2010 at the weather stations located in Lodz, Sulmierzyce and Czestochowa and in the years 1976–2010 at Kaszewice (Table 1, Figure 1).

Table 1.
Location of the weather stations and analysed years.
Two of the analysed weather stations were synoptic (Lodz and Czestochowa), while the other two were climatologic (Kaszewice) and precipitation (Sulmierzyce). The climatologic and precipitation stations will be referred to as meteorological stations further in this paper. The synoptic stations in Lodz and Czestochowa belong to the system of 63 basic stations of the Hydro-Meteorological State Service of the IMGW-PIB. At the synoptic stations, a full range of meteorological measurements and observations are carried out in accordance with the requirements and recommendations of the World Meteorological Organization. Data obtained from these stations account for the longest available series of precipitation measurements. However, the synoptic stations are situated outside the direct LMB impact area. The data from these stations have been used as reference for comparative analysis. The weather station in Lodz is about 50 km to the north from the northern border of the depression cone (Figure 1); the station in Czestochowa is about 36 km to the south of the southern border. There is a significant longitudinal difference of precipitation between these stations. Two meteorological stations are located in the impact area but these stations are of a lower order and have shorter series of precipitation measurements.
All four weather stations are located in the Central Poland Climate Region [21] and in the Warta River basin. The region belongs to a transitional part of the temperate climate zone separating the continental climate and the maritime climate.
To achieve the goals of the paper, we performed:
- −
- characterization of monthly and annual precipitation totals using the chosen descriptive statistics (average value, standard deviation and extreme values) and determination of trends using the T-test for significance of correlation coefficient;
- −
- comparative analysis of monthly and annual precipitation totals between the synoptic stations and meteorological (located in the LMB impact area) stations;
- −
- analysis of the compatibility of the empirical data series distribution with normal and gamma theoretical distributions using Pearson’s chi-squared test;
- −
- determination of monthly and annual precipitation totals at different non-exceedance probability (p, %); and
- −
- analysis of the probability of anomalous monthly precipitation totals over the impact area based on the long-term data series.
Evaluation statistics were used to compare the monthly and annual precipitation totals between synoptic and meteorological stations. Evaluation statistics are widely applied to assess environmental models: the root mean square error (RMSE), the mean absolute error (MAE), the determination coefficient (R2) [22,23,24,25] and per cent bias (PBIAS) [26,27,28]. These evaluation statistics are commonly used to assess the compatibility between simulated and observed data. RMSE and MAE are expressed in the units of the variable of interest (e.g., mm), while R2 is a dimensionless statistic and PBIAS is expressed as a percentage.
The determination coefficient R2 is a very popular measure, but it is too sensitive to high extreme values and insensitive to additive and proportional difference between the predicted and observed values [29]. Taking this into account, R2 should not be solely used. According to Willmott [25], this measure is insufficient to well-define model performance and the author recommends RMSE and MAE as the best overall measures. The smaller are RMSE and MAE, the better is the fit between the values that are compared. MAE is less sensitive to extreme values than RMSE, but more appealing, because it avoids exponentiation.
PBIAS is the percentage deviation of the evaluated data. It measures if the average tendency of the simulated data is larger or smaller than their observed counterparts. The optimal value of PBIAS is 0%, with low-magnitude values indicating accurate model simulation. Positive values indicate model underestimation bias and negative values indicate model overestimation bias [26,27].
It was assumed that monthly precipitation sums recorded at the synoptic stations (Lodz and Czestochowa) reflect “observed” values, whereas sums from the meteorological stations (Kaszewice and Sulmierzyce) reflect “simulated” values, to enable comparison of the precipitation patterns between synoptic and meteorological stations. Evaluation statistics were applied to assess which of the synoptic stations would better characterise the precipitation conditions over the LMB impact area.
The compatibility of empirical precipitation distribution (both monthly and annual) were tested with two theoretical distributions—normal and gamma—using Pearson’s chi-squared test at significance level α = 0.05.
For the majority of the data series there was no basis to reject the hypothesis of the compatibility of empirical data with theoretical gamma distribution. Therefore it was further used to determine precipitation totals with different probability of non-exceedance (p, %).
When analysing the probability of non-exceedance of monthly and annual precipitation totals the following values were closely examined: p ≤ 20% (precipitation shortage) due to drought risk in agricultural production and p ≥ 80% (precipitation excess) due to safety of mining activities related to dewatering of the lignite deposits (Table 2).
Table 2.
Criteria of quantile classification for monthly and annual precipitation shortage and excess.
All analyses were carried out using Statistica 7.1 (Dell, Austin, TX, USA) and Microsoft Excel 2007.
4. Results and Discussion
4.1. Average Annual and Monthly Precipitation Totals
The spatial distribution of average annual precipitation totals during 1961–2010 indicates increasing values to the south. The lowest average annual precipitation total has been recorded in Lodz, and the highest in Czestochowa. The average difference equal to 59 mm was found between these two weather stations. Average annual precipitation totals in Kaszewice, Sulmierzyce and Czestochowa were similar and the maximum difference between these three stations was only 17 mm. The lowest variability of annual precipitation was marked in Lodz (SD = 93 mm), while the largest was marked at two weather stations located close to the mine area—Kaszewice and Sulmierzyce (Table 3).
Table 3.
Monthly and annual precipitation (mm)—average x and standard deviation SD in 1961–2010.
The analysed region was also characterised by high temporal variability of monthly precipitation totals (Table 3). At all stations, the highest long term average sums were recorded in July and lowest in February. The SD values from May to October, with maximum also in July, were higher than in the other months pointing out the high variability of precipitation between succeeding years in this period. In winter, the greatest variability of precipitation was observed in December and the lowest generally in January and February. The same regularity was found for monthly precipitation in Lodz in the years 1904–2006 [18].
In Lodz, the monthly precipitation totals and their variability were the lowest. June was the exception because this station experienced greater rainfall variability (SD = 41 mm) than the others. Czestochowa stood out with the highest rainfall from May to October, although the variability was generally lower than that observed at the meteorological stations.
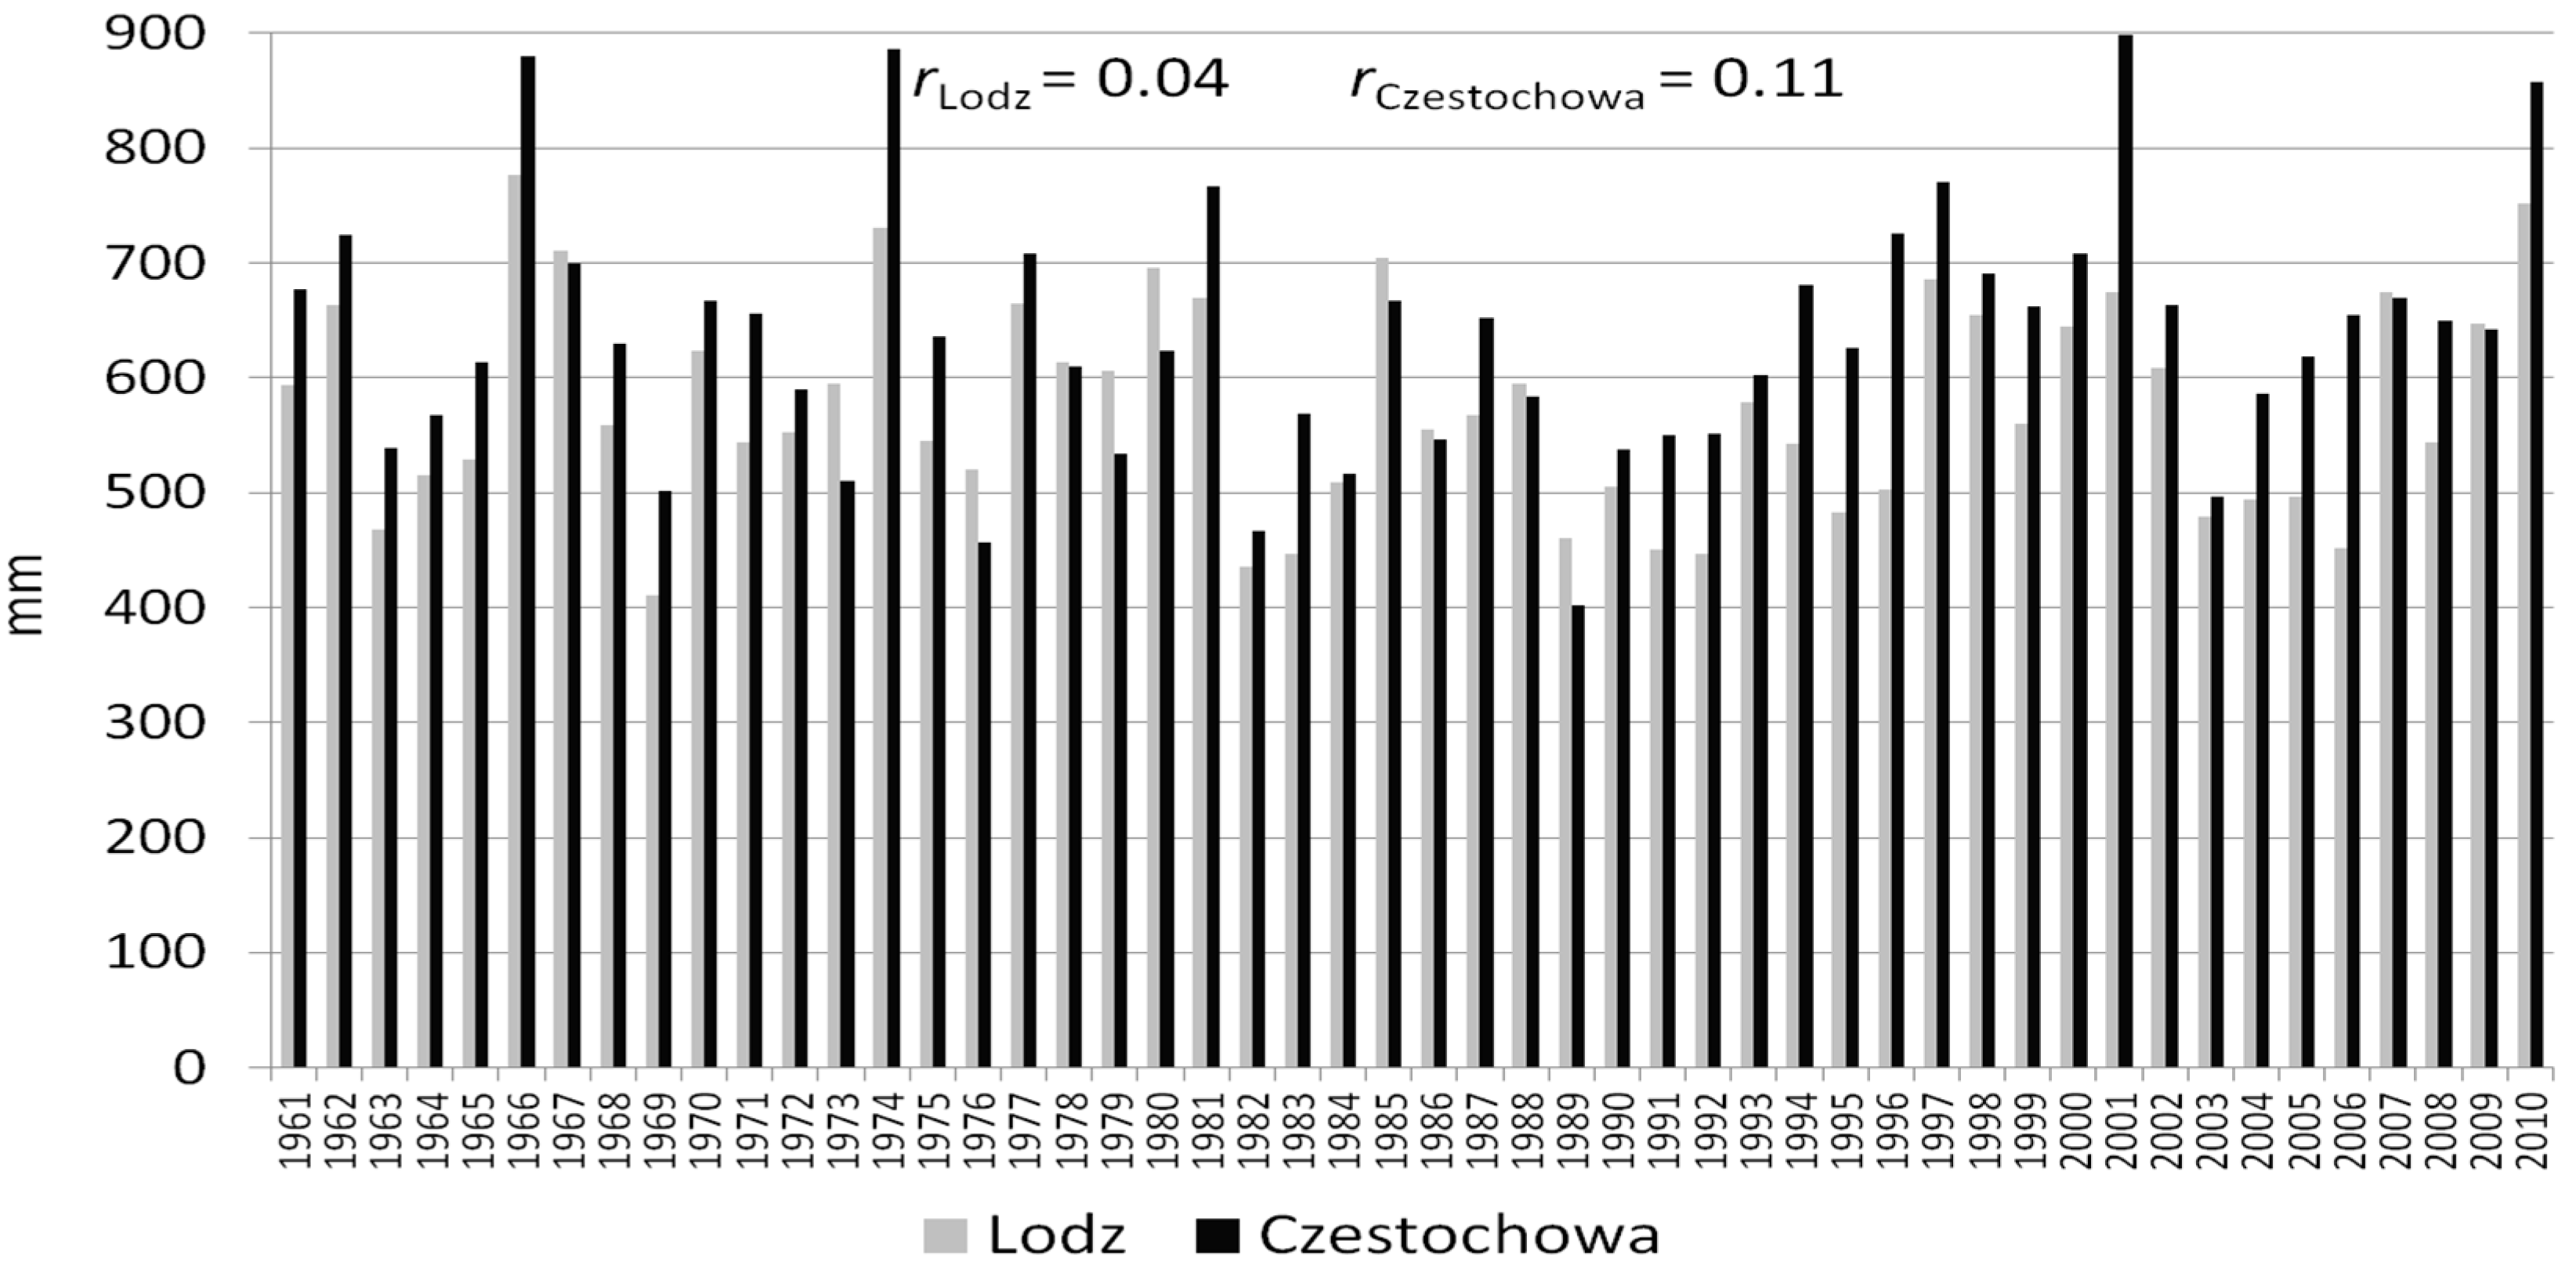
There were generally no statistically significant trends (α = 0.05) in annual precipitation totals for the analysed weather stations. These are presented in Figure 2 for the synoptic stations and in Figure 3 for the station in Sulmierzyce. For Kaszewice, which has a shorter data series, a significant trend (r = 0.34, p = 0.04) was found. For monthly precipitation in only four cases significant trends were found. Ilnicki et al. [31] analysing the long data series of precipitation for Lodz (years 1904–2010) and Czestochowa (years 1891–2010) also did not find statistically significant trends.

Figure 2.
Annual precipitation at the synoptic stations.
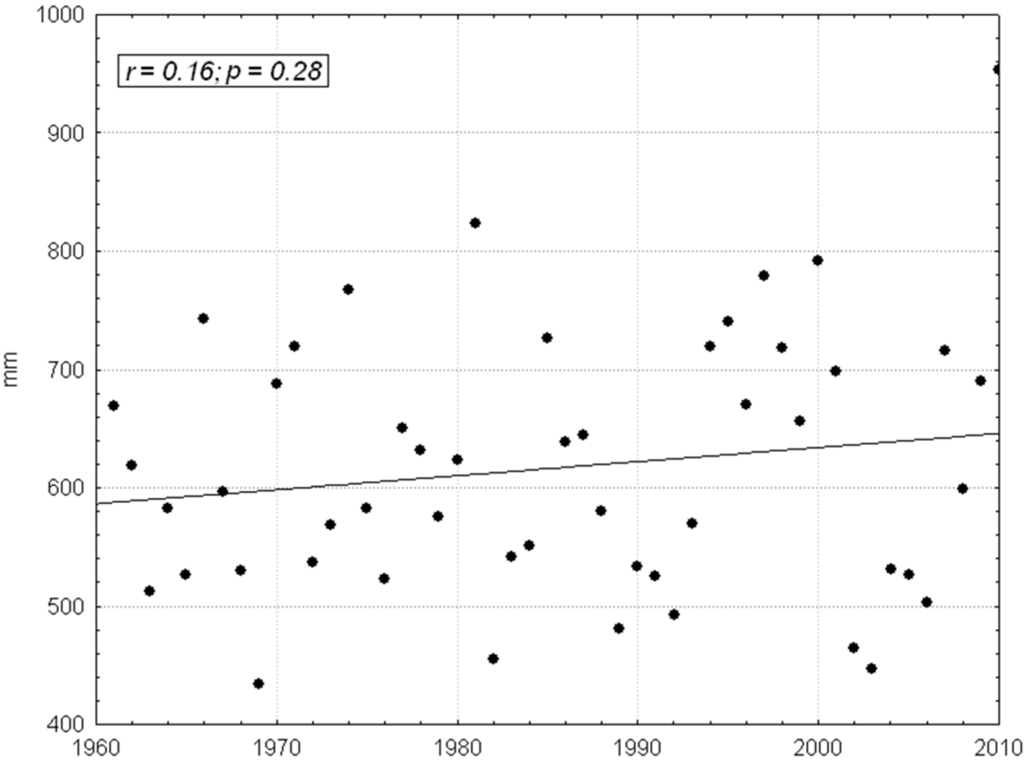
Figure 3.
Annual precipitation at the meteorological station in Sulmierzyce.
4.2. Extreme Annual and Monthly Precipitation Totals
The highest annual precipitation totals were recorded in 2010 at Kaszewice (934 mm) and Sulmierzyce (953 mm) stations, located in the LMB impact area. These amounts were more comparable to the maximum annual total at Czestochowa than Lodz (Table 4). Even though Lodz has generally the smallest amount of rain, it had the highest maximum totals in June, July and August out of the four weather stations. The value of 268 mm registered at this station in July 1997 was the highest monthly sum recorded in the studied area within the last 50 years. The precipitation total exceeded 120 mm in Kaszewice in December 2005, indicating that the maximum monthly sum may exceed more than 2.5 times the average value even in the winter months. In the examined long-term period, 40% of the maximum monthly sums occurred in the first decade of the 21st century.
Table 4.
Maximum monthly and annual precipitation totals (mm) in 1961–2010.
At each station, the minimum monthly precipitation from January to April were very low (<10 mm) and, in April 2009, imperceptible (1–3 mm). The minimum precipitation in October was ≤5 mm. Twenty-five per cent of the minimum monthly values occurred in the first decade of the twenty-first century (Table 5). These amounts are unfavourable for crop production in spring and autumn (germination and early tillering of winter crops) and for crops winter survival (lack of snow cover).
Table 5.
Minimum monthly and annual precipitation totals (mm) in 1961–2010.
The analysis of the data displayed in Table 4 and Table 5 shows a large range of variation (the difference between the maximum and minimum) in annual and monthly precipitation totals. As mentioned above, the largest share of extreme sums were recorded in the last two decades. This phenomenon may indicate the on-going climate changes towards increasing frequency of extreme precipitation events. De Luis et al. [14] analysing long-time data series of precipitation (1946–2005) in Spain detected also a general increase of precipitation concentration in the most recent period. The results published in the report of the European Academies Science Advisory Council [32] indicate the increase in the frequency of extreme weather events (including extremely high precipitation) in recent decades. Furthermore, the climate models suggest more frequent droughts in the future throughout Europe, intense precipitation events are also likely to be more frequent [33]. In the north of Europe the positive trend is more significant for extremes than for mean precipitation along the year [34].
4.3. Compatibility of the Annual and Monthly Precipitation Totals between the Synoptic and Meteorological Stations
Analysis of the agreement (compatibility) between precipitation totals at the synoptic and meteorological stations was performed using statistical measures (RMSE, MAE, PBIAS and R2) on the equal length of the data series (1976–2010). Summary of the results was prepared separately by combining measures expressed in mm (RMSE and MAE) and PBIAS with R2 (Table 6, Figure 4 and Figure 5). The values of RMSE and MAE may be regarded as small when these are less than half of the standard deviation of the observed values [27].
Table 6.
Evaluation statistics of annual precipitation patterns between synoptic (L, Cz) and meteorological stations (K, S).

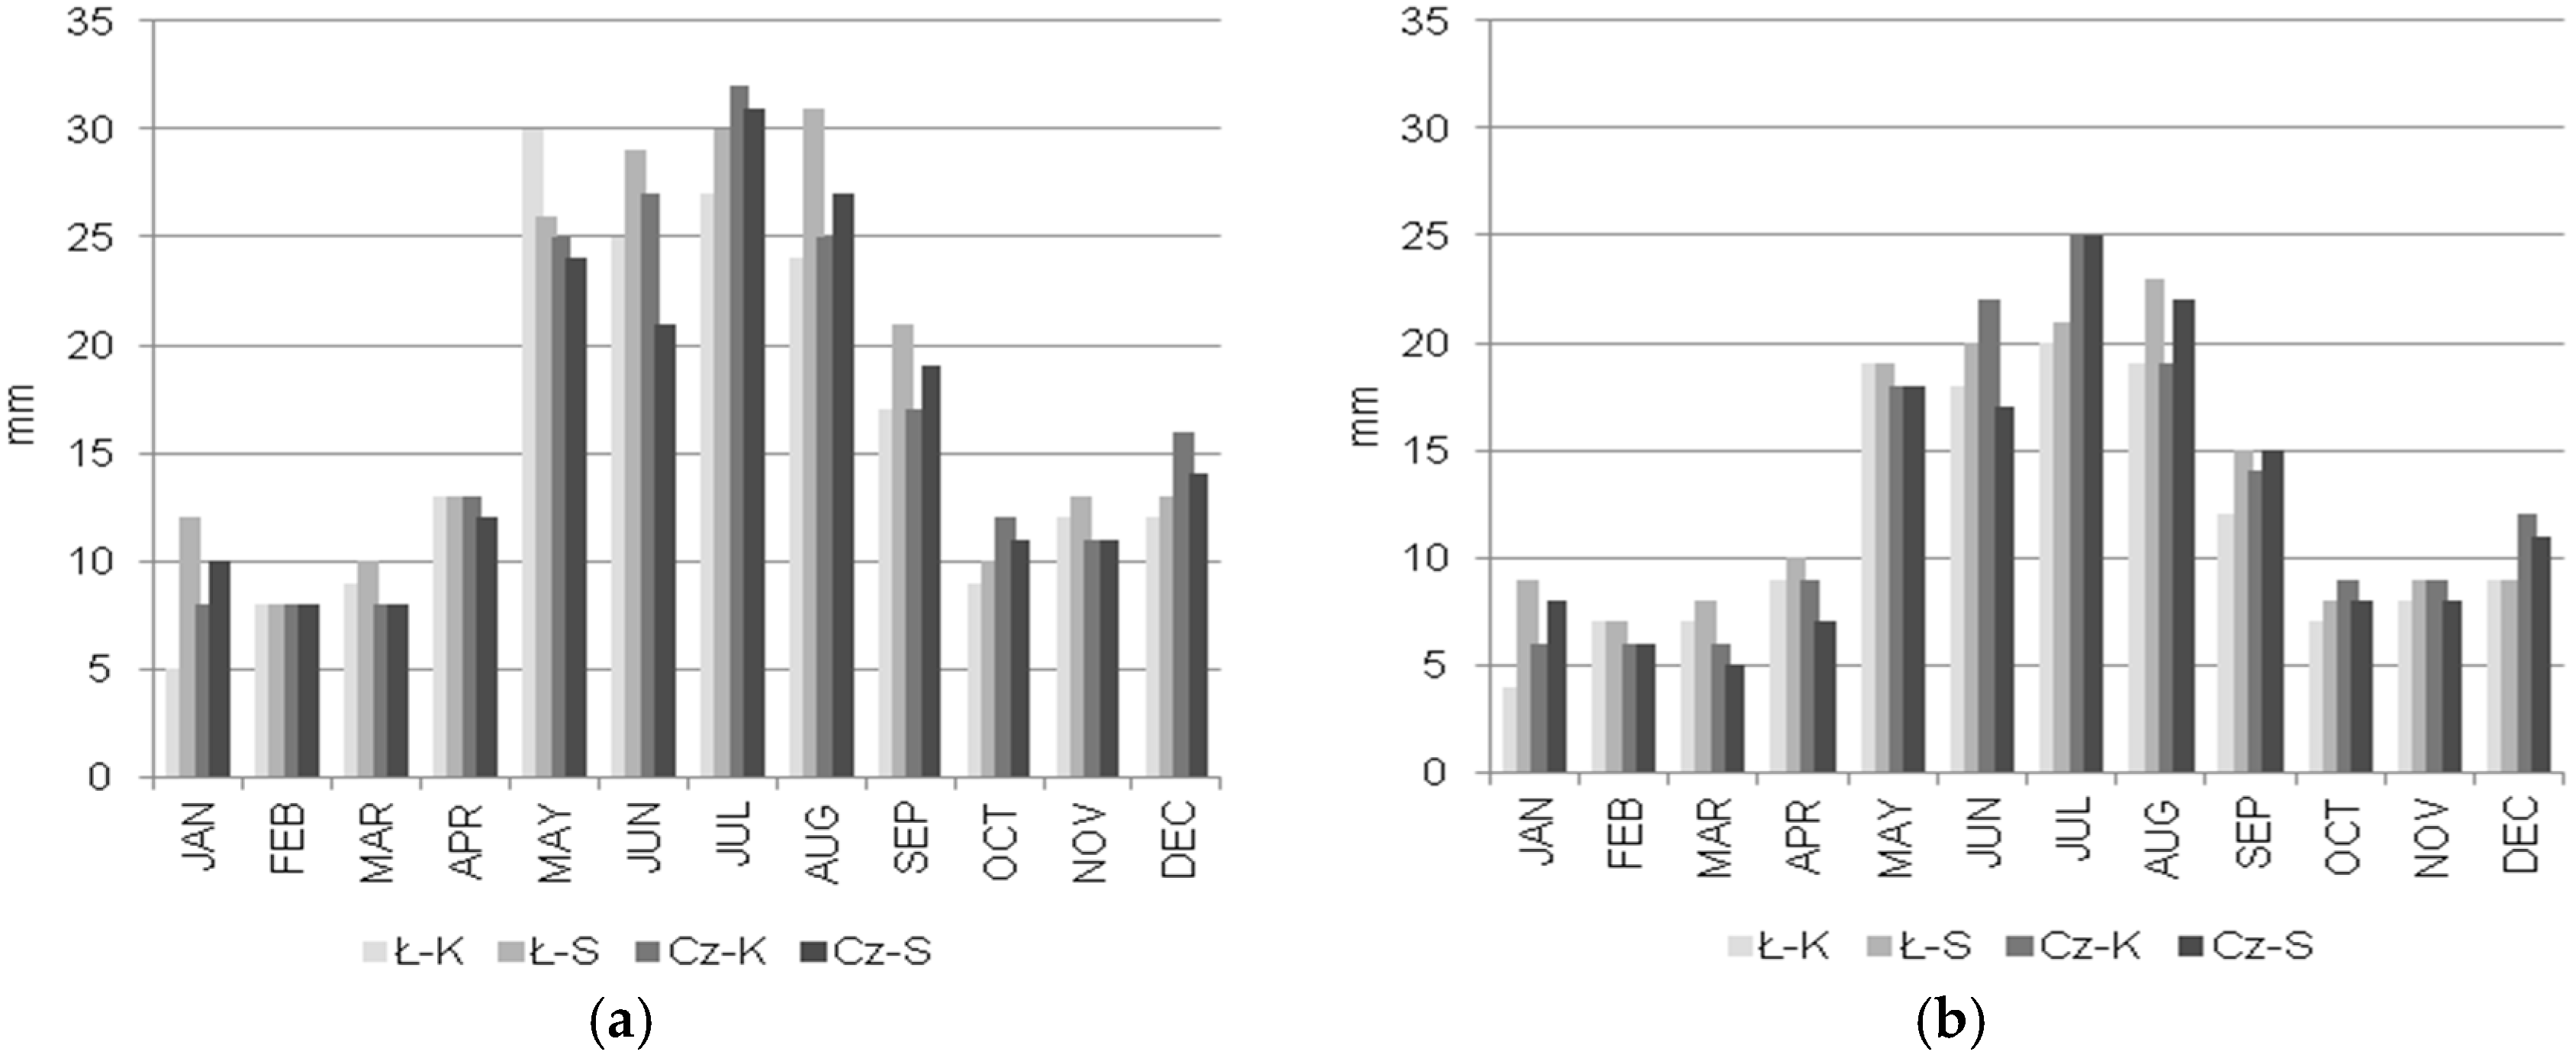
Figure 4.
Evaluation statistics (the root mean square error (a); and the mean absolute error (b)) of compatibility of monthly precipitation between synoptic (L—Lodz, and Cz—Czestochowa) and meteorological stations (K—Kaszewice, and S—Sulmierzyce).
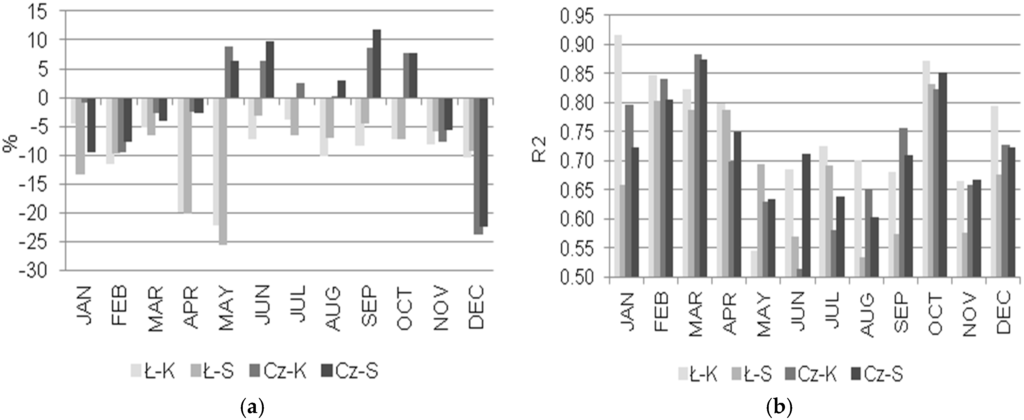
Figure 5.
Evaluation statistics (PBIAS (a); and R2 (b)) of compatibility of monthly precipitation between synoptic (L—Lodz, and Cz—Czestochowa) and meteorological stations (K—Kaszewice, and S—Sulmierzyce).
In the case of the annual totals, the lowest RMSE, MAE and PBIAS and the highest value of R2 were found for the relationship between the synoptic station in Czestochowa and meteorological station in Kaszewice. Especially low PBIAS was found between the precipitation total at Czestochowa and the precipitation totals at both meteorological stations. The poor compatibility defined with the evaluation statistics was found between Lodz and the meteorological stations. The station in Czestochowa better than Lodz represented annual precipitation conditions in the LMB impact area (Table 6).
The RMSE and MAE were the largest during the summer season in May, June, July and August (Figure 4), which may be associated with high precipitation totals in these months, and their high spatial variability in comparison to the other months (see Table 3). Major differences were found between the values of RMSE and MAE in the above mentioned months, which may indicate large variability in precipitation at the compared stations. The RMSE and MAE for each month were set together with the corresponding values of half of SD for monthly precipitation totals at the synoptic stations. The station in Czestochowa better represented precipitation totals than the station in Lodz registered at the meteorological stations in January, February, March and October, according to the more sensitive statistic RMSE. However, the station in Lodz in June and July was more representative for the meteorological stations, according to the MAE.
In most of the months, PBIAS ranged between +10% and −10%. The PBIAS was below −20% only in April and May in the relationship between Lodz and the meteorological stations, and in December in the relationship between Czestochowa and the meteorological stations. Negative values of PBIAS indicate that on average the precipitation totals recorded at the synoptic stations were lower than at the meteorological stations. In most cases, better compatibility was found between the synoptic station in Czestochowa and both meteorological stations, as evidenced by the low values of PBIAS (Figure 5a). In general, the lowest values were calculated for PBIAS in July, which in Poland is usually the wettest month of the year. PBIAS tended to vary more during dry months than during the wet ones. The same tendency was found for stream flows by Gupta et al. [26].
Large values (>0.80) of R2 in February, March and October indicate that precipitation totals at the synoptic and meteorological stations were more consistent than in the other months. This means that more than 80% of the variation of precipitation totals in these months at the synoptic stations explains variation of precipitation totals at the meteorological stations. The lowest values of R2 for the relationship between the synoptic and meteorological stations were found for the period from May to August (Figure 5b). In these months the RMSE and MAE were the greatest, confirming a high difference in precipitation totals between the synoptic stations and meteorological ones. The main reason for great variability of precipitation in warm-season is greater than in cold-season share of convective rainfalls (including thunderstorms). In Poland, convective type of precipitation occurs over the whole year but its frequency is higher in summer than in winter.
At the annual scale, Czestochowa better represented the precipitation conditions at both meteorological stations than Lodz. In July, the month with the highest variability of precipitation, it was more evident for Lodz. To characterise precipitation patterns of the LMB region, which is vulnerable to climate-related hazards, data from both synoptic stations should be taken into account and recommended. These stations have long-term data series and are of a higher order of magnitude (importance) compared to the meteorological stations.
4.4. Monthly Precipitation Patterns and Non-Exceedance Probability Distibution (p, %)
To determine the risk of extremely low and high monthly precipitation, we tested the compatibility of the theoretical normal and gamma distributions with empirical data series using Pearson’s chi-squared test.
The consistency of empirical data distribution was tested with the theoretical normal and gamma distributions, separately. It was assumed, at the significance level α = 0.05, a null hypothesis (H0) that the distribution is normal or gamma and an alternative hypothesis (H1) on the rejection of the H0. The p-values greater than 0.05 indicated no basis to reject the H0.
The majority of tested monthly data series was described by the gamma distribution (compare Table 7 with Table 8). The gamma distribution is one-sidedly bounded with zero value and provides relatively good compatibility with empirical data. It is widely used to estimate a probability of precipitation totals within a specified range [35,36,37,38,39]. Its shape is similar to the one of precipitation data histograms.
Table 7.
Results (p-values) of Pearson’s chi-squared test for normality of the monthly precipitation totals.
Table 8.
Results (p-values) of Pearson’s chi-squared tests for gamma distribution of the monthly precipitation totals.
Górski [38] found that in the weather conditions of Poland annual precipitation totals can be described by the normal as well as the gamma distribution, but monthly sums are evidently asymmetric, thus better described by the gamma distribution. In addition, analysis of multi-annual monthly precipitation totals for 32 meteorological stations in the Bashkortostan Republic (Russian Federation) revealed that all data series had the gamma distribution [40].
On the basis of gamma distribution we determined different non-exceedance probability of monthly precipitation totals. Considering water needs of crops and the risk of agricultural drought we examined monthly sums at probability p ≤ 20% in details. Taking into account the safety of the LMB and need for constant drainage (dewatering) of the lignite deposit, precipitation totals at p ≥ 80% were also recognised.
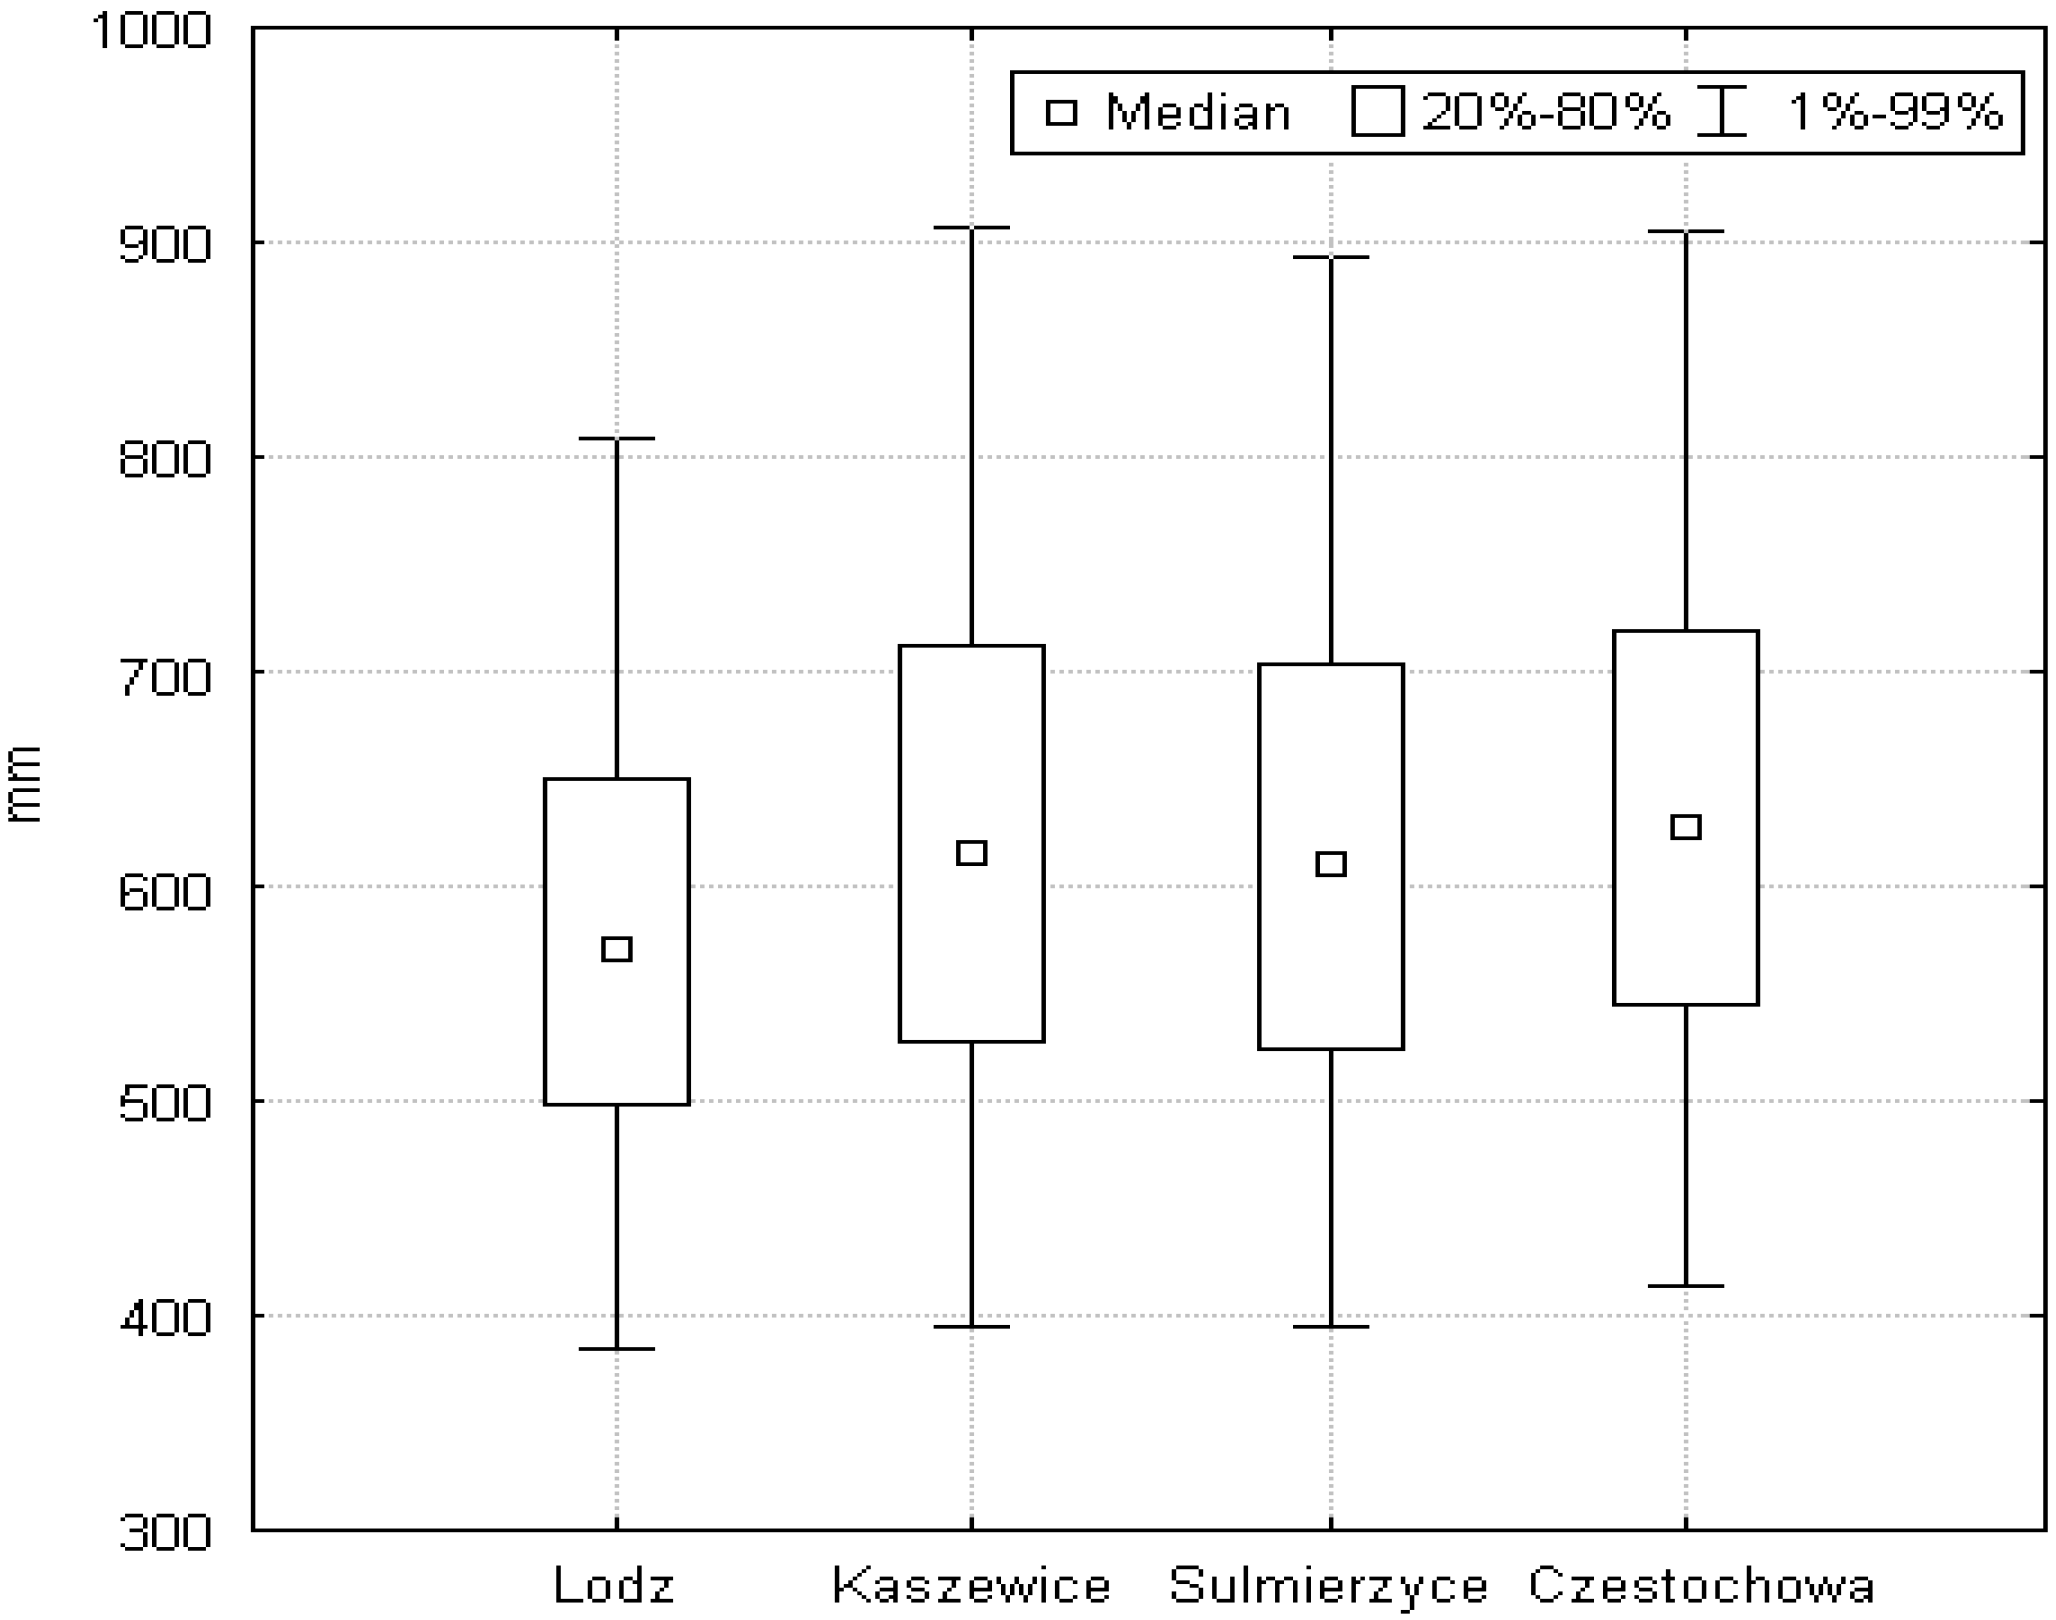
The probability of non-exceedance at p = 1%, 20%, 50%, 80% and 99% are presented on box-and-whiskers plots (Figure 6, Figure 7 and Figure 8). The lower part of the box presents the precipitation sum which together with lower values occur with a frequency of ≤20% (precipitation shortage). The upper part of the box shows the precipitation totals at p = 80%, the threshold value determining precipitation excess. The lower (bottom) whisker presents the extremely low precipitation (p = 1%) and the upper whisker indicates the extremely high precipitation (p = 99%). The point inside the box indicates the median.
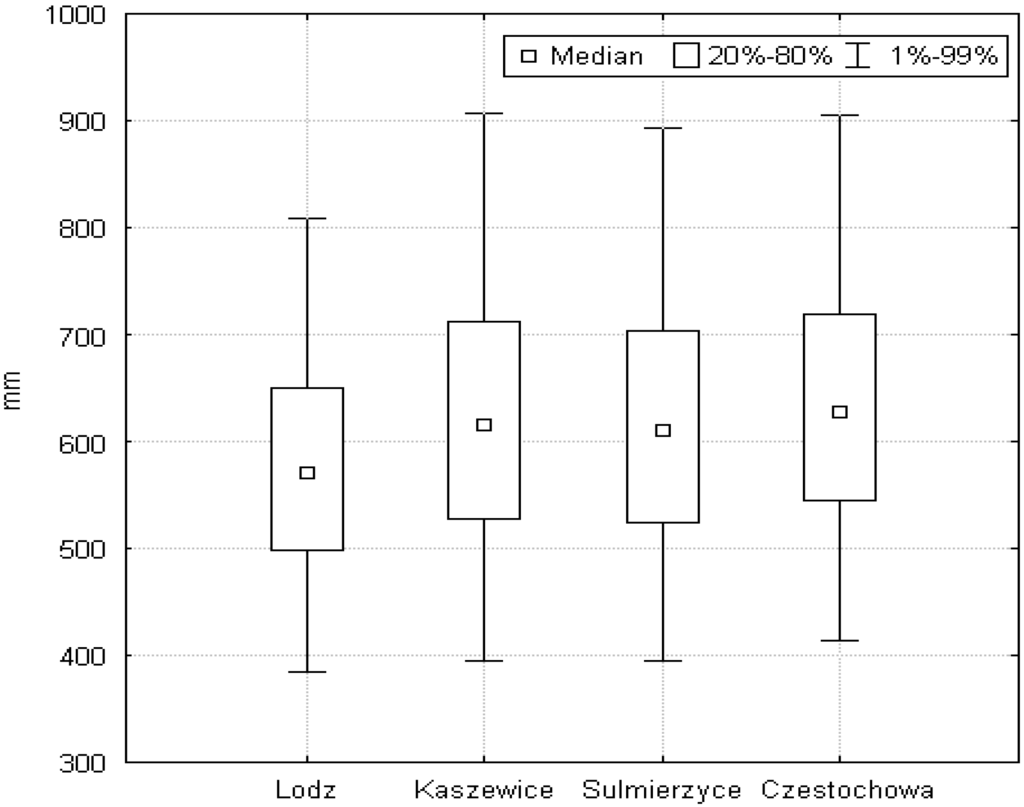
Figure 6.
Annual precipitation totals at different non-exceedance probability (p, %) for the weather stations.
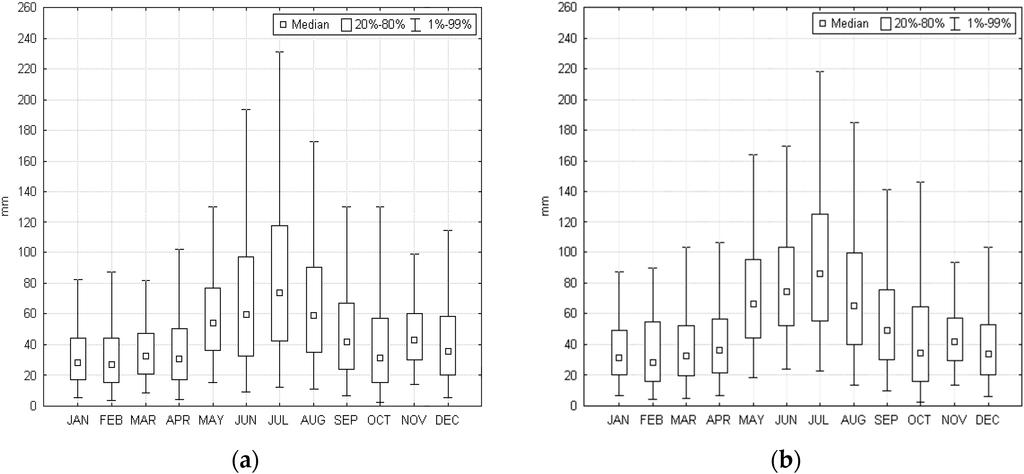
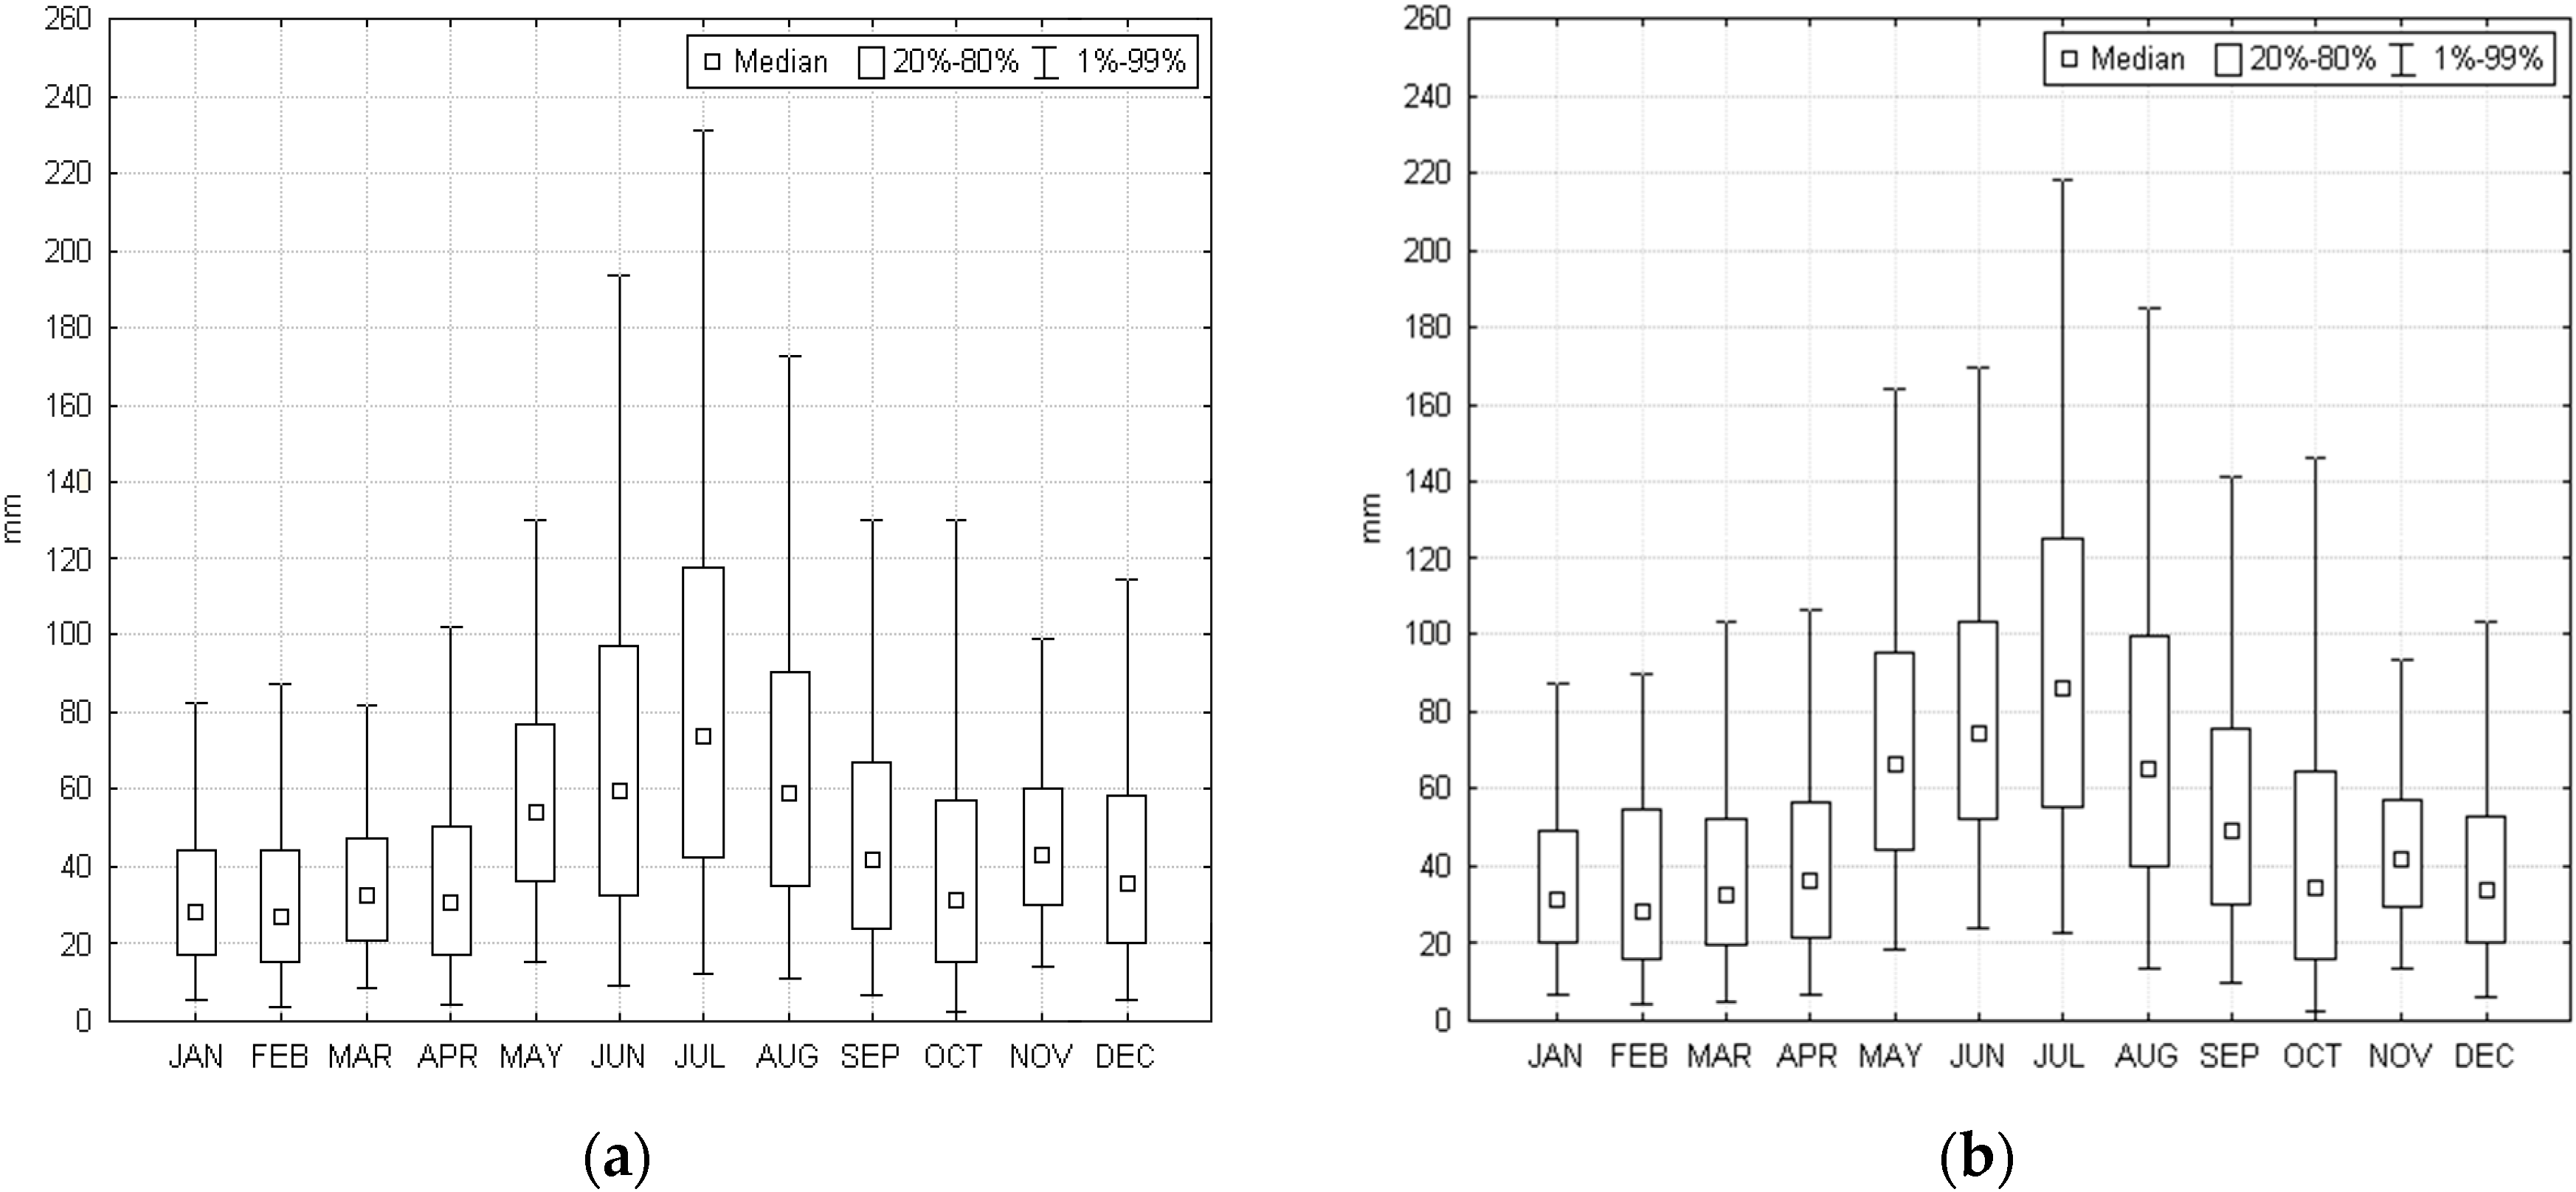
Figure 7.
Monthly precipitation totals at different non-exceedance probability (p, %) at the synoptic stations in Lodz (a) and Czestochowa (b).
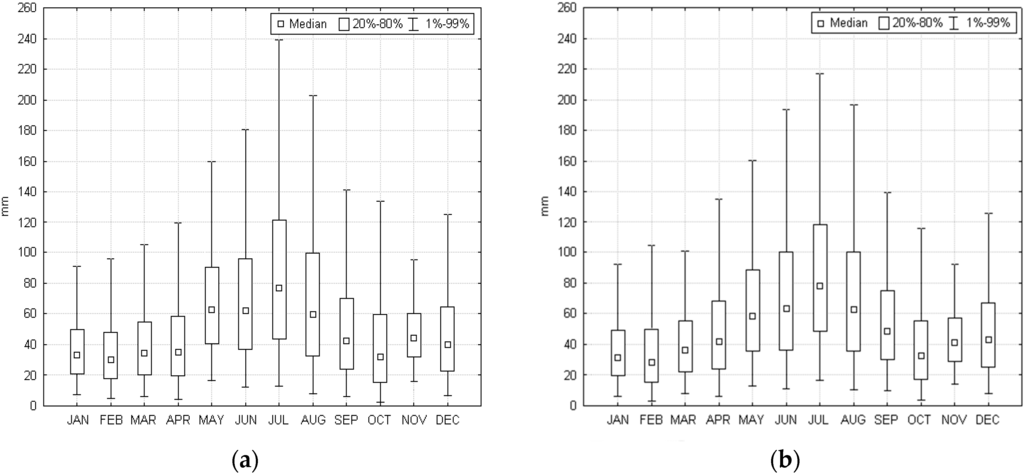
Figure 8.
Monthly precipitation totals at different non-exceedance probability (p, %) at the meteorological stations in Sulmierzyce (a) and Kaszewice (b).
The gradation of annual and monthly precipitation totals at different non-exceedance probability for all of the weather stations was generally the same as the long-term average sums (i.e., from the lowest in Lodz to the highest in Czestochowa). The median values were generally lower than the average monthly and annual totals, pointing to the right asymmetry of the frequency distribution. These asymmetries were more evident for the monthly sums distribution than for annual sums.
According to the non-exceedance probability, the lowest annual precipitation totals amounting from 384 mm in Lodz to 414 mm in Czestochowa can be expected once over the hundred years (p = 1%). At p = 99% (also once over the 100 years), extremely high annual precipitation amount from 808 in Lodz to 908 mm in Kaszewice. The maximum annual precipitation totals (see Table 4) recorded in Kaszewice and Sulmierzyce in 2010 were even higher (p > 99%) and amounted 934 and 953 mm, respectively. The annual precipitation totals in Lodz diverge from precipitation at other stations (Figure 6).
For the monthly sums, the distance between the median and the bottom part of the box and the bottom whisker is visibly shorter than the distance between median and the upper part of the box and the upper whisker, indicating lower variability of precipitation sum in the periods with precipitation shortage.
The distribution of precipitation for very dry, abnormally dry and extremely dry months (p ≤ 20%) is characterised by lower dispersion of values compared to wet months (p ≥ 80%) at all four weather stations (Figure 7 and Figure 8). This also results from the applied gamma distribution and indicates lower variability of precipitation sum in the periods with precipitation shortage. At p = 99%, Lodz has the highest values of precipitation in June and July (summer time) of all of the weather stations, while from December to April (winter and spring time) the highest monthly precipitation totals can be expected in the LMB impact area, represented by the meteorological stations.
At the meteorological stations located in the LMB impact area, the monthly precipitation sums at p ≥ 80% from December to April and in August were higher compared to the synoptic stations. This may be caused by so-called industrial clouds generated by the huge industrial facilities, i.e., power plants. Selvam et al. [41] stated that this phenomenon can cause various changes in microclimate of adjoining areas, e.g., increased precipitation. Further investigations and extended to the analysis of at least daily precipitation patterns in the LMB area would explain this phenomenon.
4.5. Analysis of Abnormal Precipitation Totals for Safety of Agriculture Production and Mine Operation
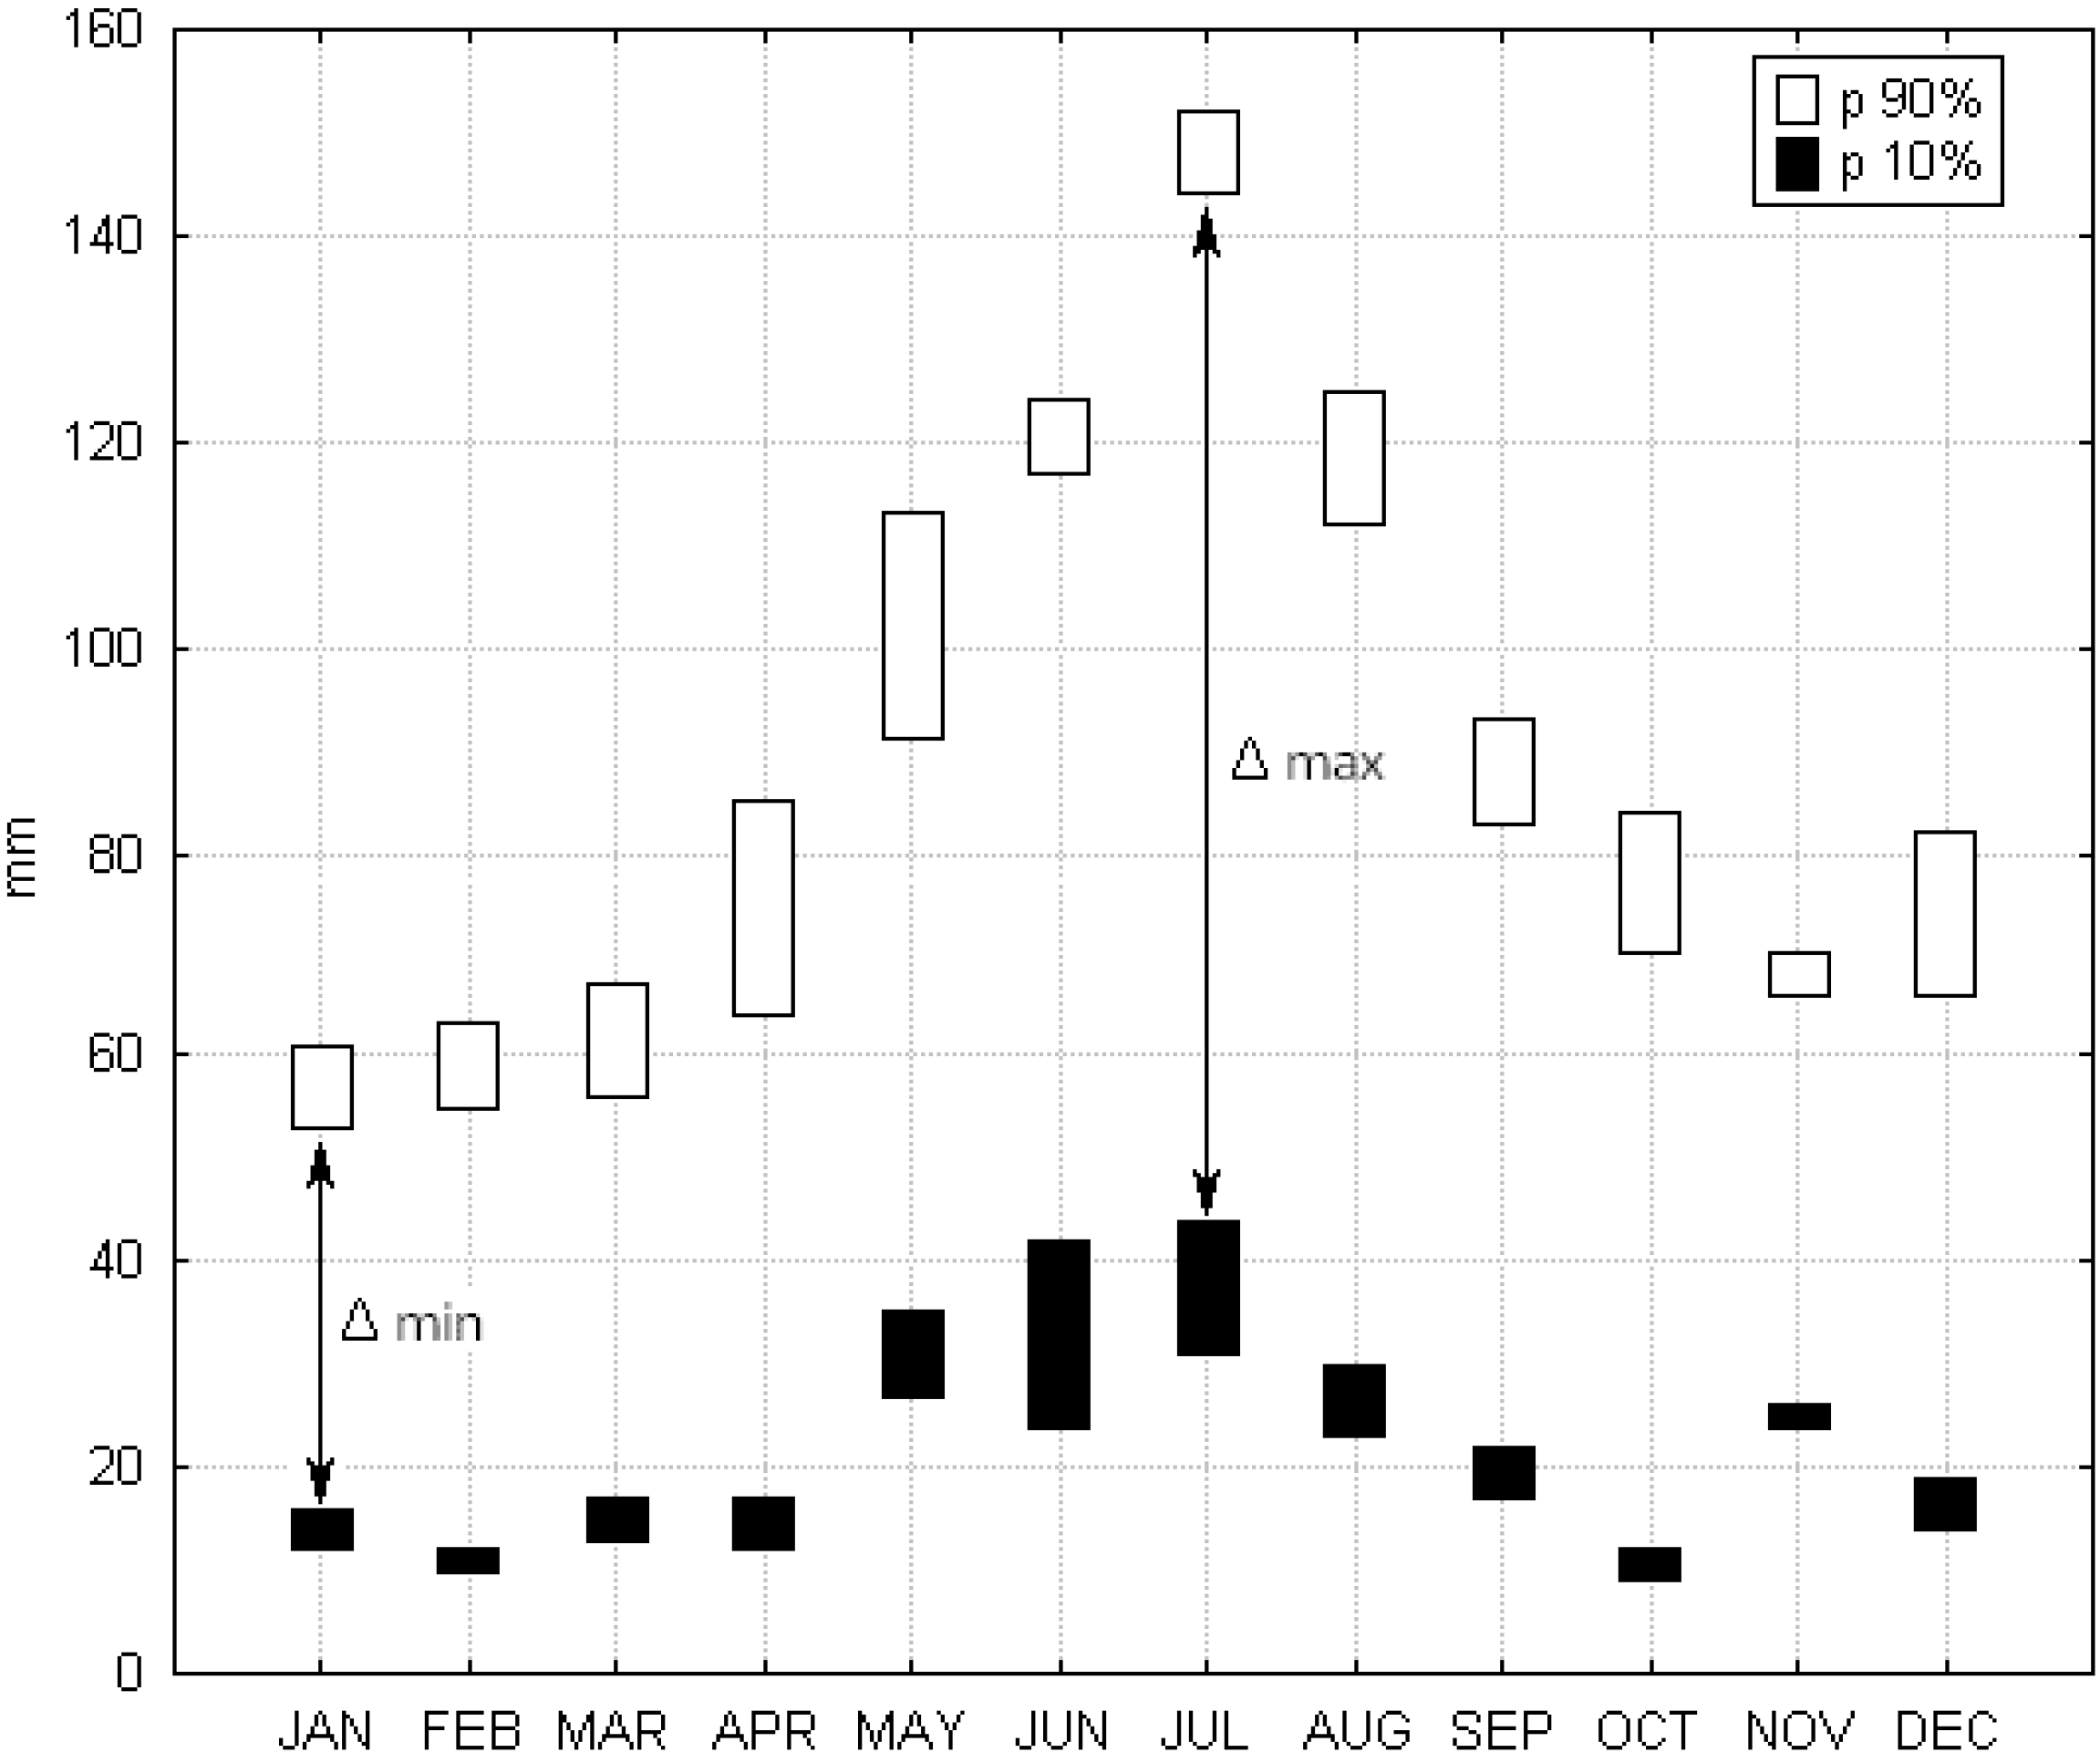
In detail, we analysed monthly low (p = 10%) and high (p = 90%) precipitation totals, which are likely to occur every ten years. In Figure 9, the lower limit of each box means the lowest monthly precipitation, whereas the upper shows the highest from all of the analysed weather stations at the given probability. The distance between the lower and upper limits of the box indicates the spatial variability of monthly precipitation. The delta symbol (Δ) means the difference between minimum monthly precipitation at p = 90% (abnormally wet) and maximum at p = 10% (abnormally dry). Therefore, it can be interpreted as a temporal variability of monthly precipitation.
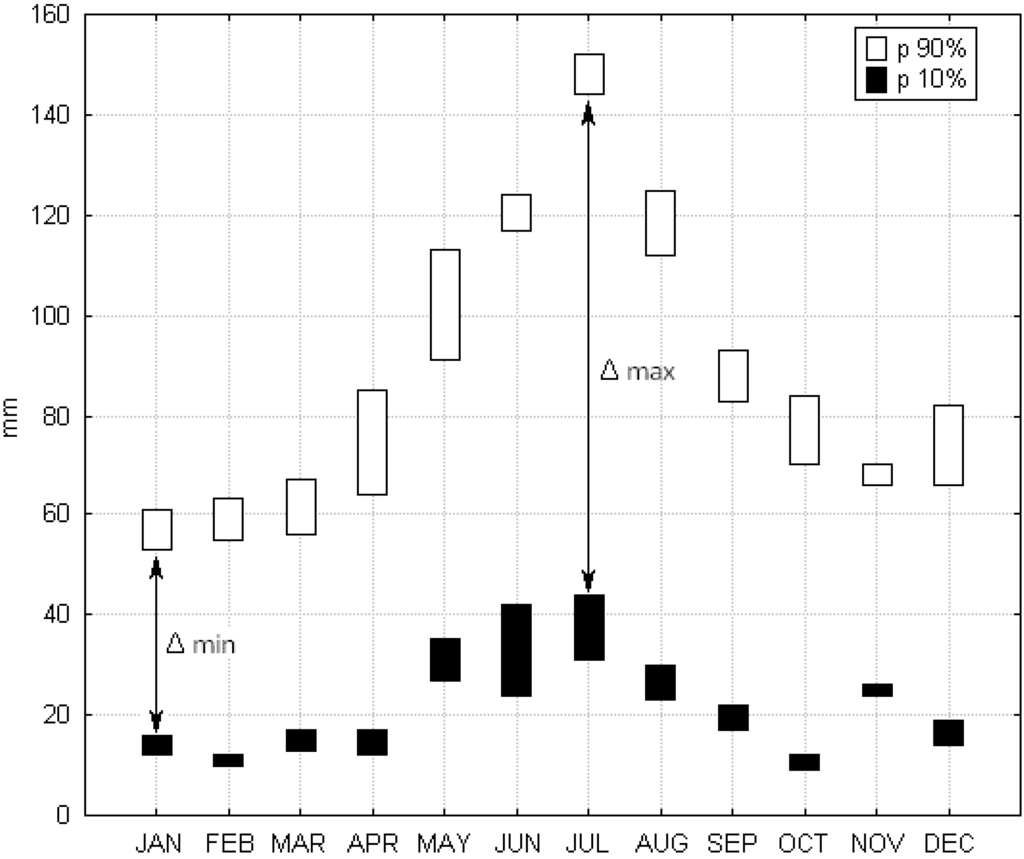
Figure 9.
Variability of monthly precipitation totals at probability p = 10% and p = 90%.
The amount of rain in the growing season (from April to October) at the analysed region is significant for rain-fed type of soil water management (without groundwater feeding, see Section 2). The monthly precipitation patterns are very relevant at p = 10% for assessment and management of the agricultural drought risk. This non-exceedance probability corresponds to abnormal drought likely to occur every ten years. Monthly precipitation less than 17 mm (p ≤ 10%) may occur in April (Figure 9), which is unfavourable for carrying out of pre-sowing agro-technical practices, winter crops tillering and spring crops emergence. Furthermore, precipitation totals not exceeding 28 mm at p = 10% in June (except Czestochowa) may also create a risk for the majority of crops, and most of these have their critical water demands usually at this month. In June, the average Penman–Monteith reference evapotranspiration in Poland equals to 103 mm [13]. This is when the water needs of crops cultivated on sandy soils in the Warta River basin amounts around 80–90 mm [42]. Even the precipitation amount matching the median value (from 60 mm in Lodz to 75 mm in Czestochowa) does not fully cover the crops water demands this month.
The knowledge about possible patterns of abnormal precipitation in June and July can be crucial for farmers’ activities to ensure stable crop yield and timely harvesting works. These months have the lowest and negative values of the climatic water balance (the difference between precipitation and reference evapotranspiration) in most area of Poland. This indicates increased water needs for crops and drought risk especially for those cultivated in rain-fed fields (without irrigation). The highest risk of agro-climatic drought in Poland was reported for the central part of the country. In the mean year the highest scarcity of water (more than 150 mm) was observed inter alia in the Warta river basin [43].
November was the month with the lowest temporal and spatial precipitation variability. This month Δ value was (after January with Δmin) the lowest in the year (Figure 9). This may indicate that November is the safest month for activities related to the operation of the LMB due to low probability of extreme precipitation events. The Δmax was in July. It proves the large temporal variability of precipitation of this month. July was characterised by low spatial variability, especially in the case of high precipitation totals (p ≥ 90%). This means that planning of the lignite deposit dewatering system and the LMB safety the long-term data series and the probability distribution of monthly precipitation from Lodz and Czestochowa can be used. The monthly precipitation totals displayed at the upper limits of the boxes and describing the non-exceedance probability at 90% are especially relevant for planning activities/operations against flooding risk of lignite deposits.
The exposure of the mining sector to flooding hazard is forecast to increase because of climate change. Identifying and understanding the potential risk is critical to elaborate strategies and actions for the mining industry to avoid or minimize possible harm [44]. Due to flooding risk of the pit, as well as mining equipment and facilities, the information about precipitation at probability p ≥ 90% (which corresponds to abnormally wet and extremely wet conditions) is necessary. July is characterised by the highest precipitation totals during the whole year (Figure 9). Thus, it can be used as an indicator of possible maximum monthly precipitation totals for planning the efficiency of the lignite deposits dewatering (drainage) system.
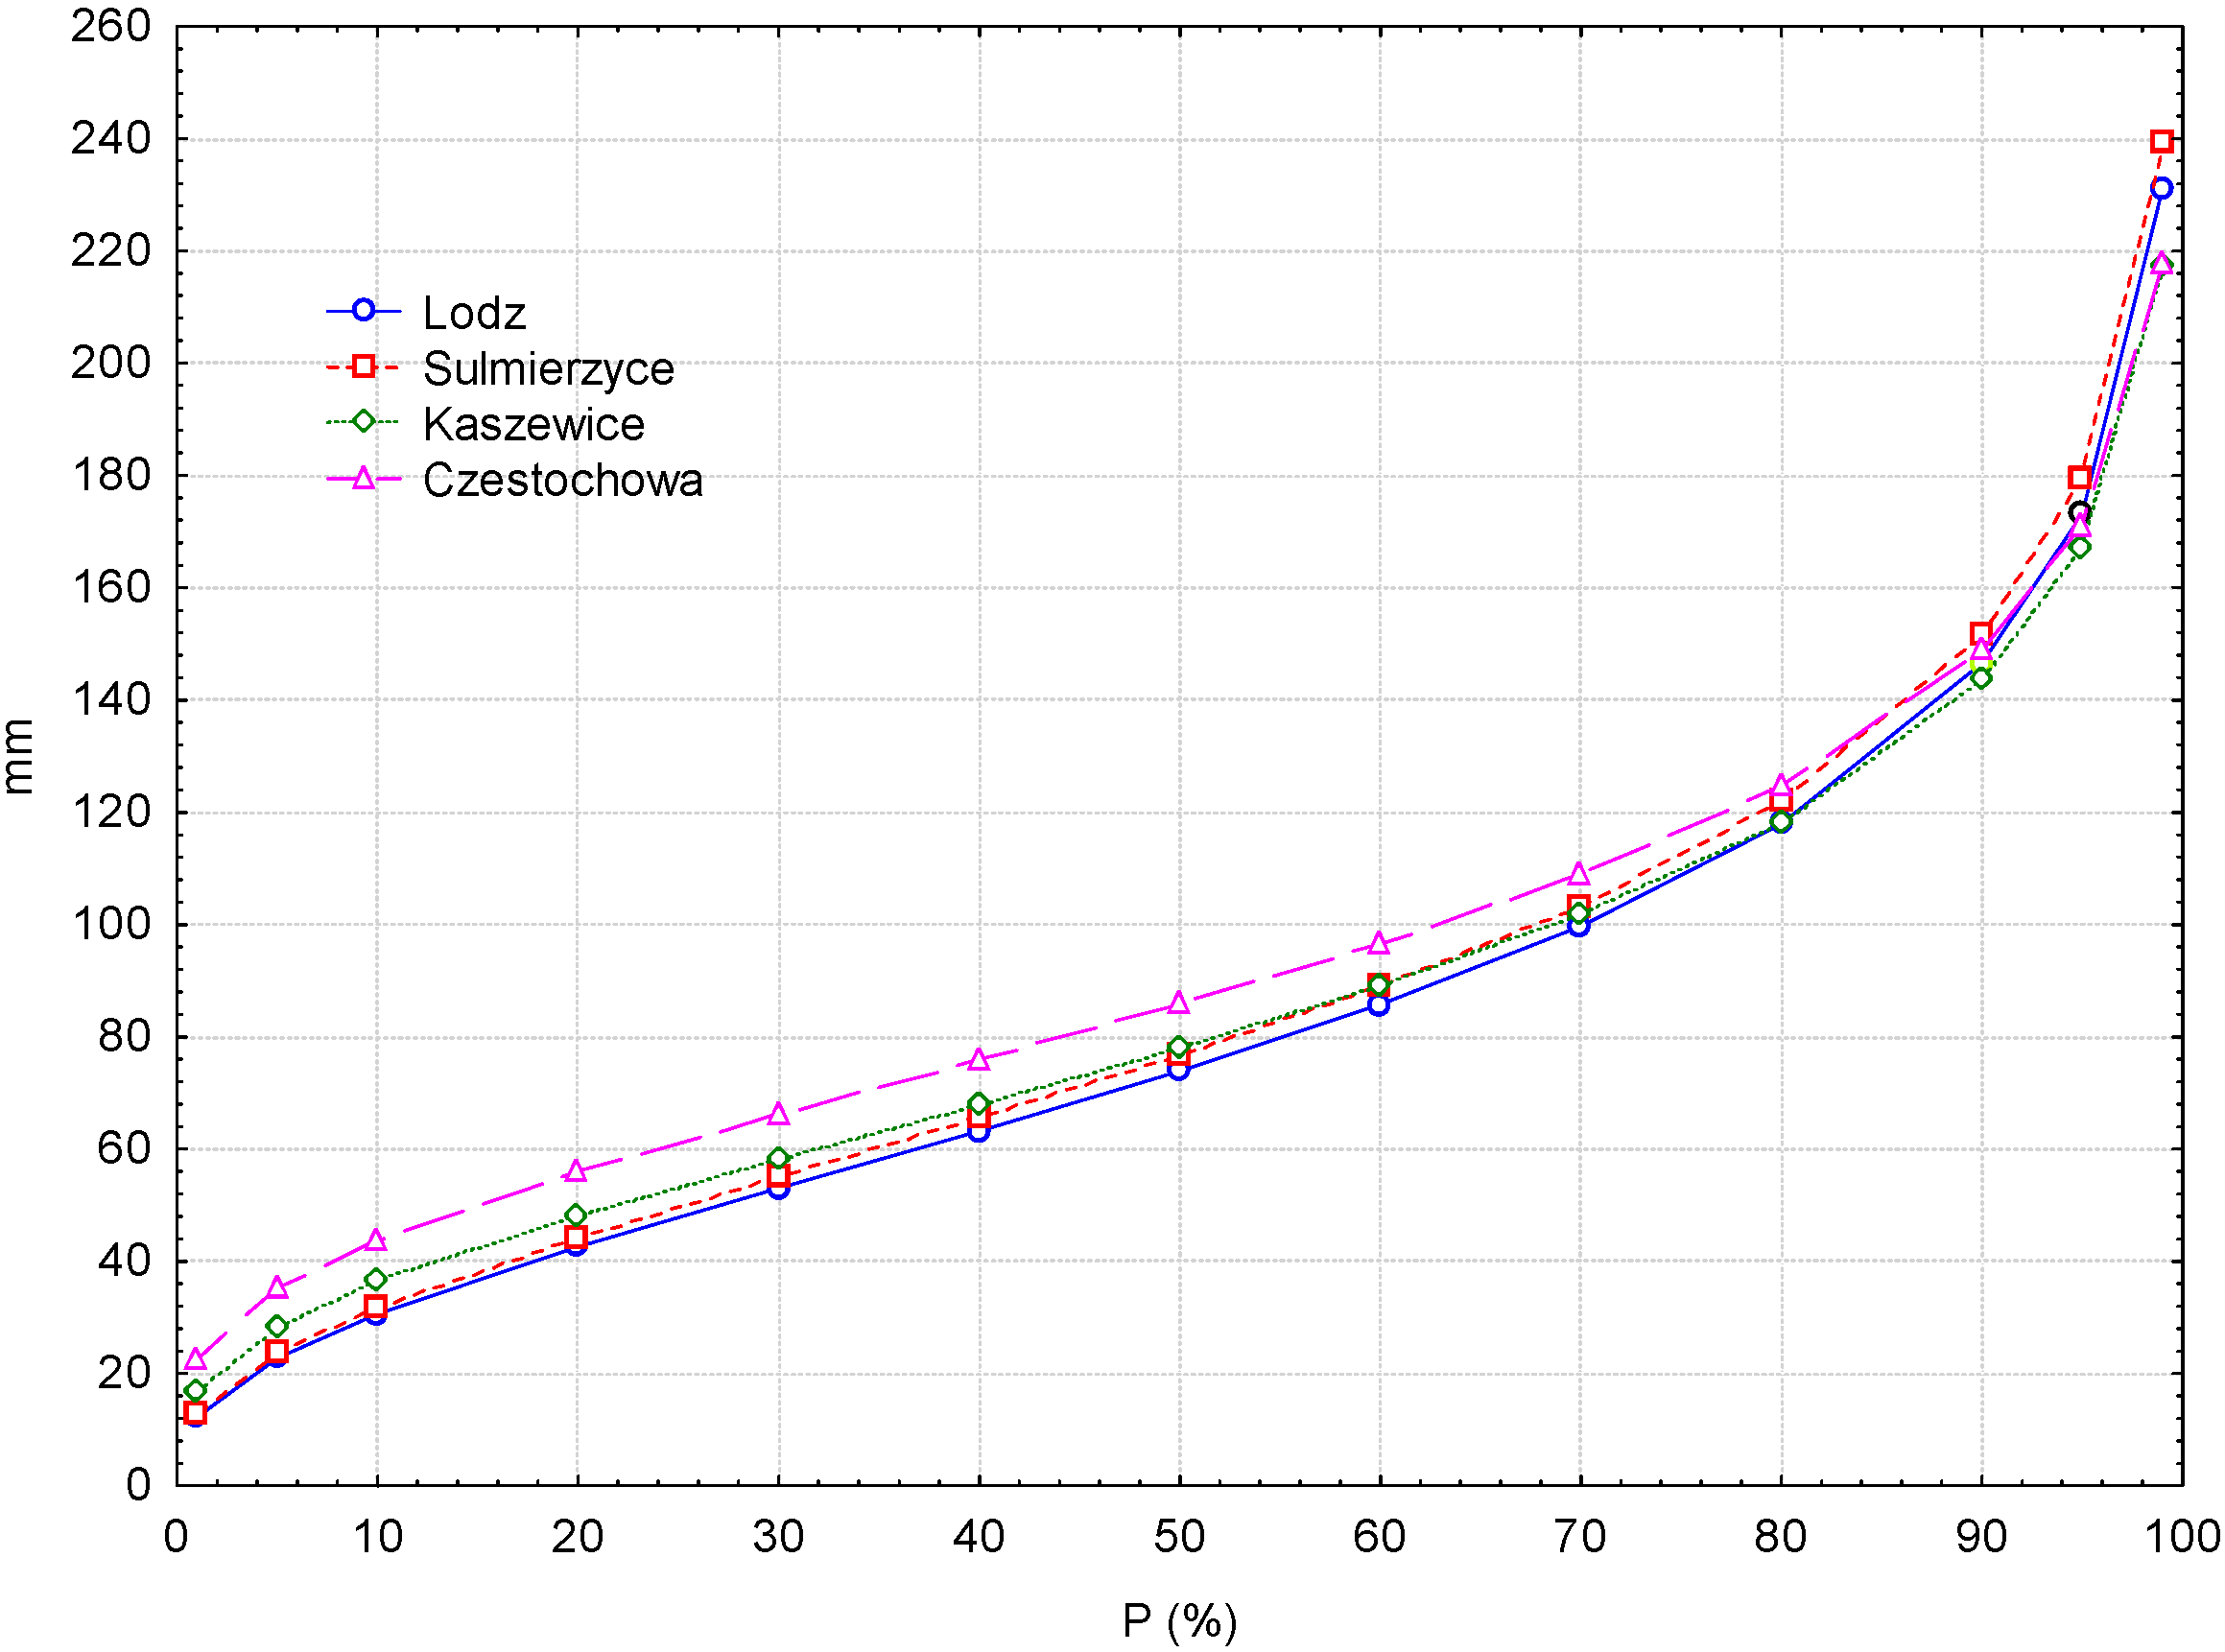
Another danger to the operation of the LMB is related to the precipitation patterns in long periods (of a month or few consecutive months) with rainfall of low intensity when monthly sum amounts ≥200 mm. It creates favourable conditions for landslides to occur. Open-cast mines are especially vulnerable to this type of natural hazard. In the LMB the frequency and size of landslides belong to the largest ones in Poland. A total number of 238 landslides were observed until 1988. Later, 48 more of these events occurred [45]. The largest, with a volume of 3.5 million m3, took place in March 2005. The activation and development of landslides have been observed inter alia in time of heavy precipitation events [46]. The monthly precipitation totals amounted to more than 200 mm in July at the each of the analysed weather station, which implies that landslides are very likely to occur in this month as a consequence of heavy and/or long lasting rains. In July, the likelihood of monthly precipitation totals of ≥200 mm is once within several years (p > 95%) at all four analysed weather stations (Figure 10).
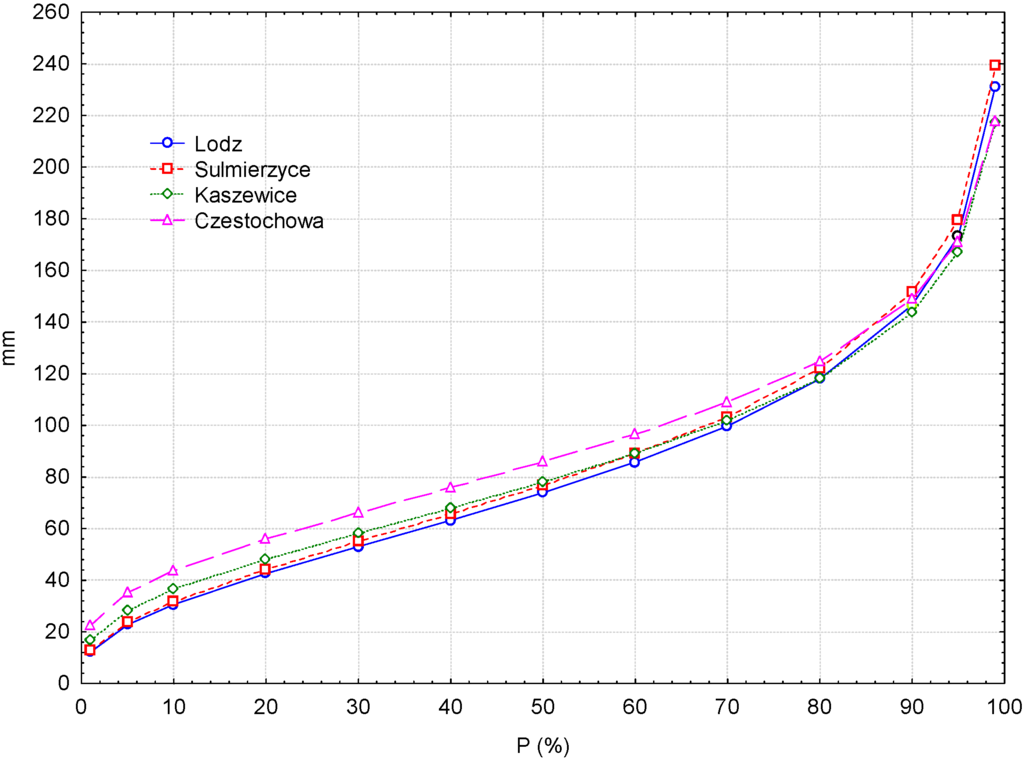
Figure 10.
Precipitation in July at a different non-exceedance probability.
5. Conclusions
This paper presents variability of monthly precipitation totals in the region dominated by lignite open-cast mining and agriculture activities. Vulnerability of this region to extreme precipitation events has increased due to the activities and also due to deep drainage of lignite deposits. Precipitation totals determined with the different probability of non-exceedance are a basis for risk assessment against abnormally wet and dry periods in the mining and adjoining agricultural area.
Annual and monthly precipitation was characterised by a large variation of values. The highest average monthly precipitation totals were registered in July and the lowest in February. Minimum monthly totals (less than 10 mm) were recorded in the period between January and April and in October at all the weather stations. Maximum totals, amounting to more than 200 mm, were noted in July.
There were no statistically significant trends in monthly and annual precipitation totals in the analysed 50-year period. However, the concentration of extreme low and extreme high monthly precipitation totals at the turn of 20th and 21st centuries indicate the coming climate changes.
To describe precipitation patterns of the LMB region, which is vulnerable to climate-related hazards, data from both synoptic stations (Lodz and Czestochowa) are recommended. Annual precipitation variability in the LMB region was better characterised by the station in Czestochowa. The same station also characterised precipitation patterns most precisely in the impact area in most of the months. However, when planning the principles of water management and assessing flooding risk in the mine, one should also take into account the monthly precipitation from Lodz where the highest monthly sum (268 mm) was registered.
Acknowledgments
We thank all anonymous reviewers for their helpful comments. We thank Agnes Jung for her contribution and comments to English language and style.
Author Contributions
Wiesława Kasperska-Wołowicz conceived the methodological framework and the paper structure, analysed the data, interpreted results, prepared the manuscript, and contributed to the paper aims forming and literature overview. Karolina Smarzyńska contributed to the data analysis and results interpretation, overviewed the thematic literature, drew maps, and prepared the manuscript. Zygmunt Miatkowski formulated the idea of the paper, analysed the data, interpreted results, overviewed the thematic literature and prepared the manuscript. Tymoteusz Bolewski contributed to statistical analysis, interpretation of results, and prepared the figures. Ryszard Farat prepared the meteorological datasets and analysed the data.
Conflicts of Interest
The authors declare no conflict of interest.
References
- Ray, D.K.; Gerber, J.S.; MacDonald, G.K.; West, P.C. Climate variation explains a third of global crop yield variability. Nat. Commun. 2015, 6, 5989. [Google Scholar] [CrossRef] [PubMed]
- Lobell, D.B.; Schlenker, W.; Costa-Roberts, J. Climate trends and global crop production since 1980. Science 2011, 333, 616–620. [Google Scholar] [CrossRef] [PubMed]
- Kundzewicz, Z.W.; Kozyra, J. Reducing impacts of climatic threats to agriculture and rural areas. Pol. J. Agron. 2011, 7, 68–81. [Google Scholar]
- Choi, Y.; Park, H.-P.; Sunwoo, C. Flood and gully erosion problems at the Pasir open pit coal mine, Indonesia: A case study of the hydrology using GIS. Bull. Eng. Geol. Environ. 2008, 67, 251–258. [Google Scholar] [CrossRef]
- Łączny, M.J.; Sienkiewicz-Małyjurek, K.; Olszewski, P. Ocena zagrożeń czynnikami klimatycznymi w gminach i zakładach górniczych. Prz. Górniczy 2012, 68, 44–51. (In Polish) [Google Scholar]
- Grünewald, U. Water resources management in river catchments influenced by lignite mining. Ecol. Eng. 2001, 17, 143–152. [Google Scholar] [CrossRef]
- Hangen-Brodersen, C.; Strempel, P.; Grünewald, U. Characteristics of catchments disturbed by lignite mining—Case study of Schlabendorf/Seese (Germany). Ecol. Eng. 2005, 24, 37–48. [Google Scholar] [CrossRef]
- Jończyk, I.; Szczepiński, J. Czynniki rozwoju leja depresyjnego w rejonie KWB “Bełchatów” SA. Available online: http://warsztatygornicze.pl/wp-content/uploads/2004_20.pdf (accessed on 17 May 2016).
- Miatkowski, Z.; Przeździecki, K.; Zawadzki, J. Obserwacje zróżnicowania przestrzennego warunków wodnych trwałych użytków zielonych w zakresie widzialnym i bliskiej podczerwieni w regionie oddziaływania kopalni odkrywkowej węgla brunatnego. Roczn. Geomatyki 2013, 11, 59–68. (In Polish) [Google Scholar]
- Motyka, J.; Czop, M.; Jończyk, W.; Stachowicz, Z.; Jończyk, I.; Martyniak, R. Wpływ głębokiej eksploatacji węgla brunatnego na zmiany środowiska wodnego w rejonie kopalni “Bełchatow”. Górnictwo Geoinżynieria 2007, 31, 447–487. (In Polish) [Google Scholar]
- Zawadzki, J.; Przeździecki, K.; Miatkowski, Z. Determining the area of influence of depression cone in the vicinity of lignite mine by means of triangle method and LANDSAT TM/ETM+ satellite images. J. Environ. Manag. 2016, 166, 605–614. [Google Scholar] [CrossRef] [PubMed]
- Zhang, X.; Gao, L.; Barrett, D.; Chen, Y. Evaluating water management practice for sustainable mining. Water 2014, 6, 414–433. [Google Scholar] [CrossRef]
- Łabędzki, L.; Bąk, B.; Smarzyńska, K. Spatio-temporal variability and trends of Penman-Monteith reference evapotranspiration (FAO-56) in 1971–2010 under climatic conditions of Poland. Pol. J. Environ. Stud. 2014, 23, 2083–2091. [Google Scholar] [CrossRef]
- De Luis, M.; Gonzalez-Hidalgo, J.C.; Brunetti, M.; Longares, L.A. Precipitation concentration changes in Spain 1946–2005. Nat. Hazards Earth Syst. Sci. 2011, 11, 1259–1265. [Google Scholar] [CrossRef]
- Dubaniewicz, H.; Zawadzka, A. Główne cechy klimatu Bełchatowskiego Okręgu Przemysłowego. In Zmiany w Środowisku Przyszłego Bełchatowskiego Okręgu Przemysłowego: Stan z Okresu Przedinwestycyjnego i Wstępnej Fazy Pracy Elektrowni; Liszewski, S., Ed.; Wydawnictwo Naukowe PWN: Warszawa, Poland, 1985; pp. 79–93. (In Polish) [Google Scholar]
- Galiniak, G.; Farat, R. Zmienność opadów atmosferycznych na obszarze oddziaływania KWB „Bełchatów” w aspekcie oddziaływania powierzchniowego. Monogr. Kom. Gospod. Wodnej Polskiej Akad. Nauk 2014, 20, 117–127. (In Polish) [Google Scholar]
- Podstawczyńska, A. Okresy suche i wilgotne w Łodzi w XX wieku. Acta Univ. Lodz. Folia Geogr. Phys. 2007, 8, 9–25. (In Polish) [Google Scholar]
- Podstawczyńska, A. Temperatura powietrza i opady atmosferyczne w regionie łódzkim w ostatnim stuleciu. In Torfowisko Żabieniec: Warunki Naturalne, Rozwój i Zapis Zmian Paleoekologicznych w Jego Osadach; Twardy, J., Żurek, S., Forysiak, J., Eds.; Bogucki Wydawnictwo Naukowe: Poznań, Poland, 2010; pp. 63–73. (In Polish) [Google Scholar]
- Kondracki, J. Geografia Regionalna Polski; Wydawnictwo Naukowe PWN: Warszawa, Poland, 2000; p. 441. [Google Scholar]
- Gawlik, L.; Grudziński, Z. Coal has a future. Acad. Mag. Pol. Acad. Sci. 2009, 1, 16–19. [Google Scholar]
- Woś, A. Zarys Klimatu Polski; Wydawnictwo Naukowe UAM: Poznań, Poland, 1996; p. 301. [Google Scholar]
- Bellocchi, G.; Rivington, M.; Donatelli, M.; Matthews, K. Validation of biophysical models: Issues and methodologies. A review. Agron. Sustain. Dev. 2010, 30, 109–130. [Google Scholar] [CrossRef]
- Chai, T.; Draxler, R.R. Root mean square error (RMSE) or mean absolute error (MAE)?—Arguments against avoiding RMSE in the literature. Geosci. Model Dev. 2014, 7, 1247–1250. [Google Scholar] [CrossRef]
- Willmott, C.J. Some comments on the evaluation of the model performance. Bull. Am. Meteorol. Soc. 1982, 63, 1309–1313. [Google Scholar] [CrossRef]
- Wilmott, C.J.; Matsuura, K. Advantages of the mean absolute error (MAE) over the root mean square error (RMSE) is assessing average model performance. Clim. Res. 2005, 30, 79–82. [Google Scholar] [CrossRef]
- Gupta, H.V.; Sorooshian, S.; Yapo, P.O. Status of automatic calibration for hydrologic models: Comparison with multilevel expert calibration. J. Hydrol. Eng. 1999, 4, 135–143. [Google Scholar] [CrossRef]
- Moriasi, D.N.; Arnold, J.G.; Van Liew, M.W.; Bingner, R.L.; Harmel, R.D.; Veith, T.L. Model evaluation guidelines for systematic quantification of accuracy in watershed simulations. Trans. ASABE 2007, 50, 885–900. [Google Scholar] [CrossRef]
- Moriasi, D.N.; Gitau, M.W.; Pai, N.; Daggupati, P. Hydrologic and water quality models: Performance measures and evaluation criteria. Trans. ASABE 2015, 58, 1763–1785. [Google Scholar]
- Legates, D.R.; McCabe, G.J. Evaluating the use of “goodness-of-fit” measures in hydrologic and hydroclimatic model validation. Water Resour. Res. 1999, 35, 233–241. [Google Scholar] [CrossRef]
- Kasperska-Wołowicz, W.; Bolewski, T. Zmienność temperatury powietrza w Bydgoszczy w latach 1931–2013. Woda-Środowisko-Obsz. Wiej. 2015, 15, 25–43. (In Polish) [Google Scholar]
- Ilnicki, P.; Farat, R.; Górecki, K.; Lewandowski, P. Long-term air temperature and precipitation variability in the Warta River catchment area. J. Water Land Dev. 2015, 27, 3–13. [Google Scholar] [CrossRef]
- Hov, Ø.; Cubasch, U.; Fischer, E.; Höppe, P.; Iversen, T.; Kvamstø, N.G.; Kundzewicz, Z.W.; Rezacova, D.; Rios, D.; Duarte Santos, F.; et al. Trends in Extreme Weather Events in Europe: Implications for National and European Union Adaptation Strategies; European Academies Science Advisory Council (EASAC): Halle, Germany, 2013; p. 20. [Google Scholar]
- Stocker, T.F.; Qin, D.; Plattner, G.-K.; Tignor, M.; Allen, S.K.; Boschung, J.; Nauels, A.; Xia, Y.; Bex, V.; Midgley, P.M.; et al. Summary for policymakers. In Climate Change 2013: The Physical Science Basis, Contribution of Working Group I to the Fifth Assessment Report of the Intergovernmental Panel on Climate Change; Cambridge University Press: Cambridge, UK; New York, NY, USA, 2013; p. 27. [Google Scholar]
- Casanueva, A.; Rodríguez-Puebla, C.; Farías, M.D.; González-Reviriego, N. Variability of extreme precipitation over Europe and its relationships with teleconnection patterns. Hydrol. Earth Syst. Sci. 2014, 18, 709–725. [Google Scholar] [CrossRef]
- Ben-Gai, T.; Bitan, A.; Manes, A.; Alpert, P.; Rubin, S. Spatial and temporal changes in rainfall frequency distribution patterns in Israel. Theor. Appl. Climatol. 1998, 61, 177–190. [Google Scholar] [CrossRef]
- Lana, X.; Burgueño, A.; Martinez, M.D.; Serra, C. A review of statistical analyses on monthly and daily rainfall in Catalonia. Tethys J. Weather Clim. West. Mediterr. 2009, 6, 15–29. [Google Scholar] [CrossRef]
- Gąsiorek, E.; Musiał, E.; Rojek, M. Ocena dokładności oszacowania wskaźnika standaryzowanego opadu (SPI) wyznaczonego za pomocą różnych rozkładów prawdopodobieństwa. Inżynieria Ekologiczna 2014, 40, 92–99. (In Polish) [Google Scholar]
- Górski, T. Wpływ sumowania opadów atmosferycznych na postać dystrybuanty. Acta Agrophysica 2007, 9, 613–622. (In Polish) [Google Scholar]
- Husak, G.J.; Michaelsen, J.; Funk, C. Use of the gamma distribution to represent monthly rainfall in Africa for drought monitoring applications. Int. J. Climatol. 2006, 27, 935–944. [Google Scholar] [CrossRef]
- Volkova, T.; Longobardi, A.; Krasnogorskaya, N. Gamma distribution function as a tool for monthly precipitation generation in the Bashkortostan Republic, Russian Federation. In Latest Trends in Energy, Environment and Development; World Scientific and Engineering Academy and Society (WSEAS) Press: Salerno, Italy, 2014. [Google Scholar]
- Selvam, A.M.; Manohar, G.K.; Murty, B.V.R. Rainfall variations around a thermal power station. Atmos. Environ. (1967) 1976, 10, 963–968. [Google Scholar] [CrossRef]
- Dzieżyc, J.; Nowak, L.; Panek, K. Średnie regionalne niedobory opadów i potrzeby deszczowania roślin uprawnych na glebach lekkich i średnich. Zesz. Probl. Postępów Nauk Rol. 1987, 314, 11–34. (In Polish) [Google Scholar]
- Kasperska-Wołowicz, W.; Łabędzki, L. Climatic and agricultural water balance for grasslands in Poland using the Penman-Monteith method. Ann. Wars. Agric. Univ. Land Reclam. 2006, 37, 93–100. [Google Scholar]
- Chen, Y.; Liu, R.; Barrett, D.; Gao, L.; Zhou, M.; Renzullo, L.; Emelyanova, I. A spatial assessment framework for evaluating flood risk under extreme climates. Sci. Total Environ. 2015, 538, 512–523. [Google Scholar] [CrossRef] [PubMed]
- Jania, J.A.; Zwoliński, Z. Ektremalne zjawiska meteorologiczne, hydrologiczne i geomorfologiczne w Polsce. Landf. Anal. 2011, 15, 51–64. [Google Scholar]
- Mirek, A.; Biały, L. Stan zagrożeń naturalnych w kopalniach węgla brunatnego ze szczególnym uwzględnieniem zagrożeń występujących w KWB “Bełchatów”. Górnictwo Geoinżynieria 2009, 2, 327–341. (In Polish) [Google Scholar]


© 2016 by the authors; licensee MDPI, Basel, Switzerland. This article is an open access article distributed under the terms and conditions of the Creative Commons Attribution (CC-BY) license (http://creativecommons.org/licenses/by/4.0/).