Navigating towards Decoupled Aquaponic Systems: A System Dynamics Design Approach
Abstract
:1. Introduction
2. Objectives and Scope
3. Methodology and Data Sources
3.1. Dynamic Systems Analysis
3.2. FAO Penman-Monteith Equation
3.3. Input Data and Parametrization for RAS
3.4. Input Data and Parametrization for Hydroponics
3.5. Input Data and Parametrization for Remineralization
4. Theory
4.1. Decoupled System Design
4.1.1. Justification for Decoupled Systems
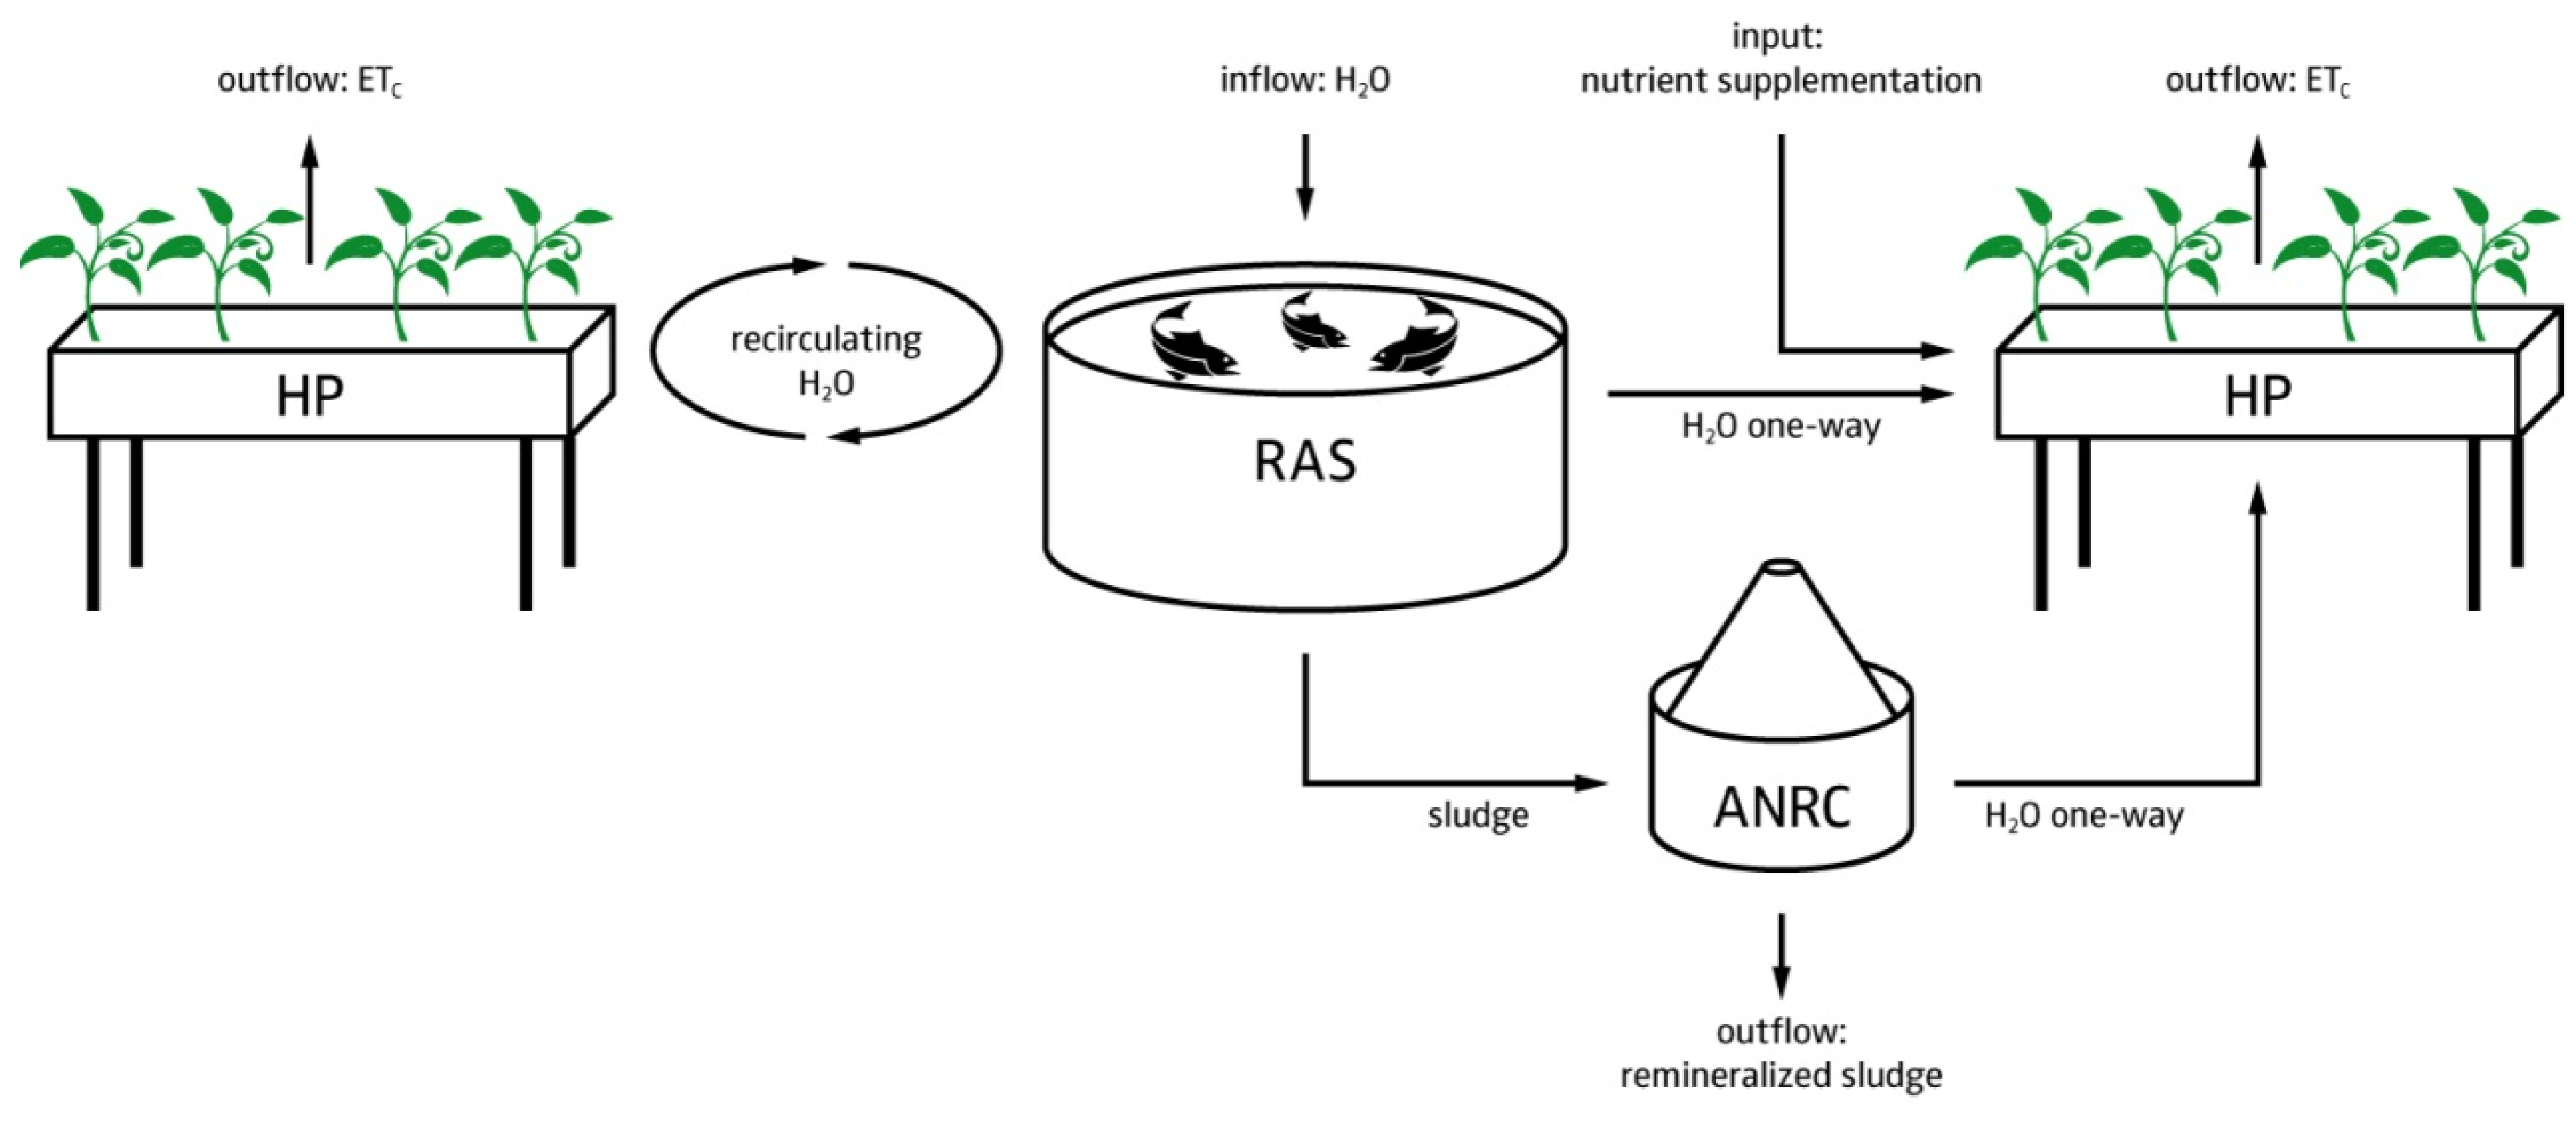
4.1.2. Hardware Layout
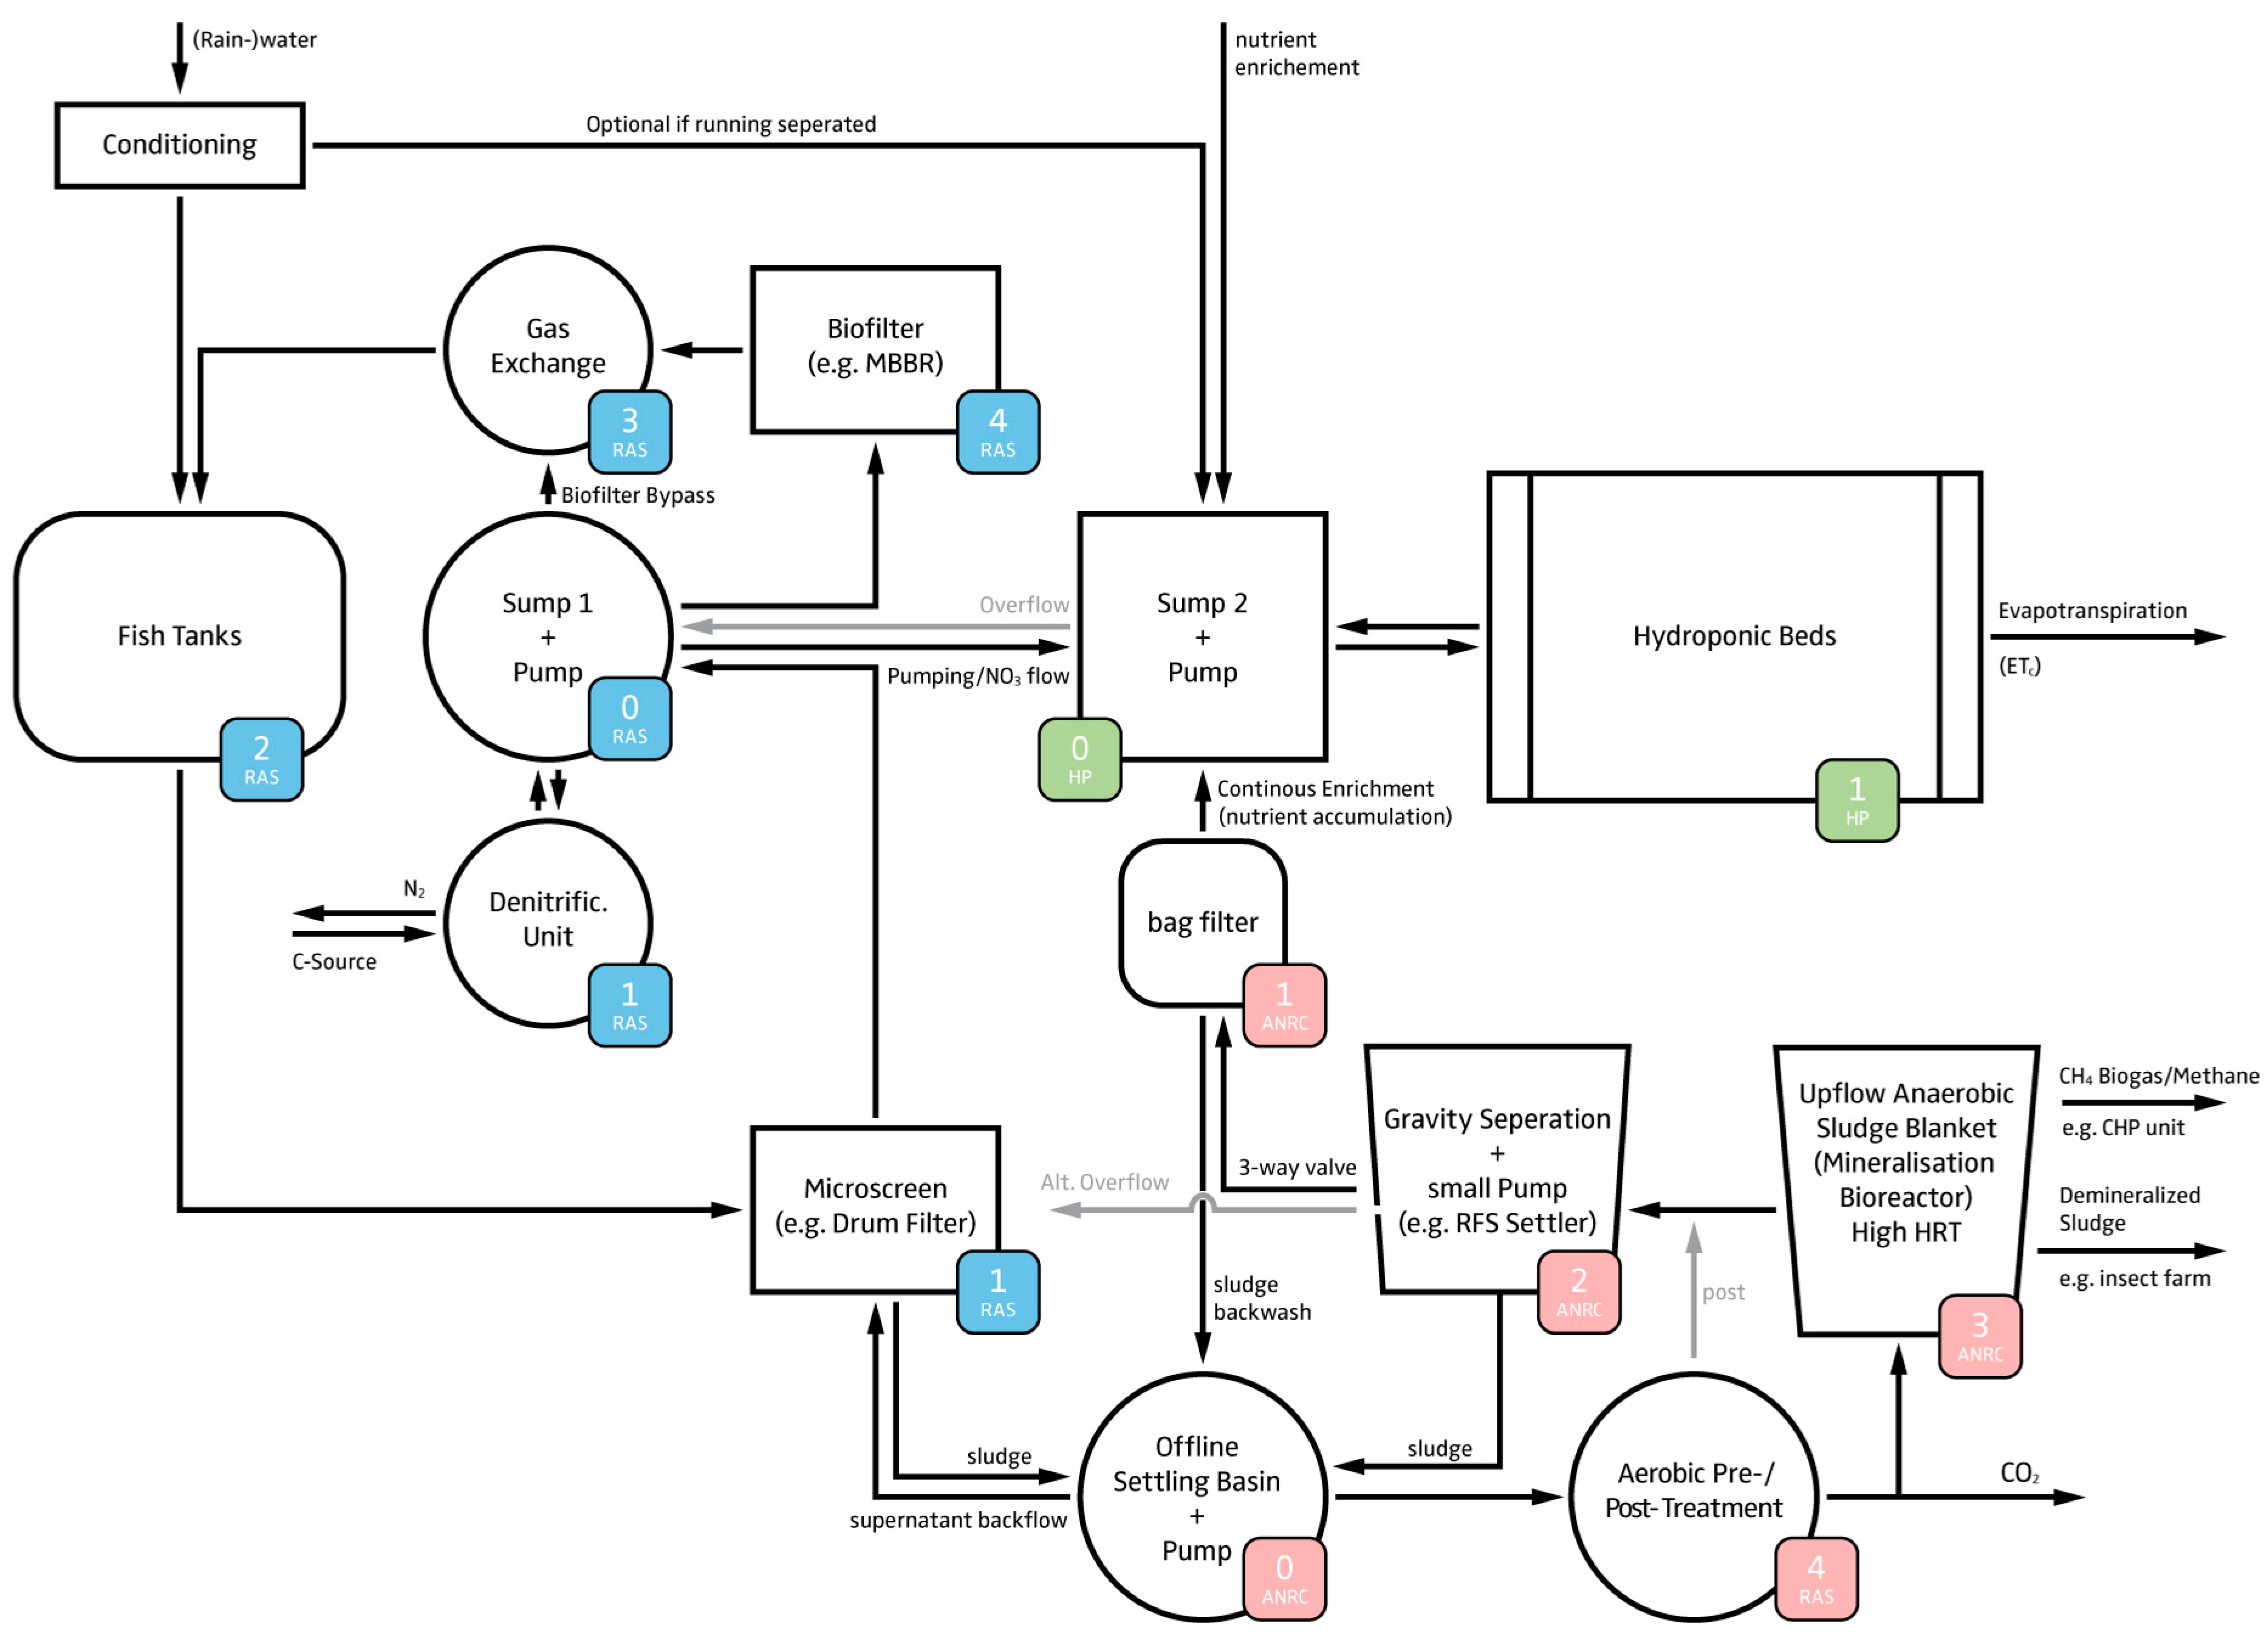
- The RAS is intended to manage the fish sludge and to provide control over the most important water quality parameters (dissolved oxygen, TAN, suspended solids, and carbon dioxide).
- Since UASBs have a high denitrification potential that is dependent on both HRT and SRT, a direct one way flow from RAS to the hydroponic component is required to control the nitrate dosing (i.e., provide the plants with N). This also includes a return overflow option; e.g., in case a sub-system needs to be re-coupled.
- Sludge thickening is a necessary prerequisite for the anaerobic digestion process [15]. An offline settling tank prior to the UASB is used for this process. In practice, activated sludge denitrification reactors can be installed upstream of the UASB to use some of the carbon source to get rid of nitrate and reduce sludge volume [80]. In our case, N is preferred to be kept in the system. However, N recovery in anaerobic sludge treatment is very much HRT dependent and only marginal, when exceeding an HRT over several hours [16].
- Hypothetically, digester effluents to RAS, even though they contain a high amount of sulfide, are not expected to affect water quality and therefore fish welfare due to dilution [17]. This also applies for the hydroponics-RAS return overflow.
- Two mechanical filtration steps are used to minimize the TSS in the UASB effluent.
- The hydroponic system is a hybrid system that utilizes dosing systems to manage nutrients, pH, electrical conductivity (EC), dissolved oxygen, and redox potential to maintain acceptable nutrient levels with precision.
- The outflow from both the ANRC and RAS, and the utilized water in the hydroponic component are congruent. Consequently, the utilized water in the hydroponic component, and thus the replenishment of water to the fish tanks must be high enough to avoid accumulation of nutrients in the RAS.
- The ANRC can be complemented with an aerobic pre- or post-treatment, as better remineralization performance can be assumed, and chemical oxygen demand (COD) reduction has been observed [81]. Yet, it must be noted that the drawback of an additional aerobic step is additional production of biomass (i.e., bacteria growth) that consumes part of the available nutrients. Whether the aerobic treatment proceeds or follows the anaerobic treatment depends on whether one prefers to increase the carbon dioxide concentration in the greenhouse (pre) or use the anaerobic digester as a biogas producing device (post). Even though the aerobic treatment most likely provides additional advantages (e.g., H2S reduction), it is no part of our software calculations. For the sake of completeness, we nonetheless added it to this scheme.
- The produced energy in form of electricity and heat, gained through CH4 combustion, can be returned to the system. This combustion also reduces greenhouse gas emissions. The combustion’s products (i.e., CO2 and H2O) can be lead back to the system as clean water and CO2 (greenhouse required) in order to enhance plant growth.
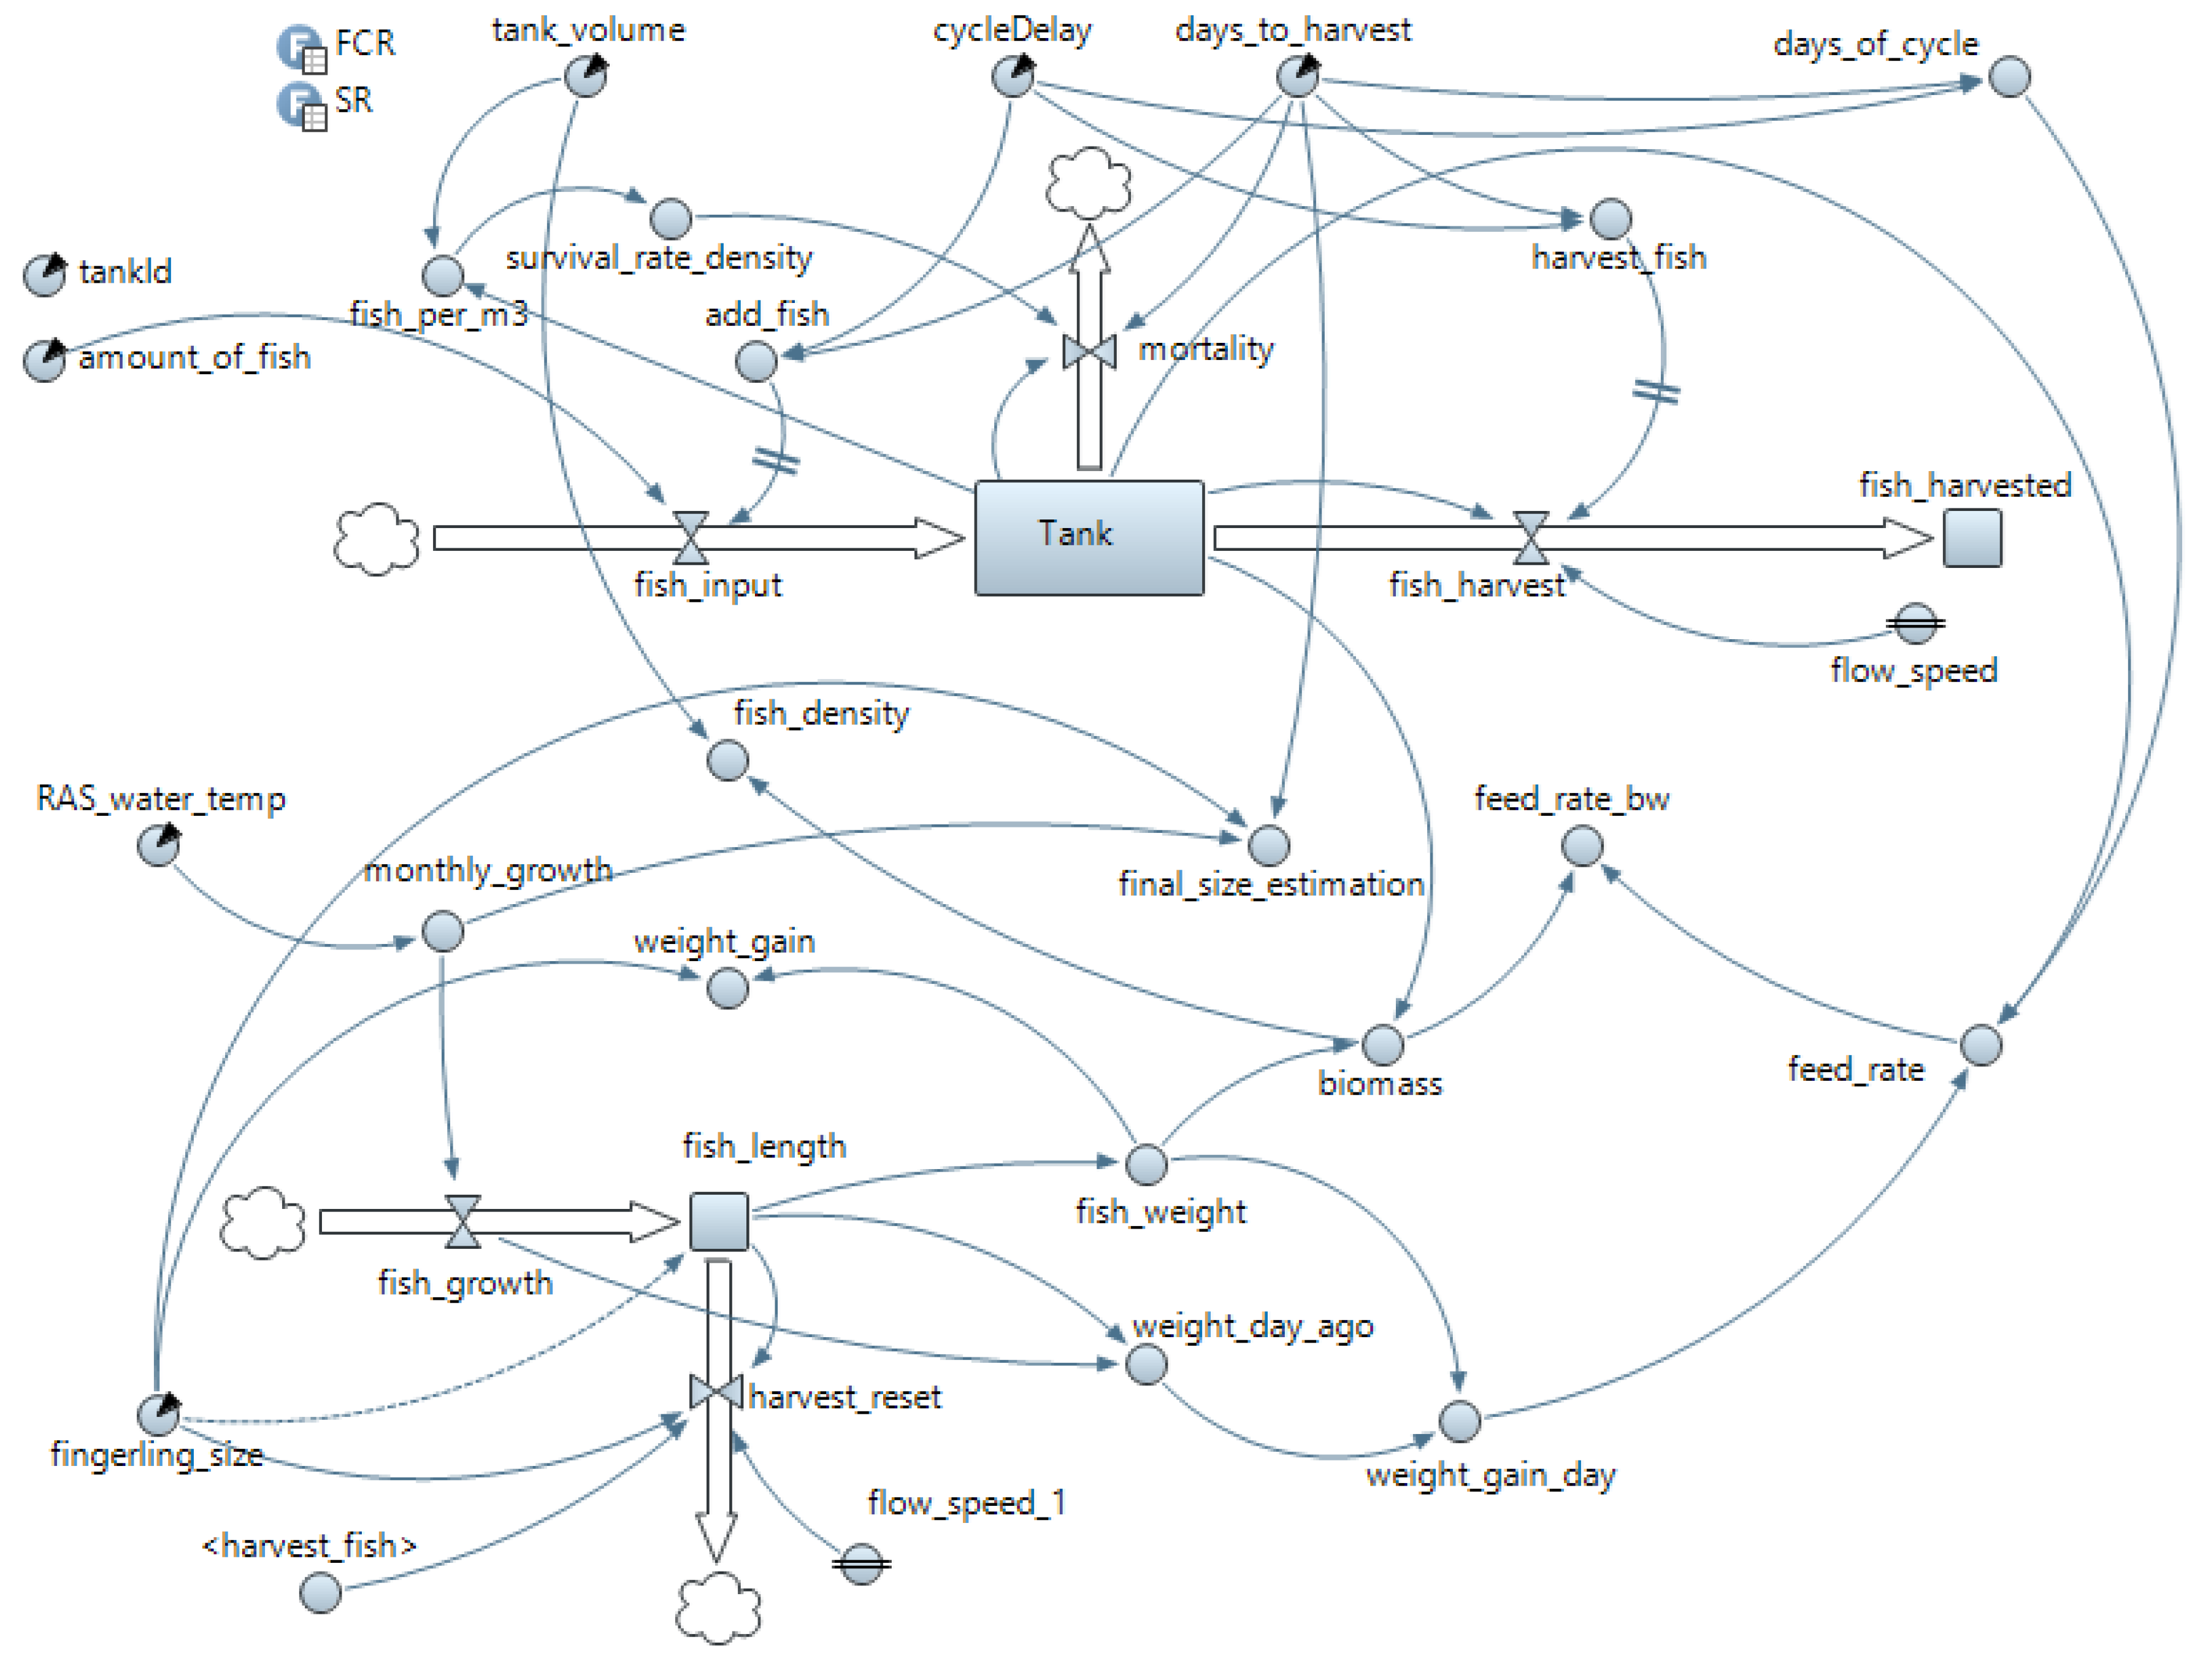
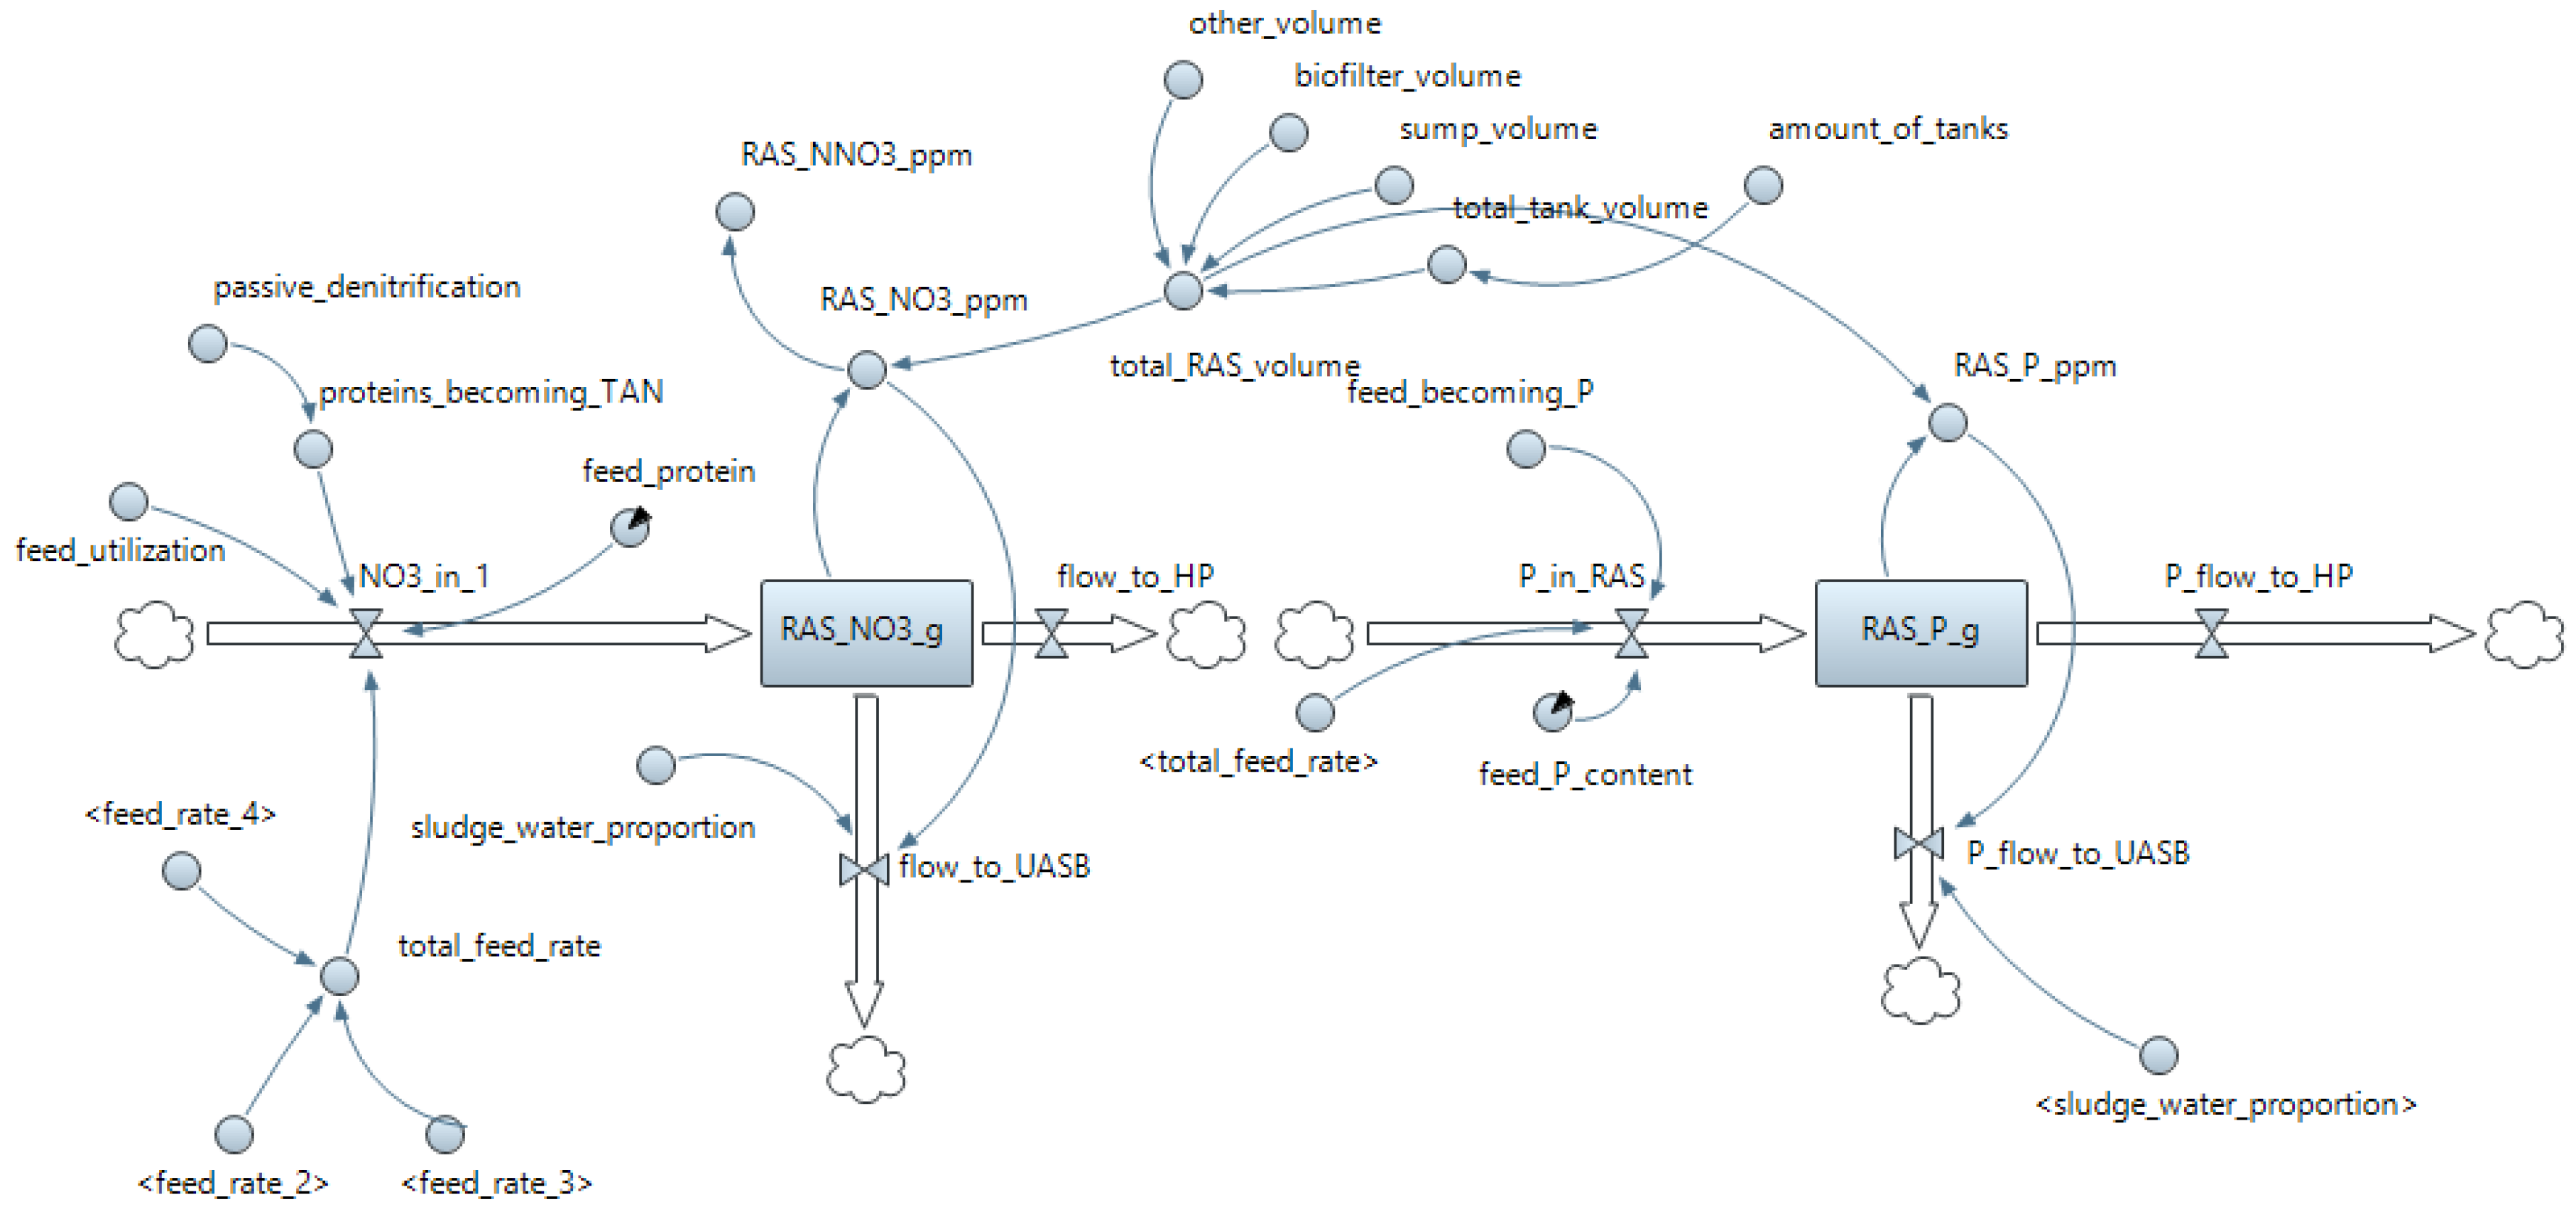
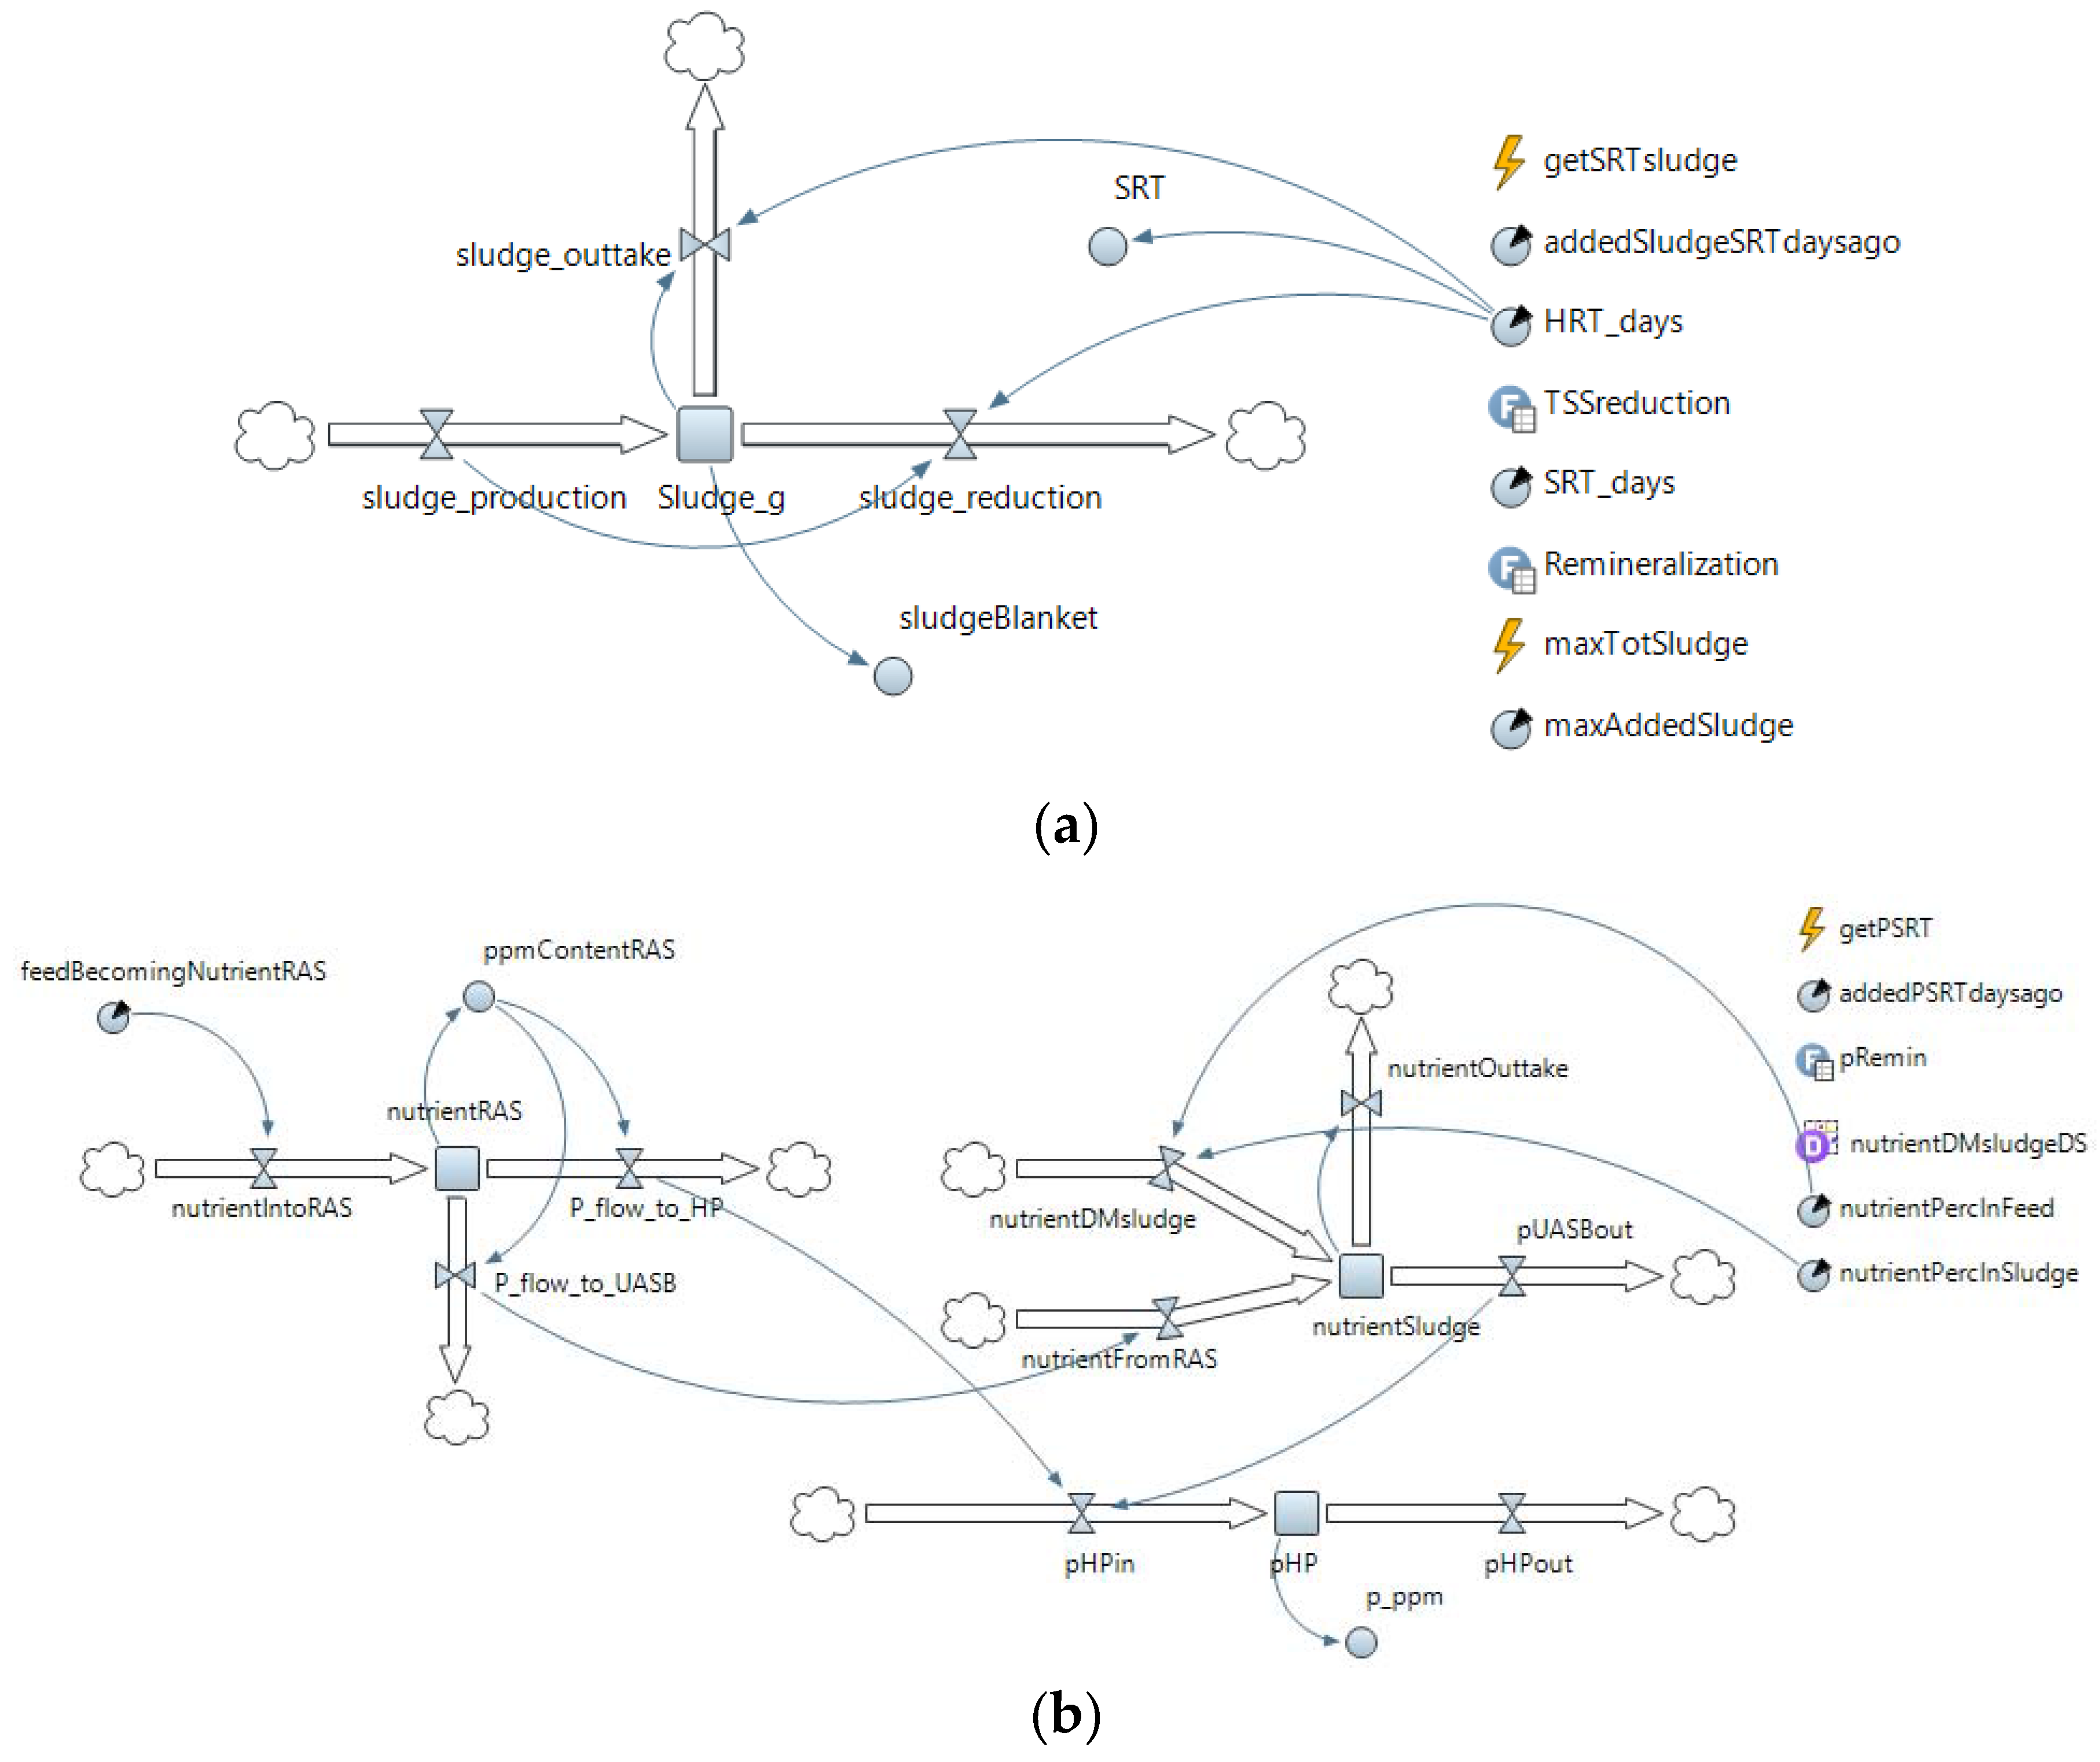
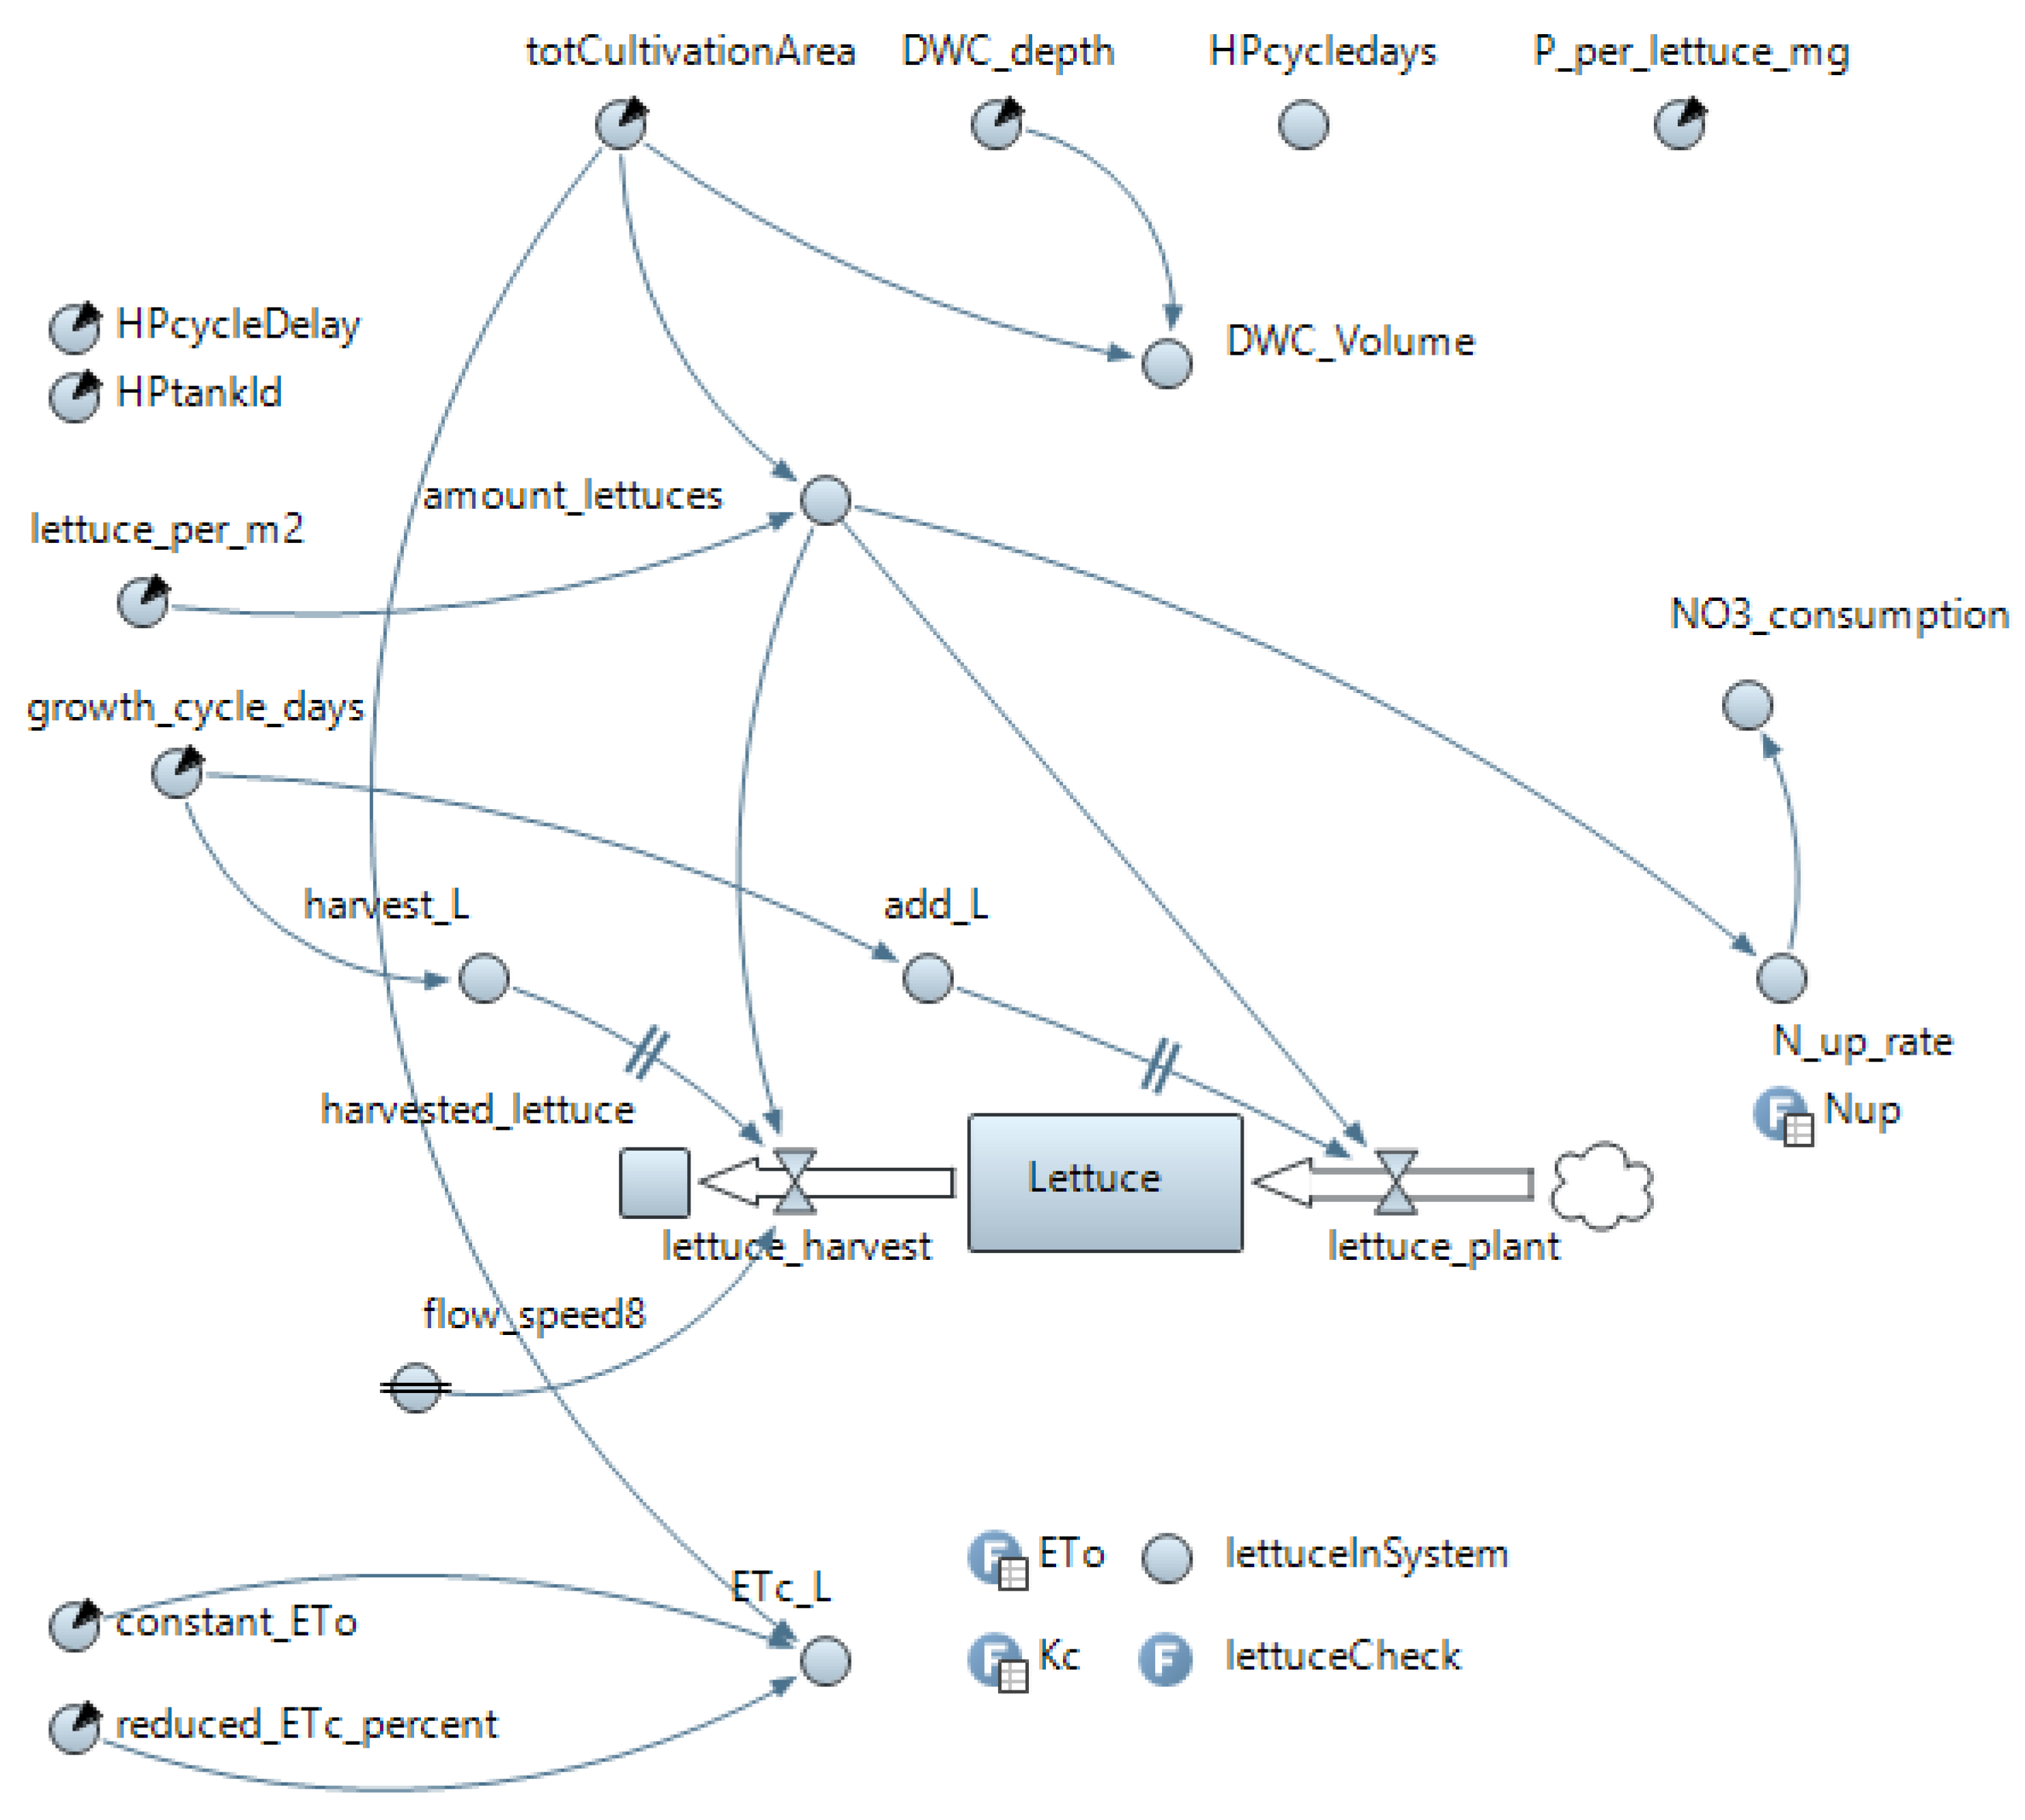
4.2. Model Description—Flowcharts
5. Results
5.1. Fish Biomass Estimates
5.2. Nitrate Flow Estimates
5.3. Hydroponics Sizing Based on P Availability
5.4. UASB Sizing Determination
6. Discussion
7. Conclusions
Acknowledgments
Author Contributions
Conflicts of Interest
Appendix A
Appendix B
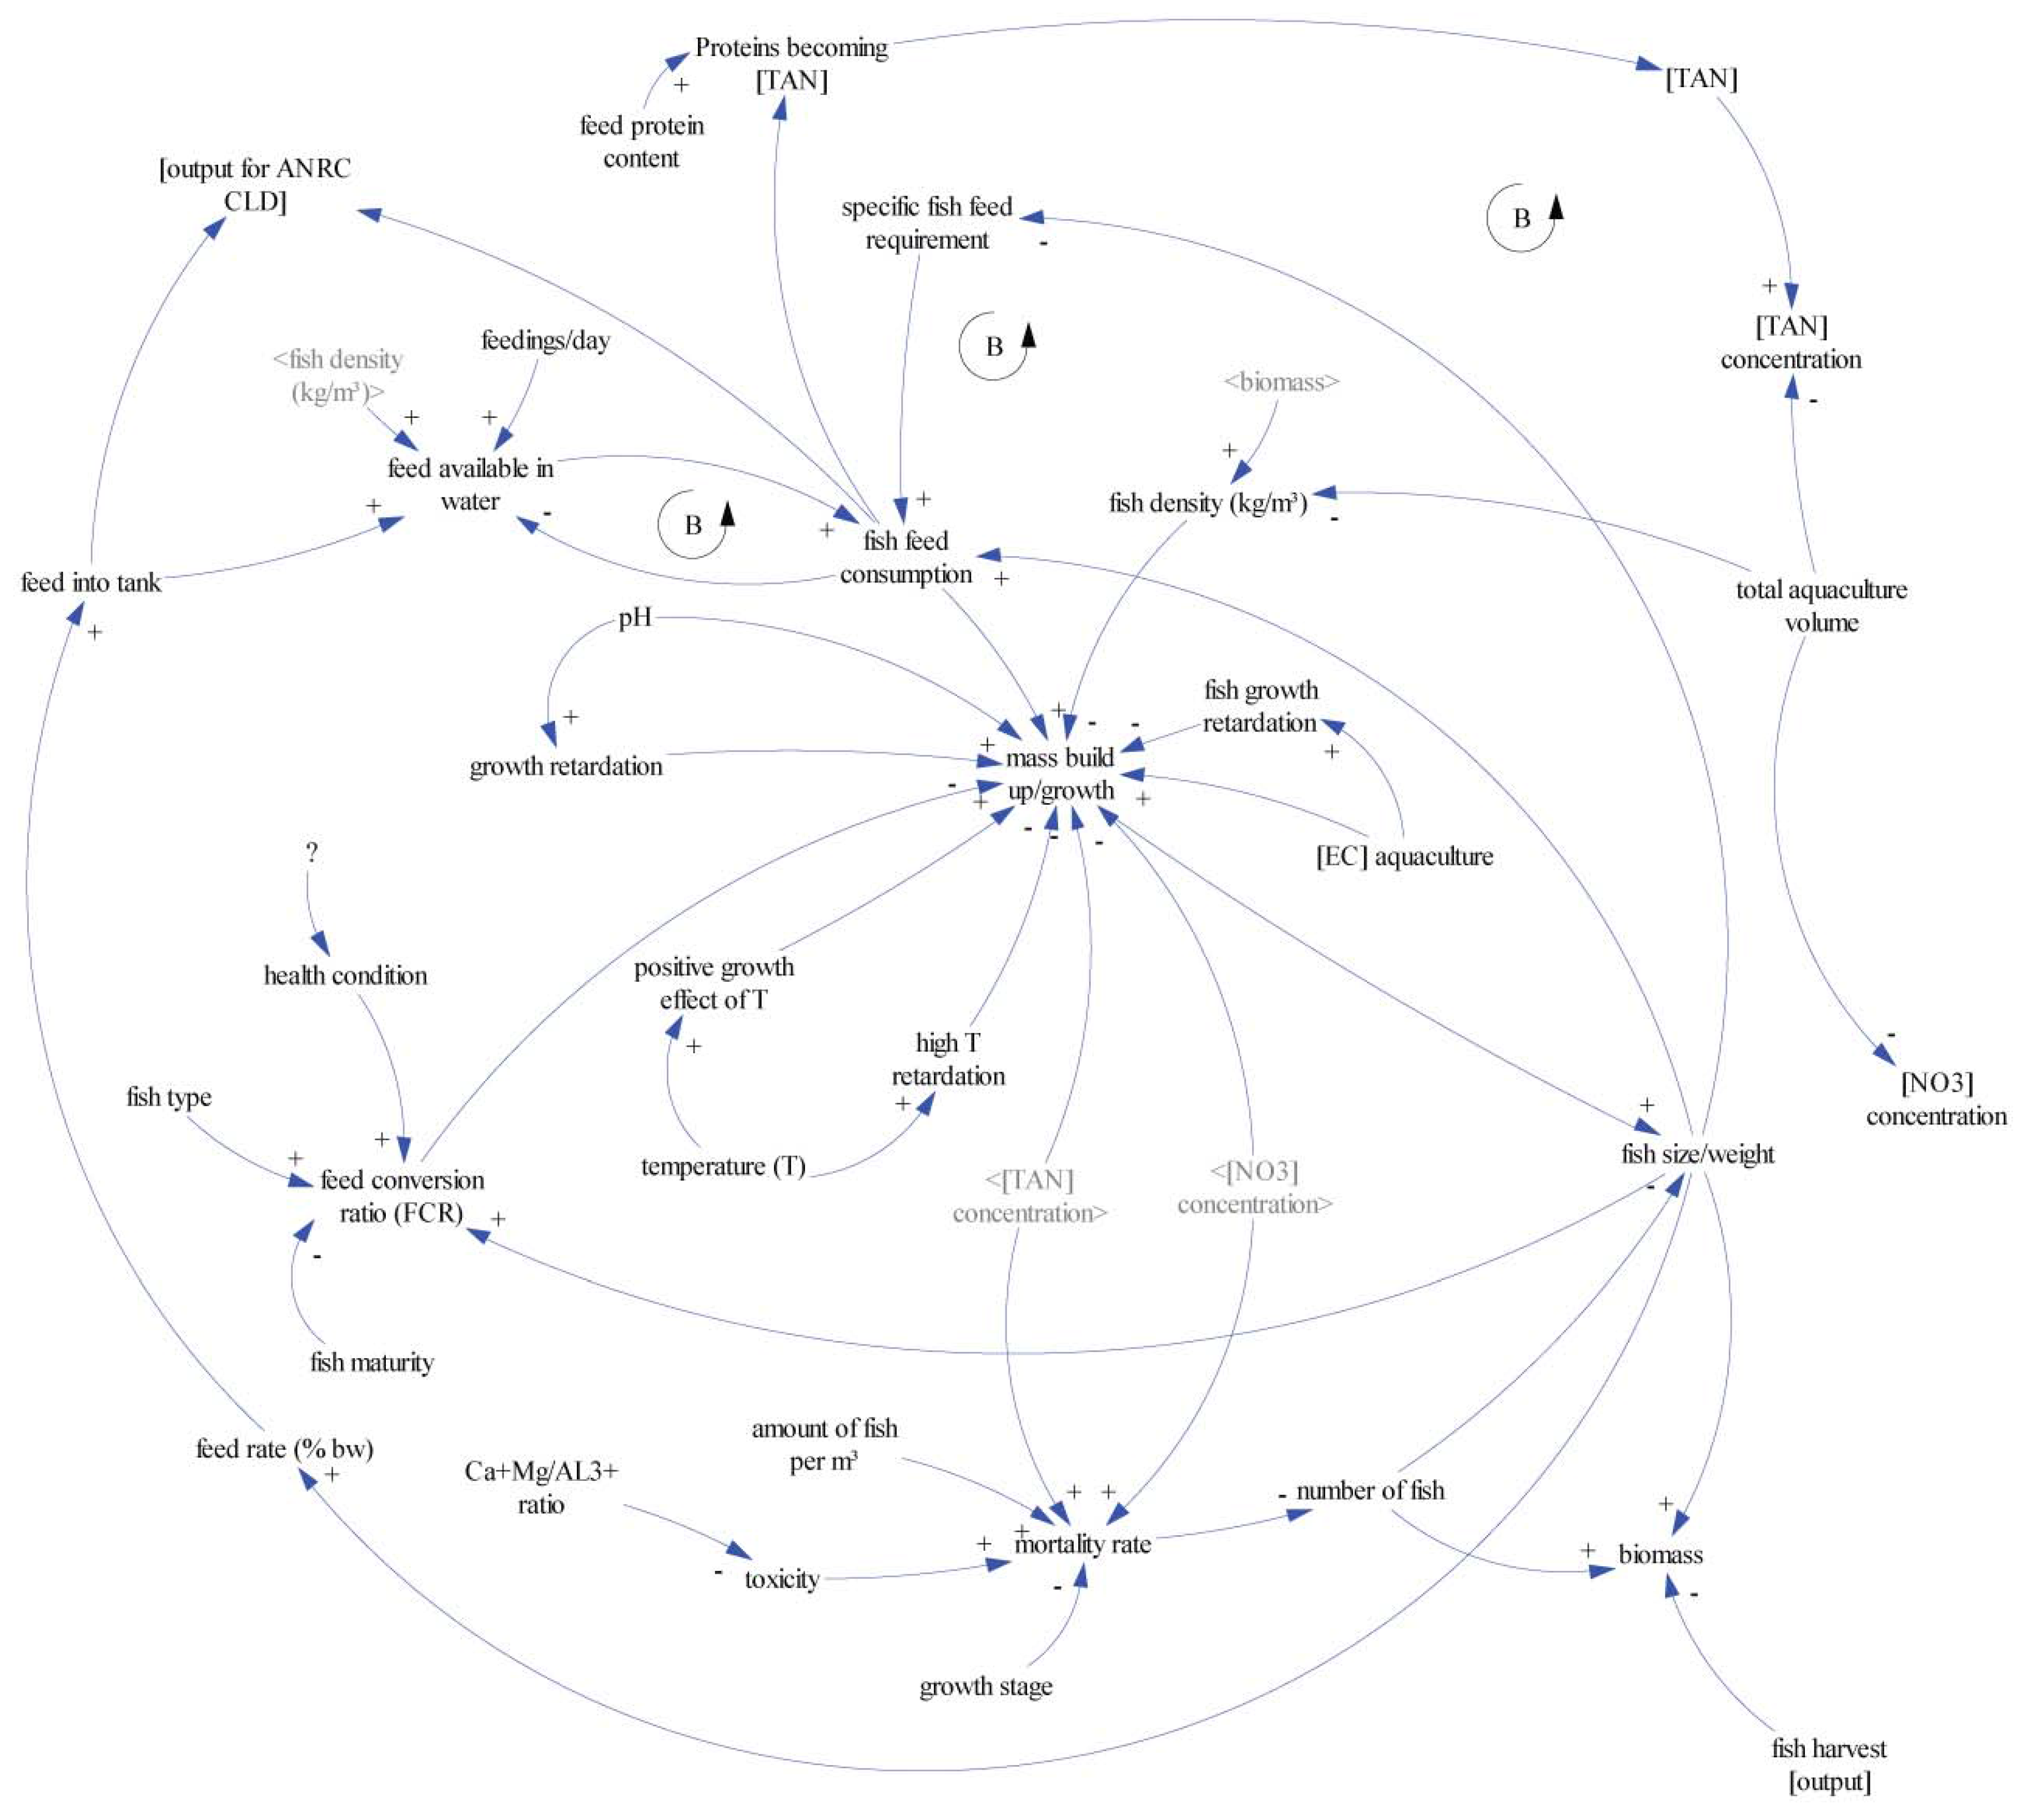
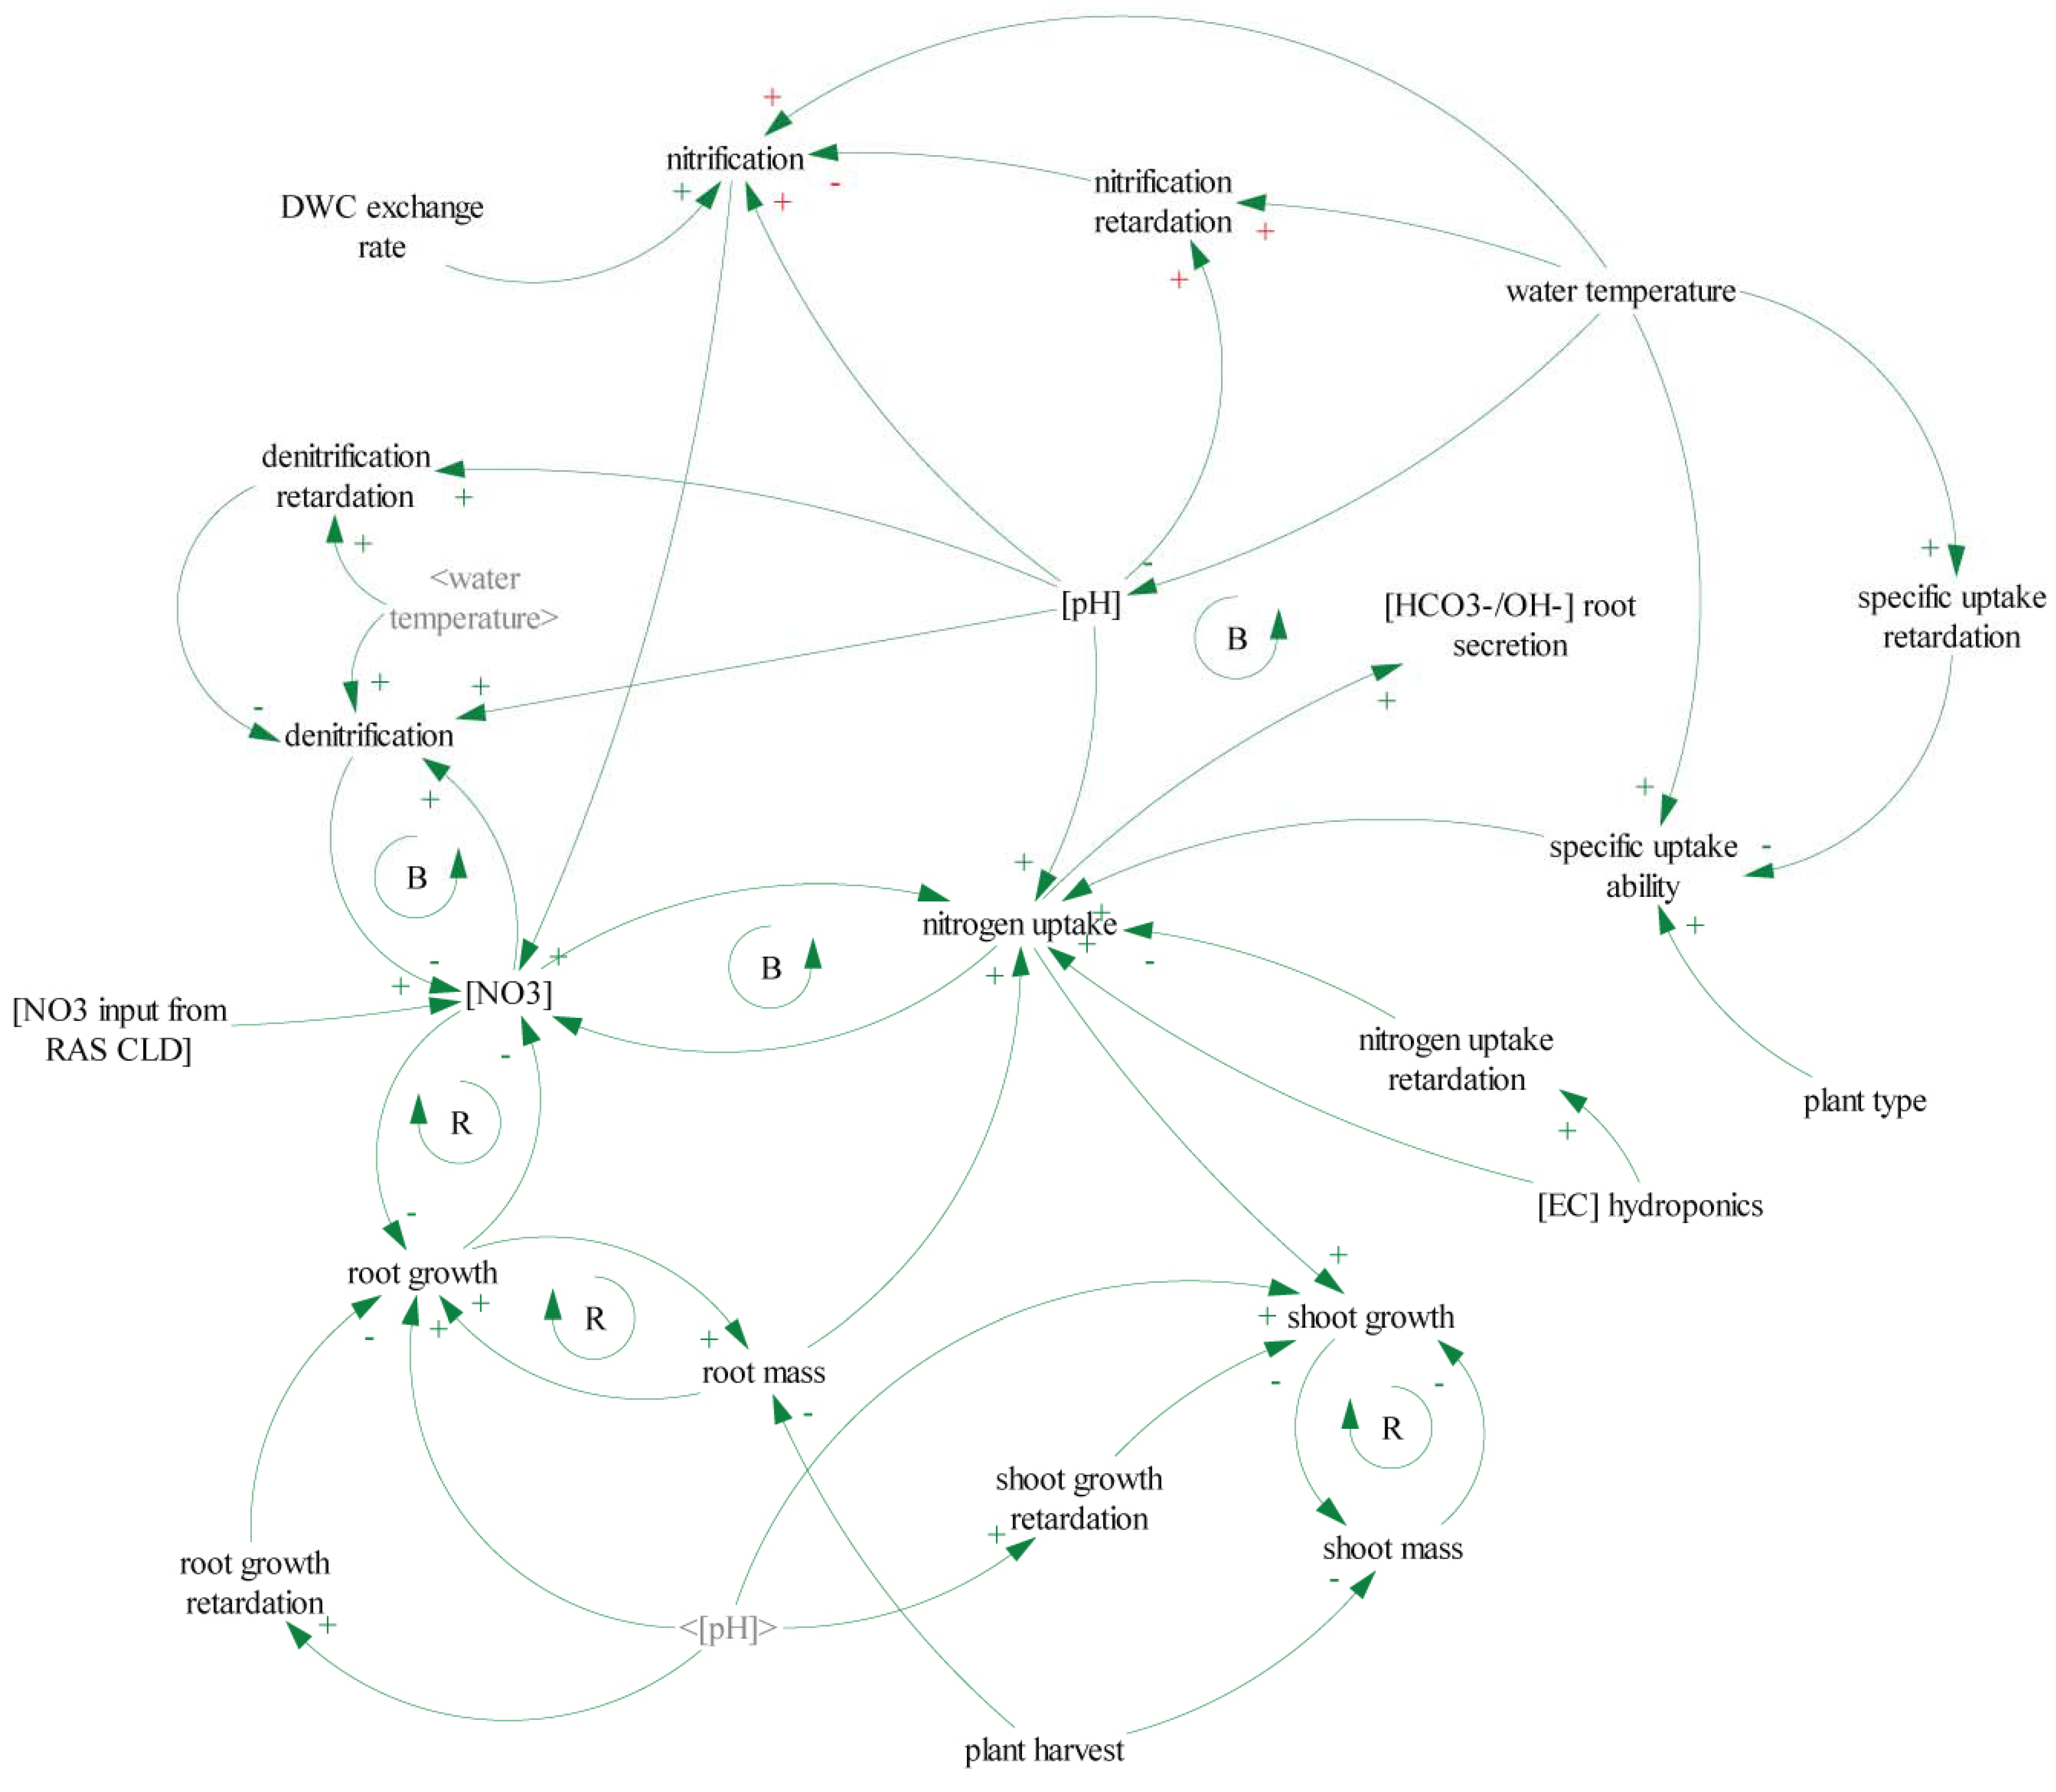

References
- Rakocy, J.E. Aquaponics-Integrating Fish and Plant Culture; Wiley-Blackwell: Hoboken, NJ, USA, 2012; pp. 344–386. [Google Scholar]
- Graber, A.; Junge, R. Aquaponic systems: Nutrient recycling from fish wastewater by vegetable production. Desalination 2009, 246, 147–156. [Google Scholar] [CrossRef]
- Vermeulen, T.; Kamstra, A. The need for systems design for robust aquaponic systems in the urban environment. Int. Symp. Soil. Cultiv. 2013, 1004, 71–78. [Google Scholar] [CrossRef]
- Goddek, S.; Delaide, B.; Mankasingh, U.; Ragnarsdottir, K.; Jijakli, H.; Thorarinsdottir, R. Challenges of Sustainable and commercial aquaponics. Sustainability 2015, 7, 4199–4224. [Google Scholar] [CrossRef]
- Kloas, W.; Groß, R.; Baganz, D.; Graupner, J.; Monsees, H.; Schmidt, U.; Staaks, G.; Suhl, J.; Tschirner, M.; Wittstock, B.; et al. A new concept for aquaponic systems to improve sustainability, increase productivity, and reduce environmental impacts. Aquac. Environ. Interact. 2015, 7, 179–192. [Google Scholar] [CrossRef]
- Jijakli, M.H.; Delaide, B.; Gott, J. Plant Production Capacity and Nutrient Mass Balance in the PAFF Box, an Urban Aquaponics Module: Preliminary Findings; Geography and Environment University of Southampton: Southampton, UK, 2016. [Google Scholar]
- Goddek, S. Three-loop Aquaponics Systems: Chances and challenges. In Proceedings of the International Conference on Aquaponics Research Matters, Ljubljana, Slovenia, 22 March 2016.
- Seawright, D.E.; Stickney, R.R.; Walker, R.B. Nutrient dynamics in integrated aquaculture-hydroponics systems. Aquaculture 1998, 160, 215–237. [Google Scholar] [CrossRef]
- Licamele, J.D. Biomass Production and Nutrient Dynamics in an Aquaponics System. Ph.D. Thesis, University of Arizona, Tucson, AZ, USA, 2009. [Google Scholar]
- Neto, R.M.; Ostrensky, A. Nutrient load estimation in the waste of Nile tilapia Oreochromis niloticus (L.) reared in cages in tropical climate conditions. Aquac. Res. 2013, 46, 1309–1322. [Google Scholar] [CrossRef]
- Adler, P.R.; Summerfelt, S.T.; Glenn, D.M.; Takeda, F. Evaluation of the effect of a conveyor production strategy on lettuce and basil productivity and phosphorus removal from aquaculture wastewater. In Proceedings of the Second International Conference on Recycling the Resource Ecological Engineering for Wastewater Treatment, Waedenswil-Zurich, Switzerland, 18–22 September 1995; Staudenmann, J., Schönborn, A., Etnier, C., Eds.; Trans Tech Publications: Waedenswil-Zurich, Switzerland, 1996; pp. 131–136. [Google Scholar]
- Roosta, H.R.; Hamidpour, M. Effects of foliar application of some macro- and micro-nutrients on tomato plants in aquaponic and hydroponic systems. Sci. Hortic. (Amst.) 2011, 129, 396–402. [Google Scholar] [CrossRef]
- Savidov, N.A.; Hutchings, E.; Rakocy, J.E. Fish and plant production in a recirculating aquaponic system: A new approach to sustainable agriculture in Canada. Acta Hortic. 2007, 742, 209–222. [Google Scholar] [CrossRef]
- Rakocy, J.E.; Bailey, D.S.; Shultz, K.A.; Cole, W.M. Evaluation of a commercial-scale aquaponic unit for the production of tilapia and lettuce. In Proceedings of the 4th International Symposium on Tilapia in Aquaculture, Orlando, FL, USA, 9–12 November 1997; pp. 357–372.
- Mirzoyan, N.; Tal, Y.; Gross, A. Anaerobic digestion of sludge from intensive recirculating aquaculture systems: Review. Aquaculture 2010, 306, 1–6. [Google Scholar] [CrossRef]
- Mirzoyan, N.; McDonald, R.C.; Gross, A. anaerobic treatment of brackishwater aquaculture sludge: An alternative to waste stabilization ponds. J. World Aquac. Soc. 2012, 43, 238–248. [Google Scholar] [CrossRef]
- Mirzoyan, N.; Gross, A. Use of UASB reactors for brackish aquaculture sludge digestion under different conditions. Water Res. 2013, 47, 2843–2850. [Google Scholar] [CrossRef] [PubMed]
- Sterman, J. Business Dynamics: Systems Thinking and Modeling for a Complex World; McGraw Hill: New York, NY, USA, 2000. [Google Scholar]
- Sverdrup, H.U.; Ragnarsdottir, K.V. Challenging the planetary boundaries II: Assessing the sustainable global population and phosphate supply, using a systems dynamics assessment model. Appl. Geochem. 2011, 26, S307–S310. [Google Scholar] [CrossRef]
- Borshchev, A. The Big Book of Simulation Modeling; AnyLogic North America: Chicago, IL, USA, 2013. [Google Scholar]
- Schrader, K.K.; Davidson, J.W.; Summerfelt, S.T. Evaluation of the impact of nitrate-nitrogen levels in recirculating aquaculture systems on concentrations of the off-flavor compounds geosmin and 2-methylisoborneol in water and rainbow trout (Oncorhynchus mykiss). Aquac. Eng. 2013, 57, 126–130. [Google Scholar] [CrossRef]
- Davidson, J.; Good, C.; Welsh, C.; Summerfelt, S.T. Abnormal swimming behavior and increased deformities in rainbow trout Oncorhynchus mykiss cultured in low exchange water recirculating aquaculture systems. Aquac. Eng. 2011, 45, 109–117. [Google Scholar] [CrossRef]
- Davidson, J.; Good, C.; Welsh, C.; Summerfelt, S.T. Comparing the effects of high vs. low nitrate on the health, performance, and welfare of juvenile rainbow trout Oncorhynchus mykiss within water recirculating aquaculture systems. Aquac. Eng. 2014, 59, 30–40. [Google Scholar] [CrossRef]
- Bonachela, S.; González, A.M.; Fernández, M.D. Irrigation scheduling of plastic greenhouse vegetable crops based on historical weather data. Irrig. Sci. 2006, 25, 53–62. [Google Scholar] [CrossRef]
- FAO. FAO Irrigation and Drainage Paper: Crop Evapotranspiration; Allen, R.G., Pereira, L.S., Raes, D., Smith, M., Eds.; FAO: Rome, Italy, 1998. [Google Scholar]
- Zolnier, S.; Lyra, G.B.; Gates, R.S. Evapotranspiration estimates for greenhouse lettuce using an intermittent nutrient film technique. Am. Soc. Agric. Biol. Eng. 2004, 47, 271–282. [Google Scholar] [CrossRef]
- Boulard, T. Evapotranspiration in greenhouses. Encycl. Water Sci. 2003. [Google Scholar] [CrossRef]
- Jolliet, O.; Bailey, B. The effect of climate on tomato transpiration in greenhouses: Measurements and models comparison. Agric. For. Meteorol. 1992, 58, 43–62. [Google Scholar] [CrossRef]
- Fernández, M.D.; Bonachela, S.; Orgaz, F.; Thompson, R.; López, J.C.; Granados, M.R.; Gallardo, M.; Fereres, E. Measurement and estimation of plastic greenhouse reference evapotranspiration in a Mediterranean climate. Irrig. Sci. 2010, 28, 497–509. [Google Scholar] [CrossRef]
- Möller, M.; Assouline, S. Effects of a shading screen on microclimate and crop water requirements. Irrig. Sci. 2006, 25, 171–181. [Google Scholar] [CrossRef]
- Deutscher Wetterdienst WESTE-XL. Available online: https://kunden.dwd.de/weste (accessed on 13 September 2015).
- Timmons, M.B.; Ebeling, J.M. Recirculating Aquaculture, 3rd ed.; Ithaca Publishing Company LLC: Ithaca, NY, USA, 2013. [Google Scholar]
- Rakocy, J.E.; Masser, M.P.; Losordo, T.M. Recirculating Aquaculture Tank Production Systems: Aquaponics—Integrating Fish and Plant Culture; Southern Regional Aquaculture Centre: Stoneville, MS, USA, 2006; pp. 1–16. [Google Scholar]
- Gullian-Klanian, M.; Arámburu-Adame, C. Rendimiento de juveniles de tilapia del Nilo Oreochromis niloticus en un sistema híperintensivo de recirculación acuícola con mínimo recambio de agua. Lat. Am. J. Aquat. Res. 2013, 41, 150–162. [Google Scholar]
- El-Shafai, S.A.; El-Gohary, F.A.; Nasr, F.A.; van der Steen, N.P.; Gijzen, H.J. Chronic ammonia toxicity to duckweed-fed tilapia (Oreochromis niloticus). Aquaculture 2004, 232, 117–127. [Google Scholar] [CrossRef]
- Al-Hafedh, Y.S.; Alam, A.; Alam, M.A. Performance of plastic biofilter media with different configuration in a water recirculation system for the culture of Nile tilapia (Oreochromis niloticus). Aquac. Eng. 2003, 29, 139–154. [Google Scholar] [CrossRef]
- Dalsgaard, J.; Lund, I.; Thorarinsdottir, R.; Drengstig, A.; Arvonen, K.; Pedersen, P.B. Farming different species in RAS in Nordic countries: Current status and future perspectives. Aquac. Eng. 2013, 53, 2–13. [Google Scholar] [CrossRef]
- DeLong, D.P.; Losordo, T.M.; Rakocy, J.E. Tank Culture of Tilapia; Southern Regional Aquaculture Centre: Stoneville, MS, USA, 2009; No. 282. [Google Scholar]
- Eding, E.H.; Verdegem, M.; Martins, C.; Schlaman, G.; Heinsbroek, L.; Laarhoven, B.; Ende, S.; Verreth, J.; Aartsen, F.; Bierbooms, V. Tilapia farming using Recirculating Aquaculture Systems (RAS)—Case study in the Netherlands. In Handbook for Sustainable Aquaculture; Eurofish International Organisation: Copenhagen, Denmark, 2009. [Google Scholar]
- Veras, G.C.; Murgas, L.D.S.; Rosa, P.V.; Zangeronimo, M.G.; da Ferreira, M.S.S.; Leon, J.A.S.-D. Effect of photoperiod on locomotor activity, growth, feed efficiency and gonadal development of Nile tilapia. Rev. Bras. Zootec. 2013, 42, 844–849. [Google Scholar] [CrossRef]
- Resh, H.M. Hydroponic Food Production: A Definitive Guidebook for the Advanced Home Gardener and the Commercial Hydroponic Grower; CRC Press: Boca Raton, FL, USA, 2012. [Google Scholar]
- Appels, L.; Baeyens, J.; Degrève, J.; Dewil, R. Principles and potential of the anaerobic digestion of waste-activated sludge. Prog. Energy Combust. Sci. 2008, 34, 755–781. [Google Scholar] [CrossRef]
- Zhao, L.; Guo, J.; Lian, J.; Guo, Y.; Yue, L.; Gou, C.; Zhang, C.; Liu, X. Study of the dynamics and material transformation characteristics of nitrite denitrification in UASB. Biotechnol. Biotechnol. Equip. 2015, 29, 907–914. [Google Scholar] [CrossRef]
- Cuervolopez, F.; Martinez, F.; Gutierrezrojas, M.; Noyola, R.; Gomez, J. Effect of nitrogen loading rate and carbon source on denitrification and sludge settleability in upflow anaerobic sludge blanket (UASB) reactors. Water Sci. Technol. 1999, 40, 123–130. [Google Scholar] [CrossRef]
- Lettinga, G.; Pol, L.W.H. UASB-process design for various types of wastewaters. Water Sci. Technol. 1991, 24, 87–107. [Google Scholar]
- Ross, L.G. Environmental physiology and energetics. In Tilapias: Biology and Exploitation; McAndrew, B.J., Ed.; Springer Netherlands: Dordrecht, The Netherlands, 2000; pp. 89–128. [Google Scholar]
- Alfredo, M.H.; Hector, S.L. Blood gasometric trends in hybrid red tilapia Oreochromis niloticus (Linnaeus) × O. mossambicus (Peters) while adapting to increasing salinity. J. Aquac. Trop. 2002, 17, 101–112. [Google Scholar]
- El-Sayed, A.-F.M. Tilapia Culture; CABI Publishing: Oxfordshire, UK, 2006. [Google Scholar]
- FAO. Cultured Aquatic Species Information Programme. Oncorhynchus Mykiss. Available online: http://www.fao.org/fishery/culturedspecies/Oncorhynchus_mykiss/en (accessed on 21 August 2015).
- Finstad, B.; Staurnes, M.; Reite, O.B. Effect of low temperature on sea-water tolerance in rainbow trout, Salmo gairdneri. Aquaculture 1988, 72, 319–328. [Google Scholar] [CrossRef]
- Coghlan, S.M.; Ringler, N.H. Temperature-dependent effects of rainbow trout on growth of atlantic salmon parr. J. Great Lakes Res. 2005, 31, 386–396. [Google Scholar] [CrossRef]
- Azevedo, P.A.; Podemski, C.L.; Hesslein, R.H.; Kasian, S.E.M.; Findlay, D.L.; Bureau, D.P. Estimation of waste outputs by a rainbow trout cage farm using a nutritional approach and monitoring of lake water quality. Aquaculture 2011, 311, 175–186. [Google Scholar] [CrossRef]
- Westin, D.T. Nitrate and nitrite toxicity to salmonid fishes. Progress Fish-Cult. 1974, 36, 86–89. [Google Scholar] [CrossRef]
- Barton, B.A. Principles of Salmonid Culture; Developments in Aquaculture and Fisheries Science; Elsevier: Amsterdam, The Netherlands, 1996; Volume 29. [Google Scholar]
- Wedemeyer, G. Physiology of Fish in Intensive Culture Systems; Springer: Berlin, Germany, 1996. [Google Scholar]
- FAO. Cultured Aquatic Species Information Programme. Clarias Gariepinus. Available online: http://www.fao.org/fishery/culturedspecies/Clarias_gariepinus/en (accessed on 21 August 2015).
- Wellborn, T.L. Channel Catfish: Life History and Biology; Southern Regional Aquaculture Centre: Stoneville, MS, USA, 1988. [Google Scholar]
- Tucker, C.S.; Hargreaves, J.A. Biology and Culture of Channel Catfish; Elsevier Science Ltd.: Amsterdam, The Netherlands, 2004. [Google Scholar]
- Horváth, L.; Tamás, G.; Seagrave, C. Carp and Pond Fish Culture, 2nd ed.; Blackwell Science Ltd.: Oxford, UK, 2002. [Google Scholar]
- FAO. Cultured Aquatic Species Information Programme. Sander Lucioperca. Available online: http://www.fao.org/fishery/culturedspecies/Sander_lucioperca/en (accessed on 21 August 2015).
- Keen, G.A.; Prosser, J.I. Interrelationship between pH and surface growth of Nitrobacter. Soil Biol. Biochem. 1987, 19, 665–672. [Google Scholar] [CrossRef]
- Tyson, R.V.; Simonne, E.H.; Davis, M.; Lamb, E.M.; White, J.M.; Treadwell, D.D. Effect of nutrient solution, nitrate-nitrogen concentration, and pH on nitrification rate in Perlite medium. J. Plant Nutr. 2007, 30, 901–913. [Google Scholar] [CrossRef]
- Parker, R. Aquaculture Science, 2nd ed.; Delmar Publications: Clifton Park, NY, USA, 2002. [Google Scholar]
- Huang, Z.; Gedalanga, P.B.; Asvapathanagul, P.; Olson, B.H. Influence of physicochemical and operational parameters on Nitrobacter and Nitrospira communities in an aerobic activated sludge bioreactor. Water Res. 2010, 44, 4351–4358. [Google Scholar] [CrossRef] [PubMed]
- Blackburne, R.; Vadivelu, V.M.; Yuan, Z.; Keller, J. Kinetic characterisation of an enriched Nitrospira culture with comparison to Nitrobacter. Water Res. 2007, 41, 3033–3042. [Google Scholar] [CrossRef] [PubMed]
- Sonneveld, C.; Voogt, W. Plant Nutrition of Greenhouse Crops; Springer Netherlands: Dordrecht, The Netherlands, 2009. [Google Scholar]
- Resh, H.M. Hydroponic Tomatoes; Taylor and Francis: Abingdon, UK, 2002. [Google Scholar]
- Kafkafi, U.; Tarchitzky, J. Fertigation: A Tool for Efficient Water and Nutrient Management; IFA and IPI: Paris, France, 2011. [Google Scholar]
- Chen, Y.; He, J.; Mu, Y.; Huo, Y.-C.; Zhang, Z.; Kotsopoulos, T.A.; Zeng, R.J. Mathematical modeling of upflow anaerobic sludge blanket (UASB) reactors: Simultaneous accounting for hydrodynamics and bio-dynamics. Chem. Eng. Sci. 2015, 137, 677–684. [Google Scholar] [CrossRef]
- Lu, X.; Zhen, G.; Estrada, A.L.; Chen, M.; Ni, J.; Hojo, T.; Kubota, K.; Li, Y.-Y. Operation performance and granule characterization of upflow anaerobic sludge blanket (UASB) reactor treating wastewater with starch as the sole carbon source. Bioresour. Technol. 2015, 180, 264–273. [Google Scholar] [CrossRef] [PubMed]
- Alvarez, R.; Lidén, G. The effect of temperature variation on biomethanation at high altitude. Bioresour. Technol. 2008, 99, 7278–7284. [Google Scholar] [CrossRef] [PubMed]
- Rakocy, J.E.; Shultz, R.C.; Bailey, D.S.; Thoman, E.S. Aquaponic Production of Tilapia and Basil: Comparing a Batch and Staggered Cropping System; Nichols, M.A., Ed.; University of the Virgin Islands: St. Croix, VI, USA, 2004; Volume 648, pp. 63–69. [Google Scholar]
- Davidson, J.; Summerfelt, S.T. Solids removal from a coldwater recirculating system—Comparison of a swirl separator and a radial-flow settler. Aquac. Eng. 2005, 33, 47–61. [Google Scholar] [CrossRef]
- Rafiee, G.; Saad, C.R. Nutrient cycle and sludge production during different stages of red tilapia (Oreochromis sp.) growth in a recirculating aquaculture system. Aquaculture 2005, 244, 109–118. [Google Scholar] [CrossRef]
- Suhr, K.I.; Letelier-Gordo, C.O.; Lund, I. Anaerobic digestion of solid waste in RAS: Effect of reactor type on the biochemical acidogenic potential (BAP) and assessment of the biochemical methane potential (BMP) by a batch assay. Aquac. Eng. 2015, 65, 65–71. [Google Scholar] [CrossRef]
- Lambers, H.; Chapin, F.S.; Pons, T.L. Plant Physiological Ecology, 2nd ed.; Springer: Berlin, Germany, 2008. [Google Scholar]
- Steingrobe, B.; Schenk, M.K. A model relating the maximum nitrate inflow of lettuce (Lactuca satvia L.) to the growth of roots and shoots. Plant Soil 1994, 162, 249–257. [Google Scholar] [CrossRef]
- Letey, J.; Jarrell, W.M.; Valoras, N. Nitrogen and water uptake patterns and growth of plants at various minimum solution nitrate concentrations. J. Plant Nutr. 1982, 5, 73–89. [Google Scholar] [CrossRef]
- Mathieu, J.; Linker, R.; Levine, L.; Albright, L.; Both, A.J.; Spanswick, R.; Wheeler, R.; Wheeler, E.; de Villiers, D.; Langhans, R. Evaluation of the nicolet model for simulation of short-term hydroponic lettuce growth and nitrate uptake. Biosyst. Eng. 2006, 95, 323–337. [Google Scholar] [CrossRef]
- Klas, S.; Mozes, N.; Lahav, O. Development of a single-sludge denitrification method for nitrate removal from RAS effluents: Lab-scale results vs. model prediction. Aquaculture 2006, 259, 342–353. [Google Scholar] [CrossRef]
- González-González, A.; Cuadros, F. Effect of aerobic pretreatment on anaerobic digestion of olive mill wastewater (OMWW): An ecoefficient treatment. Food Bioprod. Process. 2015, 95, 339–345. [Google Scholar] [CrossRef]
- Van Rijn, J. Waste treatment in recirculating aquaculture systems. Aquac. Eng. 2013, 53, 49–56. [Google Scholar] [CrossRef]
- Dawson, C.J.; Hilton, J. Fertiliser availability in a resource-limited world: Production and recycling of nitrogen and phosphorus. Food Policy 2011, 36, S14–S22. [Google Scholar] [CrossRef]
- Rogers, P. Facing the freshwater crisis. Sci. Am. 2008, 299, 46–53. [Google Scholar] [CrossRef] [PubMed]
- Ragnarsdottir, K.V.; Sverdrup, H.U.; Koca, D. Challenging the planetary boundaries I: Basic principles of an integrated model for phosphorous supply dynamics and global population size. Appl. Geochem. 2011, 26, S303–S306. [Google Scholar] [CrossRef]
- Zekki, H.; Gauthier, L.; Gosselin, A. Growth, productivity, and mineral composition of hydroponically cultivated greenhouse tomatoes, with or without nutrient solution recycling. J. Am. Soc. Hortic. Sci. 1996, 121, 1082–1088. [Google Scholar]
- Van Bussel, C.G.J.; Schroeder, J.P.; Wuertz, S.; Schulz, C. The chronic effect of nitrate on production performance and health status of juvenile turbot (Psetta maxima). Aquaculture 2012, 326–329, 163–167. [Google Scholar] [CrossRef]
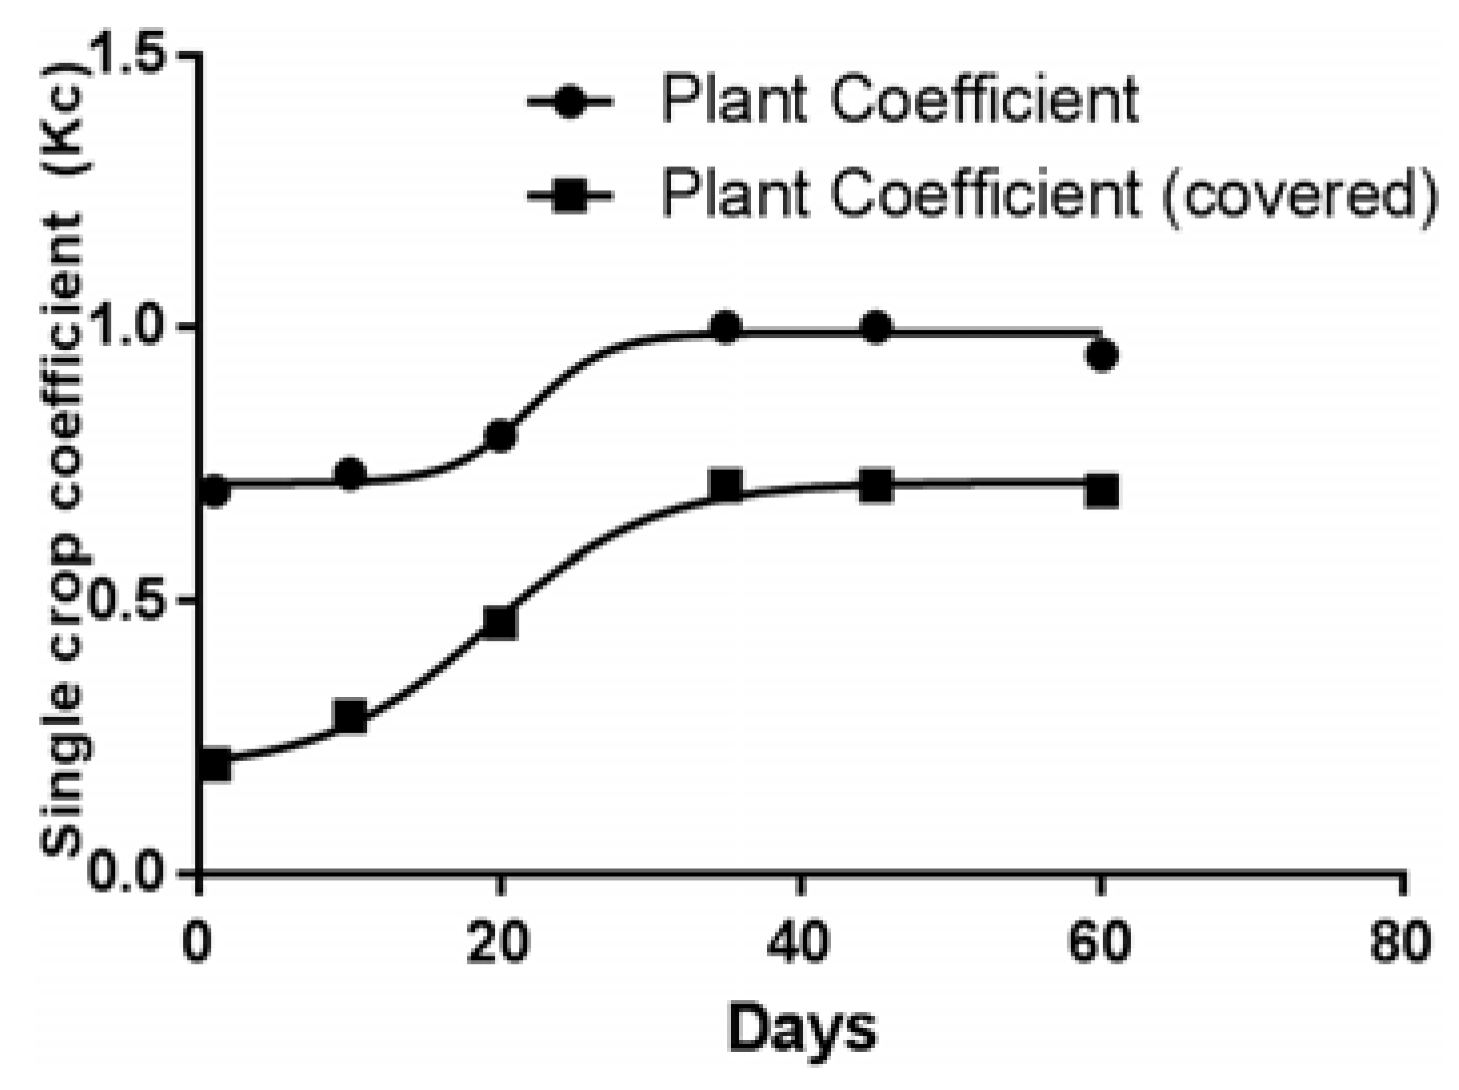
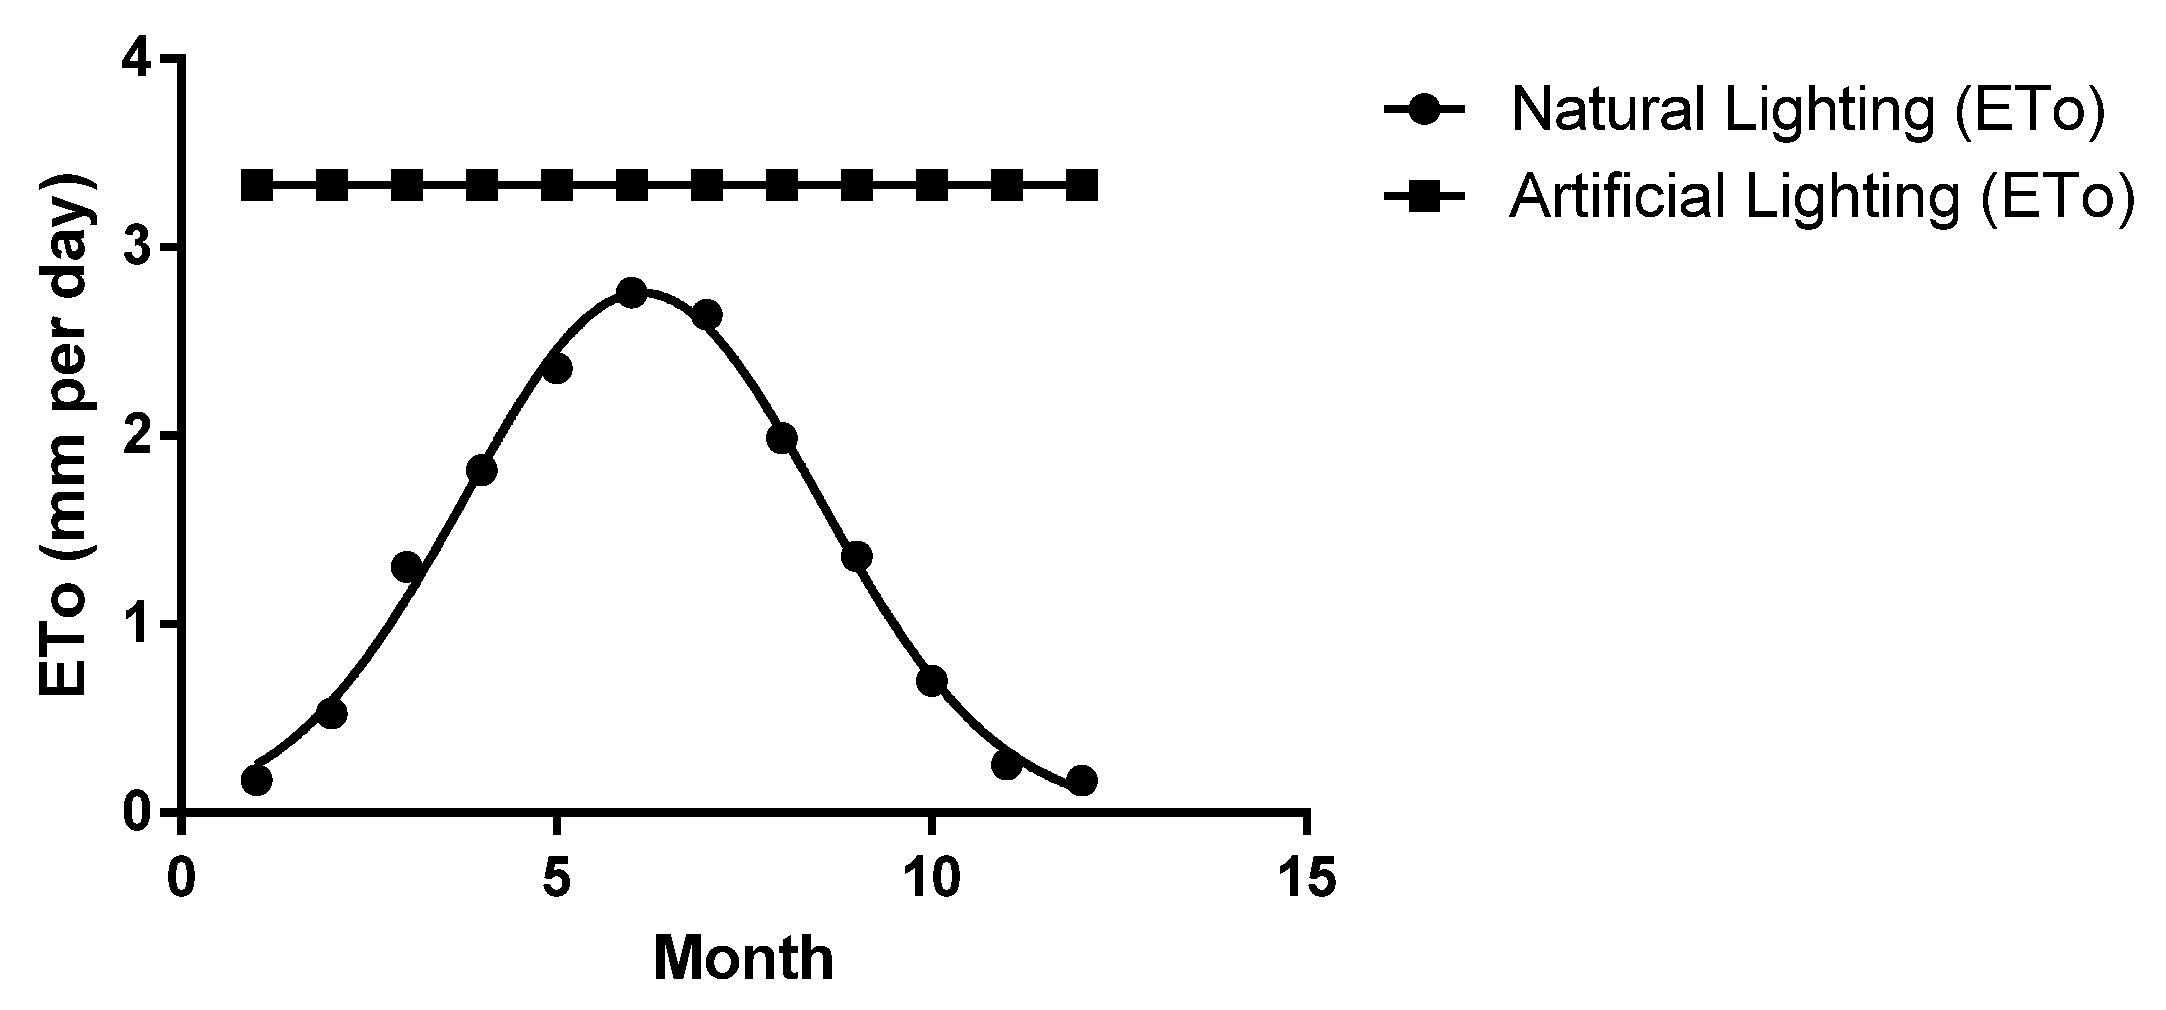

| Parameters | January | February | March | April | May | June | July | August | September | October | November | December |
|---|---|---|---|---|---|---|---|---|---|---|---|---|
| Sun | 73.4 | 75.8 | 187.5 | 143.9 | 168.8 | 212.1 | 209.8 | 150.7 | 135.4 | 99.6 | 68.1 | 18.0 |
| ETo | 0.18 | 0.53 | 1.30 | 1.82 | 2.36 | 2.76 | 2.64 | 1.99 | 1.36 | 0.70 | 0.26 | 0.17 |
| Parameter | Threshold for Optimal Growth | References |
|---|---|---|
| TAN (mg/L) | <2.9 | [35] |
| NO2−-N (mg/L) | <0.5–1 | [36] |
| NO3−-N (mg/L) | <100–200 | [37] |
| T (°C) | 27–29 | [38] |
| O2 (mg/L) | 4–6 | [39] |
| pH | 6–9 | [38] |
| Photoperiod | 18L:6D | [40] |
| Sub-System | Species/Type | pH | EC (mS·cm−1) or Salinity | Optimal Temp (°C) | Ammonia (mg·L−1) | Dissolved Oxygen (ml·L−1) | Hardness (CaCO3 in mg·L−1) |
|---|---|---|---|---|---|---|---|
| RAS | Oreochromis niloticus (Nile tilapia) | 7–9 [46] | salinity: <15‰ [47] | 29.5 [32]; 27–30 [48] | <0.1 N-NH4 [48] | Optimal: 5.0 [38] | |
| Oncorhynchus mykiss (Rainbow trout) | 6.5–8.5 [49] | salinity: <26‰ [50] | 15 [51,52] | <0.0125 N-NH3 [53] | ~100% [49] | >200 [54,55]; 10–400 [49] | |
| Clarias gariepinus (Catfish) | 7 [56] | salinity: 0‰–4‰ [57]; <4‰–6‰; optimum 0.5‰ [58] | 25–30 [58]; 28 [56] | <2.5 N-NH3 [56] | Optimal: 5–6 [59] | >20–30 [58] | |
| Sander lucioperca, syn. Stizostedion lucioperca (Pike-Perch) | 6.5–8.2 [60] | 27–28 [60] | <0.40 TAN [60] | >50% [60] | |||
| Bio filter | Nitrobacter | 7.5 [61], 7.8 [62] | 20–30 [63]; 24–25 [64] | >1 [65] | |||
| Nitrospira | 8.3 [65] | 29–30 [64]; 30–35 [65] | |||||
| Nitrosomonas | 7.8 [62] | 20–30 [63] | |||||
| Hydroponics | Lactuca sativa (Lettuce) | 5.5–6.5 [41] | 1–2 mS/cm [41] | 21–25 [41] | <10 N-NH4 [66] | ||
| Lycopersicon esculentum (Tomato) | 6.3–6.5 [67] | >2.5 reduces yield [68] | 18–24 [67] | ||||
| Digester | Upflow Anaerobic Sludge Blanket reactor (UASB) | 7.4 [16,69] | 35 [70,71] | ~0 |
| System | pH | EC (mS·cm−1) | N-NO3 | N-NH4 | P-PO4 | K | Ca | Mg | S-SO4 | Fe | Source |
|---|---|---|---|---|---|---|---|---|---|---|---|
| Hydroponics | 5.5–5.8 | 1.5–2.0 | 165 | 25 | 50 | 210 | 200 | 40 | 113 | 5 | [41] |
| Aquaponics | 7.0–7.6 | 0.7–0.8 | 42.2 | 2.2 | 8.2 | 44.9 | 11.9 | 6.5 | 15 | 2.5 (supplemented) | [14,72] |
| Gap to Hydroponics (%) | 74.4 | 91.2 | 83.6 | 89 | 94 | 83.7 | 86.7 | 50.0 |
| Parameters | N (%) | P (%) | N (%) | P (%) |
|---|---|---|---|---|
| Neto and Ostrensky [10] | Personal Observations (RAS) | |||
| Feed | 100 | 100 | 100 | 100 |
| Fish retention | 35 | 28 | 35–50 | 60–70 |
| Water (Soluble Excretion) | 33 | 17 | 20–30 | 5–10 |
| Total Sludge | 31 | 55 | 15–25 | 35–45 |
| Thereof non-consumed feed | 18 | 18 | 5–10 | 5–10 |
| Thereof feces | 13 | 37 | 10–15 | 30–35 |
© 2016 by the authors; licensee MDPI, Basel, Switzerland. This article is an open access article distributed under the terms and conditions of the Creative Commons Attribution (CC-BY) license (http://creativecommons.org/licenses/by/4.0/).
Share and Cite
Goddek, S.; Espinal, C.A.; Delaide, B.; Jijakli, M.H.; Schmautz, Z.; Wuertz, S.; Keesman, K.J. Navigating towards Decoupled Aquaponic Systems: A System Dynamics Design Approach. Water 2016, 8, 303. https://doi.org/10.3390/w8070303
Goddek S, Espinal CA, Delaide B, Jijakli MH, Schmautz Z, Wuertz S, Keesman KJ. Navigating towards Decoupled Aquaponic Systems: A System Dynamics Design Approach. Water. 2016; 8(7):303. https://doi.org/10.3390/w8070303
Chicago/Turabian StyleGoddek, Simon, Carlos Alberto Espinal, Boris Delaide, Mohamed Haissam Jijakli, Zala Schmautz, Sven Wuertz, and Karel J. Keesman. 2016. "Navigating towards Decoupled Aquaponic Systems: A System Dynamics Design Approach" Water 8, no. 7: 303. https://doi.org/10.3390/w8070303
APA StyleGoddek, S., Espinal, C. A., Delaide, B., Jijakli, M. H., Schmautz, Z., Wuertz, S., & Keesman, K. J. (2016). Navigating towards Decoupled Aquaponic Systems: A System Dynamics Design Approach. Water, 8(7), 303. https://doi.org/10.3390/w8070303


