Article

Hydro-Meteorological Drought Projections into the 21-st Century for Selected Polish Catchments

Institute of Geophysics, Polish Academy of Sciences, Warsaw, 01-452, Poland
*
Author to whom correspondence should be addressed.
Water 2016, 8(5), 206; https://doi.org/10.3390/w8050206
Submission received: 27 January 2016 / Revised: 10 May 2016 / Accepted: 11 May 2016 / Published: 17 May 2016

Abstract

:
The nature of drought conditions is estimated using a range of indices describing different aspects of drought events. Three drought indices are evaluated, namely the Standardized Precipitation Index (SPI), Standardized Precipitation Evapotranspiration Index (SPEI) and Standardized Runoff Index (SRI), using observed hydroclimatic data and applying them to hydro-meteorological projections into the 21st century. The first two indices are evaluated using only meteorological variables and from this point of view, are better suited to meteorological drought projections than the third index, SRI, which is based on catchment discharge and represents hydrological drought. We assess information contained in those indices and their suitability to catchment scale climate projection drought assessment in ten selected Polish catchments, representing different hydro-climatic conditions, which are used as a case study. Projections of climatic variables (precipitation and temperature) are obtained from the EURO-CORDEX initiative derived from seven climate models at a grid resolution of 12.5 km for the time period 1971–2100. Future runoff projections for the catchments are obtained using a conceptual rainfall-runoff model (HBV). The results of analyses of indices based on observations in the reference period show consistent estimates for most of the catchments. Hydro-meteorological climate model projections for three periods, including the reference period 1971–2000, and two 30-year periods, near-future 2021–2050 and far-future 2071–2100, are used to estimate changes of future drought conditions in the catchments studied. The results show a substantial variation of temporal drought patterns over the catchments and their dependence on projected precipitation and temperature variables and the type of indices applied. Of the three indices studied, only SPEI projections indicate drier conditions in the catchments in the far-future period. The other two indices, SPI and SRI, indicate wetter climates in the future.

1. Introduction

Climate change is often measured by changes in the main climate variables, such as global surface air temperature and precipitation [1]. Global climate model (GCM) projections of these variables show that the Earth will be warmer in the future [2,3,4]. This implies an increasing rate of evapotranspiration, which could bring a distortion (imbalance) of water content in the atmosphere and surface water [5]. Hence, studies of the impact of global climate change on different sectors (water resource management, agriculture and ecosystems) become an important scientific research area across the world besides their economic and social importance [6,7,8]. This is because changes in precipitation and temperature have a direct impact on drought and flood occurrence [9,10,11] and therefore, may have a serious impact on humans, infrastructure, and environment [12,13].
According to [12] the definition of drought is categorized into four concepts: meteorological, hydrological, agricultural, and socioeconomic. The first three definitions are related to physical phenomena and climate variables [14,15]. The last is based on water supply and demand through socioeconomic systems. The concepts behind the first three categories are similar; a drought is defined as an extended period of abnormally dry weather, sufficiently prolonged for the lack of water to cause a serious hydrologic imbalance (i.e., precipitation deficit, soil moisture deficit, water level decline, water supply shortage, etc.) in the affected area [16] and is caused mainly by a lack of precipitation and rise air temperature (high evapotranspiration), and depletion of soil moisture level over a long time period [17,18].
In the future both precipitation and evapotranspiration are expected to change with global warming at different scales across the globe. Many researchers in Poland have studied historical drought characteristics [19,20,21], the relationship between the state of the atmosphere and the occurrence of meteorological drought [22,23] and drought changes in the future using different climate model projections [24]. A review of these and many other similar studies indicates that the relative precipitation index (RPI), the effective drought index (EDI), the standardized precipitation index (SPI) and the climatic water balance (CWB) methods have been employed for the identification of historical drought and the estimation of future drought conditions in Poland. The SPI method has been the favoured choice of most studies due to its simplicity. According to [24,25], an increase in temperature and changes in rainfall are expected in future in Poland, which might have a strong impact on different sectors (water resource, agriculture, health). However, the idea that increased evaporative demand in a warmer world might enhance drought has been missed in Polish research. This issue is relevant not only to Polish research but also globally. Little has been done to quantify and explicitly separate the relative contribution of changes in precipitation and evaporative demand to the magnitude and extent of global warming-induced drought [14]. Therefore, using the standardized precipitation Index (SPI), standardized precipitation evapotranspiration index (SPEI) and standardized runoff index (SRI) can lead to understanding the effects separately, i.e., the SPI might help us to understand the implications of precipitation for meteorological drought conditions in the selected catchments, the SPEI also considers the evapotranspiration, whereas the SRI considers the catchment dynamics [26,27].
The use of drought indices which include precipitation, air temperature, evapotranspiration and flow data in their formulation (such as the SPI, SPEI and indirectly, SRI) might be preferable for applications involving future climate scenarios [27]. These types of indices are essential for assessing drought in relation to different hydrological systems, and differentiating among different drought conditions. The SPI, SPEI, and SRI indices are used for detecting, monitoring and exploring the consequences of climate change on drought conditions [26,28,29].
The aims of this paper are: (i) to compare SPI, SPEI and SRI indices in order to evaluate their ability to describe historical drought, including the transformation of meteorological drought into hydrological drought and the spatial characteristics of both, (ii) to investigate how drought is expected to change in the 21th century, using the SPI, SPEI and SRI drought indices and the newest source of climate projections (EURO-CORDEX initiative) for ten catchments in Poland. These aims are novel in respect of the use of data from EURO-CORDEX in Poland and the development and comparison of SPI, SPEI and SRI projections into the 21st century in Polish catchments.
A description of the study area and the hydro-climatic characteristics of the selected catchments and input data are included in Section 2. Section 3 presents the applied drought indices SPI, SPEI, and SRI. The results of drought projections using seven RCM/GCM climate models are presented in Section 4. Finally, we summarize the results and conclude our research findings in Section 5.

2. Study Area and Data Input

2.1. Study Area

Poland is located in Central Europe, occupying a transitory temperate climate zone, influenced by a mild oceanic climate from the west and a dry continental climate from the east. The country is divided into different climatic zones, with wetter southern and northern parts and a drier middle part. The mean annual precipitation over Poland in the period 1961–2009 was 623.7 mm [30] but the central part of the Western Carpathian Mountains reached precipitations higher than 1000 mm. Precipitation higher than average is observed in both southern and northern Poland. The lowest values are observed in central Poland. Prevailing atmospheric circulation patterns may also influence the water balance in a catchment. The mean annual air temperature over Poland in the period 1951–2008 was 7.9 °C, with lower air temperatures (7.6 °C) in the eastern part and higher (8.2 °C) in the western part of Poland. Differences in air temperature due to elevation are also visible [30].
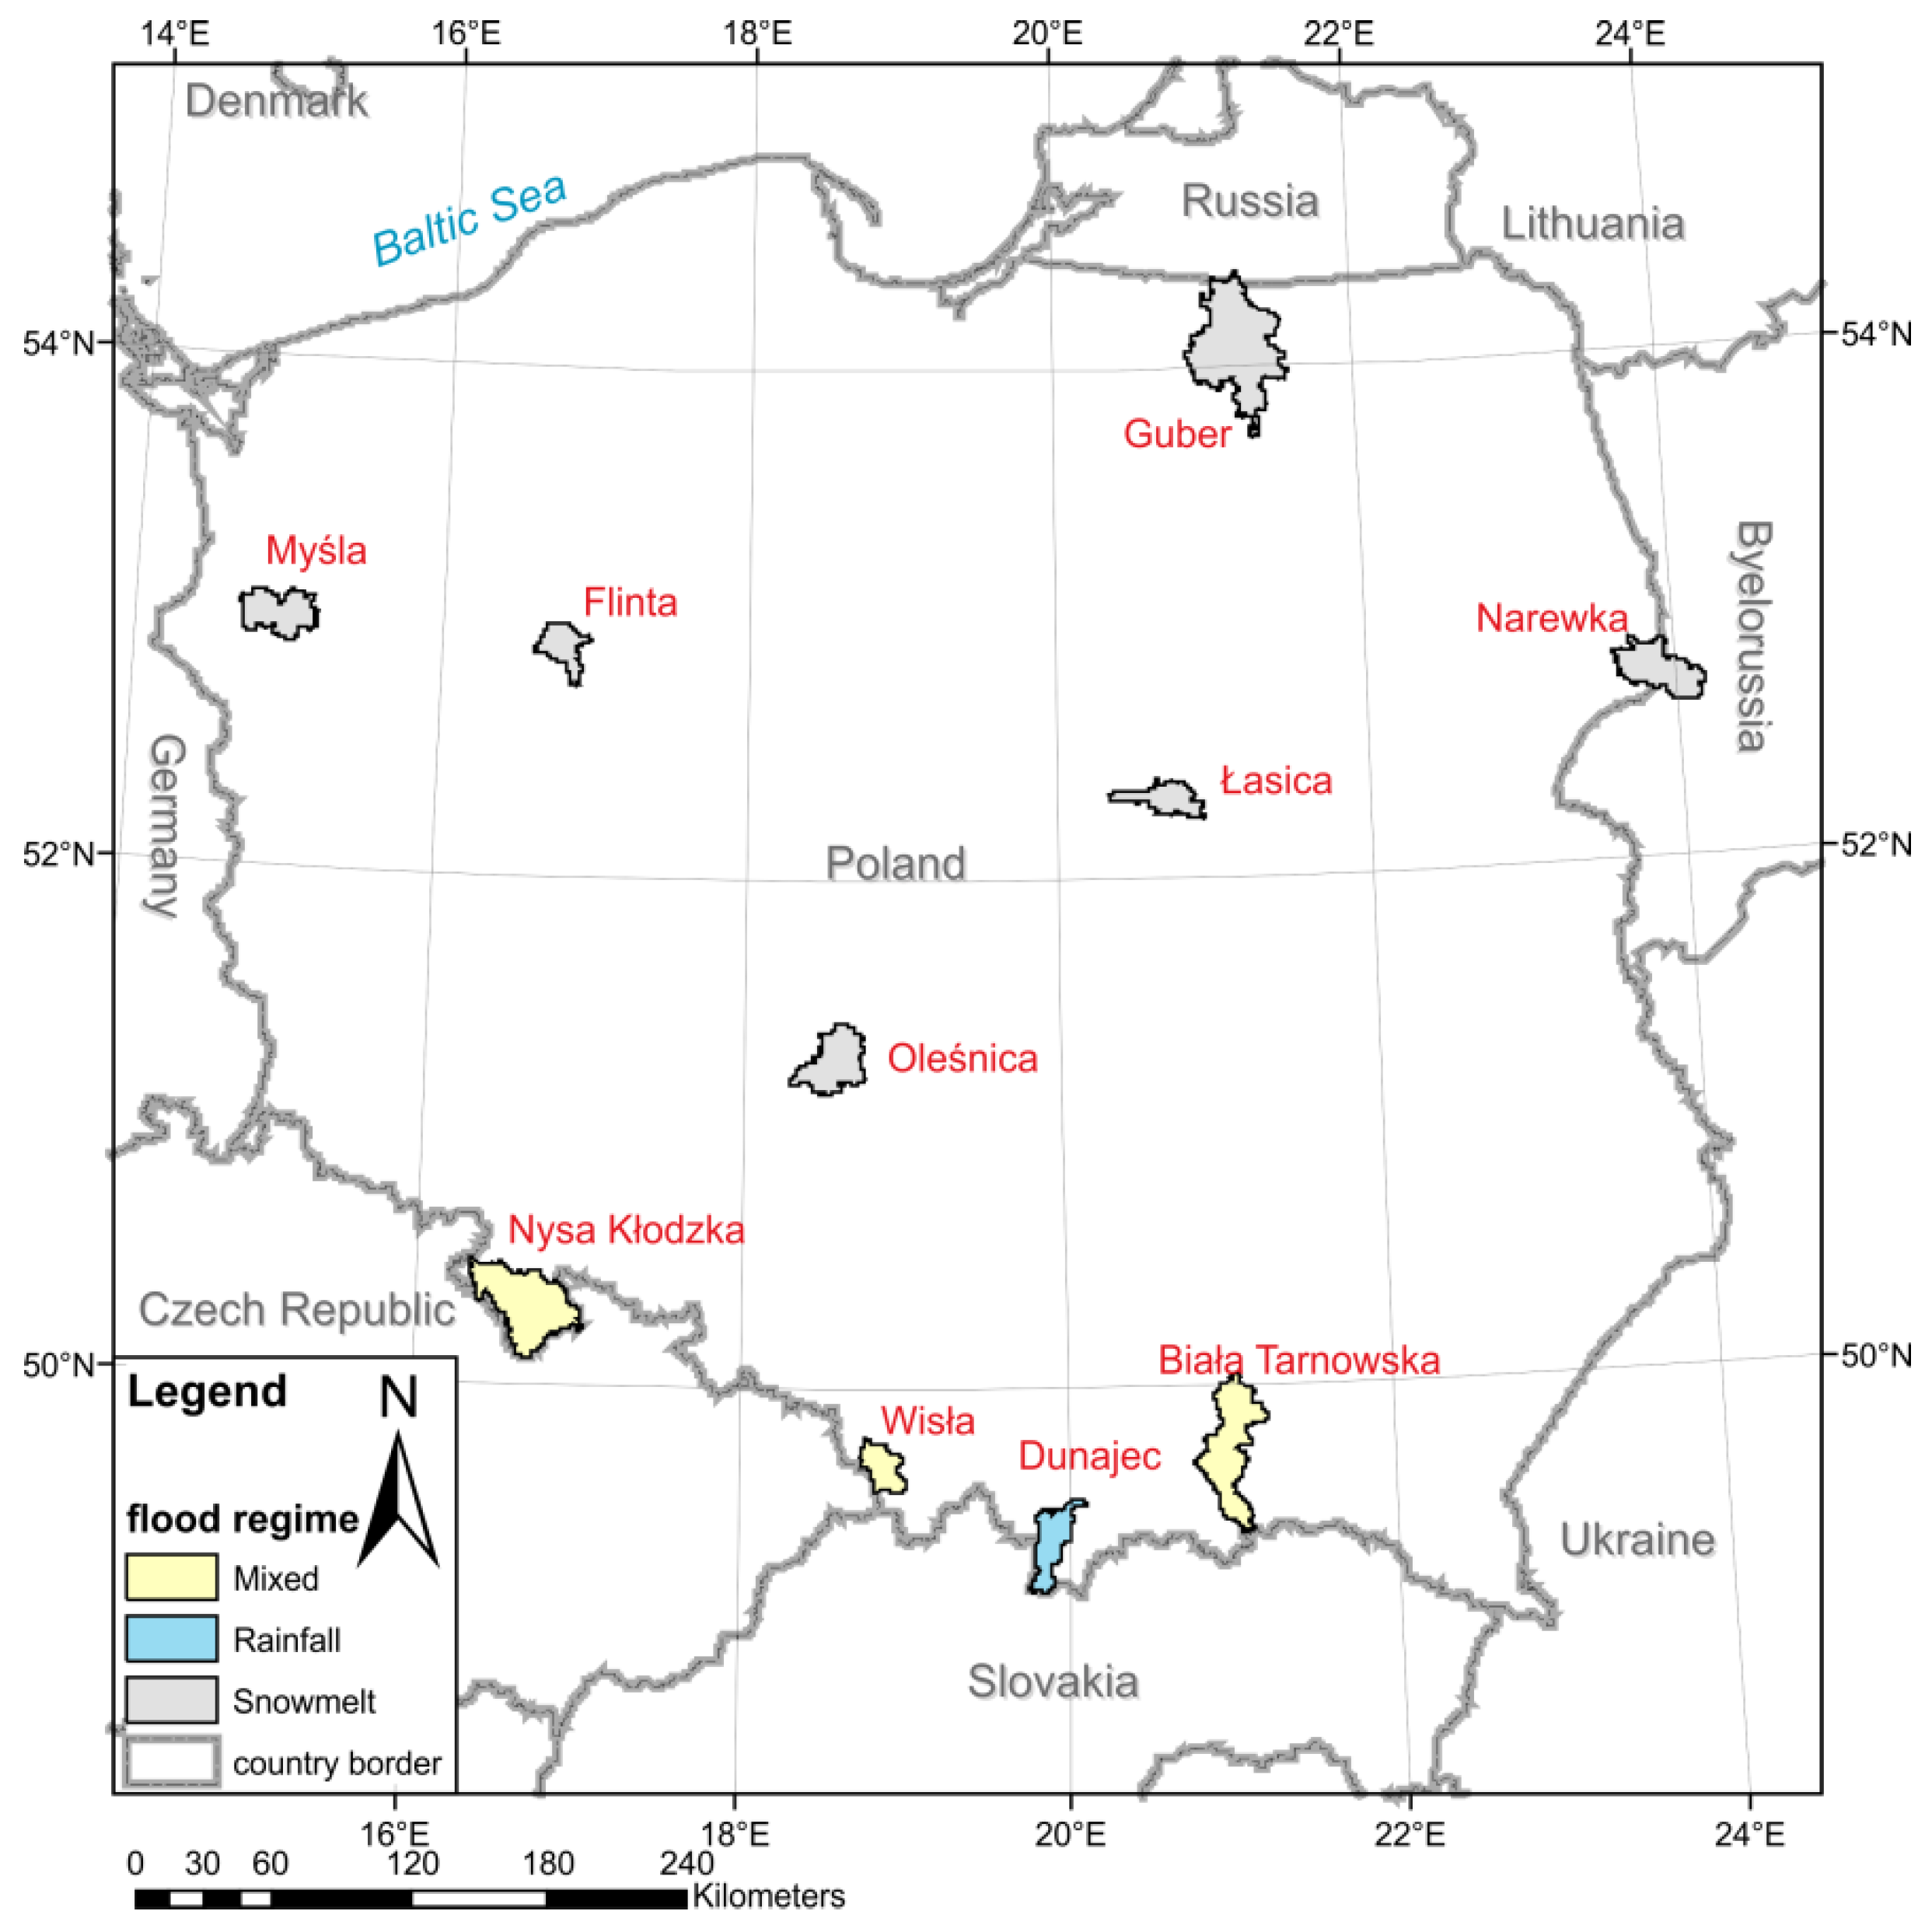
The study area includes ten catchments (Figure 1). The catchments were chosen to ensure that they have nearly-natural conditions. Catchment characteristics, including the name of the catchment, gauging station name, flood regime, catchment area and mean elevation, as well as land cover are listed in Table 1. Four catchments: Nysa Kłodzka, Wisła, Dunajec and Biała Tarnowska are located in the south. These catchments are characterized by relatively high elevations. The other catchments (Myśla, Flinta, Guber, Łasica and Narewka) are located in the lowland area. The catchment area ranges from 297 km2 to 1555 km2. The selected catchments are characterized by semi natural conditions without significant changes in land use and water management work. According to Corine land cover data [31], the catchments are covered mostly by forest except the Wisła and BiałaTarnowska catchments where agriculture is the dominant land use. In the Narewka and Flinta catchments, the percentage of forest-covered area is higher than in the other catchments, almost 79% and 91%. The area of catchments with urban land use varies from almost zero for Narewka to almost 10% for the Oleśnica catchment.

2.2. Input Data

2.2.1. Observations

The meteorological (daily rainfall and air temperature) and hydrological (streamflow) data from 1971 to 2010 time period were acquired from the Institute of Meteorology and Water Management (IMGW), Poland.
For hydrological application, it is often necessary to compute aerial precipitation for a watershed from a number of rain gauge observations as the precipitation at one geographical point may not be representative of the precipitation on a catchment scale. In this study, the Thiessen Polygon method was used to calculate catchment daily precipitation, interpolated from a number of rainfall-gauging stations.

2.2.2. Climate Model Projections

To assess the impact of climate change on drought conditions, we used the newest source of climate projections available from the EURO-CORDEX initiative [32,33]. Simulations of EURO-CORDEX data use the new Representative Concentration Pathways (RCPs) scenario products, which are defined and explained in the fifth IPCC report [34]. The RCP4.5 is an “intermediate pathway” in which radiative forcing is stabilized after 2100 [35]. The climatic variables are obtained in the form of time series of daily sums of precipitation and mean daily air temperatures derived from seven different climate models: CNRM-CM5-CCLM4-8-17 (m1), EC-EARTH-CCLM4-8-17 (m2), EC-EARTH-HIRHAM5 (m3), EC-EARTH-RACMO22E (m4), EC-EARTH-RCA4 (m5), MPI-ESM-LR-CCLM4-8-17 (m6) and MPI-ESM-LR-RCA4 (m7). The selected combination of models consists of three GCMs: EC-EARTH, MPI-ESM-LR and CNRM-CM5 and four RCMs (Table 2). These RCM/GCMs provide projections of climatic variables up to the year 2100 at a resolution of 12.5 km. The analyses of hydro-meteorological conditions were conducted for the whole 1971–2100 period. For comparison, three time-frames are used: 1971–2000 called the reference period, and two future periods: the near future 2021-2050 and the far future 2071–2100.
The quality of climate projections of precipitation and air temperature is very important for reliable future drought projections. The RCM/GCMs simulations are generally biased and cannot be used as forcing variables in drought projection without some form of prior bias correction. Several studies have been performed in which a bias correction method was applied to RCM data (e.g., [36,37,38,39]). In this study, the Quantile Mapping (QM) method [40,41,42] was applied for each catchment to correct the simulated precipitation and air temperature time series. In the case of precipitation, the observations and simulations are approximated using two gamma distributions, one for low and intermediate precipitation intensity (up to the 95% quantile) and one for the extreme intensity (above the 95% quantile) [43]. These two distributions describing the observations are compared with the distributions derived for the simulated time series in the reference period 1971–2000. On this basis, a transformation of quantiles of simulated time series relative to the observed quantiles are derived. In addition to the correction of precipitation values, the number of wet days is also corrected based on the empirical probability of non-zero values in the observations. Due to the problems with a realistic simulation of the annual cycle for precipitation, these transformation are derived independently for each month. The transformations derived in the reference time period are later applied to correct simulations of future climatic conditions. In the case of temperature, the extreme value distribution was used to remove the bias from the raw air temperature data. This method involves the creation of a transfer function to correct the distribution function of the simulated values to match the distribution function of the observed values. A detailed description of corrected climatic projections for ten studied catchments is presented in [44].

3. Drought Indices

There are many studies of drought indices (e.g., [14,45]). The selection of indices depends mainly on the research objectives (e.g., water resource management, ecosystem management, wetland, drought protection and reservoir operation). In this study, we apply three drought indices: the SPI [46,47], the SPEI [48] and SRI [26].

3.1. Standardized Precipitation Index (SPI)

One of the most popular meteorological drought indices, the SPI, was developed for drought monitoring by [47]. It is based on the statistical analysis of precipitation data at a given location. The precipitation sums over a specified time period, the so-called aggregation scale, are used to develop a cumulative probability of these time series. Usually a gamma distribution is fitted (using a maximum likelihood approach) to the observed precipitation totals, although other distributions could also be used [49]. In order to enable a comparison of SPI values across different locations, the quantiles of estimated gamma distribution are transformed into standard normal variables. Therefore, the negative values of SPI indicate lower than median precipitation and positive values indicate wetter than median conditions. In this paper, the SPI-12 was estimated using 12 months aggregated sums of precipitation. The choice of that aggregation scale was dictated by its best performance regarding the correlation with the inter-annual changes in precipitation and the relevance to the other indices studied.

3.2. Standardized Precipitation Evapotranspiration Index (SPEI)

The Standardized Precipitation-Evapotranspiration Index (SPEI) was introduced by [48]. It is an extension of the SPI, i.e., it uses similar normalisation approach, but it takes into account both precipitation and potential evapotranspiration. Therefore, it accounts for losses due to the increase of temperature in the evaluation of atmospheric water demand. The SPEI is based on an atmospheric water balance, which is calculated as a difference between precipitation and potential evapotranspiration. In this work, potential evapotranspiration was calculated using the temperature based Hamon method. A log-logistic probability distribution is fitted to the empirical distribution of sums of those differences aggregated over a chosen time-period. Similarly, as in the case of the SPI, the quantiles of estimated log-logistic distribution are transformed into standard normal variables. Its main advantage in climate studies lies in taking into account increasing temperatures that will influence water demands and its comparativeness with the other similarly derived indices. It requires only climatological information and no other assumptions are made on the system studied. Its main limitation lies in its dependence on the method of derivation of potential evapotranspiration. Similarly as with other climatic indices, at least 30-year long sample periods should be used in order to account for natural climate variability. Similarly as the SPI, the SPEI can be estimated on a range of scales from 1 month onwards. In this work, the SPEI was evaluated on the 12 month aggregation period. As mentioned before, that scale was chosen to depict inter-annual variability of the wetness conditions in the catchment.

3.3. Standardized Runoff Index (SRI)

The Standardized Runoff Index (SRI) was introduced by [26] and is defined in the same way as SPI with runoff variable used instead of precipitation. Streamflow, as a component of the hydrological cycle, is related to infiltration, ground water dynamics, superficial runoff, soil moisture, etc.; therefore the time-response of runoff against precipitation will depend on the characteristics of the basin: size, complexity, landuse, etc. So, the SRI takes into account, in addition to precipitation, other elements of the hydrologic cycle that are relevant in many basins and are difficult to be modeled. Thus, it is convenient to consider SRI as a complement to SPI and SPEI. For future climate projections, streamflow is simulated using a rainfall-runoff model. In this study, we apply the HBV model, calibrated using observations from the reference period (1971–2000) and validated on observations from the years 2001–2010. A detailed description of an applied version of the model is presented in [50,51]. The daily values of precipitation, air temperature and potential evapotranspiration are used as input variables to the HBV model. An automatic calibration of the HBV hydrological model was performed to get the best agreement between the observed and modelled runoff measured by the Nash-Sutcliffe criterion [52]. The 14 parameters of the model were calibrated for the period of 1971–2000 and validated for 2001–2010. The results of model calibration and validation are described in detail in [50]. The obtained NS values vary between the catchments in the range 0.48–0.80 for the validation stage.

3.4. Drought Classification according to SPI, SPEI and SRI

The values of three drought indices studied (SPI, SPEI and SRI) give an indication of the relative dryness/wetness in the analysed periods. Due to standardization to normal distribution, they have the same ranges and are directly comparable, which allows a quantification of drought classes to be performed. We follow the most popular classification scheme presented in Table 3 [46].

4. Results

4.1. Evaluation of Drought Indices in the 1971–2000 Period using Observations

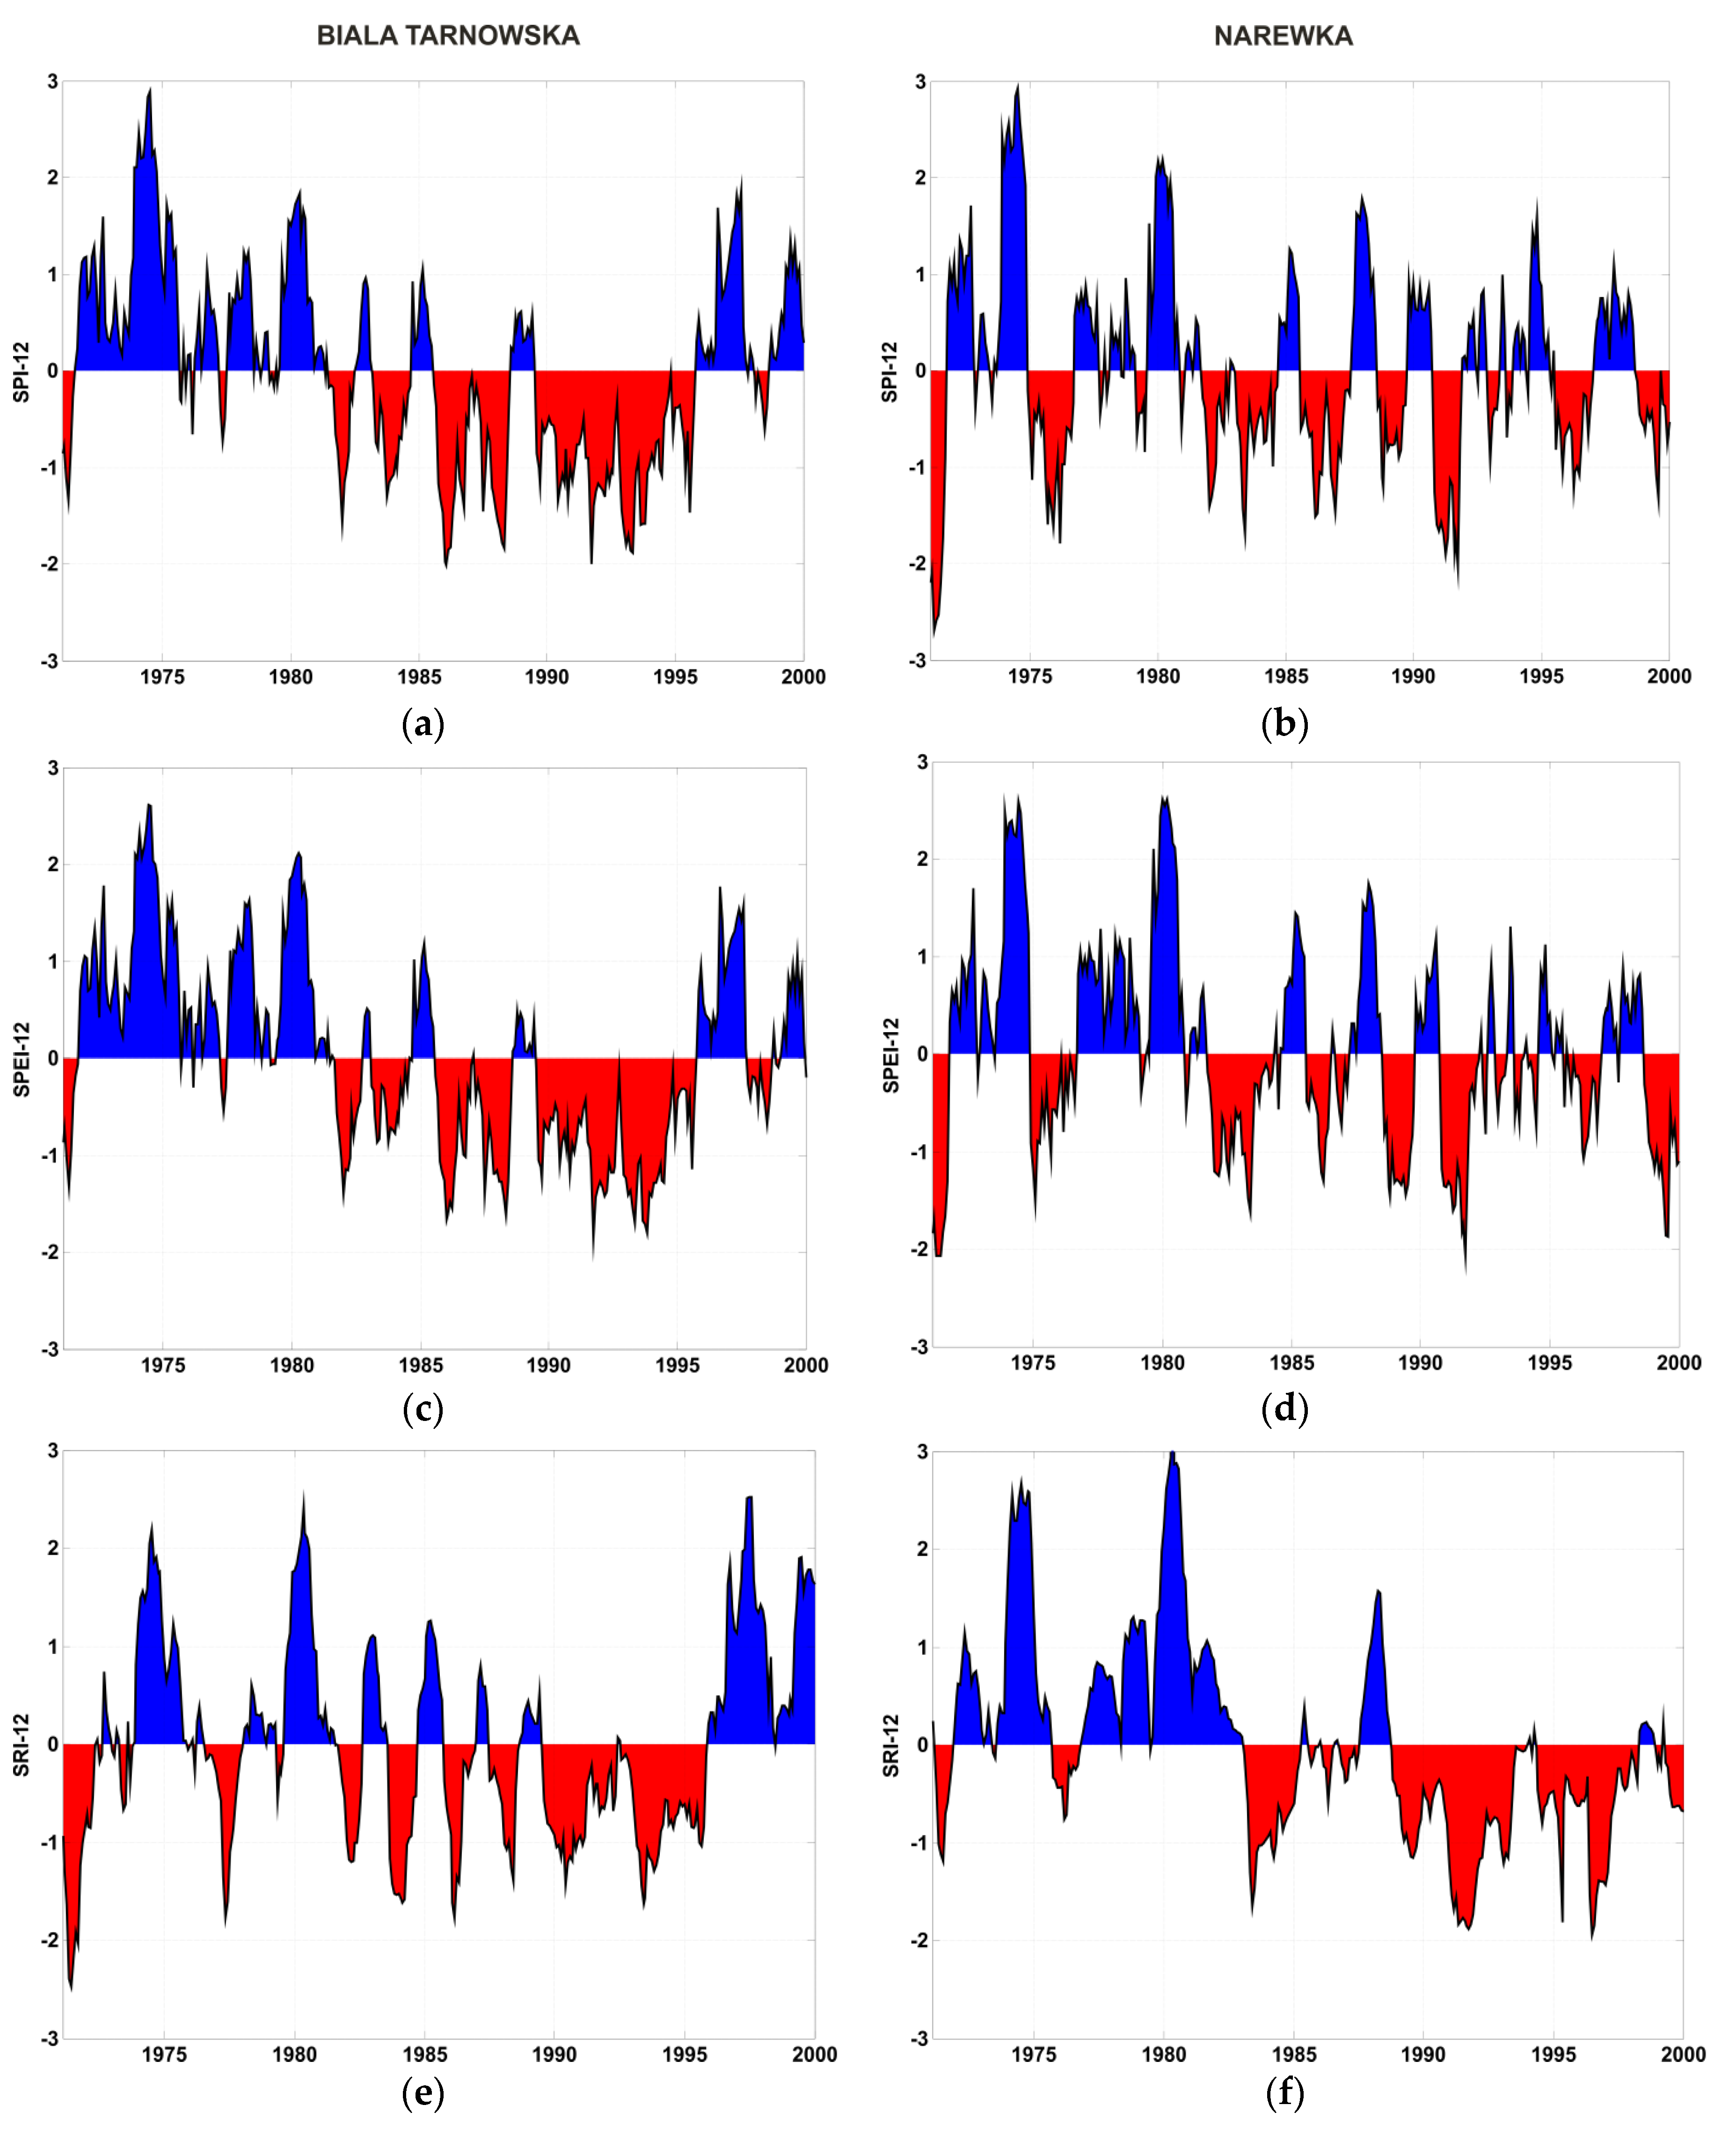
The SPI, SPEI and SRI may be evaluated at different accumulation periods, from 1-month onwards. In this study, a 12-month accumulation period was used, allowing for the integration over the whole year cycle [26]. The indices differ in their description of drought. As mentioned in previous sections, SPI is based solely on precipitation, SPEI uses precipitation and potential evapotranspiration as input variables and SRI is based on flow. Therefore, the SPI and SPEI describe meteorological drought, whilst SRI refers to hydrological drought. A comparison of temporal patterns of SPI-12, SPEI-12 and SRI-12 indices under specific drought conditions gives an indication of how well those indices represent historical drought and also informs on their ability to illustrate the transformation of meteorological drought (described by SPI-12 and SPEI-12) into hydrological drought (SRI-12) [26]. The latter was tested by comparison of temporal patterns of indices for two geographically different catchments, Biała Tarnowska and Narewka. Figure 2 presents the SPI-12, SPEI-12 and SRI-12 evaluated using observations from the period 1971–2000 for these catchments.
Figure 2a,b presents temporal patterns of SPI-12 for Biała Tarnowska (Figure 2a) and Narewka (Figure 2b). Blue colour indicates wet conditions (higher than median from that period) and red the dry conditions. It is visible that three types of 3–5 year clusters can be distinguished: (i) mostly wet, (ii) mostly dry and (iii) annually alternating dry and wet. Comparison of the SPI-12 for Biała Tarnowska and Narewka catchments shows that wet and dry periods do not occur at the same time in both catchments. In the case of Biała Tarnowska, the precipitation deficit occurred in the period 1982–1997 followed by mostly wet conditions. The SPI-12 pattern for Narewka shows alternating dry and wet conditions. Interestingly, the meteorological drought in the 1975–1976 is visible in Narewka and wet conditions prevail in the same time in Biała Tarnowska. This phenomenon can be explained by the catchments location (North East for Narewka and South for Biała Tarnowska). Both catchments show dry spell in the 1982–1983, but it is more visible for Narewka than Biała Tarnowska. Also the dry spell in 1992 is well represented in both catchments.
The Figure 2c,d presents the SPEI-12 variability in the period 1971–2009 for Biała Tarnowska (Figure 2c) and Narewka (Figure 2d) catchments, respectively. The SPEI-12 generally repeats the SPI-12 temporal patterns in both catchments with small differences in the intensity of dry and wet periods.
The time series of the SRI-12 estimated for Biała Tarnowska (Figure 2e) and Narewka (Figure 2f) catchments are shown in Figure 2e, f. The SRI-12 temporal variability differs from the SPI-12 and SPEI-12 due to an integrating behaviour of a rainfall-runoff process which is expressed by a catchment memory. The SRI-12 indicates drier conditions in Narewka catchment than two other indicators, starting in the 80ties and lasting until 2000. As SRI-12 describes moisture conditions in the catchment, we can look at this period as a transition from wetter into drier conditions in Narewka. It can be noted that this pattern is not reproduced neither by SPI-12 nor SPEI-12 in the Narewka catchment. For Biała Tarnowska, the period starting in the 80 ties and ending in 1996 is consequently shown as mostly dry by all three indices. Biała Tarnowska (southern Poland) is a mountainous catchment whilst Narewka is situated in the lowland (north-east Poland) and their geographic and hydro-climatic characteristics differ. The differences between indices are due to catchment geomorphology, snow cover and human induced changes that can affect flow patterns.
The spatial characteristics of three drought indices for ten catchments were analysed using the Pearson correlation coefficient. The correlation of SPI-12 values is statistically significant for all catchments (Table 4). In this Table 4 and the following Table 5 and Table 6, the colour code from red to orange to light green to dark green corresponds to the values of Pearson correlation coefficient varying from 1 (red) to 0.0 (dark green). The estimated correlation coefficients permit a selection of similar catchments taking into account pluvial conditions. The largest correlation was achieved for the SPI-12 in mountainous catchments Biała Tarnowska, Dunajec and Wisła, most probably due to their close location. A lower correlation was estimated between lowland and mountainous catchments, which also are the most distant. The results obtained for the SPEI-12 and SRI-12 (Table 5 and Table 6, respectively) resemble the estimates for the SPI. The highest values of correlation were achieved for catchments located in neighbouring regions. In the case of lowland catchments, a higher correlation was estimated for SRI-12 than SPI-12 and SPEI-12.
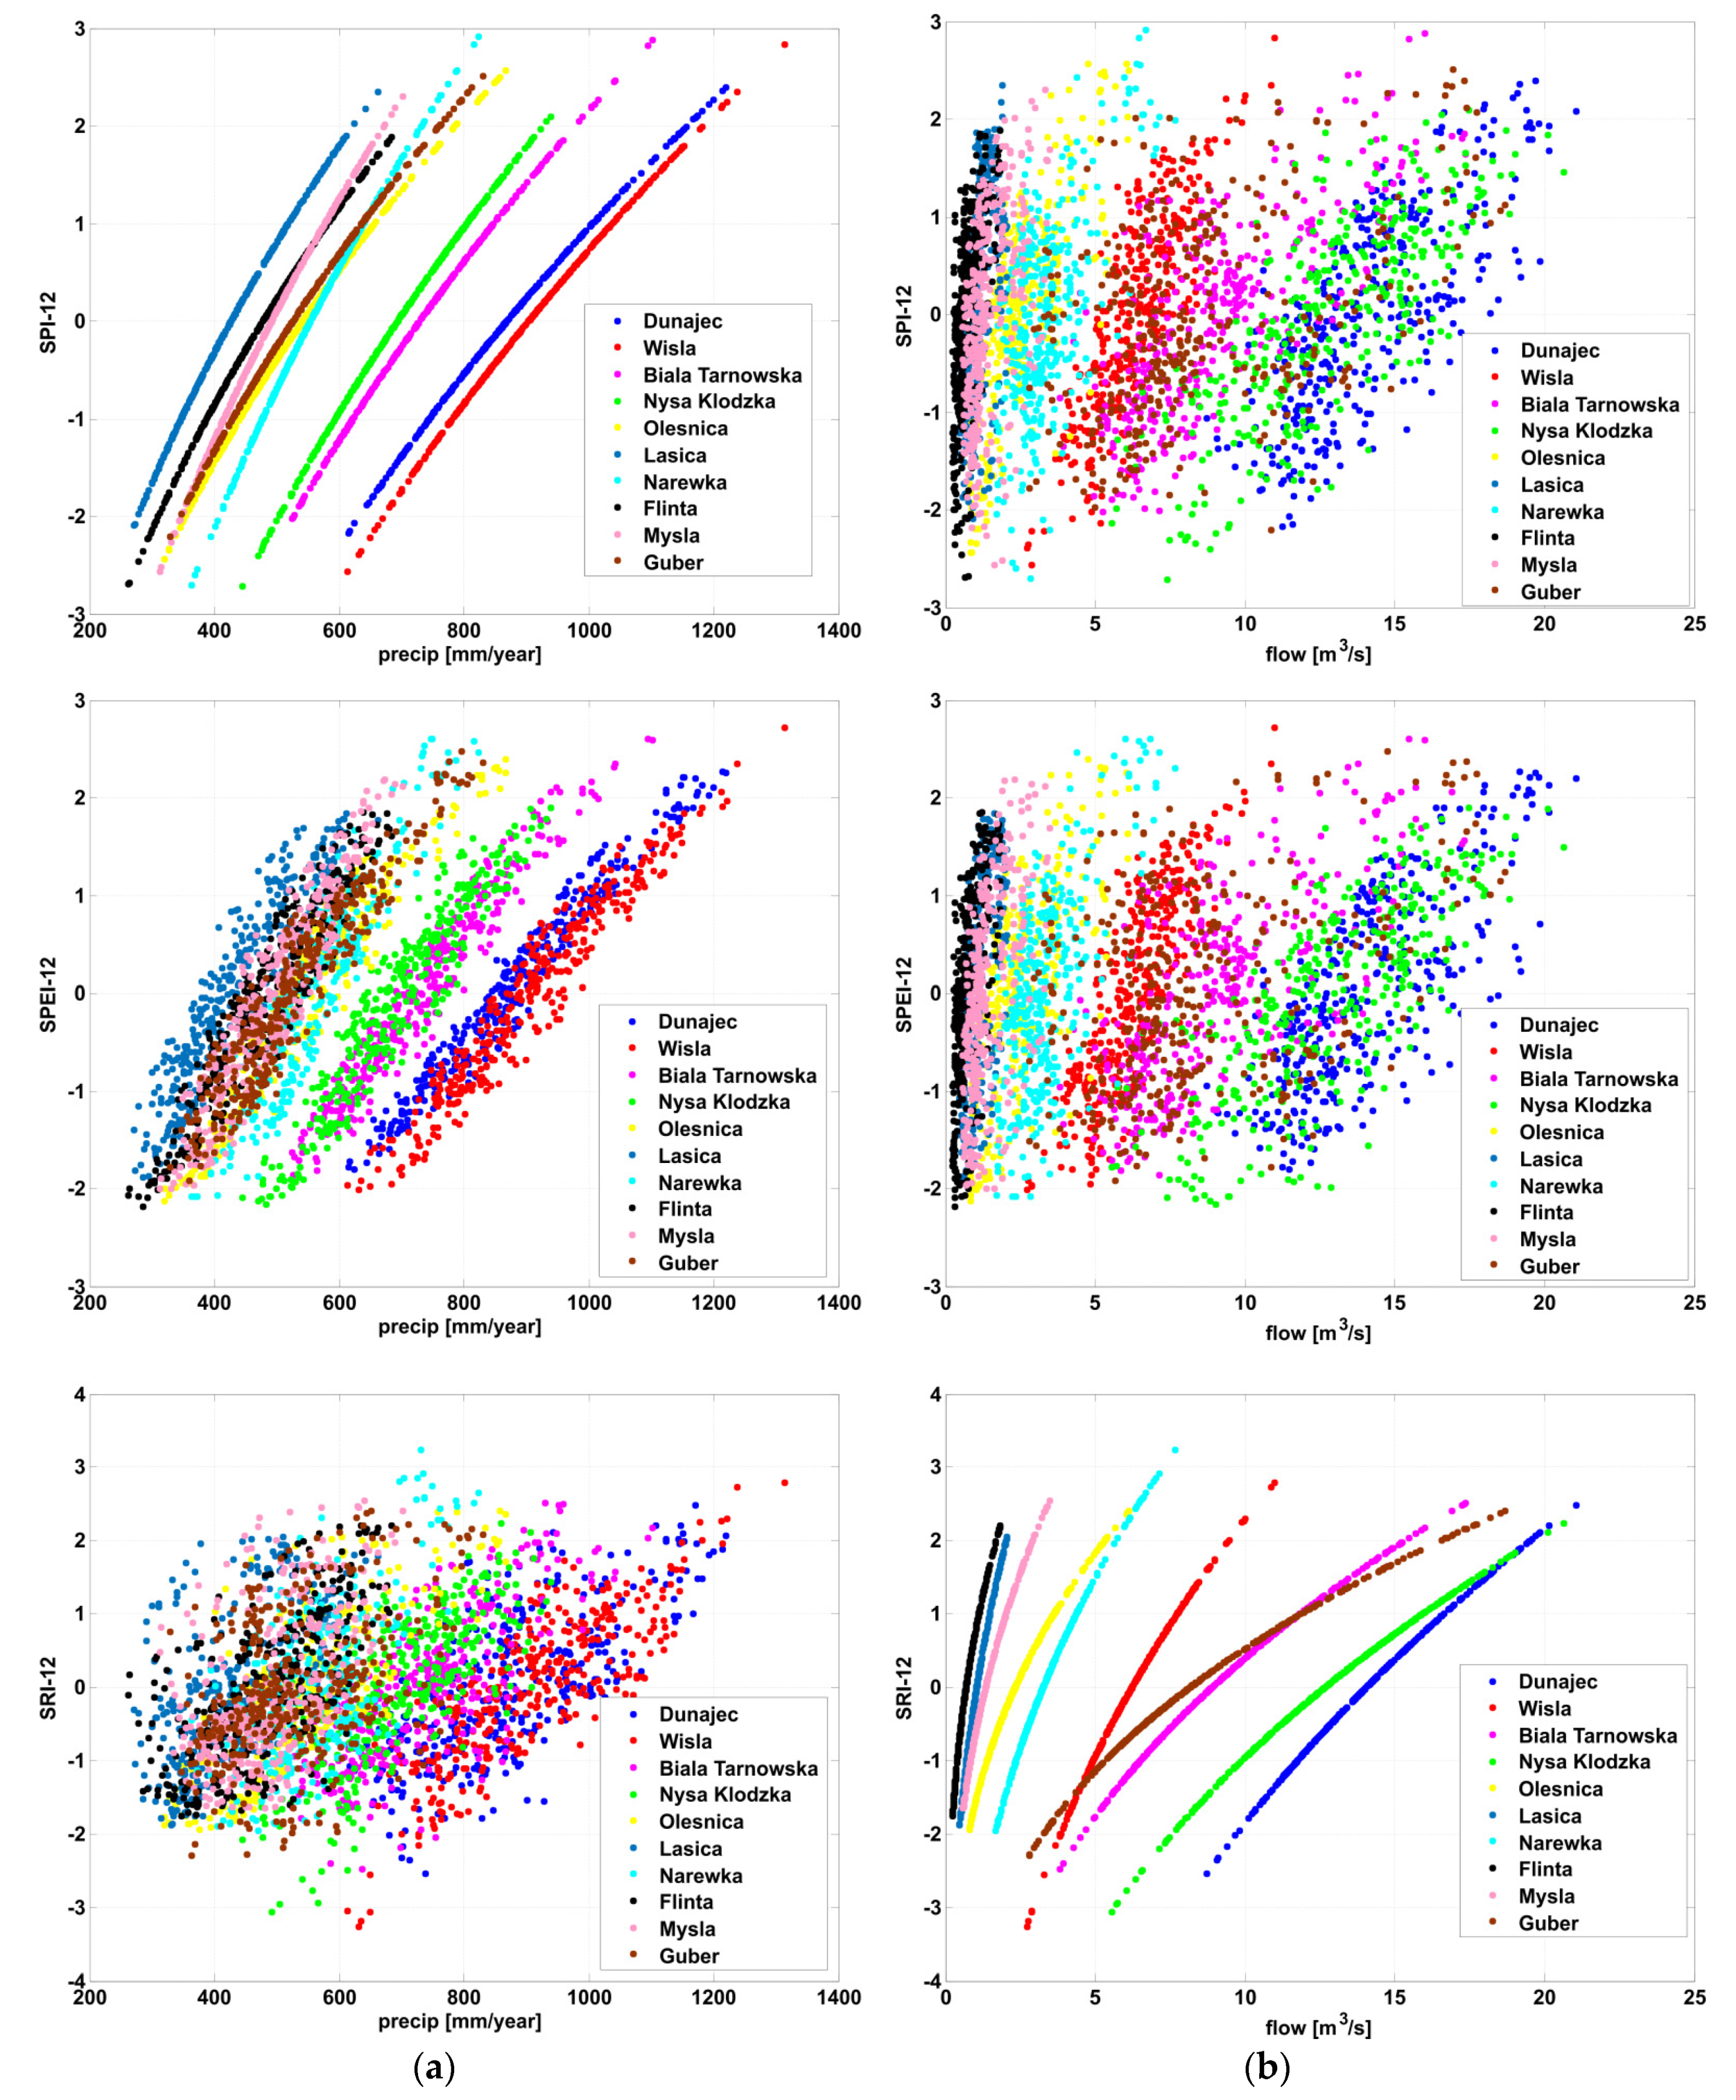
The correlation analysis between the three drought indices and hydro-meteorological observations, annual sums of precipitation and mean annual daily flow was performed to assess the sensitivity of those indices to changes in hydro-meteorological input. The results of that analysis, are presented in Table 7 and Figure 3. The highest values of the Person correlation coefficient were found for the SPI-12 vs precipitation and SRI-12 vs flow, which can be explained by their direct relationship with those two variables. It is interesting to note that SPI-12 and SPEI-12 have a similar sensitivity to precipitation for all catchments. However, the relationship between SRI-12 and flow shows two clusters, dividing catchments into lowland and mountainous. The division is most probably due to the ranges of precipitation and flow, small for lowland rivers and large for mountainous rivers. The Guber catchment is an exception, as it shows a larger range of flow values than the other lowland rivers. This catchment is the most northerly and contains a large number of lakes, indicating strong dependence of its discharge on groundwater system.
In the case of the SPEI-12, the calculated correlation coefficients have a bit lower values, in the range 0.92–0.98. The correlation coefficients between precipitation and the SRI-12 and flow and the SPI-12 are the lowest and take values between 0.4 and 0.8. There is a significant variation of the estimated correlation coefficients between catchments. The lowest values were achieved for Guber (SRI-12 vs. precipitation, SPI-12 vs. flow and SPEI-12 vs. flow) and Myśla (SPI-12 vs. flow).
The suitability of each of the indices for future climate predictions depends on their sensitivity to changes of climatic variables (precipitation and temperature) and on their robustness. The SPI-12 and SPEI-12 have no memory of previous moisture conditions, SRI-12 carries a catchment memory which is embedded in the flow patterns and is catchment specific, but it relies on hydrological model simulations for future climate projections. Therefore, its estimates for future climate are biased by the hydrological model uncertainty. The analyses based on observations reported here indicate that each of the indices gives some valuable information on soil moisture conditions in the catchment which also depends on catchment geomorphology and its location. In particular, the SRI-12 gives different to the SPI-12 and SPEI-12 drought assessment in lowland catchments included in this study.

4.2. Consistency of the Simulated and Observed Hydro-Climatological Variables in the Reference Period

Analyses of the changes in future drought conditions were carried out using air temperature and precipitation simulations available from the EURO-CORDEX initiative, as described in Section 2.2.2. The climate data were corrected on the basis of observations from the reference period and the same corrections were applied to future conditions. The corrected time series were used for the estimation of mean changes between two future periods, near future 2021–2050 (clim1) and far future 2071–2100 (clim2), and reference period 1971–2000 (ref).
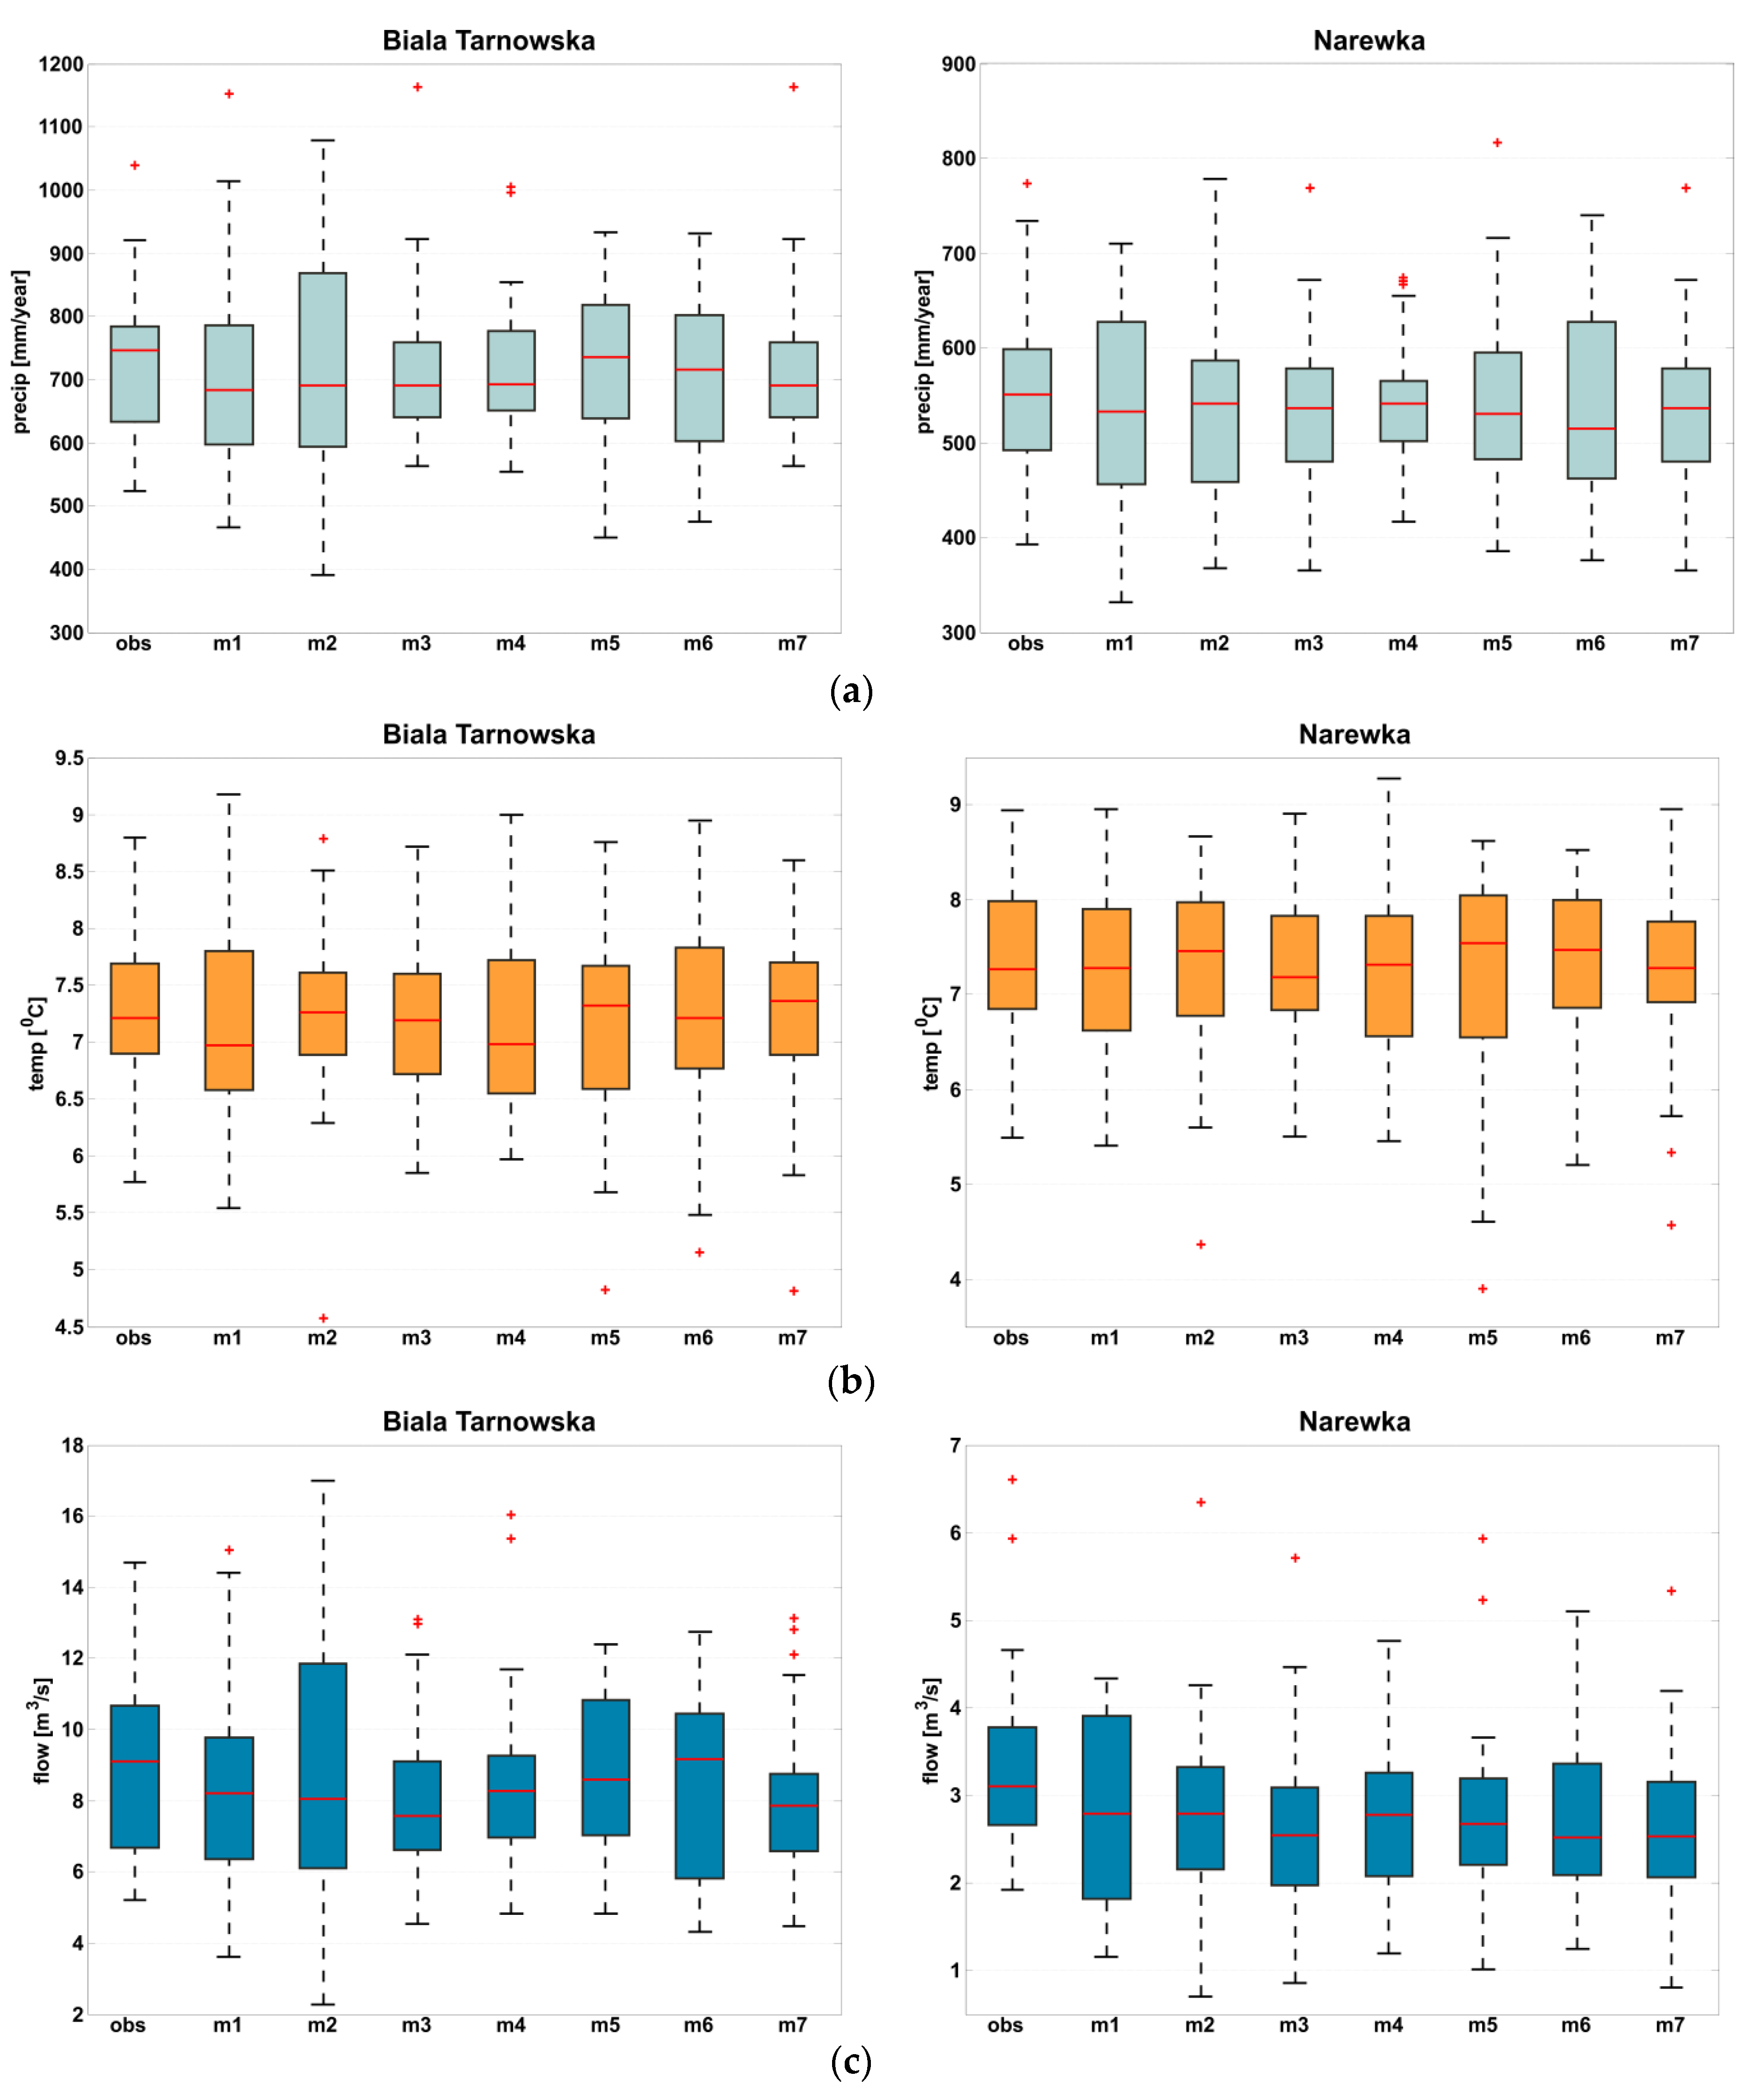
Hydrological models (Hamon method of PET calculation and HBV rainfall-runoff model), calibrated and validated using observations from the reference period, were applied to derive catchment discharges for future climate projections. The comparisons of simulated precipitation, air temperature and flows with observations for the reference period 1971–2000 for the Biała Tarnowska and Narewka catchments are presented in Figure 4. The results indicate that there are some differences between mean values of climate model simulations and observations. The simulated median annual sum of precipitation over the period 1971–2000 underestimates the observations. In the case of air temperature, there are slight differences between climate models and underestimation as well as overestimation can be seen for median annual air temperature over the reference period. The results of simulations of mean annual flow indicate that the median value is underestimated for all models for the Narewka catchments and Biała Tarnowska except model MPI-ESM-LR-CCLM4-8-17. Also the variability of sum/mean annual hydro-climatic variables in the period 1971–2000 shows differences between climate models.

4.3. Changes in Projected Precipitation and Temperature

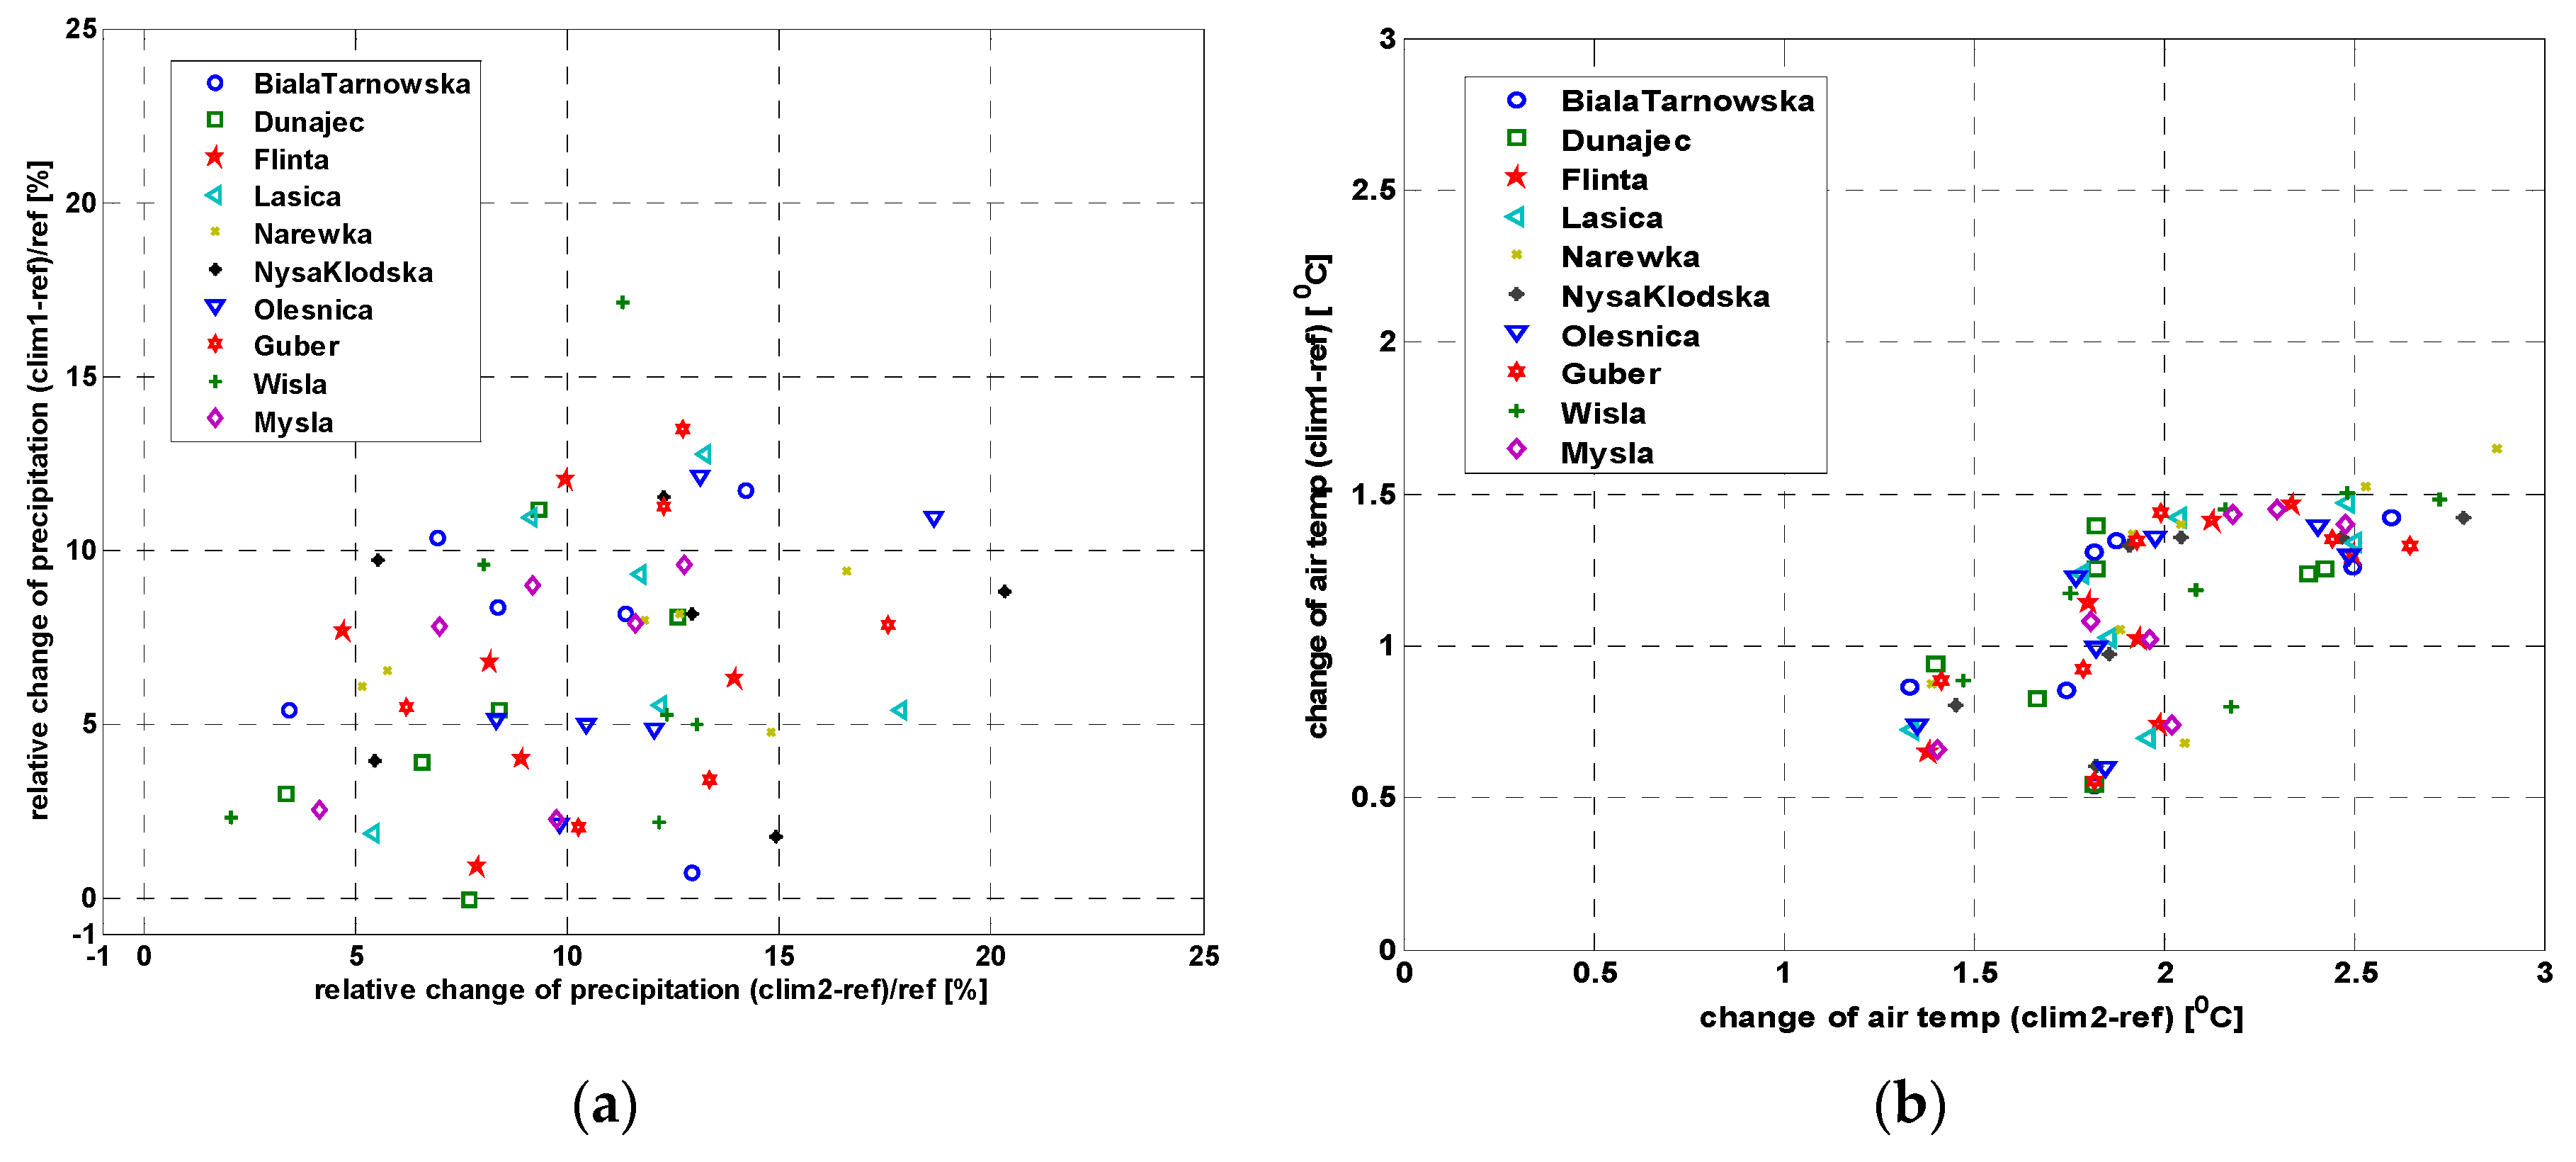
The estimated changes resulting from the seven models in the mean annual air temperature for the ten studied catchments are shown in Figure 5b. The results are presented in the form of absolute changes expressed in (°C). The largest changes (from 1.3 to almost 3 °C) were estimated for the far-future. The difference in mean annual air temperature between near future and reference periods is smaller and ranges from 0.5 to slightly above 1.5 °C. The results indicate that there are differences in the magnitude of the changes between catchments, climate models and two future periods. The largest changes estimated using the median from the ensemble of climate models are projected for Myśla, Narewka and Guber catchments located in northern Poland. A comparison of the simulations between climate models indicates that MPI-ESM-LR-CCLM4-8-17 model projects the lowest changes in air temperature (1.4 °C median for ten catchments) between the far-future and reference periods. The highest changes (2.5 °C) are projected by EC-EARTH-RACMO22E and EC-EARTH-RCA4 models.
A similar analysis was performed for changes in the annual sum of precipitation and the relative changes are presented in Figure 5a. In all cases increases of precipitation are projected, with the changes increasing with time. The relative differences in the mean annual sum of precipitation between the near-future and reference periods vary from 0 to 17% whilst for the far-future the range from 2% to slightly above 20%. There is a significant variability of the projected changes between climate models and catchments. A comparison of projected relative changes between catchments for the far-future with reference to 1971–2000 periods indicates higher changes in lowland catchments and smaller changes in those located in a mountainous area. Taking into account the difference between climate models, the three models project changes of around 6% (EC-EARTH-HIRHAM5, MPI-ESM-LR-CCLM4-8-17 and MPI-ESM-LR-RCA4) whilst the highest changes (13.5%) are simulated by CNRM-CM5-CCLM4-8-17 model.

4.4. Drought Projections: SPI-12, SPEI-12 and SRI-12

The SPI-12, SPEI-12 and SRI-12 values have been computed over the period 1971–2100 for 10 catchments.
A comparison of the drought projections using SPI-12, SPEI-12 and SRI-12 was carried out using the following quantities:
  • median conditions according to the three indicators in the three periods: 1971–2000, 2021–2050 and 2071–2100,
  • frequency of drought recurrence (a number of months in a specific time reference or two future periods) with a specified drought category divided by total number of months,
  • drought severity (the sum of negative values over a certain period).

4.4.1. Comparison of the Median Conditions of the SPI-12, SPEI-12 and SRI-12 in the three periods

Following the methods presented in section 3, projections of the dryness/wetness conditions in the entire period 1971–2100 were developed using simulations of the seven climate models. The selection of the time series that correspond to the three periods 1971–2000, 2021–2050 and 2071–2100 allows for comparison of dryness/wetness conditions in these periods and changes among them.
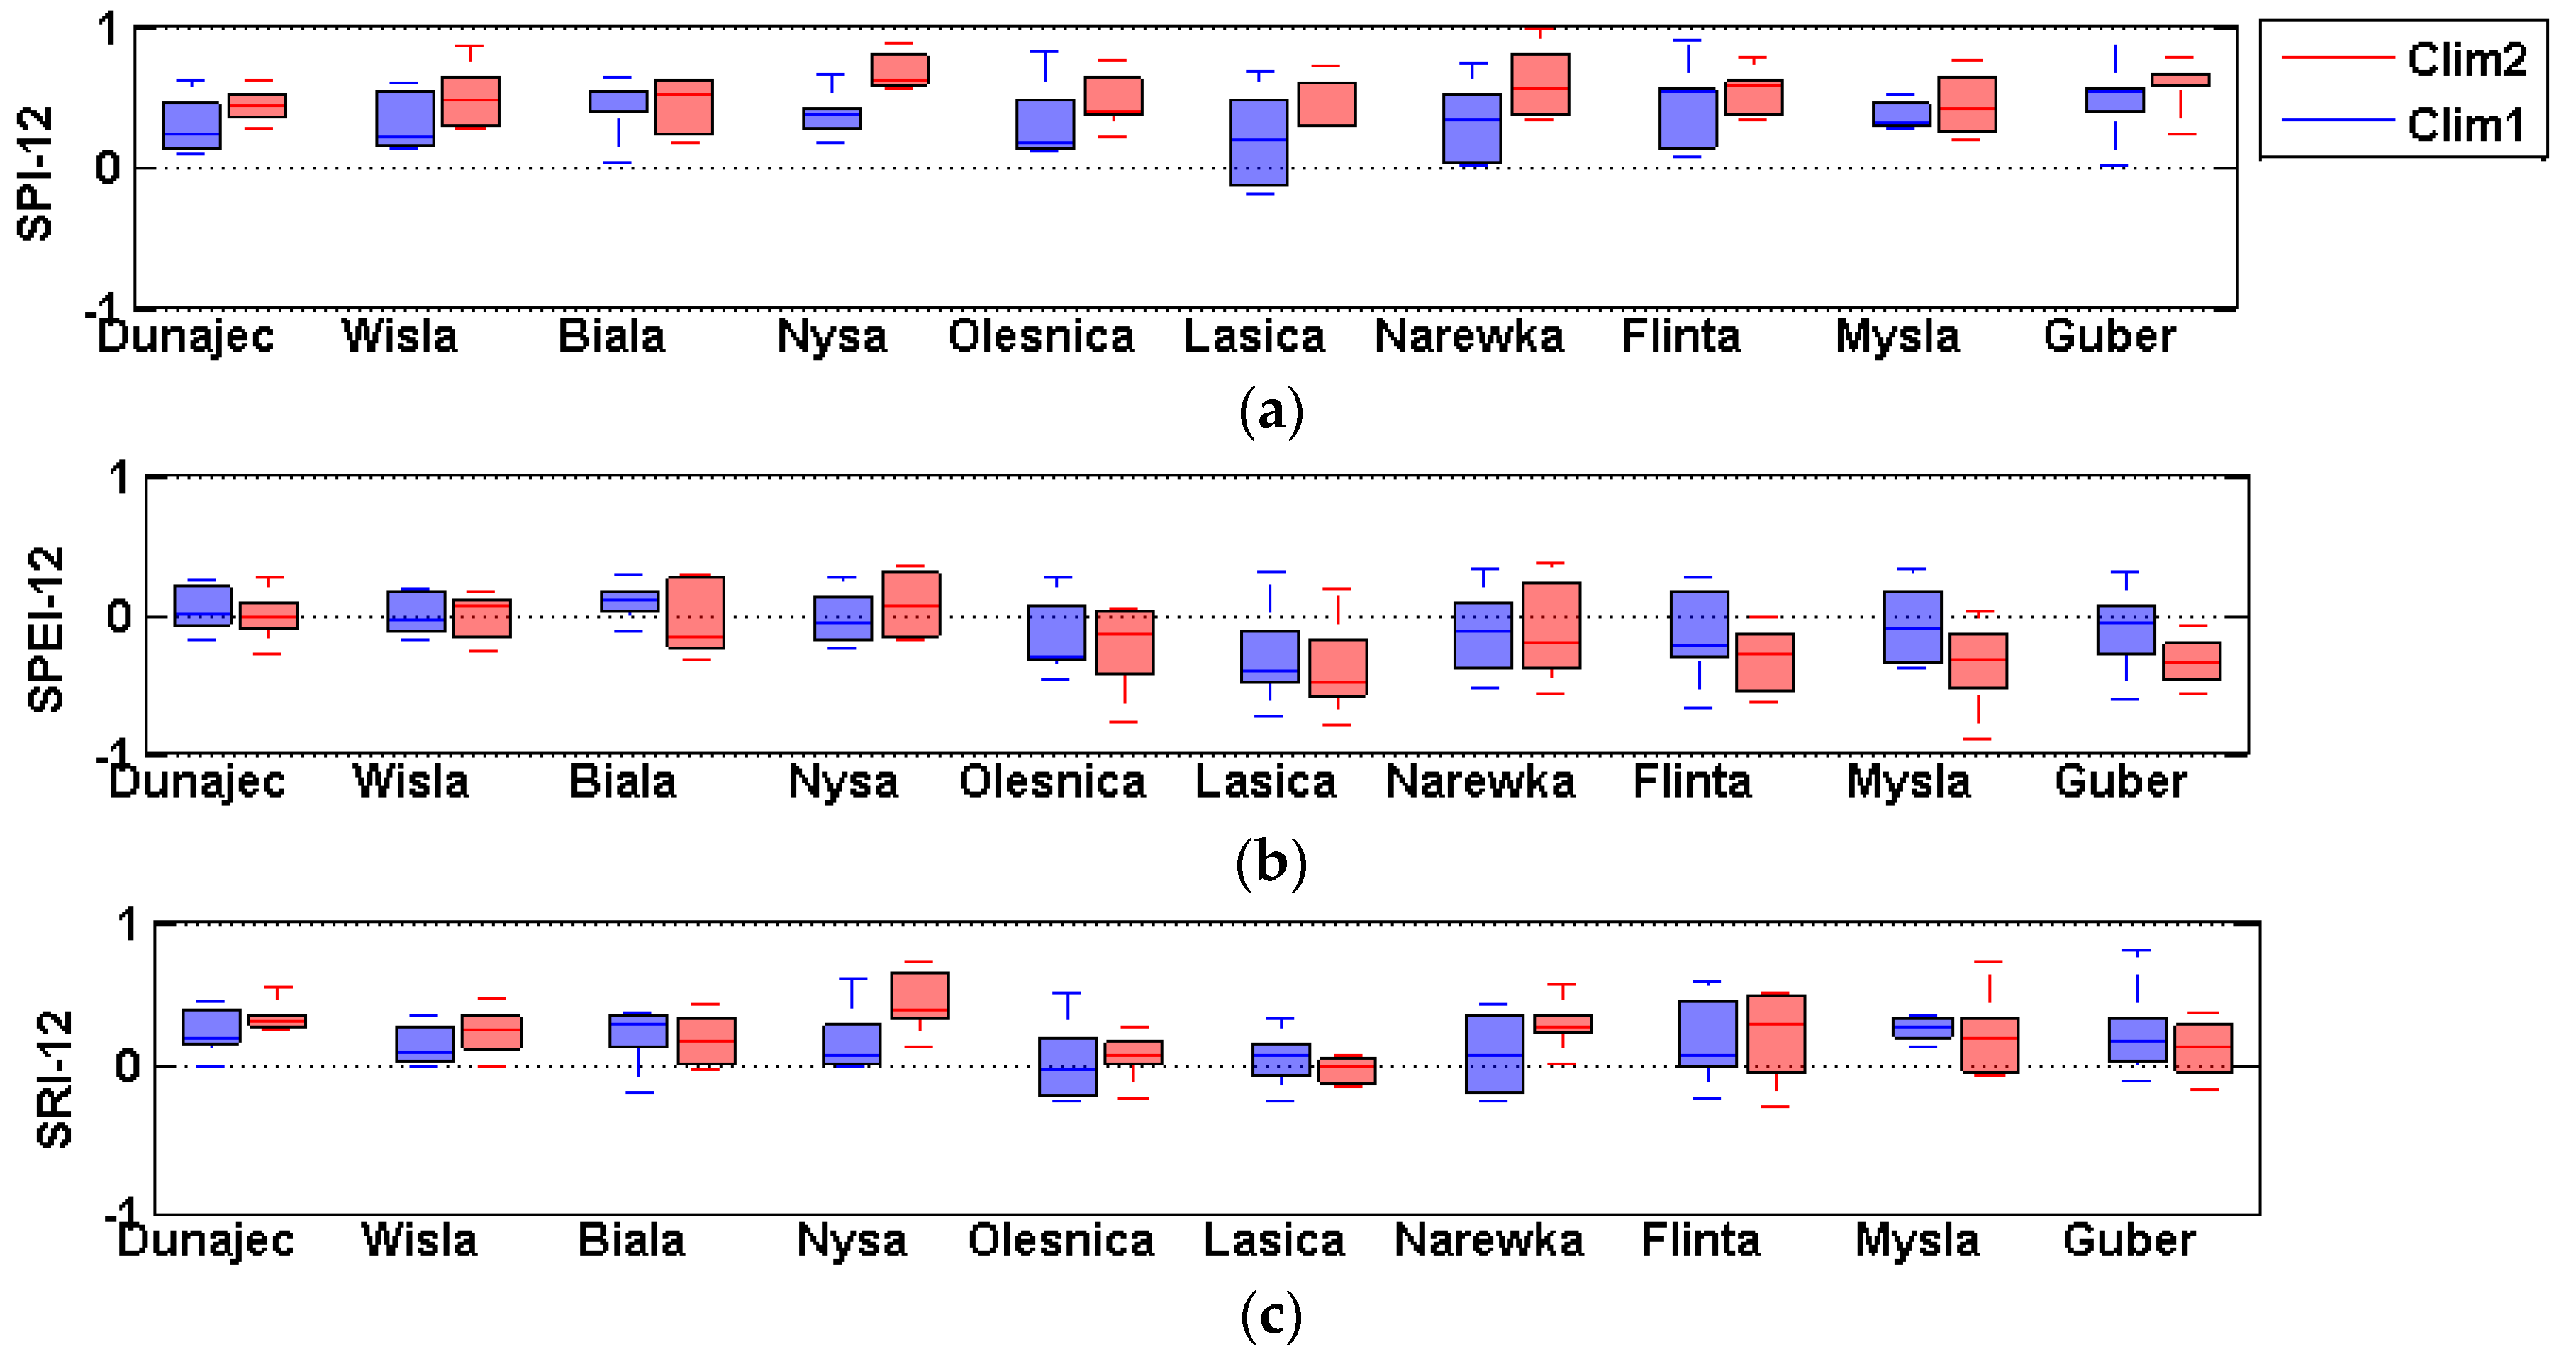
Drought tendencies relative to the reference period (1971–2000) for the near- and far-future using SPI-12 (Figure 6a), SPEI-12 (Figure 6b) and SRI-12 (Figure 6c) are presented in Figure 6 for all ten catchments and seven climate model simulations. The median conditions shown as a red line indicate an increasing trend of the SPI-12 values with time that correspond to a decrease of a degree of dryness in all studied catchments. The absolute median drought changes in the near and far future period are characterized by positive values (wetter conditions). A comparison of changes of the SPI-12 in all catchments indicates that the largest positive changes will occur in the far-future period.
The estimated median SPEI-12 values in the reference period for all catchments and climate models have negative values, indicating dryer conditions than in the past periods. The results both for the near-future (clim1: 2021–2050) and the far-future (clim2: 2071–2100) are characterized by a noticeable decrease of wetness conditions in all catchments in comparison with the SPI-12 results. That results from an influence of the air temperature rise on water losses due to the evapotranspiration, neglected by the SPI index. The differences are particularly noticeable for the far-future climate conditions, where the SPI-12 indicates wet conditions whilst the SPEI-12 indicates dry conditions.
The estimates of SRI-12 indicate that median conditions over 30 years depend on the climate model, catchment and period. In the reference period, the negative values of SRI-12 were achieved for most of models and catchments with a few exceptions (four models for Łasica and Oleśnica, three models for Guber and Flinta catchments). In the near future, the number of simulations with a positive value of the median SRI-12 conditions is significantly higher than the reference period, but there are inconsistencies between simulations of climate models. The highest increases of the SRI-12 are projected for the Flinta, Myśla and Guber catchments.
The outcomes for the far-future (2071–2100) indicate that the median estimated SRI-12 values are higher than zero (indicating wetter condition) with some exceptions. A comparison of the similarity of results between catchments shows that for Dunajec, Wisła, Nysa Kłodzka catchments, all models project positive values of the median SRI-12. In the other cases, there are differences between the climate models.

4.4.2. Frequency of Drought Recurrence

The frequency of the recurrence of drought is defined as the number of months in a specific time (reference, near future or far future) with a specified drought category (mild, moderate, severe or extreme) divided by the total number of months. After a transformation of this empirical frequency into normal distribution, the theoretical probability of occurence of each class is easy to estimate. It is equal to 9.2% for moderate drought, 4.4% for severe dryness and 2.3% for extreme dryness. Due to nonstationarity of climatic conditions, the estimates of these probabilities in the three periods are different than for the entire period.
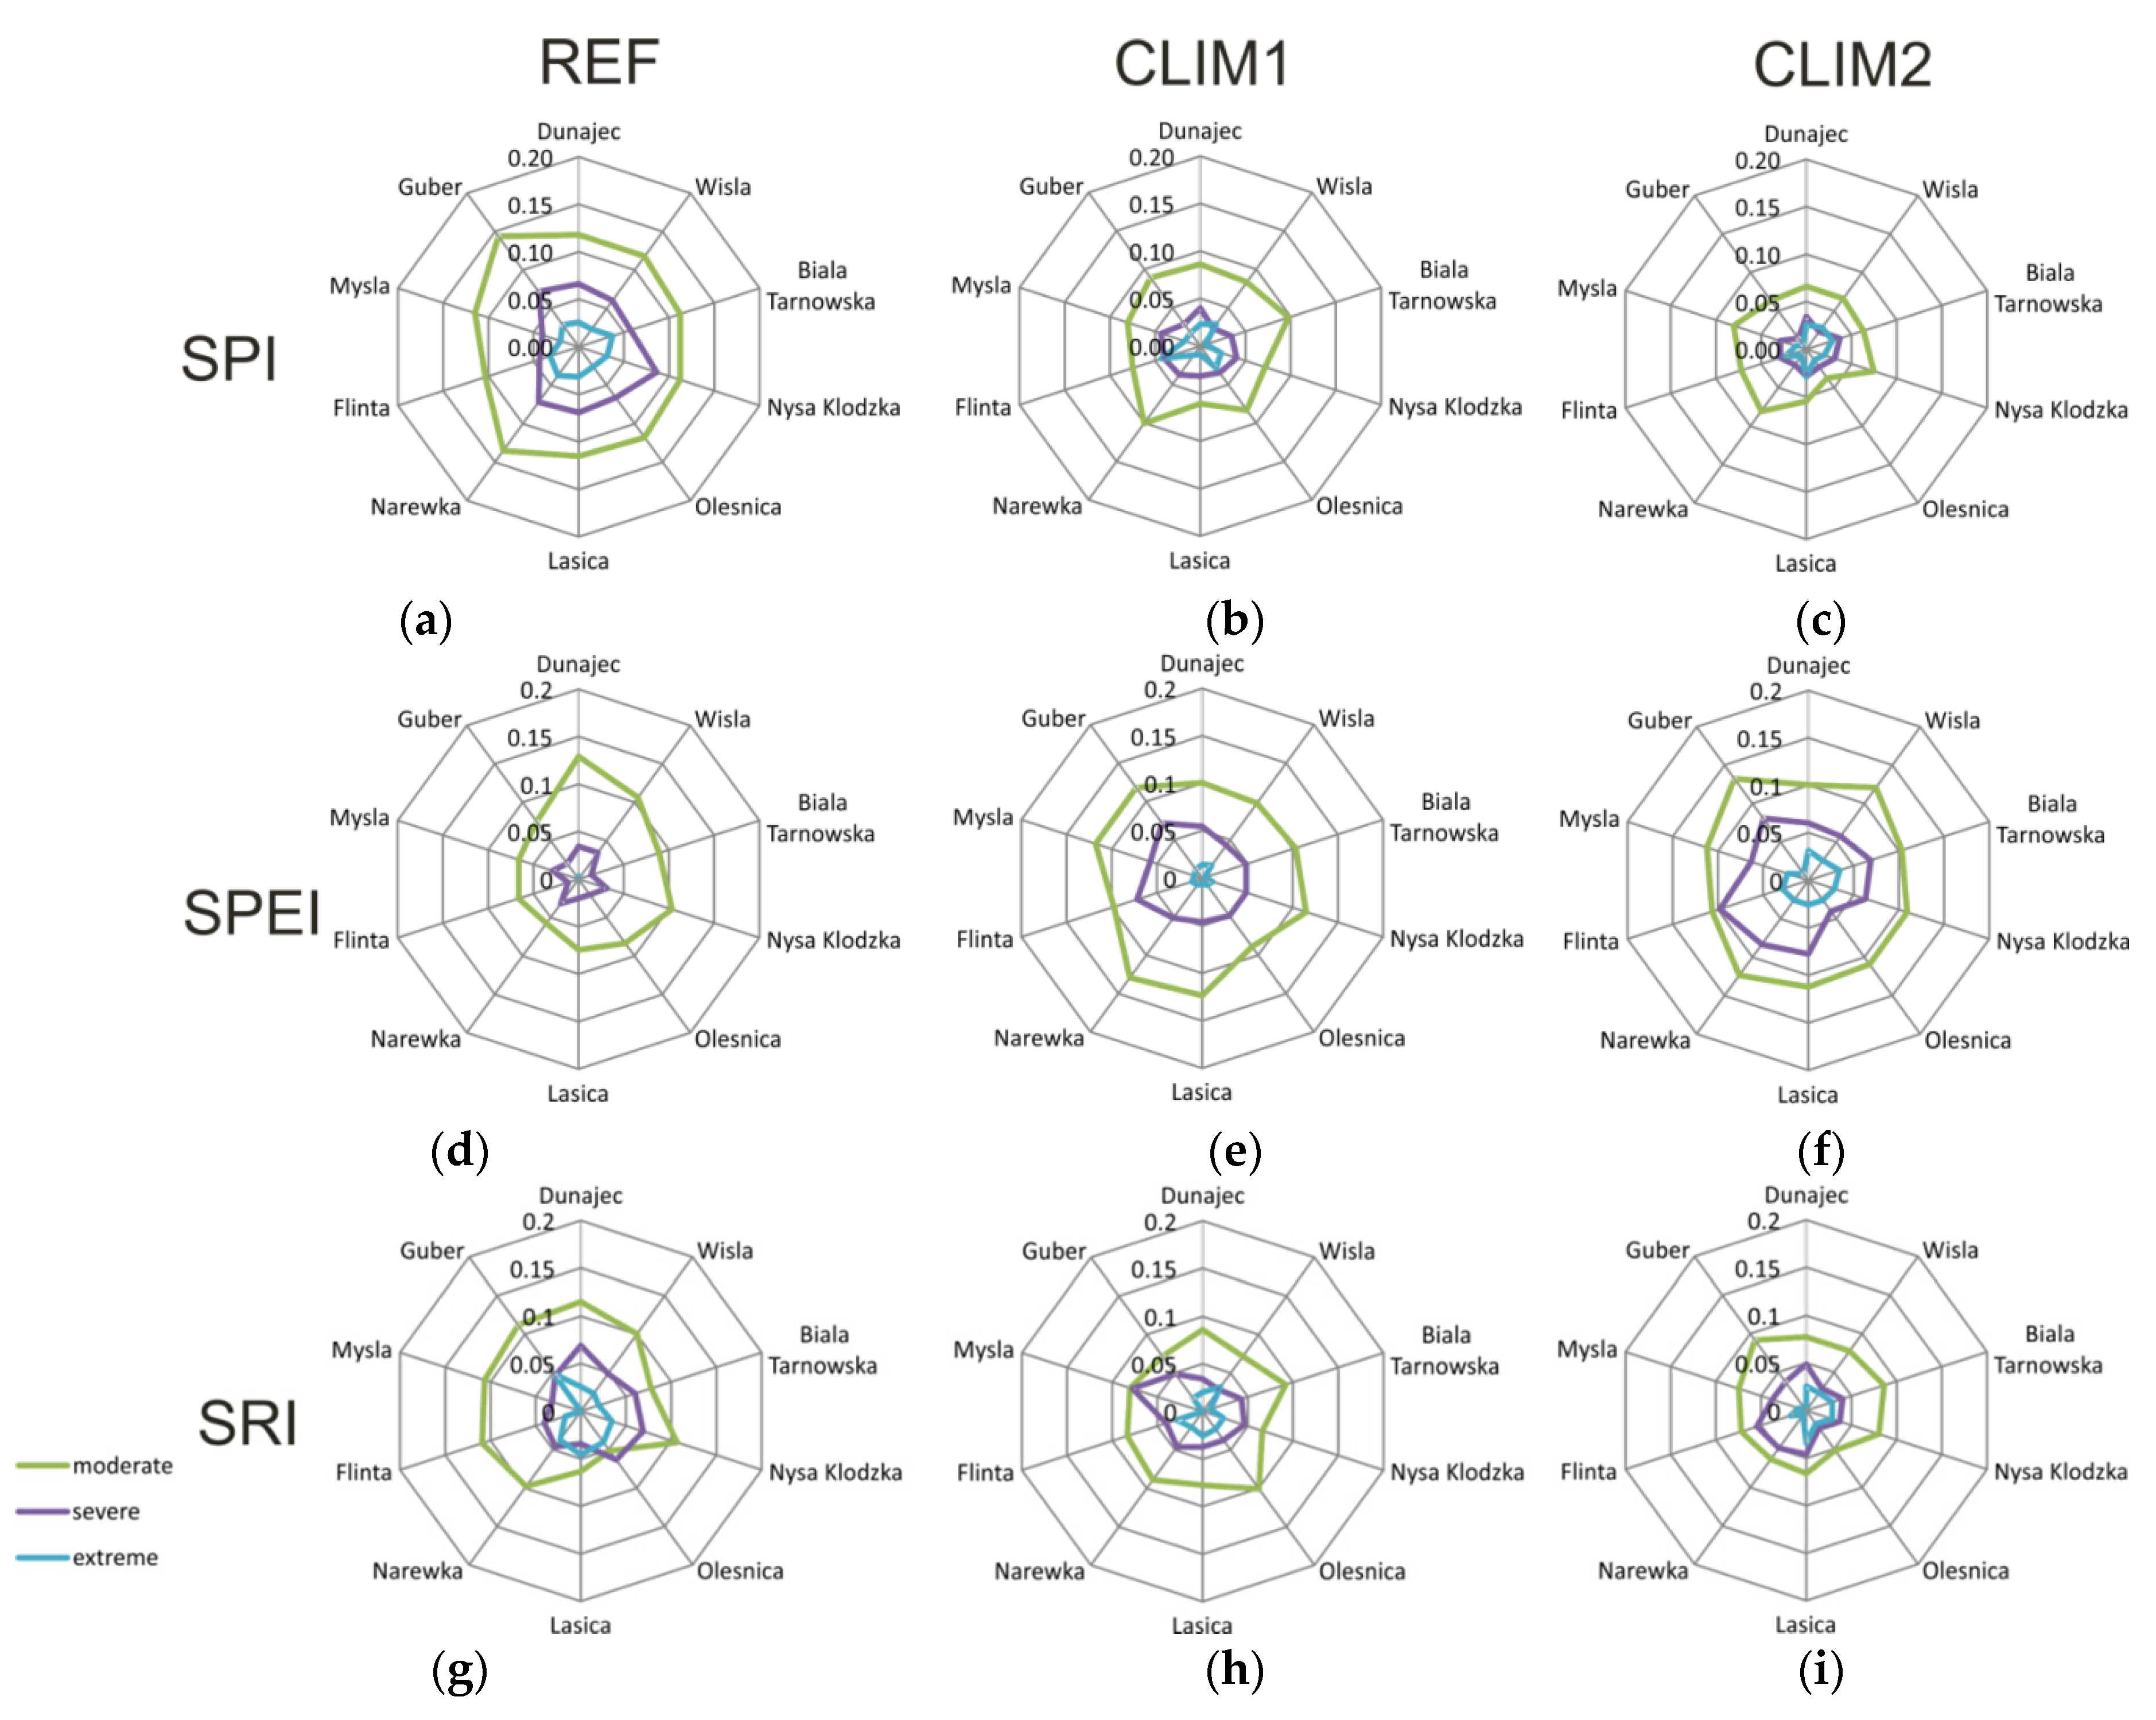
Table 8 shows estimated median values of a probability of occurrence of five classes of dryness during the 349 months (i.e., 30 years) baseline (reference) period and during the 349-months of the near-future and far-future time windows. The results present a median values over ten studied catchments whilst Figure 7 shows estimates of probability of occurrence of drought of three categories (moderate, severe and extreme) in each catchment. The probability of recurrence of three drought classes estimated according to SPI-12 values, shown in Figure 7a–c, is decreasing with time. The estimates for moderate drought (median over ten catchments) are changing from 11.6% in the reference period to 8.3% in the near future and 6.6% in the far future. The number of cases with severe drought condition is also decreasing (6.6% ref, 3.7% clim1 and 2.9% clim2). Changes of probability of recurrence of the extreme drought are less visible (3.0% in ref, 2.3% in clim1 and 2.2% in clim2). Those patterns are visible for all catchments, but intensities of changes vary between catchments. The largest changes (decreases) of moderate drought occurrence are estimated for Łasica and Guber catchments whilst the lowest for Nysa Kłodzka, Myśla and Flinta.
The analyses of probability of drought occurence carried out with help of the SPEI-12 are shown in the Table 8 and in Figure 7d–f. In that case, the number of events classified as moderate drought is changing from 7.9% in reference period through 10.9% in the near future to 11.1% in the far future. also an increase of number of severe and extreme drought events is projected. Differences between estimates for ten catchments are noticeable. The estimates of moderate drought for Dunajec catchment in both future periods and Wisła in near future project decreases while in all other cases, increases of probability are projected. The highest increases are simulated for Narewka catchment.
The outcomes of the analyses using SRI-12 show a decrease of drought probability from the reference period to the future and increasing number of events with wet conditions. In average the results are similar to those for SPI-12 but with smaller decreases of number of drought events. However, spatially (catchment to catchment), there are differences in the magnitude and also tendency of changes. Increases of number of moderate drought events were estimated for Biała Tarnowska and Łasica catchments.

4.4.3. Drought Severity

Drought severity was estimated as the sum of negative values of the drought index (SPI-12, SPEI-12 or SRI-12) in the specified time (1971–2000, 2021–2050 or 2071–2100) for each catchment and all climate models. The results of the assessment in the form of changes in the drought severity between two future periods and a reference period are presented in Figure 8. A similar tendency of changes (decreases) was achieved between drought indices SPI-12 and SRI-12 for most of the catchments. The median change from an ensemble of climate models for future periods and all catchments, models and drought indicators has negative value indicating decreases of drought severity with time. There is a significant spread of the results between climate models shown by whiskers in the Figure 8. Some climate models project increases of three drought indices for lowland catchments (Flinta, Łasica). However, SPEI-12 shows an increase of drought severity in the near-future and far-future periods for all catchments. Both SPEI-12 and SRI-12 take into account the potential evapotranspiration, but in the case of SRI-12 losses are limited by physical laws, whilst for the SPEI-12 the losses are directly related to the air temperature increase.
A comparison of the results using three indices shows that the highest spread is estimated for the SPEI-12. The influence of changes in air temperature on the drought indices is analysed by comparison of the SPI-12, SPEI-12 and SRI-12 results. The changes in the drought severity, estimated using SPI-12, are greater than those for SRI-12 due to projected increases of air temperature and related evapotranspiration. The outcomes for SPEI-12 are characterized by different tendency of changes comparing to the SPI-12 and SRI-12. These results are explained by the method of SPEI-12 calculation that is based on the differences between aggregated precipitation and potential evapotranspiration. As potential evapotranspiration from definition does not take into account water availability, the projected changes also the estimated changes of SPEI-12 are not under control of water supply that limits changes of actual evapotranspiration. A comparison of changes simulated with help of SPEI-12 and SRI-12 shows the limited water supply reduces increases of evapotranspiration; therefore, decreases of drought severity are projected when SRI-12 is analysed.

5. Discussion and Conclusions

The drought occurrence is influenced by changes in air temperature and precipitation. Those issues motivate further research on understanding and quantifying drought characteristics and the consequences for surface water, river flow, agricultural production, the hydrologic cycle, and ecosystems for the future. The study has provided a discussion on changes in three hydro-meteorological drought indices, SPI-12, SPEI-12 and SRI-12, due to climate change in ten catchments in Poland, in the 21st century. The catchments have different hydro-climate conditions and soil water holding capacity.
The SPI-12 is based on precipitation, the SPEI-12 and SRI-12 follow an approach similar to that of the SPI but the first takes into account losses due to the potential evapotranspiration and the second is based on river discharge. The SRI-12 has the largest potential for identifying hydrological drought in the catchment. However, its projections in future climate conditions are based on hydrological model simulations, which increases the uncertainty of its estimates. In this study we applied the HBV hydrological model to derive future flow projections.
The discussion was conducted in two stages. At first, the differences and similarities between the three drought indices, namely SPI-12, SPEI-12 and SRI-12, (indices with twelve month accumulation period) were assessed using observations of temperature, precipitation and flow from the reference period 1971–2000. At this stage the consistency of the drought indices studied was also tested. A comparison of the temporal patterns of the indices was performed using as an example two geomorphologically different catchments, Biała Tarnowska and Narewka. The indices show consistency in drought assessment but only SRI-12 was able to reproduce the transformation of meteorological drought into hydrological drought. SPI-12 and SPEI-12 give very similar assessments of catchment dryness and/or wetness in both catchments, whilst the SRI-12 results depend on the catchment. In Narewka (a lowland catchment) the SRI-12 shows a more pronounced drought than the two other indices, whilst for Biała Tarnowska (a mountainous catchment) the simulations of all three indices are similar. Narewka has a larger water storage capacity than Biała Tarnowska, which results in differences in the SRI-12 estimates. The spatial characteristics of the indices for the ten catchments were studied using the Pearson correlation coefficient (Table 4, Table 5 and Table 6). The highest correlation coefficient was obtained for the neighbouring catchments for all the indices. However SRI-12 showed a higher correlation than the other indices for the lowland catchments, probably due to their larger water storage capacity and the ability for snow accumulation to be taken into account. The sensitivity of the indices to changes in precipitation and flow was also tested. Following their definitions, SPI-12 is most strongly correlated with precipitation and SRI-12 with flow. However, there is also a statistically significant correlation of SPI-12 with flow and SRI-12 with precipitation, but its strength depends on the catchment. SPEI-12 depends strongly on precipitation and to lesser degree on flow, with large differences between catchments. Both SPI-12 and SPEI-12 show better correlation with flow for the mountainous rather than lowland catchments.
In the second stage, projections into the 21st century for two time periods, the near-future (2021–2050), and the far-future (2071–2100) were assessed. Climatic variables (daily sums of precipitation and mean daily air temperatures) were obtained from the EURO-CORDEX project from seven different climate models: CNRM-CM5-CCLM4-8-17, EC-EARTH-CCLM4-8-17, EC-EARTH-HIRHAM5,EC-EARTH-RACMO22E,EC-EARTH-RCA4,MPI-ESM-LR-CCLM4-8-17 and MPI-ESM-LR RCA4CNRM-CERFACS-CNRM-CM5-CCLM4-8-17, EC-EARTH-CCLM4-8-17, EC-EARTH-HIRHAM5, EC-EARTH-RACMO22E, EC-EARTH-RCA4, MPI-ESM-LR-CCLM4-8-17 and MPI-ESM-LR-RCA4, with a resolution of 12.5 km. A bias correction of EURO-CORDEX simulations was performed using the quantile mapping (QM) approach.
The consistency of the bias-corrected seven climate model projections, the estimated catchment discharge using the HBV model and the observed precipitation and flow values, was tested for the reference period. The results indicate that there are some differences between mean values of climate model simulations and observations. The results of simulations of mean annual flow indicate that the median value is underestimated for almost all climate models. Also the variability of sum/mean annual hydro-climatic variables in the period 1971–2000 shows differences between climate models.
The changes of projected temperature and precipitation into the near- and far-future were analysed. There is a visible increase in the temperatures in the two future time periods and evidence of an increase of precipitation in both future periods against the reference period. In particular, the results indicate increases of air temperature (from 1.3 to almost 3 °C) for the far-future. The difference in mean annual air temperature between near future and reference periods is smaller and ranges from 0.5 to slightly above 1.5 °C. The results indicate that there are differences in the magnitude of changes between catchments, climate models and two future periods. The largest changes estimated using the median from the ensemble of climate models are projected for Myśla, Narewka and Guber catchments located in northern Poland.
The relative differences in the mean annual sum of precipitation between the near-future and reference periods vary from 0 to 17% whilst for the far-future, the differences range from 2% to slightly above 20%. There is a significant variability of the projected changes between climate models and catchments. A comparison of projected relative changes between catchments for the far-future with reference to 1971–2000 periods indicates higher changes in lowland catchments and smaller changes in those located in a mountainous area.
A comparison of the changes of the SPI-12, SPEI-12 and SRI-12 projections into the near-future (2021–2050) and the far-future (2071–2100) relative to the reference period (1971–2000), was carried out using the statistical assessment of changes in median condition, probability of drought recurrence and drought severity.
The changes of median values of the SPI-12 in the near-future and far-future periods in comparison with the reference period show positive values, indicating wetter conditions in all catchments. In contrast, the SPEI-12 changes are negative, indicating drier future conditions in the catchments. The SRI-12 projections follow the SPI-12 patterns, indicating wetter catchment conditions.
The probabilities of drought for three periods: the reference, near-future and far-future for ten catchments were evaluated for four classes of dryness. The results for two future periods were compared with the reference period (1971–2000). SPI-12 and SRI-12 show a decrease of probability of drought ocurrence from the reference period to the future, but these estimates differ between the catchments. The opposite findings were achieved for the SPEI-12 where the probability of drought ocurrence is increasing with time in nearly all catchments.
Changes in drought severity are similar to the previous measures. The SPI-12 and SRI-12 show a decrease in drought severity in all catchments in the near- and far-future periods. However, SPEI-12 shows an increase of drought severity in both future periods for all catchments studied.
In summary, our results show that taking only precipitation into account (SPI-12), the wetter conditions are projected to prevail in the future in the catchments. However, when potential evapotranspiration is taken into account (SPEI-12), the situation is reversed and drier conditions are projected. The SRI-12 seems to follow the SPI-12 patterns, but it has a potential to take into account the catchment response to climatic forcing. Its projections are bounded by physical conditions in the catchment, i.e. water availability, whereas losses projected by SPEI-12 have no physical limits as potential evapotranspiration is taken into account instead of actual evapotranspiration.
The analysis presented included the variability of future climate projections in the form of an ensemble of seven GCM/RCMs but did not take into account the uncertainty related to future climate scenarios, climate model simplifications, and hydrological model uncertainty. Work on these issues is the subject of our future research.
Acknowledgements

This work was supported by the project CHIHE (Climate Change Impact on Hydrological Extremes), carried out in the Institute of Geophysics Polish Academy of Sciences, funded by Norway Grants (contract No. Pol-Nor/196243/80/2013). The hydro-meteorological data were provided by the Institute of Meteorology and Water Management (IMGW), Poland.

Author Contributions

H.M. and M.O. designed and performed numerical analyses. R.R. supervised the work. All authors participated in interpretation of the results and paper writing.

Conflicts of Interest

The authors declare no conflict of interest.

References

  1. Hansen, J.; Sato, M.; Ruedy, R.; Lo, K.; Lea, D.W.; Medina-Elizade, M. Global temperature and precipitation change. Proc. Natl. Acad. Sci. 2006, 103, 14288–14293. [Google Scholar] [CrossRef] [PubMed]
  2. Jones, P.; Moberg, A. Hemispheric and large-scale surface air temperature variations: an extensive revision and an update to 2001. J. Clim. 2003, 16, 206–223. [Google Scholar] [CrossRef]
  3. IPCC. Climate Change 2007: Synthesis Report; Contribution of Working Groups I, II and III to the Fourth Assessment Report of the Intergovernmental Panel on Climate Change; IPCC: Geneva, Switzerland, 2007; p. 104. [Google Scholar]
  4. Karl, T.R.; Melillo, J.M.; Peterson, T.C. Global Climate Change Impacts in the United States: A State of Knowledge Report from the U.S. Global Change Research Program; Cambridge University Press: New York, NY, USA, 2009; pp. 41–73. [Google Scholar]
  5. Sheffield, J.; Wood, E.F. Global trends and variability in soil moisture and drought characteristics, 1950–2000, from observation-driven simulations of the terrestrial hydrologic cycle. J. Clim. 2008, 21, 432–458. [Google Scholar] [CrossRef]
  6. Adams, R.M.; Peck, D.E. 2008: Effects of Climate Change on Drought Frequency: Impacts and Mitigation Opportunities. In Mountains, Valleys, and Flood Plains: Managing Water Resources in a Time of Climate Change; Dinar, A., Garrido, A., Eds.; Routledge Publishing: Orlando, FL, USA, 2008; pp. 117–130. [Google Scholar]
  7. Cutter, S.L.; Burton, C.G.; Emrich, C.T. Disaster resilience indicators for benchmarking baseline conditions. JHSEM 2010, 7, 1–24. [Google Scholar] [CrossRef]
  8. Zhang, J. Using hydrologic simulation to explore the impacts of climate change on runoff in the Huaihe River Basin of China. J. Hydrol. Eng. 2012, 11, 1393–1399. [Google Scholar] [CrossRef]
  9. Wilhite, D.A.; Hayes, M.J.; Knutson, C.; Smith, K.H. Planning for drought: Moving from crisis to risk management. J. Am. Water Resour. Assoc. 2000, 36, 697–710. [Google Scholar] [CrossRef]
  10. Giorgi, F.; Bi, X. Updated regional precipitation and temperature changes for the 21st century from ensembles of recent AOGCM simulations. Geophys. Res. Lett. 2005, 32, L21715. [Google Scholar] [CrossRef]
  11. Brohan, P.; Kennedy, J.J.; Haris, I.; Tett, S.F.B.; Jones, P.D. Uncertainty estimates in regional and global observed temperature changes: A new dataset from 1850. J. Geophys. Res. 2006, 117, D15. [Google Scholar] [CrossRef]
  12. Wilhite, D.A.; Glantz, M.H. Understanding the Drought Phenomenon: The Role of Definitions. Water Int. 1985, 10, 111–120. [Google Scholar] [CrossRef]
  13. Wilhite, D.A. The enigma of drought. In Drought Assessment, Management, and Planning: Theory and Case Studies; Wilhite, D.A., Ed.; Kluwer Academic: Boston, MA, USA, 1993; pp. 3–15. [Google Scholar]
  14. Dai, A. Drought under global warming: A review. Wiley Interdiscip. Rev. Clim. Chang. 2011, 2, 45–65. [Google Scholar] [CrossRef]
  15. Trenberth, K.E.; Dai, A.; van der Schrier, G.; Jones, P.D.; Barichivich, J.; Briffa, K.R.; Sheffield, J. Global warming and changes in drought. Nat. Clim. Chang. 2013, 4, 17–22. [Google Scholar] [CrossRef]
  16. Glickman, T.S. Glossary of Meteorology; American Meteorological Society: Boston, MA, USA, 2000; p. 855. [Google Scholar]
  17. Lehner, B.; Doell, P.; Alcamo, J. Estimating the impact of global change on flood and drought risks in Europe: A continental, integrated assesment. Clim. Chang. 2006, 75, 273–299. [Google Scholar] [CrossRef]
  18. Feyen, L.; Dankers, R. Impact of global warming on streamflow drought in Europe. J. Geophys. Res. 2009, 114, D17209. [Google Scholar] [CrossRef]
  19. Labedzki, L. Estimation of local drought frequency in central Poland using the standardized precipitation index SPI. Irrig. Drain. 2007, 56, 6777. [Google Scholar] [CrossRef]
  20. Tokarczyk, T.; Szalińska, W. Combined analysis of precipitation and water deficit for drought hazard assessment. Hydrol. Sci. J. 2014, 59, 1675–1689. [Google Scholar] [CrossRef]
  21. Labedzki, L.; Bak, B. Meteorological and agricultural drought indices used in drought monitoring in Poland. Meteorol. Hydrol. Water Manag. 2014, 2, 3–13. [Google Scholar]
  22. Pianko-Kluczynska, K. The relationship between the state of the stratosphere and the occurrence of meteorological drought in Poland. Meteorol. Z. 2013, 22, 561–567. [Google Scholar] [CrossRef]
  23. Radzka, E. The assessment of atmospheric drought during vegetation season (according to standardized precipitation index SPI) in central-eastern Poland. J. Ecol. Eng. 2015, 16, 87–91. [Google Scholar] [CrossRef]
  24. Szwed, M.; Karg, G.; Pinskwar, I.; Radziejewski, M.; Graczyk, D.; Kedziora, A.; Kundzewicz, Z.W. Climate change and its effect on agriculture, water resources and human health sectors in Poland. Nat. Hazards Earth Syst. Sci. 2010, 10, 1725–1737. [Google Scholar] [CrossRef]
  25. Osuch, M.; Romanowicz, R.J.; Lawrence, D.; Wong, W.K. Assessment of the influence of bias correction on meteorological drought projections for Poland. Hydrol. Earth Syst. Sci. Discuss. 2015, 12, 10331–10377. [Google Scholar] [CrossRef]
  26. Shukla, S.; Wood, A.W. Use of a standardized runoff index for characterizing hydrologic drought. Geophys. Res. Lett. 2008, 35, L02405. [Google Scholar] [CrossRef]
  27. Taylor, I.H.; Burke, E.; McColl, L.; Falloon, P.D.; Harris, G.R.; McNeall, D. The impact of climate mitigation on projections of future drought. Hydrol. Earth Syst. Sci. 2013, 17, 2339–2358. [Google Scholar] [CrossRef]
  28. Zhai, J.; Su, B.; Krysanova, V.; Vetter, T.; Gao, C.; Jiang, T. Spatial variation and trends in PDSI and SPI indices and their relation to streamflow in 10 large regions of China. J. Clim. 2010, 23, 649–663. [Google Scholar] [CrossRef]
  29. Qian, W.H.; Shan, X.L.; Zhu, Y.F. Ranking regional drought events in China for 1960–2009. Adv. Atmos. Sci. 2011, 28, 310–321. [Google Scholar] [CrossRef]
  30. Biernacik, D.; Brzóska, B.; Czernecki, B.; Curyłło, A.; Farat, R.; Filipiak, J.; Jaczewski, A.; Jakusik, E.; Kamińska, M.; Kańska, A.; et al. Warunki Klimatyczne i Oceanograficzne w Polsce i na Bałtyku Południowym-Spodziewane Zmiany i Wytyczne do Opracowania Strategii Adaptacyjnych w Gospodarce Krajowej; Wibig, J., Jakusik, E., Eds.; Instytut Meteorologii i Gospodarki Wodnej-Państwowy Instytut Badawczy: Warsaw, Poland, 2012; p. 283. [Google Scholar]
  31. CORINE Land Cover. European Environment Agency. Land Cover and Land Use Database. Available online: http://reports.eea.europa.eu/CORO-landcover/en (accessed on 13 May 2014).
  32. Jacob, D.; Petersen, J.; Eggert, B.; Alias, A.; Christensen, O.B.; Bouwer, L.M.; Braun, A.; Colette, A.; Deque, M.; Georgievski, G.; et al. EURO-CORDEX: New high-resolution climate change projections for European impact research. Reg. Environ. Chang. 2014, 14, 563–578. [Google Scholar] [CrossRef]
  33. Kotlarski, S.; Keuler, K.; Christensen, O.B.; Colette, A.; Deque, M.; Gobiet, A.; Goergen, K.; Jacob, D.; Luthi, D.; van Meijgaard, E.; et al. Regional climate modelling on European scales: a joint standard evaluation of the EURO-CORDEX RCM ensemble. Geosci. Model Dev. 2014, 7, 1297–1333. [Google Scholar] [CrossRef]
  34. Moss, R.H.; Edmonds, J.A.; Hibbard, K.A.; Manning, M.R.; Rose, S.K.; van Vuuren, D.P.; Carter, T.R.; Emori, S.; Kainume, M.; Kram, T.; et al. The next generation of scenarios for climate change research and assessment. Nature 2010, 463, 747–756. [Google Scholar] [CrossRef] [PubMed]
  35. Clarke, L.; Edmonds, J.; Jacoby, H.; Pitcher, H.; Reilly, J.; Richels, R. Scenarios of Greenhouse Gas Emissions and Atmospheric Concentrations; Sub-Report 2.1A of Synthesis and Assessment Product 2.1 by the U.S. Climate Change Science Program and the Subcommittee on Global Change Research; Department of Energy, Office of Biological & Environmental Research: Washington, DC, USA, 2007; p. 154. [Google Scholar]
  36. Cloke, H.; Wetterhall, F.; He, Y.; Freer, J.E.; Pappenberg, F. Modelling climate impact on floods with ensemble climate projections. Q. J. R. Meteorol. Soc. 2013, 671, 282–297. [Google Scholar] [CrossRef]
  37. Lafon, T.; Dadson, S.; Buys, G.; Prudhomme, C. Bias correction of daily precipitation simulated by a regional climate model: a comparison of methods. Int. J. Climatol. 2013, 33, 1367–1381. [Google Scholar] [CrossRef] [Green Version]
  38. Li, C.; Sinha, E.; Horton, D.E.; Diffenbaugh, N.S.; Michalak, A.M. Joint bias correction of temperature and precipitation in climate model simulations. J. Geophys. Res. Atmos. 2014, 119. [Google Scholar] [CrossRef]
  39. Teng, J.; Potter, N.; Chiew, S.; Zhang, L.; Wang, B.; Vaze, J.; Evans, P. How does bias correction of regional climate model precipitation affect modelled runoff? Hydrol. Earth Syst. Sci. 2014, 19, 711–728. [Google Scholar] [CrossRef]
  40. Piani, C.; Haerter, J.O.; Coppola, E. Statistical bias correction for daily precipitation in regional climate models over Europe. Theor. Appl. Climatol. 2010, 99, 187–192. [Google Scholar] [CrossRef]
  41. Gudmundsson, L.; Bremnes, J.B.; Haugen, J.E.; Engen-Skaugen, T. Technical Note: Downscaling RCM precipitation to the station scale using statistical transformations-a comparison of methods. Hydrol. Earth Syst. Sci. 2012, 16, 3383–3390. [Google Scholar] [CrossRef]
  42. Sunyer, M.A.; Hundecha, Y.; Lawrence, D.; Madsen, H.; Willems, P.; Martinkova, M.; Vormoor, K.; Bürger, G.; Hanel, M.; Kriaučiuniene, J.; et al. Inter-comparison of statistical downscaling methods for projection of extreme precipitation in Europe. Hydrol. Earth Syst. Sci. 2015, 19, 1827–1847. [Google Scholar] [CrossRef] [Green Version]
  43. Willems, P.; Olsson, J.; Arnbjerg-Nielsen, K.; Beecham, S.; Pathirana, A.; Bulow Gregersen, I.; Madsen, H.; Nguyen, V.T.V. Impacts of Climate Change on Rainfall Extremes and Urban Drainage Systems; International Water Association: London, UK; New York, NY, USA, 2012; p. 90. [Google Scholar]
  44. Romanowicz, R.J.; Bogdanowicz, E.; Debele, S.E.; Doroszkiewicz, J.; Hisdal, H.; Lawrence, D.; Meresa, H.K.; Napiorkowski, J.J.; Osuch, M.; Strupczewski, W.G.; et al. Climate Change Impact on Hydrological Extremes: Preliminary Results from the Polish-Norwegian Project. Acta Geophys. 2016, 64, 477–509. [Google Scholar] [CrossRef]
  45. Núñez, J.; Rivera, D.; Oyarzún, R.; Arumí, J.L. On the use of Standardized Drought Indices under decadal climate variability: Critical assessment and drought policy implications. J. Hydrol. 2014, 517, 458–480. [Google Scholar] [CrossRef]
  46. McKee, T.B.; Doesken, N.J.; Kleist, J. The relationship of drought frequency and duration to time scales. In Proceedings of the 8th Conference on Applied Climatology; AMS: Boston, MA, USA, 1993; pp. 179–184. [Google Scholar]
  47. McKee, T.B.; Doesken, N.J.; Kleist, J. 1995: Drought monitoring with multiple time scales. In Proceedings of the 9th Conference on Applied Climatology; AMS: Boston, MA, USA, 1995; pp. 233–236. [Google Scholar]
  48. Vicente-Serrano, S.M.; Beguería, S.; López-Moreno, J.I. A Multiscalar Drought Index Sensitive to Global Warming: The Standardized Precipitation Evapotranspiration Index. J. Clim. 2010, 23, 1696–1718. [Google Scholar] [CrossRef] [Green Version]
  49. Stagge, J.H.; Tallaksen, L.M.; Gudmundsson, L.; Van Loon, A.F.; Stahl, K. Candidate Distributions for Climatological Drought Indices (SPI and SPEI). Int. J. Climatol. 2015, 35, 4027–4040. [Google Scholar] [CrossRef]
  50. Romanowicz, R.J.; Osuch, M.; Grabowiecka, M. On the choice of calibration periods and objective functions: A practical guide to model parameter identification. Acta Geophys. 2013, 61, 1477–1503. [Google Scholar] [CrossRef]
  51. Osuch, M.; Romanowicz, R.J.; Booij, M.J. The influence of parametric uncertainty on the relationships between HBV model parameters and climatic characteristics. Hydrolog. Sci. J. 2015, 60, 1299–1316. [Google Scholar] [CrossRef]
  52. Nash, J.E.; Sutcliffe, J.V. River flow forecasting through conceptual models. Part I—A discussion of principles. J. Hydrol. 1970, 10, 282–290. [Google Scholar] [CrossRef]
Figure 1. The location of the selected catchments in Poland.
Water 08 00206 g001
Figure 2. Comparison of the SPI-12, SPEI-12 and SRI-12 time series derived for Biała Tarnowska (a,c,e) and Narewka (b,d,f) catchments in the 1971–2000 period. The blue and red colours denote conditions, respectively, wetter or than a median from the 1971–2000 period.
Water 08 00206 g002
Figure 3. Scatterplots showing dependency between accumulated annual precipitation (a), mean annual daily flow (b) and three studied drought indices (SPI-12, SPEI-12 and SRI-12) for ten catchments.
Water 08 00206 g003
Figure 4. Comparison of simulated (seven climate models denoted as m1, m2, m3, m4, m5 m6 and m7) and observed (obs) annual sums of precipitation (a), annual mean air temperature (b) and annual mean flow (c). In each box, the central red mark denotes a median from seven climate model simulations, the edges of the box are the 25th and 75th percentiles, the whiskers extend to the most extreme data points not considered as outliers, and outliers are plotted individually in the form of red crosses; Biała Tarnowska-panels on the left, Narewka-panels on the right.
Water 08 00206 g004
Figure 5. Estimated absolute changes in mean annual air temperature (°C) (b) and relative changes in mean annual sum of precipitation (%) (a) between two future periods (2021–2050 and 2071–2100) and reference period for seven climate models and ten catchments.
Water 08 00206 g005
Figure 6. A comparison of the absolute changes of the SPI-12 (a); SPEI-12 (b) and SRI-12 (c) in the median dryness/wetness conditions between two future periods and reference period. In each box, the central red mark denotes a median from seven climate model simulations, the edges of the box are the 25th and 75th percentiles, the whiskers extend to the most extreme data points not considered as outliers, and outliers are plotted individually in the form of red crosses; the x-axis presents the list of ten Polish catchments.
Water 08 00206 g006
Figure 7. A comparison of the probability of drought ocurrence calculated using SPI-12 (ac), SPEI-12 (df) and SRI-12 (gi), in ten Polish catchments, in three periods: ref (1971–2000)—a,c,g; clim1 (2021–2050)—b,e,h; and clim2 (2071–2100)—c,f,i.
Water 08 00206 g007
Figure 8. A comparison of the relative changes in the drought severity (%) between two future periods and a reference period. In each box, the central red mark denotes a median from seven climate model simulations, the edges of the box are the 25th and 75th percentiles, the whiskers extend to the most extreme data points not considered as outliers, and outliers are plotted individually in the form of red crosses.
Water 08 00206 g008
Table 1. List of catchments and their characteristics.
CatchmentGauging StationFlood RegimeArea (km2)Mean Elevation (m a.s.l.)Forest (%)Agricul. (%)Artificial (%)Other (%)
Nysa KłodzkaKłodzkomixed1062844672940
OleśnicaNiechmirówsnow melt5842044644100
FlintaRyczywółsnow melt813125792010
MyślaMyślibórzsnow melt58789593551
WisłaSkoczówmixed297741632881
DunajecNowy Targrainfall6811320385552
Biała TarnowskaKoszyce Wielkiemixed967561435160
NarewkaNarewkasnow melt63517391900
ŁasicaWładysławówsnow melt62994623170
GuberProsnasnow melt1555125543268
Table 2. A list of applied climate models.
RCM →RCA4HIRHAM5CCLM4-8-17RACMO22E
GCM
EC-EARTH
MPI-ESM-LR
CNRM-CM5
Table 3. Classification of drought according to the SPI, SPEI and SRI values.
CategoryIndex Value
wet condition≥0
Mild drought−0.99 to 0
Moderate drought−1.49 to −1.00
Severe drought−1.99 to −1.50
Extreme drought≤−2.00
Table 4. Pearson correlation coefficient between SPI-12 in 1971-2000 estimated for ten studied catchments.
SPI-12DunajecWisłaBiałaNysaOleśnicaŁasicaNarewkaFlintaMyślaGuber
Dunajec1.000.650.880.500.690.610.460.300.290.59
Wisła0.651.000.590.740.770.740.310.420.330.55
Biała0.880.591.000.350.600.540.450.160.200.57
Nysa0.500.740.351.000.720.580.210.540.480.40
Oleśnica0.690.770.600.721.000.760.390.580.470.67
Łasica0.610.740.540.580.761.000.550.560.530.79
Narewka0.460.310.450.210.390.551,000.430.370.57
Flinta0.300.420.160.540.580.560.431.000.800.39
Myśla0.290.330.200.480.470.530.370.801.000.46
Guber0.590.550.570.400.670.790.570.390.461.00
Table 5. Pearson correlation coefficient between SPEI-12 in 1971-2000 estimated for ten studied catchments.
SPEI-12DunajecWisłaBiałaNysaOleśnicaŁasicaNarewkaFlintaMyślaGuber
Dunajec1.000.670.900.560.720.640.500.350.350.64
Wisła0.671.000.630.740.790.750.340.460.390.61
Biała0.900.631.000.430.660.580.480.250.280.63
Nysa0.560.740.431.000.760.660.370.620.590.52
Oleśnica0.720.790.660.761.000.820.530.640.590.75
Łasica0.640.750.580.660.821.000.630.670.660.84
Narewka0.500.340.480.370.530.631.000.570.530.63
Flinta0.350.460.250.620.640.670.571.000.850.48
Myśla0.350.390.280.590.590.660.530.851.000.57
Guber0.640.610.630.520.750.840.630.480.571.00
Table 6. Pearson correlation coefficient between SRI-12 in 1971-2000 estimated for ten studied catchments.
SRI-12DunajecWisłaBiałaNysaOleśnicaŁasicaNarewkaFlintaMyślaGuber
Dunajec1.000.660.770.360.350.290.350.210.050.22
Wisła0.661.000.580.720.680.480.350.510.290.38
Biała0.770.581.000.360.540.380.360.330.190.39
Nysa0.360.720.361.000.60.40.260.590.420.34
Oleśnica0.350.680.540.61.000.810.590.670.580.64
Łasica0.290.480.380.40.811.000.690.520.560.6
Narewka0.350.350.360.260.590.691.000.650.620.69
Flinta0.210.510.330.590.670.520.651.000.850.66
Myśla0.050.290.190.420.580.560.620.851.000.72
Guber0.220.380.390.340.640.60.690.660.721.00
Table 7. Person correlation coefficients between three drought indices (SPI-12, SPEI-12 and SRI-12) and observed annual sums of precipitation and mean annual daily flow in the 1971–2000 period for ten catchments studied.
PrecipitationFlow
SPI-12SPEI-12SRI-12SPI-12SPEI-12SRI-12
Dunajec0.99820.98090.71190.70850.70960.9977
Upper Wisła0.99830.96810.82580.82920.84430.9938
Biała Tarnowska0.99800.97090.76460.76660.72010.9929
Nysa Kłodzka0.99810.95070.76430.76890.76110.9946
Oleśnica0.99540.95090.77010.74820.69620.9818
Łasica0.99770.92700.58420.55950.59490.9913
Narewka0.99750.91870.61790.61490.63080.9898
Flinta0.99700.94650.66410.63970.64730.9823
Myśla0.99790.92820.52570.49660.52070.9891
Guber0.99710.94740.40790.41740.38170.9861
Table 8. A comparison of the median probability of recurrence of five types of dryness conditions estimated using the SPI-12, SPEI-12 and SRI-12 in the reference (Ref) and two future periods (clim1 and clim2).
refclim1clim2
Wet conditionsSPI-120.3970.540.588
SPEI-120.5460.5040.408
SRI-120.4550.5420.550
Mild droughtSPI-120.3890.310.296
SPEI-120.3380.3000.316
SRI-120.3510.3100.309
Moderate droughtSPI-120.1160.0830.066
SPEI-120.0790.1090.111
SRI-120.1030.0820.076
Severe droughtSPI-120.0660.0370.029
SPEI-120.0240.0500.066
SRI-120.0470.0420.039
Extreme droughtSPI-120.0300.0230.022
SPEI-120.0000.0100.026
SRI-120.0300.0220.020