
Predicting the Hydraulic Conductivity of Metallic Iron Filters: Modeling Gone Astray

Abstract
:1. Introduction
2. The Rate Constant of Iron Corrosion (kiron Value)
2.1. Descriptive Aspects
2.2. Corrosion Rate and Extent of Mass Loss
2.3. Oxide Scale Formation and Its Effects on kiron: Modeling Aspects
3. Metallic Iron for Water Treatment
3.1. Major Characteristics of Fe0 Materials for Water Filters
3.2. Coping with the Singularity of Fe0 Filters
4. Modeling Permeability Loss of Fe0 Filters
4.1. Lessons from Monitored Aquifer Recharge
4.2. Lessons from the Merrill-Crowe Process
4.3. Conventional Approach
4.4. An Alternative Approach
4.4.1. Descriptive Aspects
4.4.2. On the Significance of kiron Values
5. Designing Long-Term, Efficient Fe0 Filters
5.1. The Problem
5.2. Ways to Reliable kiron Values
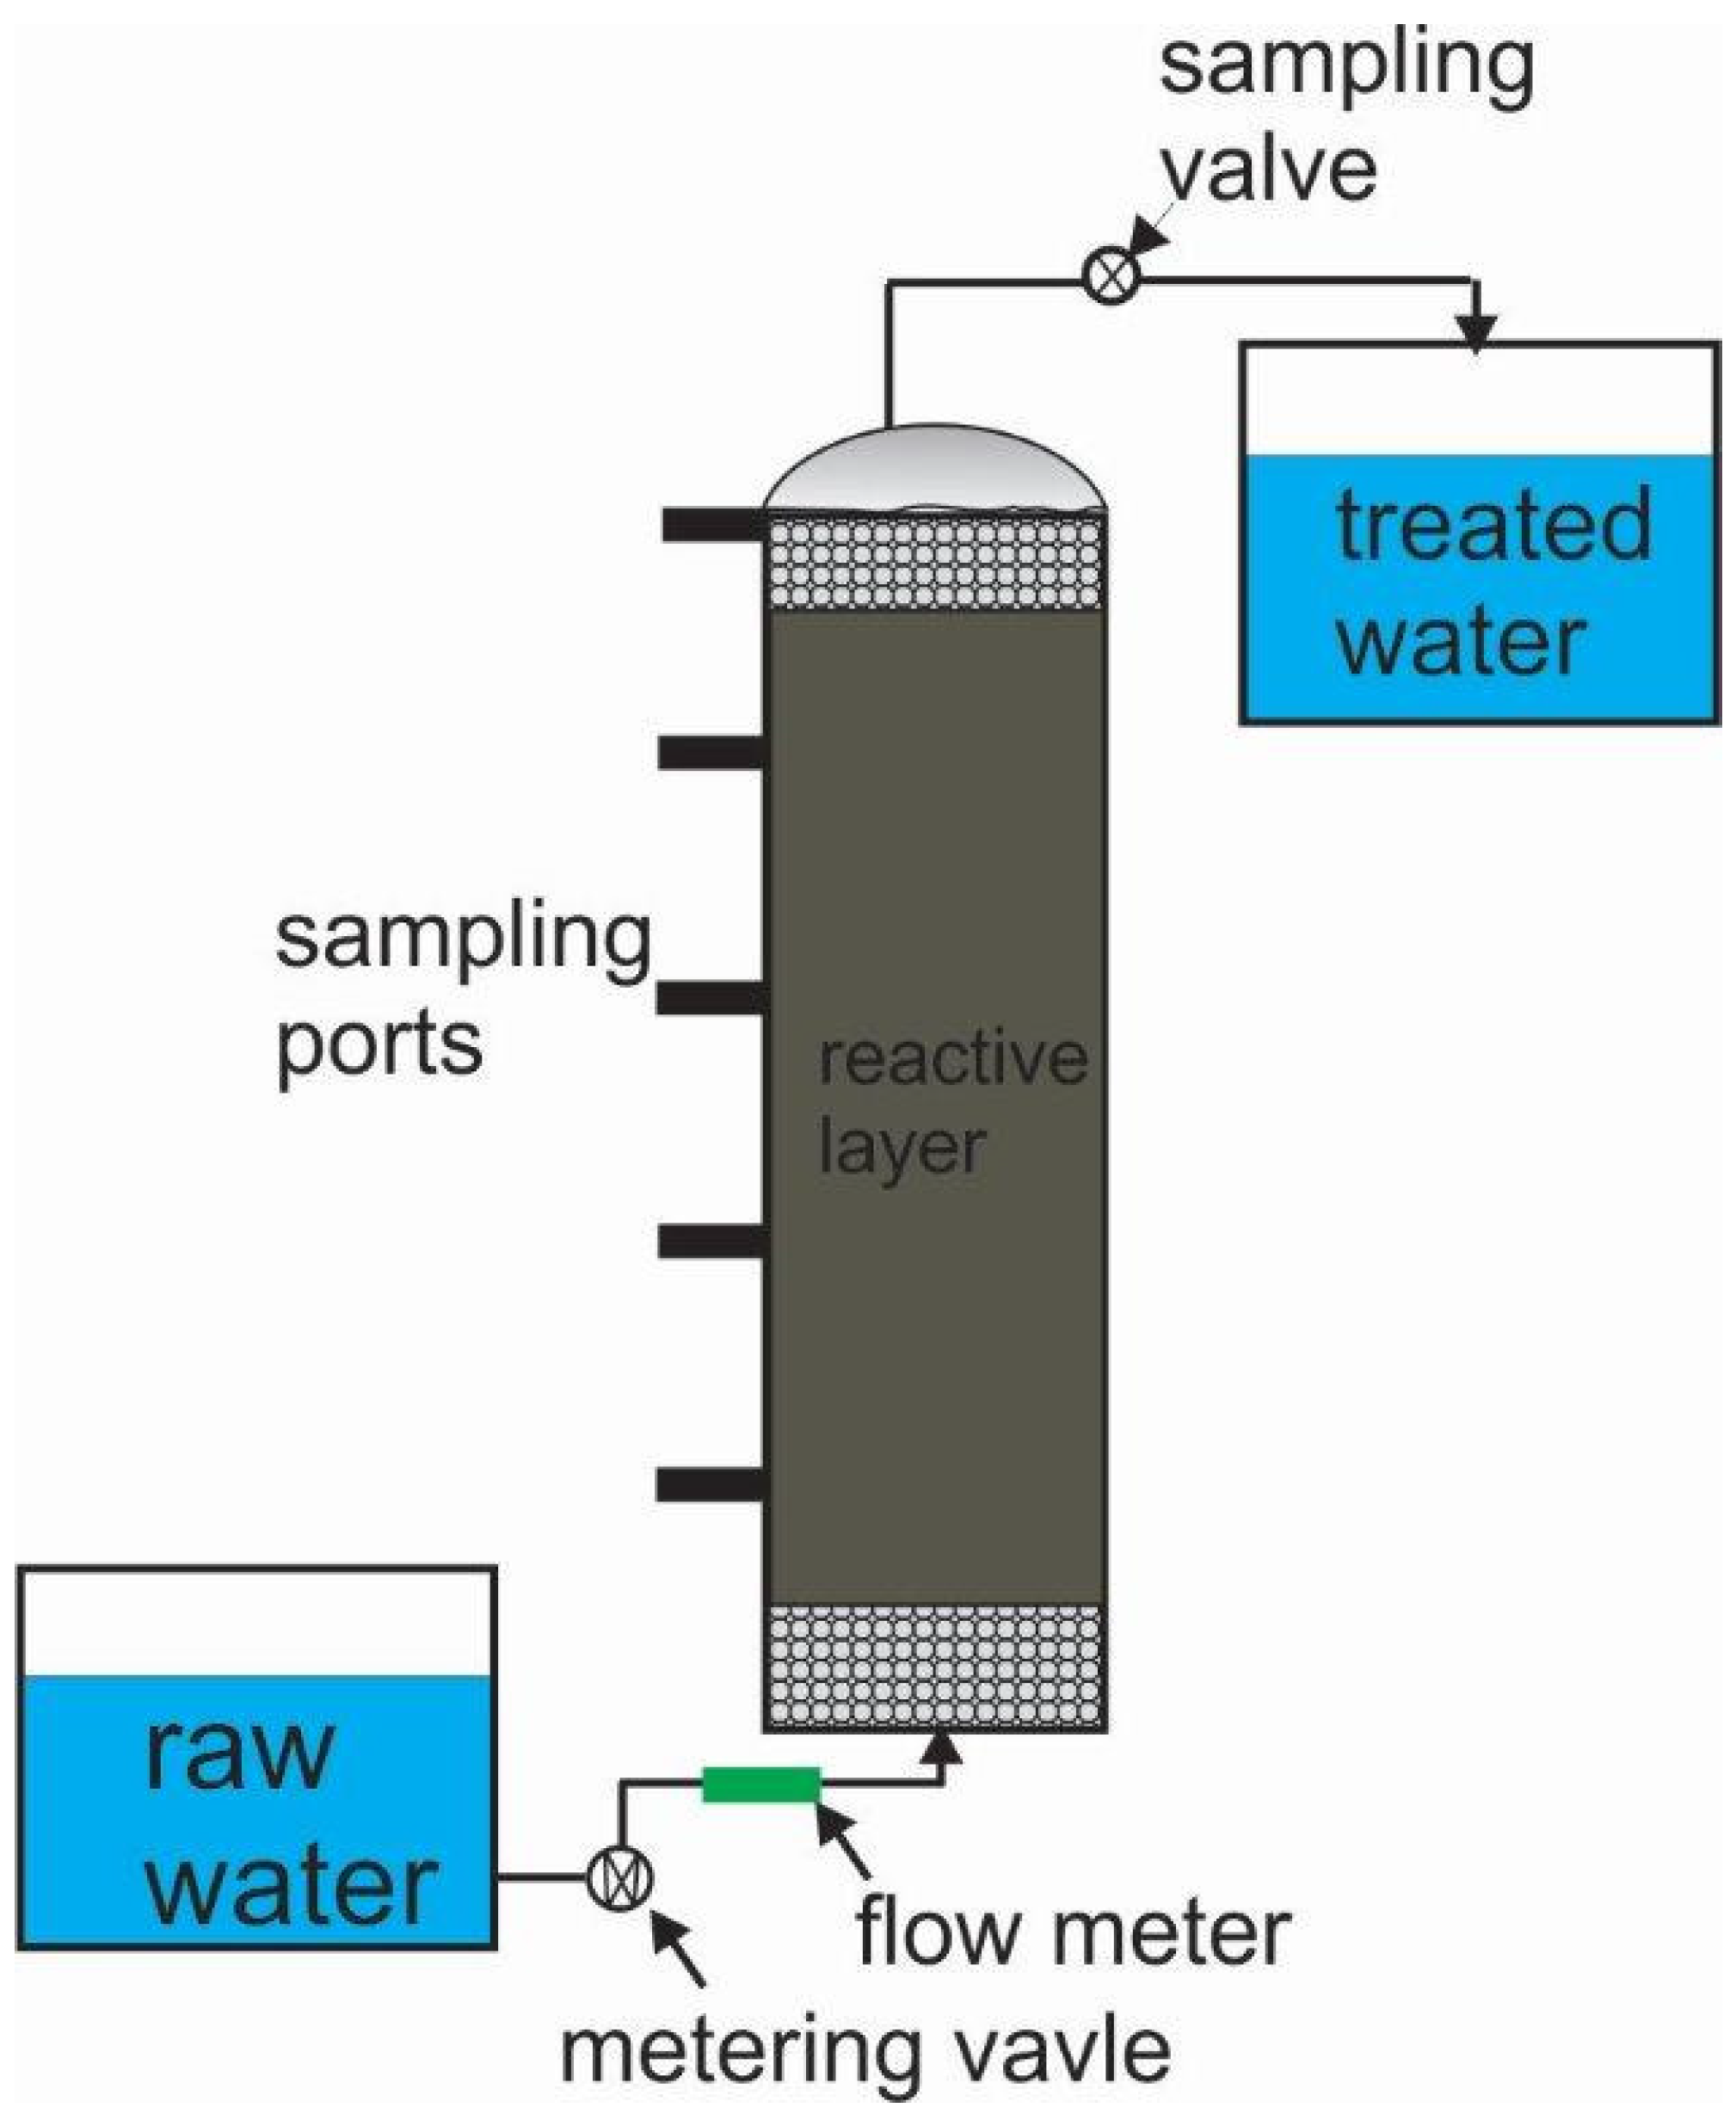
5.2.1. The Sampling-Port Approach
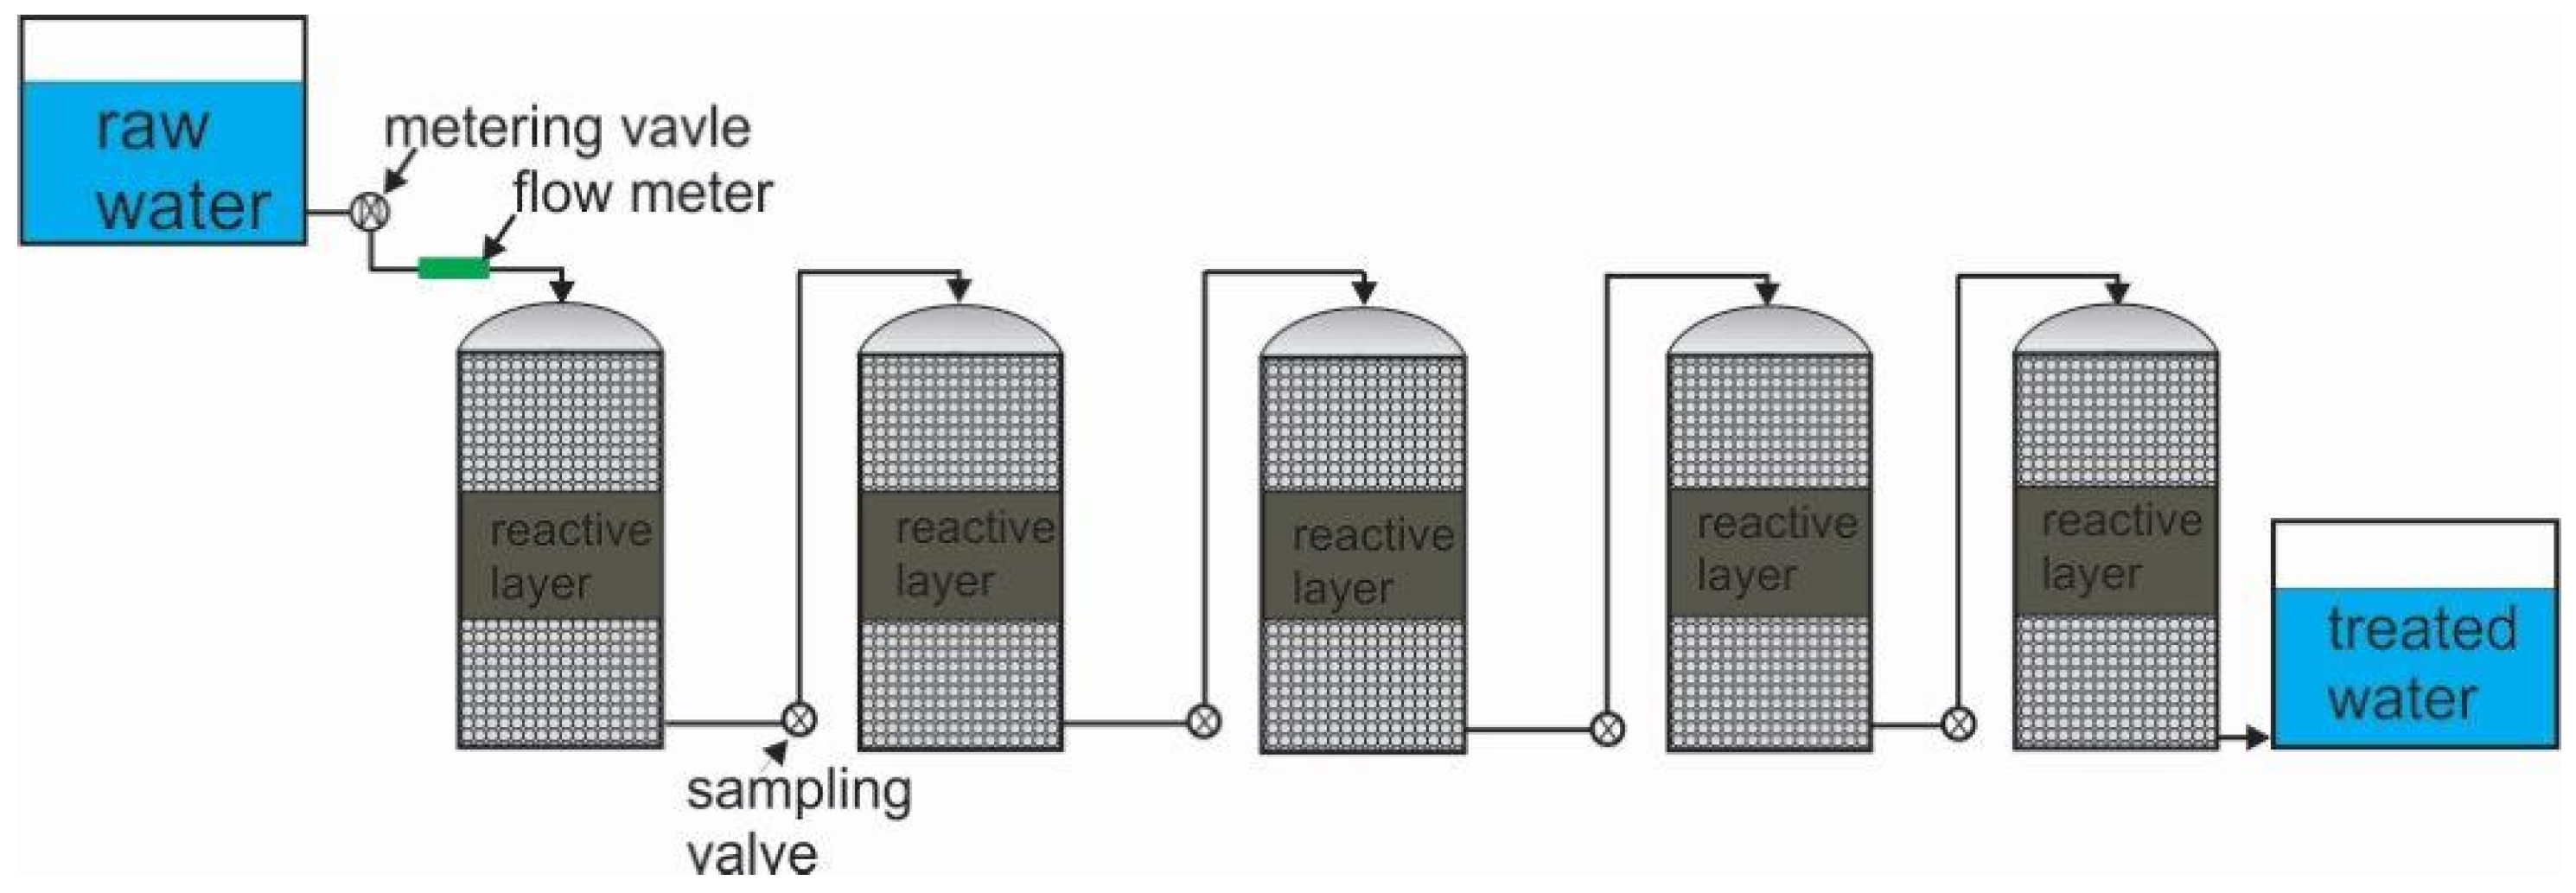
5.2.2. The Column-In-Series Approach
5.3. The Significance of the Short-Term Kinetics of Fe0 Corrosion
6. Discussion
6.1. Contaminant Removal in Fe0/H2O Systems
6.2. The Shortcomings of Current Modeling Efforts
6.3. The True Value of Mathematical Modeling
6.4. Messages to Anonymous Collaborators
7. Concluding Remarks
Acknowledgments
Conflicts of Interest
Abbreviations
| AMD | acid mine drainage |
| ID | internal diameter |
| L | length (of the column) |
| MAR | monitored aquifer recharge |
| RX-CT | X-ray computed tomography |
| SSF | slow sand filter |
References
- Bartzas, G.; Komnitsas, K. Solid phase studies and geochemical modelling of low-cost permeable reactive barriers. J. Hazard. Mater. 2010, 183, 301–308. [Google Scholar] [CrossRef] [PubMed]
- Li, L.; Benson, C.H. Evaluation of five strategies to limit the impact of fouling in permeable reactive barriers. J. Hazard. Mater. 2010, 181, 170–180. [Google Scholar] [CrossRef] [PubMed]
- Obiri-Nyarko, F.; Grajales-Mesa, S.J.; Malina, G. An overview of permeable reactive barriers for in situ sustainable groundwater remediation. Chemosphere 2014, 111, 243–259. [Google Scholar] [CrossRef] [PubMed]
- Statham, T.M.; Stark, S.C.; Snape, I.; Stevens, G.W.; Mumford, K.A. A permeable reactive barrier (PRB) media sequence for the remediation of heavy metal and hydrocarbon contaminated water: A field assessment at Casey Station, Antarctica. Chemosphere 2016, 147, 368–375. [Google Scholar] [CrossRef] [PubMed]
- Noubactep, C.; Caré, S. Dimensioning metallic iron beds for efficient contaminant removal. Chem. Eng. J. 2010, 163, 454–460. [Google Scholar] [CrossRef]
- Noubactep, C.; Caré, S. Designing laboratory metallic iron columns for better result comparability. J. Hazard. Mater. 2011, 189, 809–813. [Google Scholar] [CrossRef] [PubMed]
- Caré, S.; Crane, R.; Calabrò, P.S.; Ghauch, A.; Temgoua, E.; Noubactep, C. Modeling the permeability loss of metallic iron water filtration systems. Clear Soil Air Water 2013, 41, 275–282. [Google Scholar] [CrossRef]
- Rahman, M.A.; Karmakar, S.; Salama, H.; Gactha-Bandjun, N.; Btatkeu-K., B.D.; Noubactep, C. Optimising the design of Fe0-based filtration systems for water treatment: The suitability of porous iron composites. J. Appl. Solut. Chem. Model. 2013, 2, 165–177. [Google Scholar]
- Noubactep, C. Flaws in the design of Fe(0)-based filtration systems? Chemosphere 2014, 117, 104–107. [Google Scholar] [CrossRef] [PubMed]
- Ghauch, A. Iron-based metallic systems: An excellent choice for sustainable water treatment. Freib. Online Geosci. 2015, 38, 60. [Google Scholar]
- Noubactep, C. Metallic iron for environmental remediation: A review of reviews. Water Res. 2015, 85, 114–123. [Google Scholar] [CrossRef] [PubMed]
- Noubactep, C. Designing metallic iron packed-beds for water treatment: A critical review. Clean Soil Air Water 2016, 44, 411–421. [Google Scholar] [CrossRef]
- Noubactep, C. Processes of contaminant removal in “Fe0–H2O” systems revisited: The importance of co-precipitation. Open Environ. J. 2007, 1, 9–13. [Google Scholar] [CrossRef]
- Noubactep, C. A critical review on the mechanism of contaminant removal in Fe0–H2O systems. Environ. Technol. 2008, 29, 909–920. [Google Scholar] [CrossRef] [PubMed]
- Noubactep, C. The fundamental mechanism of aqueous contaminant removal by metallic iron. Water SA 2010, 36, 663–670. [Google Scholar] [CrossRef]
- Ulsamer, S. A Model to Characterize the Kinetics of Dechlorination of Tetrachloroethylene and Trichloroethylene by a Zero Valent Iron Permeable Reactive Barrier. Master’s thesis, Worcester Polytechnic Institute, Worcester, UK, 2011. [Google Scholar]
- Jeen, S.-W.; Yang, Y.; Gui, L.; Gillham, R.W. Treatment of trichloroethene and hexavalent chromium by granular iron in the presence of dissolved CaCO3. J. Contam. Hydrol. 2013, 144, 108–121. [Google Scholar] [CrossRef] [PubMed]
- Guan, X.; Sun, Y.; Qin, H.; Li, J.; Lo, I.M.C.; He, D.; Dong, H. The limitations of applying zero-valent iron technology in contaminants sequestration and the corresponding countermeasures: The development in zero-valent iron technology in the last two decades (1994–2014). Water Res. 2015, 75, 224–248. [Google Scholar] [CrossRef] [PubMed]
- Moraci, N.; Ielo, D.; Bilardi, S.; Calabrò, P.S. Modelling long term hydraulic conductivity behaviour of zero valent iron column tests for PRB design. Can. Geotec. J. 2015. [Google Scholar] [CrossRef]
- Tratnyek, P.G. Putting corrosion to use: remediating contaminated groundwater with zero-valent metals. Chem. Ind. 1996, 13, 499–503. [Google Scholar]
- Stratmann, M.; Müller, J. The mechanism of the oxygen reduction on rust-covered metal substrates. Corros. Sci. 1994, 36, 327–359. [Google Scholar] [CrossRef]
- Jiao, Y.; Qiu, C.; Huang, L.; Wu, K.; Ma, H.; Chen, S.; Ma, L.; Wu, L. Reductive dechlorination of carbon tetrachloride by zero-valent iron and related iron corrosion. Appl. Catal. B: Environ. 2009, 91, 434–440. [Google Scholar] [CrossRef]
- Ghauch, A.; Abou Assi, H.; Bdeir, S. Aqueous removal of diclofenac by plated elemental iron: Bimetallic systems. J. Hazard. Mater. 2010, 182, 64–74. [Google Scholar] [CrossRef] [PubMed]
- Ghauch, A.; Abou Assi, H.; Baydoun, H.; Tuqan, A.M.; Bejjani, A. Fe0-based trimetallic systems for the removal of aqueous diclofenac: Mechanism and kinetics. Chem. Eng. J. 2011, 172, 1033–1044. [Google Scholar] [CrossRef]
- Gheju, M. Hexavalent chromium reduction with zero-valent iron (ZVI) in aquatic systems. Water Air Soil Pollut. 2011, 222, 103–148. [Google Scholar] [CrossRef]
- Gheju, M.; Balcu, I. Removal of chromium from Cr(VI) polluted wastewaters by reduction with scrap iron and subsequent precipitation of resulted cations. J. Hazard. Mater. 2011, 196, 131–138. [Google Scholar] [CrossRef] [PubMed]
- Jeen, S.-W.; Gillham, R.W.; Przepiora, A. Predictions of long-term performance of granular iron permeable reactive barriers: Field-scale evaluation. J. Contam. Hydrol. 2011, 123, 50–64. [Google Scholar] [CrossRef] [PubMed]
- Jeen, S.-W.; Amos, R.T.; Blowes, D.W. Modelling gas formation and mineral precipitation in a granular iron column. Environ. Sci. Technol. 2012, 46, 6742–6749. [Google Scholar] [CrossRef] [PubMed]
- Weber, A.; Ruhl, A.S.; Amos, R.A. Investigating dominant processes in ZVI permeable reactive barriers using reactive transport modeling. J. Contam. Hydrol. 2013, 151, 68–82. [Google Scholar] [CrossRef] [PubMed]
- Firdous, R.; Devlin, J.F. BEARKIMPE-2: A VBA Excel program for characterizing granular iron in treatability studies. Computer Geosci. 2014, 63, 54–61. [Google Scholar] [CrossRef]
- Lackovic, J.A.; Nikolaidis, N.P.; Dobbs, G.M. Inorganic arsenic removal by zero-valent iron. Environ. Eng. Sci. 2000, 17, 29–39. [Google Scholar] [CrossRef]
- Gottinger, A.M.; McMartin, D.W.; Wild, D.J.; Moldovan, B. Integration of zero valent iron sand beds into biological treatment systems for uranium removal from drinking water wells in rural Canada. Can. J. Civ. Eng. 2013, 40, 945–950. [Google Scholar] [CrossRef]
- Zhang, Y.; Gillham, R.W. Effects of gas generation and precipitates on performance of Fe0 PRBs. Ground Water 2005, 43, 113–121. [Google Scholar] [CrossRef] [PubMed]
- Luo, P.; Bailey, E.H.; Mooney, S.J. Quantification of changes in zero valent iron morphology using X-ray computed tomography. J. Environ. Sci. 2013, 25, 2344–2351. [Google Scholar] [CrossRef]
- Domga, R.; Togue-Kamga, F.; Noubactep, C.; Tchatchueng, J.B. Discussing porosity loss of Fe0 packed water filters at ground level. Chem. Eng. J. 2015, 263, 127–134. [Google Scholar] [CrossRef]
- Reardon, J.E. Anaerobic corrosion of granular iron: Measurement and interpretation of hydrogen evolution rates. Environ. Sci. Technol. 1995, 29, 2936–2945. [Google Scholar] [CrossRef] [PubMed]
- Reardon, J.E. Zerovalent irons: Styles of corrosion and inorganic control on hydrogen pressure buildup. Environ. Sci. Technol. 2005, 39, 7311–7317. [Google Scholar] [CrossRef] [PubMed]
- Reardon, J.E. Capture and storage of hydrogen gas by zero-valent iron. J. Contam. Hydrol. 2014, 157, 117–124. [Google Scholar] [CrossRef] [PubMed]
- Noubactep, C.; Meinrath, G.; Dietrich, P.; Sauter, M.; Merkel, B. Testing the suitability of zerovalent iron materials for reactive Walls. Environ. Chem. 2005, 2, 71–76. [Google Scholar] [CrossRef]
- Nesic, S. Key issues related to modelling of internal corrosion of oil and gas pipelines-A review. Corros. Sci. 2007, 49, 4308–4338. [Google Scholar] [CrossRef]
- Obuka, N.S.P.; Ikwu, O.N.C.; Chukwumuanya, G.R.O.; Okechukwu, E. Review of corrosion kinetics and thermodynamics of CO2 and H2S corrosion effects and associated prediction/evaluation on oil and gas pipeline system. Int. J. Sci. Technol. Res. 2012, 1, 156–162. [Google Scholar]
- Wang, J.; Farrell, J. Investigating the role of atomic hydrogen on chloroethene reactions with iron using tafel analysis and electrochemical impedance spectroscopy. Environ. Sci. Technol. 2003, 37, 3891–3896. [Google Scholar] [CrossRef] [PubMed]
- Noubactep, C.; Schöner, A.; Sauter, M. Significance of oxide-film in discussing the mechanism of contaminant removal by elemental iron materials. In Photo-Electrochemistry & Photo-Biology for the Sustainability; Bentham Science Publishers: Sharjah, UAE, 2010; pp. 97–122. [Google Scholar]
- Anderko, A.; Young, R.D. Simulation of CO2/H2S corrosion using thermodynamic and electrochemical models. In Proceedings of NACE international Corrosion Annual Conference, San Antonio, TX, USA, 25–30 April 1999.
- Anderson, A.B.; Ray, N.K. Structures and reactions of H3O+, H2O, and OH on an Fe electrode. Potential dependence. J. Phys. Chem. 1982, 86, 488–494. [Google Scholar] [CrossRef]
- Miehr, R.; Tratnyek, G.P.; Bandstra, Z.J.; Scherer, M.M.; Alowitz, J.M.; Bylaska, J. E. Diversity of contaminant reduction reactions by zerovalent iron: Role of the reductate. Environ. Sci. Technol. 2004, 38, 139–147. [Google Scholar] [CrossRef] [PubMed]
- Btatkeu-K., B.D.; Miyajima, K.; Noubactep, C.; Caré, S. Testing the suitability of metallic iron for environmental remediation: Discoloration of methylene blue in column studies. Chem. Eng. J. 2013, 215, 959–968. [Google Scholar] [CrossRef]
- Birke, V.; Schuett, C.; Burmeier, H.; Friedrich, H.-J. Impact of trace elements and impurities in technical zero-valent iron brands on reductive dechlorination of chlorinated ethenes in groundwater. In Permeable Reactive Barrier Sustainable Groundwater Remediation; Naidu, R., Birke, V., Eds.; CRC Press: Boca Raton, FL, USA, 2014; pp. 87–98. [Google Scholar]
- Li, S.; Ding, Y.; Wang, W.; Lei, H. A facile method for determining the Fe(0) content and reactivity of zero valent iron. Anal. Methods 2016, 8, 1239–1248. [Google Scholar] [CrossRef]
- Mohebbi, H.; Li, C.Q. Experimental investigation on corrosion of cast iron pipes. Int. J. Corros. 2011, 2011, 1–17. [Google Scholar] [CrossRef]
- Alamilla, J.L.; Espinosa-Medina, M.A.; Sosa, E. Modelling steel corrosion damage in soil environment. Corros. Sci. 2009, 51, 2628–2638. [Google Scholar] [CrossRef]
- Obanijesu, E.O.; Pareek, V.; Gubner, R.; Tade, M.O. Corrosion education as a tool for the survival of natural gas industry. Nafta 2010, 61, 541–554. [Google Scholar]
- Habashi, F. A short history of hydrometallurgy. Hydrometallurgy 2005, 79, 15–22. [Google Scholar] [CrossRef]
- Nicol, M.J.; Schalch, E.; Balestra, P.; Hegedus, H. A modern study of the kinetics and mechanism of the cementation of gold. J. South African Inst. Min. Met. 1979, 79, 191–198. [Google Scholar]
- Noubactep, C. Elemental metals for environmental remediation: Learning from cementation process. J. Hazard. Mater. 2010, 181, 1170–1174. [Google Scholar] [CrossRef] [PubMed]
- Dillon, P.; Pavelic, P.; Siebenaler, X.; Gerges, N.; Clark, R. Aquifer storage and recovery os stromwater runoff. AWWA J. Water 1997, 24, 7–11. [Google Scholar]
- Rahman, M.A.; Wiegand, B.; Badruzzaman, A.B.M.; Ptak, T. Hydrogeological analysis of Upper Dupitila Aquifer towards the implementation of managed aquifer recharge project in Dhaka City, Bangladesh. Hydrogeol. J. 2013, 21, 1071–1089. [Google Scholar] [CrossRef]
- Holländer, H.M.; Boochs, P.W.; Billib, M.; Panda, S.N. Laboratory experiments to investigate clogging effects in aquifers. Grundwasser 2005, 10, 205–215. (In German) [Google Scholar] [CrossRef]
- Mutschmann, J.; Stimmelmayr, F. Taschenbuch der Wasserversorgung; Springer-Verlag: Stuttgart, Germany, 2007; p. 926. [Google Scholar]
- Caré, S.; Nguyen, Q.T.; L'Hostis, V.; Berthaud, Y. Mechanical properties of the rust layer induced by impressed current method in reinforced mortar. Cement Concrete Res. 2008, 38, 1079–1091. [Google Scholar] [CrossRef]
- Guo, X.; Yang, Z.; Dong, H.; Guan, X.; Ren, Q.; Lv, X.; Jin, X. Simple combination of oxidants with zero-valent-iron (ZVI) achieved very rapid and highly efficient removal of heavy metals from water. Water Res. 2016, 88, 671–680. [Google Scholar] [CrossRef] [PubMed]
- Antia, D.D.J. Sustainable zero-valent metal (ZVM) water treatment associated with diffusion, infiltration, abstraction and recirculation. Sustainability 2010, 2, 2988–3073. [Google Scholar] [CrossRef]
- Ruhl, A.S.; Weber, A.; Jekel, M. Influence of dissolved inorganic carbon and calcium on gas formation and accumulation in iron permeable reactive barriers. J. Contam. Hydrol. 2012, 142, 22–32. [Google Scholar] [CrossRef] [PubMed]
- Taylor, C.D. Atomistic modeling of corrosion events at the interface between a metal and its environment. Int. J. Corros. 2012, 2012, 1–13. [Google Scholar] [CrossRef]
- Zou, J.; Cannon, F.S.; Chen, W.; Dempsey, B.A. Improved removal of arsenic from groundwater using pre-corroded steel and iron tailored granular activated carbon. Water Sci. Technol. 2010, 61, 441–453. [Google Scholar] [CrossRef] [PubMed]
- Bilardi, S.; Calabrò, P.S.; Caré, S.; Moraci, N.; Noubactep, C. Effect of pumice and sand on the sustainability of granular iron beds for the removal of CuII, NiII, and ZnII. Clean Soil Air Water 2013, 41, 835–843. [Google Scholar] [CrossRef]
- Tepong-Tsindé, R.; Phukan, M.; Nassi, A.; Noubactep, C.; Ruppert, H. Validating the efficiency of the MB discoloration method for the characterization of Fe0/H2O systems using accelerated corrosion by chloride ions. Chem. Eng. J. 2015, 279, 353–362. [Google Scholar] [CrossRef]
- Okwi, G.J.; Thomson, N.R.; Gillham, R.W. The impact of permanganate on the ability of granular iron to degrade trichloroethene. Ground Water Monit. Remed. 2005, 25, 123–128. [Google Scholar] [CrossRef]
- Miyajima, K. Optimizing the design of metallic iron filters for water treatment. Freib. Online Geosci. 2012, 32, 60–61. [Google Scholar]
- Miyajima, K.; Noubactep, C. Effects of mixing granular iron with sand on the efficiency of methylene blue discoloration. Chem. Eng. J. 2012, 200, 433–438. [Google Scholar] [CrossRef]
- Btatkeu-K., B.D.; Olvera-Vargas, H.; Tchatchueng, J.B.; Noubactep, C.; Caré, S. Characterizing the impact of MnO2 on the efficiency of Fe0-based filtration systems. Chem. Eng. J. 2014, 250, 416–422. [Google Scholar] [CrossRef]
- Phukan, M. Characterizing the Fe0/sand system by the extent of dye discoloration. Freib. Online Geosci. 2015, 42, 80–86. [Google Scholar]
- Phukan, M.; Noubactep, C.; Licha, T. Characterizing the ion-selective nature of Fe0-based filters using azo dyes. Chem. Eng. J. 2015, 259, 481–491. [Google Scholar] [CrossRef]
- Btatkeu-K., B.D.; Tchatchueng, J.B.; Noubactep, C.; Caré, S. Designing metallic iron based water filters: Light from methylene blue discoloration. J. Environ. Manag. 2016, 166, 567–573. [Google Scholar] [CrossRef] [PubMed]
- Henderson, A.D.; Demond, A.H. Impact of solids formation and gas production on the permeability of ZVI PRBs. J. Environ. Eng. 2011, 137, 689–696. [Google Scholar] [CrossRef]
- Noubactep, C.; Caré, S.; Crane, R.A. Nanoscale metallic iron for environmental remediation: Prospects and limitations. Water Air Soil Pollut. 2012, 223, 1363–1382. [Google Scholar] [CrossRef] [PubMed] [Green Version]
- Tepong-Tsindé, R.; Crane, R.; Noubactep, C.; Nassi, A.; Ruppert, H. Testing metallic iron filtration systems for decentralized water treatment at pilot scale. Water 2015, 7, 868–897. [Google Scholar] [CrossRef]
- Ndé-Tchoupé, A.I.; Crane, R.A.; Mwakabona, H.T.; Noubactep, C.; Njau, K. Technologies for decentralized fluoride removal: Testing metallic iron based filters. Water 2015, 7, 6750–6774. [Google Scholar] [CrossRef]
- Trois, C.; Cibati, A. South African sands as a low cost alternative solution for arsenic removal from industrial effluents in permeable reactive barriers: Column tests. Chem. Eng. J. 2015, 259, 981–989. [Google Scholar] [CrossRef]
- Glinka, N.L. General Chemistry; MIR Moscow: Leningrad, Russia, 1990. (In Russian) [Google Scholar]
- Haig, S.-J. Characterising the Functional Ecology of Slow sand Filters through Environmental Genomics. Ph.D. Thesis, School of Engineering, University of Glasgow, Glasgow, UK, 2014. [Google Scholar]
- Mackenzie, P.D.; Horney, D.P.; Sivavec, T.M. Mineral precipitation and porosity losses in granular iron columns. J. Hazard. Mater. 1999, 68, 1–17. [Google Scholar] [CrossRef]
- Noubactep, C. Relevant reducing agents in remediation Fe0/H2O systems. Clean Soil Air Water 2013, 41, 493–502. [Google Scholar] [CrossRef]
- Kowalski, K.P.; Søgaard, E.G. Implementation of zero-valent iron (ZVI) into drinking water supply-Role of the ZVI and biological processes. Chemosphere 2014, 117, 108–114. [Google Scholar] [CrossRef] [PubMed]
- Bojic, A.; Purenovic, M.; Bojic, D. Removal of chromium(VI) from water by micro-alloyed aluminium based composite in flow conditions. Water SA 2004, 30, 353–359. [Google Scholar] [CrossRef]
- Bojic, A.Lj.; Bojic, D.; Andjelkovic, T. Removal of Cu2+ and Zn2+ from model wastewaters by spontaneous reduction-coagulation process in flow conditions. J. Hazard. Mater. 2009, 168, 813–819. [Google Scholar] [CrossRef] [PubMed]
- Sarr, D. Zero-valent-iron permeable reactive barriers-how long will they last? Remediation 2001, 11, 1–18. [Google Scholar]
- Lee, G.; Rho, S.; Jahng, D. Design considerations for groundwater remediation using reduced metals. Korean J. Chem. Eng. 2004, 21, 621–628. [Google Scholar] [CrossRef]
- Schreier, C.G.; Reinhard, M. Transformation of chlorinated organic compounds by iron and manganese powders in buffered water and in landfill leachate. Chemosphere 1994, 29, 1743–1753. [Google Scholar] [CrossRef]
- Qiu, S.R.; Lai, H.-F.; Roberson, M.J.; Hunt, M.L.; Amrhein, C.; Giancarlo, L.C.; Flynn, G.W. Yarmoff Removal of contaminants from aqueous solution by reaction with iron surfaces. Langmuir 2000, 16, 2230–2236. [Google Scholar] [CrossRef]
- Farrell, J.; Wang, J.; O'Day, P.; Conklin, M. Electrochemical and spectroscopic study of arsenate removal from water using zero-valent iron media. Environ. Sci. Technol. 2001, 35, 2026–2032. [Google Scholar] [CrossRef] [PubMed]
- Mantha, R.; Taylor, K.E.; Biswas, N.; Bewtra, J.K. A continuous system for Fe0 reduction of nitrobenzene in synthetic wastewater. Environ. Sci. Technol. 2001, 35, 3231–3236. [Google Scholar] [CrossRef] [PubMed]
- Furukawa, Y.; Kim, J.-W.; Watkins, J.; Wilkin, R.T. Formation of ferrihydrite and associated iron corrosion products in permeable reactive barriers of zero-valent iron. Environ. Sci. Technol. 2002, 36, 5469–5475. [Google Scholar] [CrossRef] [PubMed]
- Mielczarski, J.A.; Atenas, G.M.; Mielczarski, E. Role of iron surface oxidation layers in decomposition of azo-dye water pollutants in weak acidic solutions. Appl. Catal. B 2005, 56, 289–303. [Google Scholar] [CrossRef]
- Jia, Y.; Aagaard, P.; Breedveld, G.D. Sorption of triazoles to soil and iron minerals. Chemosphere 2007, 67, 250–258. [Google Scholar] [CrossRef] [PubMed]
- Gorski, C.A.; Scherer, M.M. Fe2+ sorption at the Fe oxide-water interface: A revised conceptual framework. In Aquatic Redox Chemistry; Tratnyek, P., Ed.; American Chemical Society: Washington, DC, USA, 2011; pp. 315–343. [Google Scholar]
- Kamolpornwijit, W.; Liang, L. Investigation of gas production and entrapment in granular iron medium. J. Contam. Hydrol. 2006, 82, 338–356. [Google Scholar] [CrossRef] [PubMed]
- Mayer, K.U.; Blowes, D.W.; Frind, E.O. Reactive transport modeling of an in situ reactive barrier for the treatment of hexavalent chromium and trichloroethylene in groundwater. Water Resour. Res. 2001, 37, 3091–3103. [Google Scholar] [CrossRef]
- Li, L.; Benson, C.H.; Lawson, E.M. Modeling porosity reductions caused by mineral fouling in continuous-wall permeable reactive barriers. J. Contam. Hydrol. 2006, 83, 89–121. [Google Scholar] [CrossRef] [PubMed]
- Jeen, S.W.; Mayer, K.U.; Gillham, R.W.; Blowes, D.W. Reactive transport modeling of trichloroethene treatment with declining reactivity of iron. Environ. Sci. Technol. 2007, 41, 1432–1438. [Google Scholar] [CrossRef] [PubMed]
- Quarteroni, A. Mathematical models in science and engineering. J. Notices AMS 2009, 56, 1–13. [Google Scholar]
- Noubactep, C. An analysis of the evolution of reactive species in Fe0/H2O systems. J. Hazard. Mater. 2009, 168, 1626–1631. [Google Scholar] [CrossRef] [PubMed]
- Nkundimana, E.; Noubactep, C.; Uwamariya, V. Metallic iron for water treatment and environmental remediation: A handout to young researchers. Fresenius Environ. Bull. 2015, 24, 4842–4846. [Google Scholar]
- Noubactep, C.; Licha, T.; Scott, T.B.; Fall, M.; Sauter, M. Exploring the influence of operational parameters on the reactivity of elemental iron materials. J. Hazard. Mater. 2009, 172, 943–951. [Google Scholar] [CrossRef] [PubMed]
- Meinrath, G. Aquatic chemistry of uranium: A review focusing on aspects of environmental chemistry. Freib. Online Geosci. 1998, 1, 101–108. [Google Scholar]
- Grauer, R. Solubility Limitations: An “Old Timer's” View. In Modelling in aquatic Chemistry; Grenthe, I., Puigdomenech, I., Eds.; OECD Publications: Pairs, France, 1997; pp. 131–152. [Google Scholar]
- Johnson, T.L.; Scherer, M.M.; Tratnyek, P.G. Kinetics of halogenated organic compound degradation by iron metal. Environ. Sci. Technol. 1996, 30, 2634–2640. [Google Scholar]
- Ebert, M.; Birke, V.; Burmeier, H.; Dahmke, A.; Hein, P.; Köber, R.; Schad, H.; Schäfer, D.; Steiof, M. Commentary on the contributions "The end of a myth" and "On the operating mode of reactive walls" by Dr. Chicgoua Noubactep. Wasser Luft und Boden 2007, 7, 4–5. (In German) [Google Scholar]
- Elsner, M.; Cwiertny, D.M.; Roberts, A.L.; Lollar, B.S. Response to Comment on “1,1,2,2-Tetrachloroethane Reactions with OH−, Cr(II), Granular Iron, and a Copper-Iron Bimetal: Insights from Product Formation and Associated Carbon Isotope Fractionation”. Environ. Sci. Technol. 2007, 41, 7949–7950. [Google Scholar] [CrossRef]
- Kang, S.-H.; Choi, W. Response to Comment on “Oxidative Degradation of Organic Compounds Using Zero-Valent Iron in the Presence of Natural Organic Matter Serving as an Electron Shuttle”. Environ. Sci. Technol. 2009, 43, 3966–3967. [Google Scholar] [CrossRef]
- Tratnyek, P.G.; Salter, A.J. Response to Comment on “Degradation of 1,2,3-Trichloropropane (TCP): Hydrolysis, Elimination, and Reduction by Iron and Zinc”. Environ. Sci. Technol. 2010, 44, 3198–3199. [Google Scholar] [CrossRef]
- Chen, L.; Jin, S.; Fallgren, P.H.; Liu, F.; Colberg, P.J.S. Passivation of zero-valent iron by denitrifying bacteria and the impact on trichloroethene reduction in groundwater. Water Sci. Technol. 2013, 67, 1254–1259. [Google Scholar] [CrossRef] [PubMed]
- Hart, H. Critical reviews: The editor’s point of view. J. Chem. Doc. 1968, 8, 241–244. [Google Scholar] [CrossRef]
- Townsend, L.B. Critical reviews: The author's point of view. J. Chem. Doc. 1968, 8, 239–241. [Google Scholar] [CrossRef]
- Berthod, A. So what? or required content of a review article. Sep. Purif. Rev. 2009, 38, 203–206. [Google Scholar] [CrossRef]
- Lipczynska-Kochany, E.; Harms, S.; Milburn, R.; Sprah, G.; Nadarajah, N. Degradation of carbon tetrachloride in the presence of iron and sulphur containing compounds. Chemosphere 1994, 29, 1477–1489. [Google Scholar] [CrossRef]
- Warren, K.D.; Arnold, R.G.; Bishop, T.L.; Lindholm, L.C.; Betterton, E.A. Kinetics and mechanism of reductive dehalogenation of carbon tetrachloride using zero-valence metals. J. Hazard. Mater. 1995, 41, 217–227. [Google Scholar] [CrossRef]
- Lavine, B.K.; Auslander, G.; Ritter, J. Polarographic studies of zero valent iron as a reductant for remediation of nitroaromatics in the environment. Microchem. J. 2001, 70, 69–83. [Google Scholar] [CrossRef]
- Gheju, M.; Balcu, I.; Vancea, C. An investigation of Cr(VI) removal with metallic iron in the co-presence of sand and/or MnO2. J. Environ. Manag. 2016, 170, 145–151. [Google Scholar] [CrossRef] [PubMed]
- Schneider, P.; Neitzel, P.L.; Osenbrück, K.; Noubactep, C.; Merkel, B.; Hurst, S. In-situ treatment of radioactive mine waters using reactive materials-results of field experiments in uranium ore mines in Germany. Acta Hydrochem. Hydrobiol. 2001, 29, 129–138. [Google Scholar] [CrossRef]
- Noubactep, C. Aqueous contaminant removal by metallic iron: Is the paradigm shifting? Water SA 2011, 37, 419–426. [Google Scholar] [CrossRef]
- Noubactep, C. Investigating the processes of contaminant removal in Fe0/H2O systems. Korean J. Chem. Eng. 2012, 29, 1050–1056. [Google Scholar] [CrossRef]
- Noubactep, C. Metallic iron for safe drinking water worldwide. Chem. Eng. J. 2010, 165, 740–749. [Google Scholar] [CrossRef]
- Noubactep, C.; Schöner, A. Metallic iron: dawn of a new era of drinking water treatment research? Fresen. Environ. Bull. 2010, 19, 1661–1668. [Google Scholar]
- Noubactep, C. Metallic iron for safe drinking water production. Freib. Online Geosci. 2011, 27, 38–46. [Google Scholar]
- Noubactep, C. Research on metallic iron for environmental remediation: stopping growing sloppy science. Chemosphere 2016, 153, 528–530. [Google Scholar] [CrossRef] [PubMed]


| Species | Formula | ρ (kg m−3) | ρiron/ρoxide | Voxide/Viron |
|---|---|---|---|---|
| Iron | Fe | 7800 | − | − |
| Hematite | Fe2O3 | 5260 | 1.5 | 2.12 |
| Magnetite | Fe3O4 | 5180 | 1.5 | 2.08 |
| Goethite | α-FeOOH | 4260 | 1.8 | 2.91 |
| Akageneite | β-FeOOH | 3560 | 2.2 | 3.48 |
| Lepidocrocite | γ-FeOOH | 4090 | 1.9 | 3.03 |
| kiron (mmol kg−1 d−1) | kiron (mg kg−1 d−1) | kiron (μg particle−1 d−1) | t∞ (years) |
|---|---|---|---|
| 0.7 | 39 | 0.02 | 69.8 |
| 1.2 | 67 | 0.04 | 40.7 |
| 1.5 | 84 | 0.04 | 32.6 |
| 4.0 | 224 | 0.12 | 12.2 |
| 7.0 | 392 | 0.21 | 7.0 |
| 10.0 | 560 | 0.29 | 4.9 |
| 12.0 | 672 | 0.35 | 4.1 |
| 15.0 | 840 | 0.44 | 3.3 |
| 21.0 | 1176 | 0.62 | 2.3 |
| 30.0 | 1680 | 0.88 | 1.6 |
| 170.0 | 9520 | 4.99 | 0.3 |
| 200.0 | 11,200 | 5.87 | 0.2 |
| 242.0 | 13,552 | 7.10 | 0.2 |
| 300.0 | 16,800 | 8.80 | 0.2 |
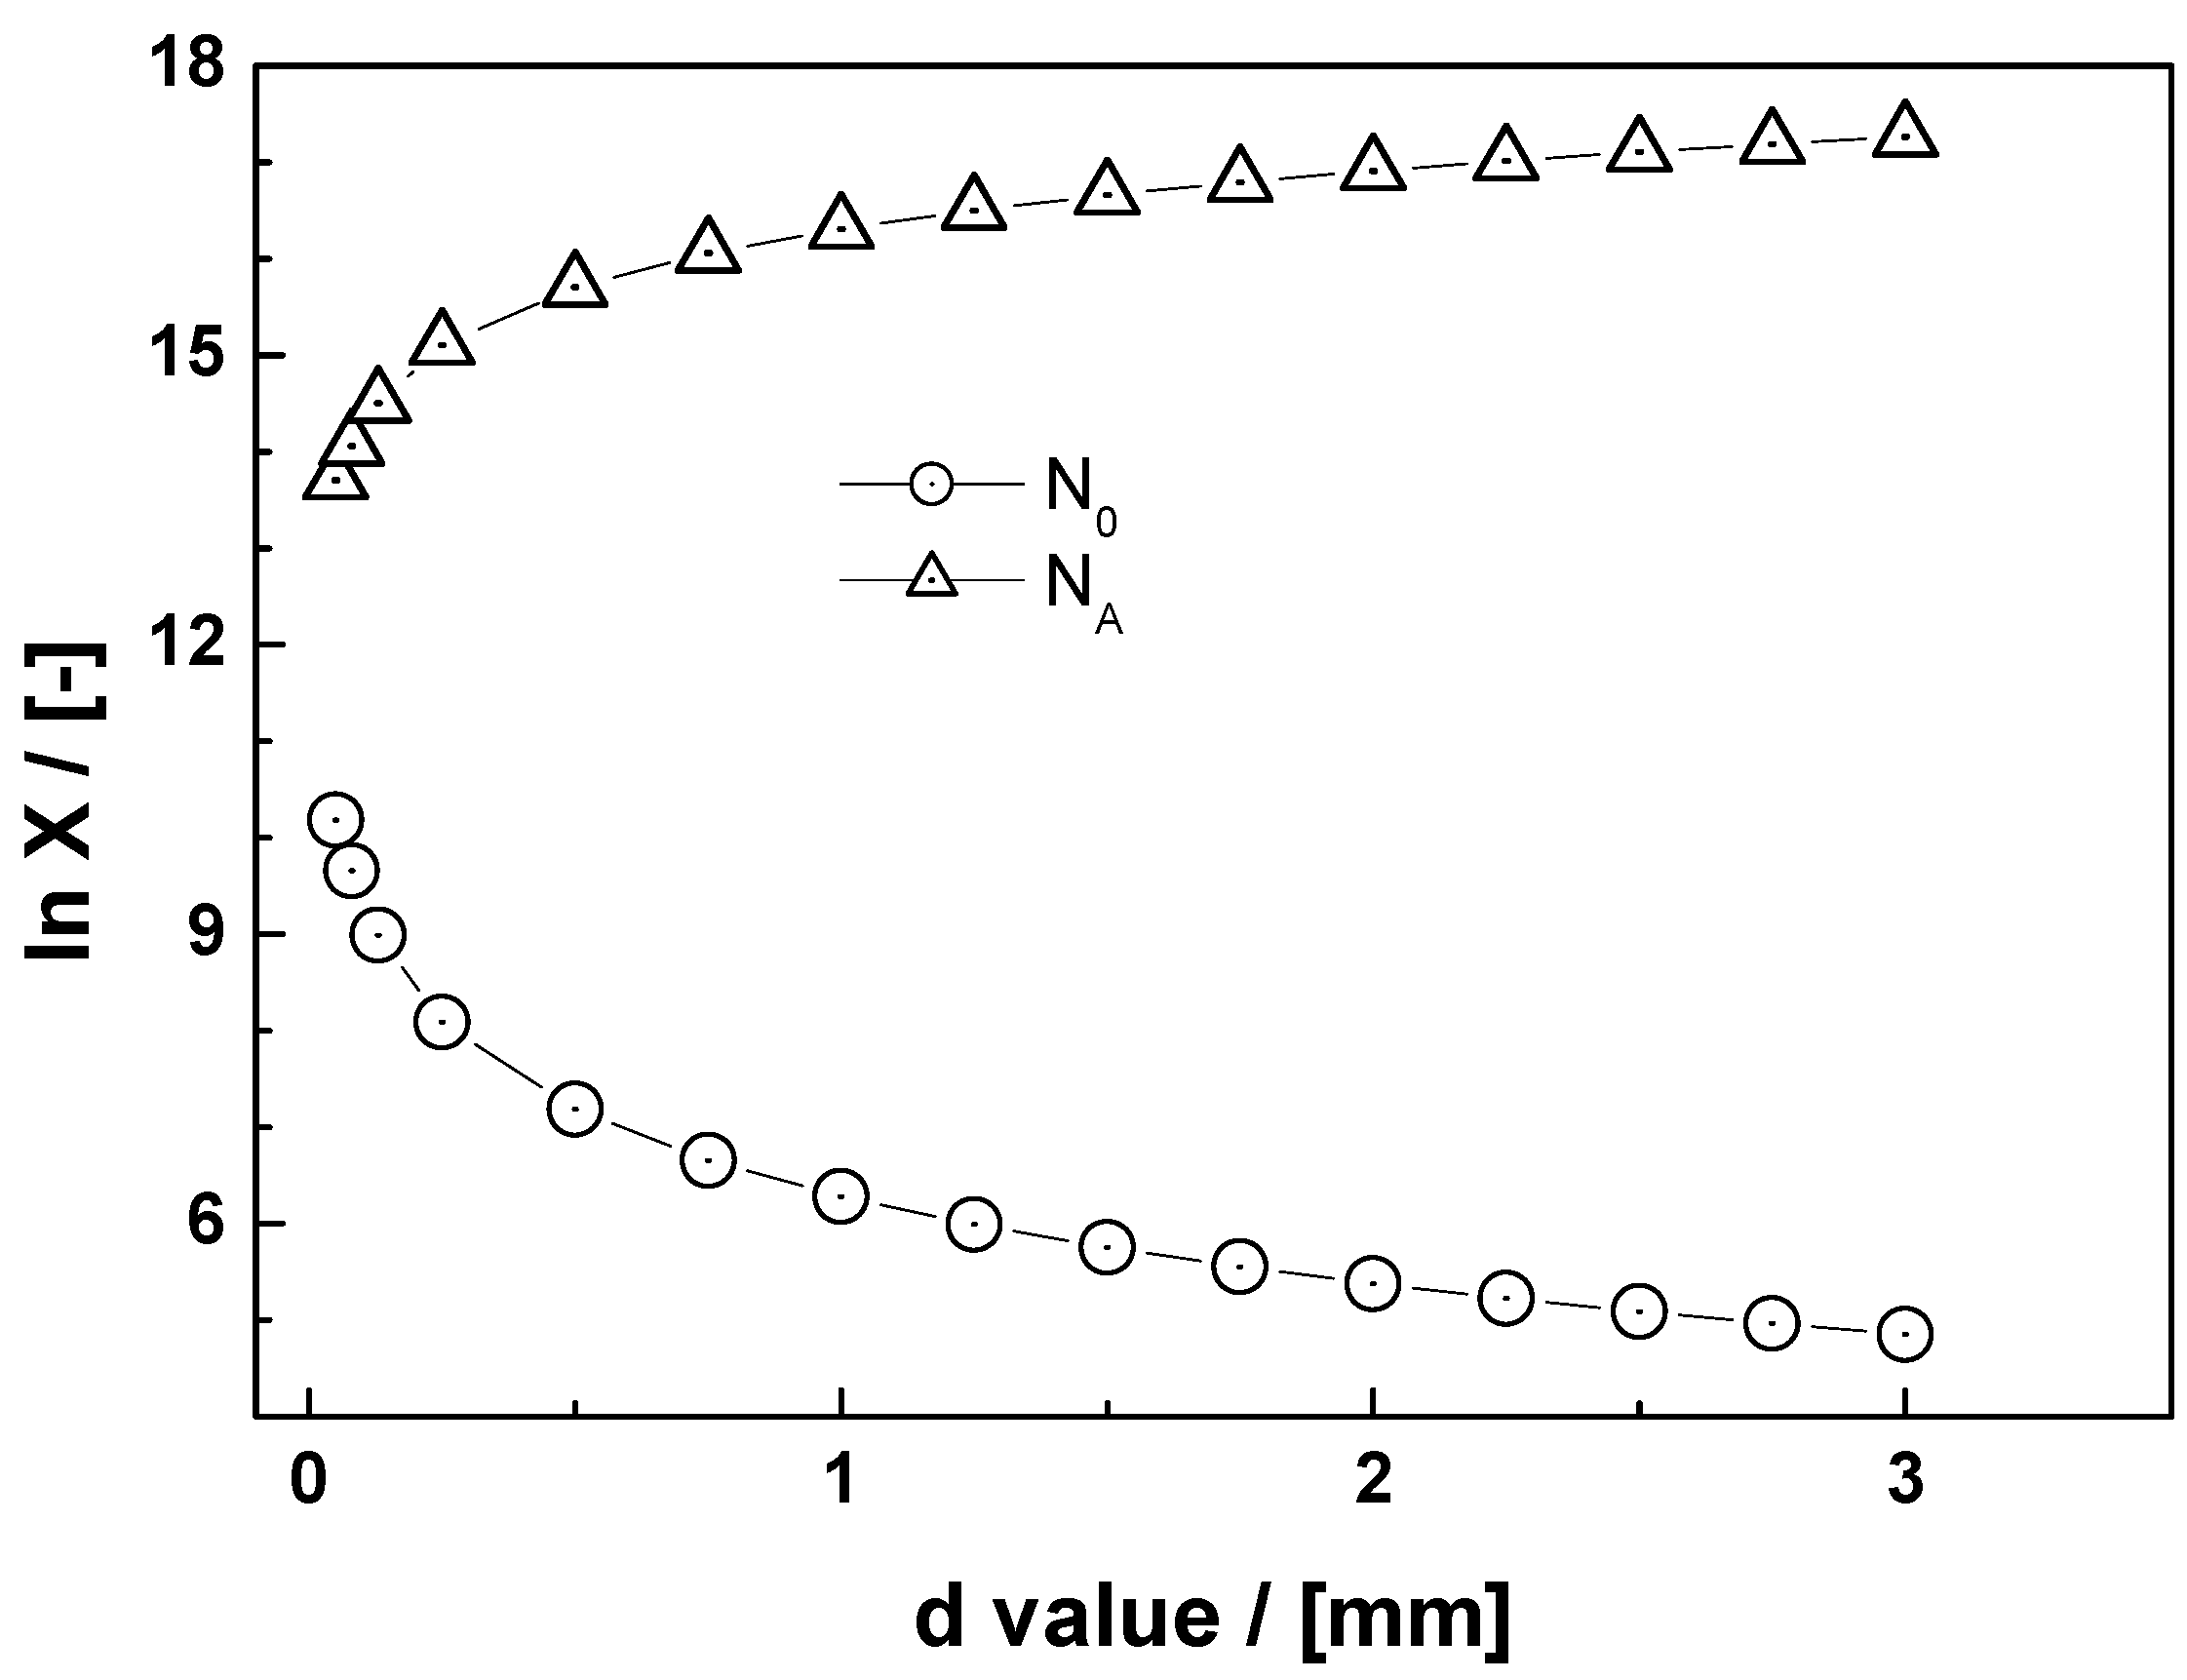
| d (mm) | N0 | Ap (m²) | NA | NA (μmol) |
|---|---|---|---|---|
| 0.05 | 1.53 × 10¹⁰ | 7.86 × 10⁷ | 5.1 × 10¹³ | 8.48 × 10⁻⁵ |
| 0.08 | 4.53 × 10⁹ | 1.77 × 10⁻⁶ | 1.1 × 10¹⁴ | 1.91 × 10⁻⁴ |
| 0.13 | 9.77 × 10⁸ | 4.91 × 10⁻⁶ | 3.2 × 10¹⁴ | 5.30 × 10⁻⁴ |
| 0.25 | 1.22 × 10⁸ | 1.96 × 10⁻⁵ | 1.3 × 10¹⁵ | 2.12 × 10⁻³ |
| 0.50 | 1.53 × 10⁷ | 7.86 × 10⁻⁵ | 5.1 × 10¹⁵ | 8.48 × 10⁻³ |
| 0.75 | 4.53 × 10⁶ | 1.77 × 10⁻⁴ | 1.1 × 10¹⁶ | 1.91 × 10⁻² |
| 1.00 | 1.91 × 10⁶ | 3.14 × 10⁻⁴ | 2.0 × 10¹⁵ | 3.39 × 10⁻² |
| 1.25 | 9.77 × 10⁵ | 4.91 × 10⁻⁴ | 3.2 × 10¹⁵ | 5.30 × 10⁻² |
| 1.50 | 5.66 × 10⁵ | 7.07 × 10⁻⁴ | 4.6 × 10¹⁵ | 7.64 × 10⁻² |
| 1.75 | 3.56 × 10⁵ | 9.63 × 10⁻⁴ | 6.3 × 10¹⁵ | 1.04 × 10⁻¹ |
| 2.00 | 2.39 × 10⁵ | 1.26 × 10⁻³ | 8.2 × 10¹⁵ | 1.36 × 10⁻¹ |
| 2.25 | 1.68 × 10⁵ | 1.59 × 10⁻³ | 1.0 × 10¹⁵ | 1.72 × 10⁻¹ |
| 2.50 | 1.22 × 10⁵ | 1.96 × 10⁻³ | 1.3 × 10¹⁵ | 2.12 × 10⁻¹ |
| 2.75 | 9.18 × 10⁴ | 2.38 × 10⁻³ | 1.5 × 10¹⁵ | 2.57 × 10⁻¹ |
| 3.00 | 7.07 × 10⁴ | 2.83 × 10⁻³ | 1.8 × 10¹⁵ | 3.05 × 10⁻¹ |
© 2016 by the author; licensee MDPI, Basel, Switzerland. This article is an open access article distributed under the terms and conditions of the Creative Commons Attribution (CC-BY) license (http://creativecommons.org/licenses/by/4.0/).
Share and Cite
Noubactep, C. Predicting the Hydraulic Conductivity of Metallic Iron Filters: Modeling Gone Astray. Water 2016, 8, 162. https://doi.org/10.3390/w8040162
Noubactep C. Predicting the Hydraulic Conductivity of Metallic Iron Filters: Modeling Gone Astray. Water. 2016; 8(4):162. https://doi.org/10.3390/w8040162
Chicago/Turabian StyleNoubactep, Chicgoua. 2016. "Predicting the Hydraulic Conductivity of Metallic Iron Filters: Modeling Gone Astray" Water 8, no. 4: 162. https://doi.org/10.3390/w8040162
APA StyleNoubactep, C. (2016). Predicting the Hydraulic Conductivity of Metallic Iron Filters: Modeling Gone Astray. Water, 8(4), 162. https://doi.org/10.3390/w8040162