1. Introduction
The concept of carrying capacity can be traced back to the 1970’s, which is defined as the number of individuals who can be supported in a given area within natural resource limits, without degrading the natural social, cultural and economic environment for present and future generations. With the increasing constraints on regional sustainable development by resource scarcity, different concepts for carrying capacity of natural resources were introduced, e.g., land [
1], environment [
2], agriculture [
3], and water [
4]. Specifically, water has been playing an increasingly important role in current socio-economic development, so water resources carrying capacity (WRCC) has attracted considerable attention [
5,
6,
7,
8,
9,
10,
11,
12]. WRCC is based on the carrying capacity theory and the exploration of response mechanisms between human activities and water resources.
WRCC rationally evaluates the socio-economic scale threshold that can be sustained by the local water resources. However, the definition of WRCC is still not clear for now. Some studies consider the WRCC to be a capacity to sustain a society with a good standard of living in a favorable water resource system [
13]; some define it as the maximum bearing capacity of water resources for human activity in a certain stage of socio-economic development or a certain living standard in a favorable ecological system [
14]. Others consider it a threshold value, for example, the capacity to support the activities of human beings [
5].
There are two types of WRCC: current WRCC and future WRCC. It is quite easy to calculate the current WRCC as the current situation of water resources and socio-economic development mode are already known. However, the WRCC changes with time. For the future WRCC, the future amount of water resources and the socio-economic development mode are unknown and need to be estimated in advance, which will cause a lot of uncertainty. In most studies, water resources and the socio-economic development mode in the future are estimated based on some supposed conditions [
14,
15,
16]. For example, the water resources in the future are estimatedbased on a 50% (represents water inflow reliability for a normal year) and 75% (for a moderate dry year) guaranteed rate. The socio-economic development is estimated based on a certain stage, e.g., basic level of living, well-off level of living and affluence level of living [
14]. This considers the uncertainty of water resources and socio-economic development to a certain extent, but the estimated results vary widely for different conditions.
This study focused on the above limits of WRCC, and proposed a new concept, water resources design carrying capacity (WRDCC), to narrow the uncertainty of future WRCC calculations.
Section 2 presents the definition of WRDCC in this study;
Section 3 describes the scheme of WRDCC,
i.e., how to select the design water resources and design socio-economic development mode;
Section 4 is a case study of WRDCC calculation of Chengdu city in China; and the conclusions are summarized in
Section 5.
2. Definition of WRDCC
This paper proposed WRDCC as the carrying capacity of water resources for human activity under a design condition, i.e., a design water resources and design socio-economic development stage. The word “design” used in WRDCC has its general meaning as in the word “design flood”, while the design flood is flood under a designed standard of water conservancy and hydropower engineering, which makes it depart from the general flood, with specific features and special meaning. Similarly, in WRDCC, the feature of design will be considered and the corresponding carrying capacity will be fixed once the design water resources and development mode are determined. The design carrying capacity is developed based only on the design development modes, which show the importance of design.
In this paper, the largest population size is used to assess WRDCC, because the scale of social economy depends largely on the scale of the population. The largest population size can indirectly indicate the largest social and economic scale, although they are not strictly equivalent. It is reasonable to use the largest population size as the quantitative expression of WRDCC.
In summary, WRDCC is defined as the largest population size that the local water resources can support, under the design water supply and design socio-economic development mode. The WRDCC and WRCC are essentially different. The former turns into a fixed value under a design condition, while the latter has multiple uncertain estimates.
3. Scheme of WRDCC
3.1. Design Water Resources
The design water resources
refer to the water resources derived from the hydrological calculation with
P probability of exceedance.
has two characteristics: firstly,
is a determined value; secondly, the probability of future water resources exceeding
is
P. When the water resources are greater than or equal to
, WRDCC can be guaranteed with a probability of
P. Otherwise, the probability of water resources less than
is (1 −
P) and the risk of not reaching the design status is 1 −
P. The choice of
P should be made based on the balance of the two aspects,
i.e., water resources being fully utilized (requiring
P not too large) and WRDCC with the appropriate guarantee rate (requiring
P not too small).
P should be selected by considering the social, economic, technology and others at the national level, which is not an easy job currently. In this paper,
P is suggested to be selected according to (1) the importance (political, economic and cultural, etc.) of the city (general, important, more important); and (2) the amount of water resources (water-rich area, water-limited area), which are shown in
Table 1.
Further, the selection of P is related to the development modes. For example, P can be a little higher for a higher development mode, and vice versa.
3.2. Design Socio-Economic Development Modes
3.2.1. Classification of Development Modes
The design socio-economic development mode reflects the characteristics and relationship between socio-economic development and water resources utilization. The development mode must be designed based on the strategic level, because it is closely related to the basic national policy, economic policy, development planning and others. For example, the regional development strategy has a large influence on water resources allocation and utilization, while the management system influences the carrying capacity to some extent, and especially improves the carrying capacity by increasing the water resource utilization rate, water reuse rate, and sewage treatment rate through scientific and technological progress. The development mode may vary and this paper presents three kinds of design development modes as shown in
Table 2 for reference.
3.2.2. Indicator Selection
Indicators must have the following characteristics conceptually:
WRDCC can be reflected by some specific quantitative indicators. These indicators can be divided into several classes: indicators of the social and economic system, ecological system, technology and others.
Table 3 shows indicators of WRDCC related to water use characteristics, water use structure, and water use efficiency.
3.2.3. Indicators Quantification
The indicator needs to be quantified by considering the basic national policy, economic policy, development planning and regional development. It is quite complex and needs more study. This paper shows the indicator values in
Table 4 based on China’s actual conditions and the existing literature.
4. Data and Method
4.1. Data
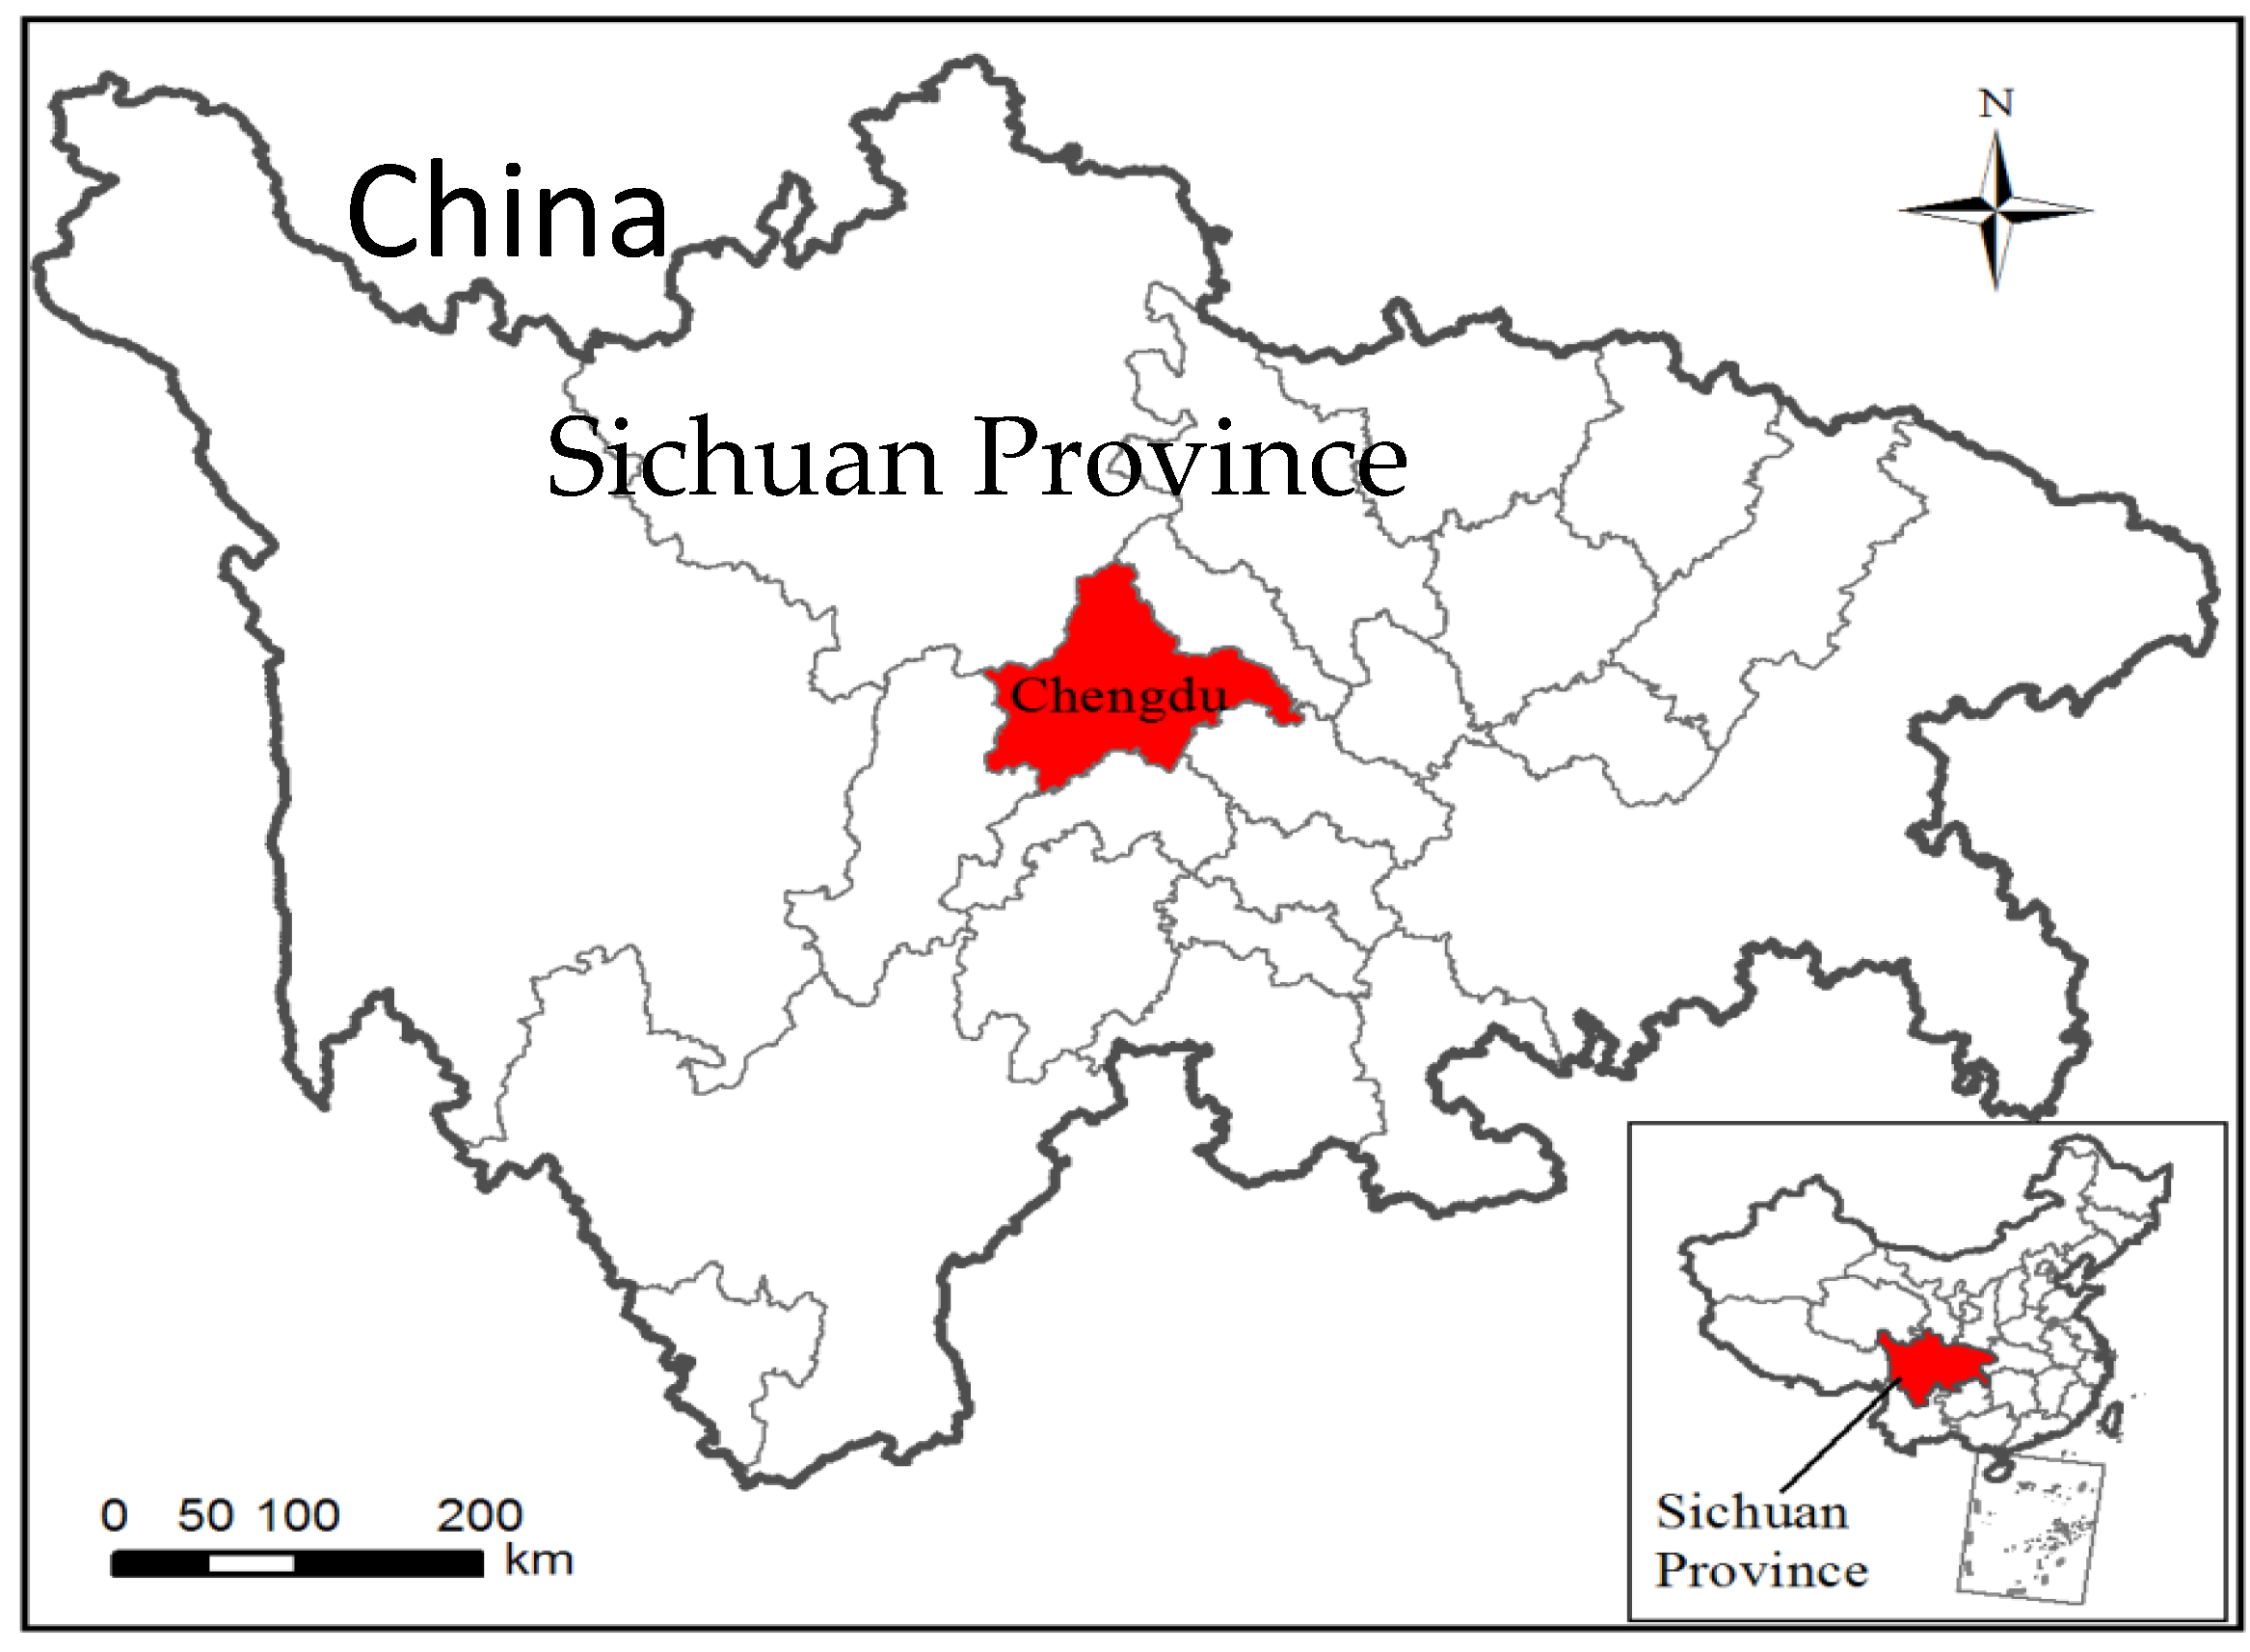
Chengdu city, the capital city of Sichuan Province, which is famous for pandas, is located in the center of Chengdu Plain, and covers an area (
A) of 12,121 km
2 (
Figure 1), with an annual mean air temperature of 15.2–16.6 °C and annual total precipitation of 800–1400 mm. According to the
Statistics Yearbook of Chengdu, in 2010, the total population of Chengdu was 1404 × 10
4 the GDP (Gross Domestic Product) was 5550 × 10
8 RMB (1 USD ≈ 6.5 RMB, currently), among which the Second industry added value (
SIA) was 2480 × 10
8 RMB, the Tertiary industry added value (
TIA) was 2780 × 10
8 RMB. The total water resources were 86 × 10
8 m³, and the available water supply (
) was 59 × 10
8 m³ (
P is 90% as Chengdu belongs to a water-rich area and important city according to
Table 1).
According to the Water Resources Plan of Chengdu City (2010–2030), in 2020 (2030), the available water supply of Chengdu will be 60 × 108 m³ (62 × 108 m³), the Second industry added value will be 6230 × 108 RMB (12,300 × 108 RMB), and the Tertiary industry added value will be 8710 × 108 RMB (20,200 × 108 RMB). Tertiary industry will increase rapidly as Chengdu is accelerating its economic restructuring, and Tertiary industry is the strategic priority.
The indicator values for WRDCC of Chengdu in 2020 and 2030 (by referring to the
Water Resources Plan of Chengdu City (
2010–
2030) and other references, for example, [
14]) are listed below in
Table 4.
Table 4 shows that there will be less water for agriculture with the increase of efficiency of irrigation water use, but more water for the environment and ecology with the increase in the eco-environmental water use ratio.
4.2. Method
The population of WRDCC can be calculated based on the balance of water supply and water consumption. The total water consumption is obtained by adding each kind of water consumption calculated according to the design development mode. Assume that the population size the water resources can support is
; it can be obtained from Equations (1)–(13).
5. Results and Discussion
Therefore, WRDCC (population size) of Chengdu city under design water supply in development mode I (II, III) will be 997 × 10
4 (770 × 10
4, 504 × 10
4) in 2020, and 934 × 10
4 (759 × 10
4, 462 × 10
4) in 2030, which are listed below in
Table 5.
The results show that the population size of WRDCC shows a rapid downward trend from a better to worse development mode (I to III), which makes sense. It also shows a slow downward trend from 2020 to 2030, this may because, for one reason, more water is used for the environment and Tertiary industry, and for another, the domestic water quota is increasing with the development of society. This is similar to Tianjin city and China, which also show a decreasing carrying population [
14].
The actual population size of Chengdu city in 2010 was 1404 × 104, and will be more than 1500 × 104 in 2020 and 2030 according to the Water Resources Plan of Chengdu City. Comparing the actual population to the carrying population (WRDCC) in 2020 and 2030, a larger gap will appear, which means more and more pressure on the society-economic sustainable development. Therefore, in the future, water should be efficiently used and rational policies and measures should be implemented to ensure sustainable development in Chengdu, and thus that the carrying population would move towards stabilization.
The uncertainty of water resources and development modes, which is influenced by random factors, makes water resources carrying capacity analysis very difficult, and may lead to uncertain results. This study considered this uncertainty by using the design water resources with a certain guarantee rate in three development modes, using the WRDCC calculation. Further, the complexity of water resources, changing over time and influenced by many factors, such as the basic national policy, economic policy, development planning, is simplified in this paper by using the design socio-economic development mode.
6. Conclusions
This paper proposed a new concept, i.e., water resources design carrying capacity, by incorporating the concept of design into WRCC. In WRDCC, water sources are quantified by using design water supply with a certain guarantee rate and design socio-economic development mode. Three kinds of development modes and corresponding indicators values are presented in this paper. The case study shows that the new method improves the calculation of future water resources carrying capacity, and is easily applicable. The WRDCC (population size) of Chengdu city under design water supply in development mode I (II, III) will be 997 × 104 (770 × 104, 504 × 104) in 2020, and 934 × 104 (759 × 104, 462 × 104) in 2030. More significant improvements on how to choose a reasonable design water supply and design socio-economic development mode are needed in the future.
Acknowledgments
This research is supported by the National Key Basic Research Program of China (973 Program, No. 2013CB036401) and National Natural Science Foundation of China (No. 51209152).
Author Contributions
Hongxia Li and Guanghua Qin conceived and designed the experiments; Hongxia Li and Jing Ding performed the experiments; Wangxin and Jing Ding analyzed the data; Guanghua Qin wrote the paper.
Conflicts of Interest
The authors declare no conflict of interest.
References
- Chen, G.X.; Xu, D.Y.; Li, M.D. The conception and calculation of the bearing capacity of land resources. J. Sichuan Teach. Coll. Nat. Sci. 1996, 17, 66–70. (In Chinese) [Google Scholar]
- Arrow, K.; Bolin, B.; Costanza, R.; Dasgupta, P.; Folke, C.; Holling, C.S.; Jansson, B.; Levin, S.; Maler, K.; Perrings, C.; Pimental, D. Economic growth, carrying capacity, and the environment. Ecol. Econ. 1995, 15, 91–95. [Google Scholar] [CrossRef]
- Duarte, P.; Meneses, R.; Hawkins, A.J.S.; Zhu, M.; Fang, J.; Grant, J. Mathematical modeling to assess the carrying capacity for multi-species culture within coastal waters. Ecol. Model. 2003, 168, 109–143. [Google Scholar] [CrossRef]
- Liu, J.J.; Dong, S.C.; Mao, Q.L. Comprehensive Evaluation of the Water Resource Carrying Capacity for China. Geogr. Nat. Resour. 2012, 33, 92–99. [Google Scholar] [CrossRef]
- Li, L.Y.; Gan, H. Remark on the relationship between water resources rational allocation, carrying capacity and sustainable development. Adv. Water Sci. 2000, 11, 307–313. (In Chinese) [Google Scholar]
- Xia, J.; Zhu, Y.Z. The measurement of water resources security: Progress and challenge in water resources carrying capacity research. J. Nat. Resour. 2002, 17, 262–269. (In Chinese) [Google Scholar]
- Yao, Z.J.; Wang, J.H.; Jiang, D. Advances in study on regional water resources carrying capacity and research on its theory. Adv. Water Sci. 2002, 13, 111–115. (In Chinese) [Google Scholar]
- Yao, Z.J.; Liu, B.Q.; Gao, Y.C. Study on water resources carrying capacity based on regional development goals. Adv. Water Sci. 2005, 16, 109–113. (In Chinese) [Google Scholar]
- Tao, J.; Zuo, Q.T.; Qi, D.H.; Dou, M. Calculation and analysis of water resources carrying capacity in central Henan urban agglomeration. J. Water Resour. Water Eng. 2011, 22, 56–61. (In Chinese) [Google Scholar]
- Gong, L.; Jin, C.L. Fuzzy Comprehensive Evaluation for Carrying Capacity of Regional Water Resources. Water Resour. Manag. 2009, 23, 2505–2513. [Google Scholar] [CrossRef]
- Li, L.J.; Guo, H.C.; Chen, B. Water resources supporting capacity of Chaidamu Basin. Environ. Sci. 2000, 21, 20–23. (In Chinese) [Google Scholar]
- Murray, L.; Les, D.; Peter, G. The essential parameters of a resource-based carrying capacity assessment model: An Australian case study. Ecol. Model. 2014, 272, 220–231. [Google Scholar]
- Feng, L.H.; Huang, C.F. A risk assessment model of water shortage based on information diffusion technology and its application in analyzing carrying capacity of water resources. Water Resour. Manag. 2008, 22, 621–633. [Google Scholar] [CrossRef]
- Song, X.M.; Kong, F.Z.; Zhan, C.S. Assessment of Water Resources Carrying Capacity in Tianjin City of China. Water Resour. Manag. 2011, 25, 857–873. [Google Scholar] [CrossRef]
- Li, C.; Wang, E.D. Water Resources Carrying Capacity of Liaoning Along Bohai Region. J. Northeast. Univ. Nat. Sci. 2011, 32, 1492–1494. (In Chinese) [Google Scholar]
- Zai, S.M.; Wen, J.; Wu, F.; Sun, H. Evaluation of water resources carrying capacity in Xinxiang City. J. Hydraul. Eng. 2011, 42, 783–788. (In Chinese) [Google Scholar]
© 2016 by the authors; licensee MDPI, Basel, Switzerland. This article is an open access article distributed under the terms and conditions of the Creative Commons by Attribution (CC-BY) license (http://creativecommons.org/licenses/by/4.0/).


