Article

Differing Levels of Forestry Best Management Practices at Stream Crossing Structures Affect Sediment Delivery and Installation Costs

1
Department of Forest Resources & Environmental Conservation, Virginia Tech, 228 Cheatham Hall, Blacksburg, VA 24061, USA
2
National Council for Air and Stream Improvement, Inc., 8270 McNatt Rd., Aubrey, TX 76227, USA
*
Author to whom correspondence should be addressed.
These authors contributed equally to this work.
Water 2016, 8(3), 92; https://doi.org/10.3390/w8030092
Submission received: 15 January 2016 / Revised: 23 February 2016 / Accepted: 2 March 2016 / Published: 10 March 2016
(This article belongs to the Special Issue BMP Development, Implementation, and Performance)

Abstract

:
Forestry best management practices (BMPs) are used to reduce sedimentation from forest stream crossings. Three BMP treatments (BMP−, BMP-std, and BMP+) were applied to three forest road stream crossings (bridge, culvert, and ford). BMP− did not meet existing BMP guidelines, BMP-std met standard recommendations, and BMP+ treatments exceeded recommendations. Following BMP applications, three simulated rainfall intensities (low, medium, and high) were applied in order to evaluate sediment delivery from crossing type and BMP level. During rainfall simulation, sediment concentrations (mg/L) were collected with automated samplers and discharge (L/s) was estimated to calculate total sediment loading. Costs of stream crossings and BMP levels were also quantified. Mean sediment associated with the three stream crossings were 3.38, 1.87, and 0.64 Mg for the BMP−, BMP-std, and BMP+ levels, respectively. Ford, culvert, and bridge crossings produced 13.04, 12.95, and 0.17 Mg of sediment during construction, respectively. BMP enhancement was more critical for sediment control at the culvert and ford crossings than at the bridge. Respective costs for BMP−, BMP-std, and BMP+ levels were $5,368, $5,658, and $5,858 for the bridge; $3,568, $4,166 and $4,595 for the culvert; and $180, $420 and $1,903 for the ford. Costs and sediment values suggest that current standard BMP levels effectively reduce stream sediment while minimizing costs.

1. Introduction

Forest operations generally have few long-term effects on water quality, but forest roads, skid trails, and stream crossings have long been areas of concern [1,2,3,4,5]. Forest operations have been shown to alter stream water quality [4]. Numerous research projects identified forest roads as a primary factor controlling sediment delivery from forest operations [6,7,8,9]. Trimble and Sartz [10] conducted one of the earlier studies that evaluated how the proximity of forest roads to streams can increase sediment loading. Several of the early hydrologic watershed studies conducted on United States Forest Service Experimental Forests concentrated on the evaluation of forest roads and sediment [11,12,13]. These evaluations have detected minimal long-lasting negative effects following timber harvesting alone, yet increases in sediment yield have been correlated with increased road building associated with timber harvesting [14,15].
The United States Environmental Protection Agency (EPA) assists states in implementing programs to reduce sediment from forest operations as a non-point source pollutant (NPSP). However, 2013 litigation in federal circuit courts, appeals courts, and the United States Supreme Court [16] considered the possibility of treating forest roads as point sources of pollution, which would require federal permitting under the National Pollution Discharge Elimination System (NPDES). The U.S. Supreme Court decided that the EPA could continue with the current NPSP control via forestry Best Management Practices (BMPs), yet a recent review of forestry BMPs and sediment by Anderson and Lockaby [17] identified gaps, including quantification of the effectiveness of BMPs and the optimization of BMP applications for sediment reduction. The gaps in BMP research, combined with the series of court rulings, have provided impetus for collaboration between forest managers and the regulatory community to identify and enhance methods of sediment reduction that are economically and environmentally effective [18]. Loehle et al. [19] suggest that future forest water quality research should focus on BMP effectiveness and potential for future refinements.
BMPs are typically designed to minimize the factors that contribute to erosion or to direct sediment into areas where it can be deposited before entering a stream [20,21]. Following inception of the Federal Water Pollution Control Act of 1972, many states developed BMP guidelines for the protection of water quality, which have been shown to be effective [21,22,23,24,25]. In 1997, state-implemented BMP effectiveness monitoring was found to be lacking; however, in 2010, many states had implemented effectiveness monitoring programs [23,26].
BMPs that maintain or increase the soil cover, increase interception of rainfall, and reduce soil particle detachment are typically effective erosion control measures [27]. Such erosion control BMPs are epitomized by the retention of soil litter layers, re-establishment of vegetation, and application of soil cover such as mulch or slash [28]. Erosion control measures, including straw mulch, slash [24,29,30,31], and gravel [3,32,33,34] have been found to reduce erosion potential. Edwards and Williard [35] evaluated three studies of BMP efficiency for sediment reduction and found that the efficiency of BMPs as well as total sediment loads decreased as time after harvest increased.
The need to separate erosion from the road approach and the stream crossing was raised by Taylor et al. [36]. Thompson et al. [37] found that it was difficult to separate the effects of stream crossing road approaches from effects of the actual approaches while examining sediment produced from three Piedmont stream crossings (two bridges and one culvert) during the construction phase and after installation. Thompson et al. [37] concluded that the BMPs used on the approach were as important as the type of stream crossing used.
In Virginia, stream crossings have been identified as an area of concern regarding BMP effectiveness and implementation [5]. Aust et al. [38] evaluated 23 stream crossings in the Piedmont of Virginia representing a range of crossing types and permanency. They concluded that culvert crossings and permanent crossings tended to result in lower downstream water quality, but also concluded that all crossing types could be adequate when the most applicable crossing structure is chosen for a given situation and appropriate BMPs are applied. This effectiveness of stream crossing BMPs was supported by Wear et al. [39], who evaluated the closure BMPs used for nine panel bridge skid trail stream crossings on harvest sites in the Piedmont of Virginia and found that slash or mulch could be effectively used to close stream crossings. Nolan et al. [40] evaluated BMP levels and erosion associated with 42 truck and skid trail crossings. Stream crossings having standard or enhanced levels of BMPs resulted in much lower erosion rates than crossings with substandard BMPs.
A 2009 survey found that 48% of loggers in the Piedmont region of Virginia had installed haul road stream crossings within the previous year [41]. Bridges (wooden and steel panel) were the dominant crossing type (32%), followed by culverts (20%) and fords (8%). Costs of materials and installation for these crossings averaged $1,586 for culverts, $2,857 for wooden bridges, and $11,246 for steel bridges. No cost estimate was provided for fords in the Piedmont; however, in the Mountains the average ford cost was $975. Visser et al. [42] investigated stream crossing installation costs for four stream crossings in the Ridge and Valley physiographic region of Virginia. Costs were the least for an improved ford crossing at a 1.2 m-wide intermittent stream, followed by panel bridges crossing a 7.3 m-wide perennial stream, and a low water crossing constructed over a 24.4 m-wide perennial stream.
Haul road stream crossing structures (i.e., bridges, culverts, fords, etc.) each have different potential sediment contributions and costs [43]. However, each crossing type may only be suitable in certain crossing locations and situations [38]. Culverts are relatively simple to install, have moderate costs, and can be installed to bear heavy loads with simple designs. Disadvantages include disturbance of the natural streambed, modification of the stream cross-sectional area, and increased water velocity immediately below culverts [44,45]. Bridges can be expensive, but portable bridges can be used for multiple crossings over time. Fords have the advantage of relatively low cost if the streambed can bear heavy loads and handle most flood events [41]. Disadvantages of fords include traffic limitations during high flows and in-stream sediment disturbance associated with traffic entering the stream channel.
Aust et al. [27] summarized problems associated with forest roads and stream crossings and concluded that many sediment problems are the result of insufficient planning, insufficient quality of BMPs, or inadequate quantities of BMPs. Application of erosion control measures on road surfaces [33] and the use of forested stream buffers have been found to be effective for reducing erosion and stream sediment [46,47]. Stream crossings resulted in an increased potential for sedimentation due to the road crossing through the stream buffer at the stream crossing [46]. Lane and Sheridan [48] conducted a rainfall simulation experiment to quantify the principal sources of sediment from a culvert crossing (e.g., road surface, fill slope, and construction phase). They evaluated upstream and downstream total suspended solids (TSS) and turbidity values for stream crossings and found a two- to threefold increase in TSS and turbidity for a culvert crossing. Aust et al. [38] found that haul road stream crossings met or exceeded the state BMP standards on 78% of harvest tracts.
Recent litigation [49] and surveys of BMP compliance [5] have focused attention on forest stream crossings, which have the potential to contribute disproportionately large quantities of sediment to streams compared to their actual area. Despite concerns and the costs of implementing BMPs, there have been few studies investigating the direct impact of various stream crossing structures or stream crossing BMPs on sediment loads that separate the effects of the stream crossing from the effects of the road approach [36].
This study was designed to quantify the sediment delivery and cost of stream crossing structures associated with different levels of BMPs. Specifically, this study: (1) estimated downstream sediment loading following simulated rain events on crossings with various levels of BMPs; (2) assessed the effectiveness of BMPs; and (3) determined the costs for crossing installation and additional BMPs.

2. Materials and Methods

2.1. Site Description

The study was conducted on the Virginia Tech Reynolds Homestead Forest Resources Research Center in Patrick County, VA, USA (36°38′58″ N, 80°9′16″ W), located along the western edge of the Piedmont physiographic province. Typical forest management in the area includes loblolly pine (Pinus taeda) plantations, natural Virginia pine (P. virginiana), and mixed hardwood stands. An existing legacy road at Reynolds Homestead Forest Resources Research Center crosses intermittent streams in three locations. The legacy forest road is in excess of 100 years old and has fair to poor location, surfacing, and water control. A bridge, culvert, and ford were constructed with three levels of BMP treatments on the three stream crossings. Preceding this experiment, all streams had been crossed with undesigned ford stream crossings having soft bottoms and steep approaches. The watershed area above the three crossings consists of mature mixed hardwood forests. Watershed areas for the bridge, culvert, and ford crossings were 40.4, 17.0, and 32.4 ha, respectively (Table 1). During construction activities the costs of materials, labor, and equipment were recorded to determine the cost of crossing construction and BMP treatments.

2.2. Initial Road Preparation and Crossing Selection

Before stream crossing installation, each stream was evaluated so that the culvert, bridge, and ford were most appropriately suited to the local stream characteristics. The stream crossing site with vertical banks was selected for the bridge crossing. A ford was installed where the channel was wide and the approaches were shallow. The culvert treatment was located at a stream crossing where the channel depth and width allowed for proper road alignment and minimized excavation and fill during construction. The legacy road approaches were modified to improve alignment for the crossings by shifting the road centerline to allow for the crossing to be as close to perpendicular to the stream channel as feasible. All three crossings were first constructed with a minimal level of erosion prevention measures (BMP−) that were considered complete when they could be navigated by a log truck, representing the minimum crossing improvement work that would be required for forest operations to utilize the crossing.

2.3. Construction—Bridge

The original legacy ford stream crossing consisted of steep approaches with poor alignment, which often required four-wheel drive usage and resulted in substantial channel disturbance. In order to improve trafficability and reduce maintenance and risk of erosion from the road network, a wood panel bridge was installed. The bridge consisted of three white oak (Quercus alba) panels 7.3 m long, 1.2 m wide, and 0.2 m thick. The panels were combined to form a bridge 7.3 m in length and 3.6 m wide (Figure 1). The bridge spans a distance of 2.8 m, with approximately 2.25 m of bridge extending beyond the abutments on each side. The eastern abutment for the bridge was constructed using two gabion baskets (0.9 m × 0.9 m × 3.6 m) that were placed along the edge of the stream channel. Approximately 0.6 m of fill was required behind the gabion baskets to allow for the desired grade on the bridge approach. The native Fairview soil series [50] was used for fill behind the gabion baskets. The eastern abutment utilized a near-vertical stream bank that was stabilized by the roots from surrounding trees. Geotextile fabric was applied on both abutments. Approximately 5 cm of Virginia Department of Transportation (VDOT) #5 (1.25–5 cm stone) drain rock was applied on the geotextile to aid drainage and increase the longevity of the permanent bridge.

2.4. Construction—Culvert

The culvert crossing replaced a legacy road ford with steep approaches and a soft non-reinforced streambed which often required four-wheel drive for travel. The alignment of the road leading to the crossing resulted in excessive curvature. The relocation and realignment of the road centerline shifted the location of the culvert approximately 10 m below the original ford. The relocation improved the horizontal curvature of the road, thereby improving both trafficability and grade of the approaches (Figure 2). The Virginia Department of Forestry (VDOF) BMP guidelines [51] suggested using a 0.9-m culvert for the 17-ha watershed and a 10-year return interval storm event. Two 6.1-m culverts were joined into a 12.2-m pipe. This length facilitated desired road alignment and provided sufficient length to allow gentle fill slope ratios above the culvert. For installation, the stream channel was excavated using a New Holland TN750 farm tractor with a 3-point mounted backhoe. The culvert was aligned with the native channel with approximately one-third of the culvert being below the natural streambed to allow for coarse bed load material to fill the bottom of the pipe and facilitate travel of aquatic species. Fill material was moved and compacted with a John Deere JD450 bulldozer. Upon completion of the earth work, the bulldozer was used to compact and grouser track the fill slopes, which increased surface roughness and storage.

2.5. Construction—Improved Ford

An existing unimproved ford on the legacy road was reinforced and improved (Figure 3). The existing ford had a semi-rocky bottom. The road was not perpendicular to the stream channel and the upstream tire track in the stream was often soft, resulting in vehicle tires sinking several inches into sediment which had settled in the wheel track. The crossing was improved by re-aligning the road to allow for a crossing that is nearly perpendicular. The steep stream banks were smoothed to allow for an easier transition when traveling through the crossing. The streambed was reinforced utilizing Geo-Web to stabilize the VDOF-specified VDOT #5 gravel which was placed in the stream channel. In order to maintain the native stream gradient, the streambed was excavated 15.2 cm. After the Geo-Web was placed in the excavated area, it was backfilled with VDOT #5 gravel to the top of the Geo-Web.

2.6. BMP Level Treatments

The condition of the crossing immediately after installation comprised the BMP− treatment, in which sub-guideline BMPs were used and the only requirement for construction was the ability to travel the road safely in a log truck (Table 2). The first BMP level (BMP−) did not meet the VDOF BMP requirements [50] and contained minimal erosion mitigation. The second BMP treatment level provided the standard BMP (BMP-std) guidelines recommended by the VDOF; however, no additional erosion mitigation measures were used. The final BMP level (BMP+) was designed to represent an increased level of erosion protection. The BMP+ treatment surpassed the requirements of the VDOF, as confirmed by site visits by multiple VDOF water quality inspectors. Although the BMP+ methods were in excess of recommended guidelines, the treatments had been previously implemented on operational forest roads in Virginia and were therefore considered feasible.

2.7. Rainfall Simulation

Three intensities of rainfall simulations were conducted on all three stream crossing types and all three BMP treatments, providing a total of 27 simulations. Water was supplied to a rainfall simulator from a downstream pond using an 18-horsepower centrifugal pump. Water pressure at the pump was maintained at 345 kPa. The pump supplied water to eight 2.5-cm × 3.1-m PVC risers fitted with Wobbler® (Senninger Irrigation, Inc., Clermont, FL, USA, Model #WOB SA-1/2 M) sprinkler heads. The sprinkler heads had interchangeable nozzles that allowed for simulation of three separate rainfall intensities: low (nozzle diameter of 2.38 mm, mean rainfall rate of 1.8 cm·h−1); medium (nozzle diameter of 3.97 mm, mean rainfall rate of 5.5 cm·h−1); and high (nozzle diameter of 5.56 mm, mean rainfall rate of 5.8 cm·h−1). Rainfall rates were dependent upon the nozzle sizes which were chosen to have similar differences in nozzle orifice diameters. Senninger Wobbler sprinkler heads were tested by Kincaid [52] and were found to produce drops with 10.36 and 13.50 J·Kg−1 with 3.16 and 3.12-mm nozzles. Sprinkler risers were arranged to maximize the areal uniformity of rainfall and minimize rainfall application to surrounding areas that were not part of the crossing. Each rainfall simulation was conducted for 30 min. Each sequence of rainfall simulations for a given BMP treatment was completed within one day. Stream stage below the crossing returned to pre simulation levels prior to the initiation of the next rainfall simulation.
At the bridge crossing, the first series (high, then medium, then low intensity) of rainfall simulations was conducted on the BMP− treatment approximately 2 months after construction. The road surface and exposed soil were left bare within the simulation area. The second rainfall simulation series was conducted on the BMP-std treatment, which consisted of the application of geotextile for 20 m on each side of the bridge surface with approximately 5 cm of #357 stone on the entire road running surface within the simulation area. The BMP-std simulation was conducted the same day as the addition of gravel. The final rainfall simulations were conducted on the BMP+ treatment, which was characterized by all bare soil being covered and armored with approximately 30 cm of rip-rap (approximately 10–30 cm stone). The BMP+ rainfall simulations were also conducted within the same day as construction.
For the culvert stream crossing, the initial rainfall simulations were conducted on the BMP− treatment, which consisted of the fully constructed culvert with bare soil on the road surface and fill slopes. The second series of rainfall simulations was applied to the BMP-std treatment, which consisted of the application of #357 rock to the road running surface on top of geotextile. The final treatment that received rainfall simulation, BMP+, consisted of applying rip-rap to the fill slopes as well as the application of grass seed and straw mulch to the bare soil near the road surface and fill slopes (Figure 2). The culvert BMP- rainfall simulations were conducted approximately 2 weeks after construction, the BMP-std rainfall simulations were conducted within a week of gravel application, and the BMP+ rainfall simulations were conducted the day of rip-rap and mulch addition.
For the ford crossing, the first rainfall simulations commenced with the BMP− treatment. For BMP−, the stream banks were angled and smoothed with the backhoe to allow for easier travel through the crossing, and approaches were graded with a bulldozer. BMP− resulted in approximately 50% bare soil due to the native rock fragment. The second series of rainfall simulations was conducted on the BMP-std treatment. The BMP-std treatment did not improve the streambed; however, #357 stone was applied to the running surface of the approaches. The final series of rainfall simulations was conducted on the BMP+ treatment, in which Geo-Web and rock were applied to the stream channel and all bare soil near the crossing was covered with native stone or gravel (Figure 3). The ford BMP− rainfall simulations were conducted one day after construction, BMP-std rainfall simulations were conducted approximately one week after construction, and the BMP+ rainfall simulations were conducted approximately one week after construction.

2.8. Stream Crossing Construction and BMP Implementation Costs

Material, labor, and equipment costs were recorded during the initial construction and subsequent BMP implementation for the bridge (Table 3), culvert (Table 4), and ford (Table 5). Labor and equipment hours were recorded to the nearest half-hour. Labor costs were calculated based on a rate of U.S. $20 h−1. The $20 rate assumes an hourly wage of $13 h−1 with an approximate additional 50% of the wage being attributed to employer costs (i.e., workers’ compensation insurance). Bulldozer and backhoe hourly rates were obtained from local earth-moving contractors in Patrick County, Virginia. Hourly rates include all fuel, maintenance, and lubrication expenses as well as operator wages and transportation costs of equipment. Excavator costs for the bridge construction were based upon the billed hourly rate. The bulldozer and backhoe were owned and operated by the Reynolds Homestead Forest Resources Research Center, while the excavator was a private contractor. The equipment and labor costs are representative of the region; however, each individual landowner or contractor may have slightly different labor and equipment costs based upon location, experience of employees, and equipment variables such as size and age of machines.

2.9. Stream Total Suspended Solids Measurement

TSS were sampled upstream and downstream of all stream crossings during the construction phase and rainfall simulation experiments using ISCO 3700 automatic water samplers. Samplers were placed 20 m upstream and 20 m downstream of the crossing locations, similar to the approach used by Wear et al. [39] for skidder stream crossings in the same region. Sampler intakes were placed near the center of the stream cross section on all crossings both above and below the crossings. During construction, the upstream samplers collected at noon while the downstream samplers collected samples at 30-min intervals from the beginning to the end of construction activities. During rainfall simulations, the upstream samplers collected samples at 10-min intervals, with the first sample being taken at the beginning of the simulation experiment and continuing for 30 min after the rainfall simulation had ceased. These samples were used to determine a baseline TSS level in the stream. The downstream sampler collected samples at 5-min intervals, beginning with the start of the rainfall simulation and continuing for 30 min after rainfall had ceased. Samples were collected at the end of each day and transported to storage. Individual samples were processed similarly to the method outlined by Eaton et al. [53]. Samples were vacuum-filtered through pre-weighed 1.5-micron fiberglass TSS filters. Filters with sediment were dried for 24 h at 105 °C before being weighed. TSS concentration was calculated by subtracting the pre-filter weight from the post-filter weight and dividing by the volume of water filtered.
Stream stage was recorded at upstream and downstream sampling locations utilizing Onset HOBO U20 water pressure and temperature loggers. Data were collected at 1-min intervals during rainfall simulations and 5-min intervals during construction activities. An additional HOBO U20 logger was used to record barometric pressure and correct stage measurements for barometric pressure fluctuations. Stream discharge was determined using through stage-discharge relationships that were calculated by comparing stage measurements with discharge measurements using a salt dilution method [54,55]. Mean discharge measurements at baseflow conditions were used to calculate sediment mass. TSS concentration (mg/L) and stream discharge (L/s) were multiplied to calculate total mass of sediment (mg/s) contributed during construction and rainfall simulation events.
The streams were of similar dimensions, watershed size, land cover, and previous land use. We also monitored the stream sediment levels above and below the proposed crossing for nine months and found similar pretreatment sediment conditions. Within each crossing type, we were constrained to applying the lowest level of treatment before progressing to the next level of BMP treatment. Thus, BMP treatments were not randomized. Rainfall simulations began with the largest nozzles (greatest intensity) followed by the medium and small nozzles.

2.10. Data Analysis

In-stream sediment deliveries were calculated from the stream sediment concentrations collected during and after rainfall simulation events and the stream discharge observed during the times in which the water samples were taken. Studies of this magnitude and expense are not as easily addressed with conventional experimental designs; thus, we have limited our interpretations to analysis of variance (ANOVA) and post-hoc means tests. The data were tested for normality and transformed using a log transformation to allow for ANOVA and the Tukey-Kramer HSD means comparisons tests. Significant differences from the ANOVA were based on α = 0.05. When treatment effects were found to have significant differences, the Tukey-Kramer HSD test [56] was subsequently utilized to separate differences between treatment means (α = 0.05). BMP level (three levels) and error were the sources of variation in the ANOVA. Each BMP level consisted of three rainfall simulations on three crossings with approximately 12 downstream water samples per simulation.

3. Results

3.1. Construction and BMP Costs

3.1.1. Bridge Costs

The bridge installation was completed with 42.5 person-hours of labor, 2 h of bulldozer use, 7.5 h of backhoe use, and 4 h of excavator work. The total cost for the BMP− bridge purchase and installation was $5,368, but it could have been reduced to $5,058 if the gabion baskets had not been used (Table 3). The BMP-std addition of gravel to the road running surface resulted in a cost increase of 5%, while the BMP+ addition of rip-rap resulted in an additional 4% increase in cost. It should be noted that the bridge was installed as a permanent crossing, although the panels are similar to those often used for portable bridges. Thus, these costs represent a permanent haul road bridge crossing.

3.1.2. Culvert Costs

The culvert construction costs totaled $3,568 for the BMP− treatment (Table 4). The addition of geotextile and rock added another $597.50 for the BMP-std treatment, for a total BMP-std treatment cost of $4,165.50. Rip-rap, straw, and seed required for the BMP+ treatment added an additional $430, bringing the total BMP+ cost to $4,595.50. Geotextile was used on the running surface due to the clayey subsoil of the Fairview soil series [50]. Soil with less clay and/or more natural rock may not require geotextile to prevent the gravel from sinking into the running surface. The culvert diameter was necessary for the watershed size and conditions; however, the culvert length could have been reduced if the road vertical alignment and subsequent fill slope ratios had allowed less fill material above the culvert. The reduction of culvert length to 6.1 m would have reduced the initial construction cost by 16% ($565).

3.1.3. Ford Costs

The initial ford construction at the BMP− level required minimal manual labor and equipment and resulted in a cost of only $180 (Table 5). Though this cost was minimal, the ease of travel was not greatly improved, nor did the crossing meet the minimum BMP requirements of the VDOF. The addition of gravel for the BMP-std level increased cost by $240, providing a total construction cost of $420. This treatment level (BMP-std) resulted in a crossing that met the minimum VDOF requirements. Due to the soft streambed, the use of Geo-Web and gravel was required to provide a firm running surface through the stream channel. The labor and materials required for Geo-Web installation totaled $1,483 and brought the total cost for the BMP+ treatment to $1,903. This additional cost for Geo-Web would not have been required if the stream had a solid bottom.

3.2. Total Suspended Sediment

3.2.1. Construction

The construction phase for all three stream crossings increased suspended sediment downstream from the crossing locations; however, the increases varied by two orders of magnitude from the bridge to the two other treatments. Bridge installation produced a total of 0.17 Mg of sediment during the initial construction phase, with no increased sediment introduced during the application of additional BMPs (Table 6). Culvert installation resulted in 12.95 Mg of sediment downstream of the crossing. Culvert installation required excavation of the stream channel to set the culvert at the appropriate depth and backfilling over the culvert with soil. The application of rock to the running surface of the road did not impact the stream; however, the application of rip-rap to the fill slopes resulted in an additional 0.03 Mg of sediment. The BMP− and BMP-std treatments on the ford did not alter the sediment concentration downstream, as both the grading of the banks and application of rock to the road surface were completed with the intent to minimize stream channel disturbance. The installation of the Geo-Web required excavation of the stream channel and resulted in an additional 13.04 Mg of sediment.

3.2.2. Rainfall Simulation

Rainfall simulations on two of the three crossings indicated that sediment loading decreased with increasing BMP level (Table 6). The culvert BMP− treatment produced 3.94 Mg of sediment to the stream channel, while the culvert with BMP+ treatment only produced 0.90 Mg during the three 30-min rainfall simulations. The ford BMP− and BMP+ treatments contributed 5.25 and 1.04 Mg, respectively. The bridge BMP− and BMP+ treatments produced 0.96 and 1.31 Mg, respectively. For both culvert and ford crossings, the BMP− treatment resulted in the greatest total sediment deliveries (3.94 Mg and 5.25 Mg for the culvert and ford crossings, respectively), while the BMP+ treatment resulted in the smallest sediment deliveries (0.90 Mg and 1.04 Mg for the culvert and ford crossings, respectively). Sediment reduction efficiency was calculated by dividing the sediment delivery of a treatment by the treatment with the greatest sediment delivery for each crossing. Sediment reduction efficiency was greatest for culvert and ford BMP+ treatments, with 77% and 80% reductions in sediment delivery, respectively, when compared to the treatment with the greatest sediment production for that crossing.
Although the largest gain was seen by culvert and ford BMP+ treatments, bridge BMP− treatment did result similar sediment delivery as the culvert and ford BMP+ treatments and highlights the effectiveness of bridges as a BMP when compared to other stream crossing methods. Although the bridge BMP-std and BMP+ treatments did not improve sediment reduction efficiencies when only investigating the bridge crossing (−20% and −36%, respectively), sediment production was comparable to ford and culvert BMP+ treatments. Increased sediment with increasing BMPs was due, in part, sediment entering the stream under the bridge panel near the center of the gabion basket abutment. This unforeseen source of sediment increased sediment levels with increased BMPs. However, the mass of sediment produced was much less than that of the culvert and ford crossings due to the channel disturbance associated with the culvert and ford crossings.
Sediment concentration of each crossing was influenced by the intensity and duration of the rainfall simulation. Sediment concentrations start with low sediment levels at the initiation of rainfall, peak approximately 15 to 30 min into the rainfall simulations, and again decrease to the baseline levels. Ford and culvert crossings showed a decrease in total sediment delivery with increasing levels of BMPs (i.e., BMP− to BMP-std to BMP+), while the bridge showed little change through all levels of BMPs (Figure 4).
All crossing and rainfall data were pooled and an analysis of variance of BMP levels was conducted on the pooled data. BMP levels were found to have significant differences (p < 0.001), with the BMP− treatment producing more sediment than the BMP-std and BMP+ treatments. A post-hoc Tukey-Kramer HSD test showed that the mean sediment delivery per sampling period for the BMP− treatment (0.105 Mg) was significantly different than those for the BMP-std (0.015 Mg) and BMP+ (0.035 Mg) treatments. This difference among BMP treatments was found while considering all crossings and all rainfall simulation levels.

3.3. Sediment Reduction Efficiency

To investigate the benefit-cost relationship between crossing structures, BMPs, and sediment reduction, sediment reduction efficiency and associated cost-effectiveness ratios were calculated. The sediment reduction efficiency is the difference between the sediment delivery value of the treatment with the largest sediment delivery and the sediment delivery value of the treatment under consideration. Initial construction costs were all included. The cost-effectiveness ratio is provided in U.S. dollars (2014) per Mg of sediment prevented ($ Mg1). The values include the total construction and BMP application costs (Table 7). The treatment with the cheapest cost-effectiveness was the ford BMP-std treatment, $124 Mg1 of prevented sediment when compared to the culvert BMP− treatment. Comparisons of the cost-effectiveness within individual crossings also indicated that the cheapest cost-effectiveness ratio was produced by the ford BMP-std treatment. The difference in cost between the worst treatment and the treatment under consideration was used to calculate the cost-effectiveness. For culvert and ford crossings, sediment delivery decreased with increased BMPs. However, the bridge with BMP+ resulted in a 0.35 Mg increase in sediment delivery. This increase in sediment delivery resulted in negative sediment reduction and negative cost-effectiveness values when only the bridge crossing was investigated. When all crossings were investigated, the bridge BMP-std and BMP+ treatments showed decreases in sediment compared to the ford BMP−; however, the cost-effectiveness was several hundred dollars greater than for other treatments.

4. Discussion

The rainfall simulation allowed for erosion from the stream crossing structure to be separated from erosion that would have originated upslope of the crossing on the road approach, fulfilling the need for separation of upslope road approaches and stream crossing structures described by Taylor et al. [36]. Brown et al. [33] used rainfall simulation in a companion study to evaluate BMP level and sediment delivery from the approaches on the same road as this study and concluded that gravelling either half or the total approach reduced sediment delivery from the approaches by two- to sevenfold. Although the sediment from stream crossings was observed without input from the upslope road approach, the areas within the stream crossing structure as defined by Lane and Sheridan [48] were not distinguishable, and sediment that originated on the road surface could not be differentiated from sediment that originated on a fill slope or other area.
Initial construction of the bridge was costly due to increased labor required to prepare abutments and material costs of gabion baskets and geotextile used due to site specific characteristics. Removal of these items could reduce the material cost by $610 and likely reduce labor by several hours. The bridge material cost after removing gabion baskets is similar to costs reported by McKee et al. [41] for panel bridges in the Virginia Piedmont ($3152). However, the reported $246 installation cost is approximately 14% of the $1678 bridge installation cost recorded. This could be due to extra labor required for gabion basket installation as well as cost recording methods by logging contractors in the McKee et al. [41] survey.
A more likely reason for the differences in costs is because a majority of stream crossings reported by McKee et al. [41] were for temporary skidder bridges that are simply placed across the stream with a skidder. Our costs are more similar to those reported for permanent roads using a constructed stringer bridge ($10,147) and a three-panel wooden bridge ($5557) reported by Visser et al. [42]. Haul road crossings, even those that use panel bridges, often require more work on abutments and careful placement of panels, so additional costs are expected. Use of onsite equipment may reduce the recorded bridge installation cost if the logger only reported fuel and labor required to install the bridge rather than contractor rates, which would include ownership and transportation charges.
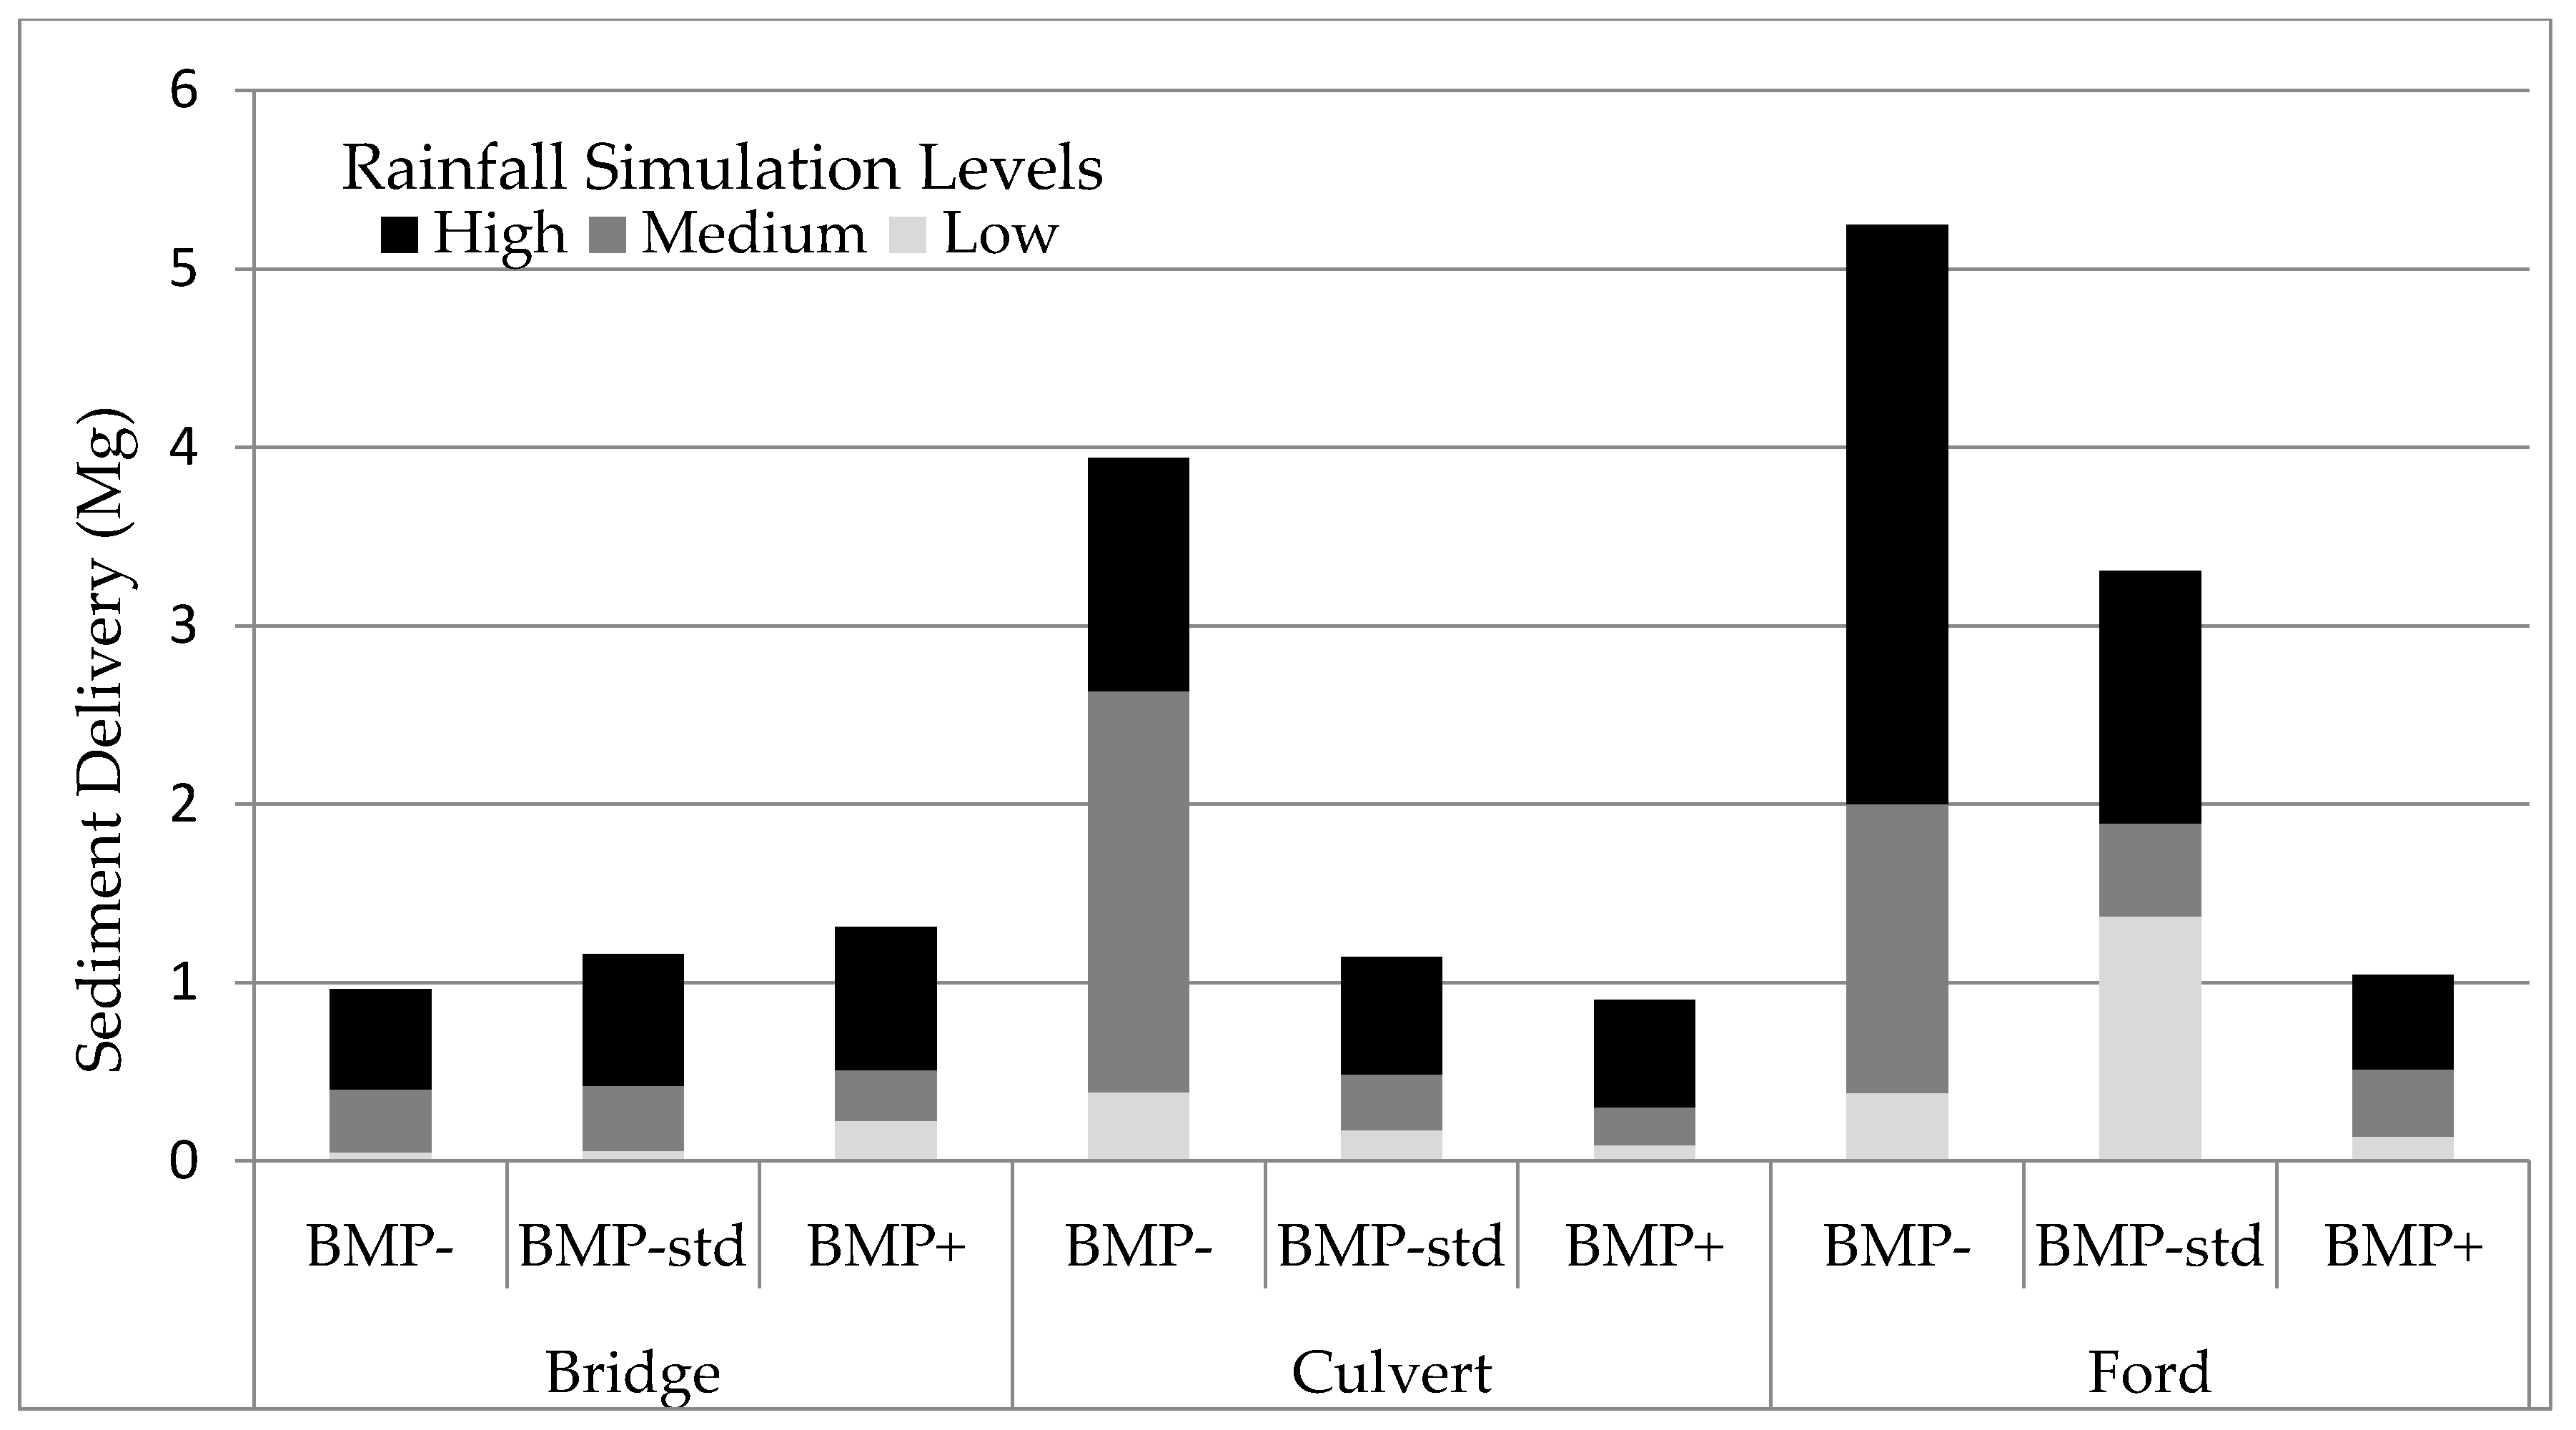
The construction phase of culvert with BMP− treatment required channel excavation, while the bridge crossing did not require excavation and the ford did not require excavation until the BMP+ treatment. Initial construction and the culvert BMP− treatment produced more sediment than the ford or bridge crossings during initial construction and BMP− treatments. These findings are similar to the negative downstream water quality impacts from culverts noted by Aust et al. [38] as well as the decreased downstream sediment from bridge construction compared to a culvert crossing [37]. Geo-Web installation at the ford crossing required excavating the streambed and resulted in sediment delivery similar to the culvert crossing construction phase, which also required channel excavation. Total sediment production, including construction, was lowest for the bridge, due to the lack of disturbance to the stream channel. Channel excavation during installation of the culvert and upgrade of the ford crossing introduced a large pulse of sediment into the stream. In addition to sediment from channel excavation, increased water velocity downstream of a culvert can have stream scour impacts [57] as well as issues for fish passage [58].
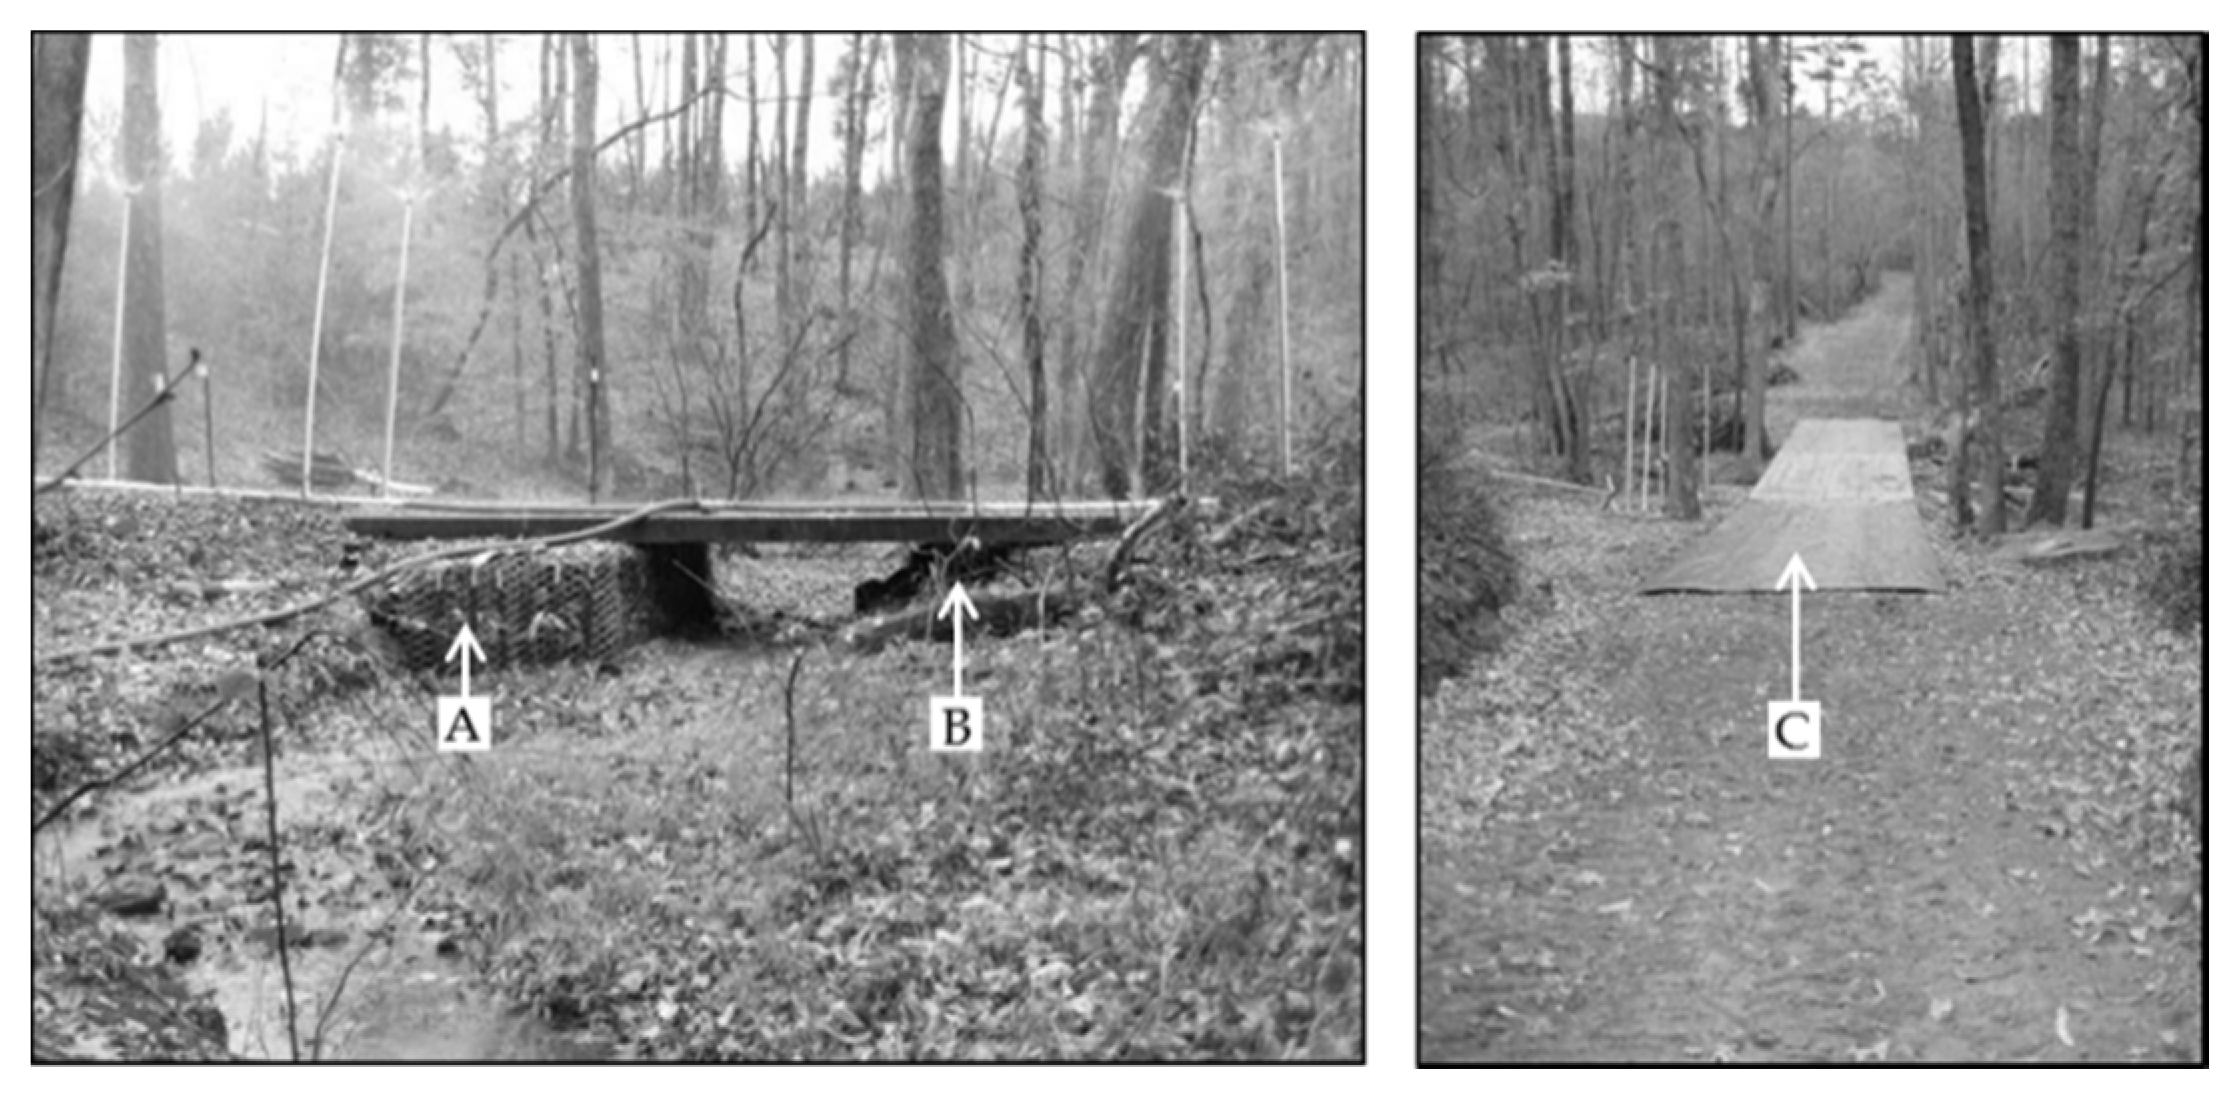
The bridge crossing showed increases in sediment with increased BMP application. During experiments, visual observations of the stream channel under the bridge panels indicated a large sediment source which entered the stream under the centerline of the bridge behind the gabion baskets. The rock beneath the bridge panel or a soil pipe, which developed while removing stumps, could be responsible for the sediment traveling from the road surface under the bridge panel and through the gabion. This sediment source may be responsible for increased sediment as BMP levels increased. Sediment entering the channel beneath the bridge panel from the gabion was the only sediment entrance point, which was visually observable during the rainfall simulations.
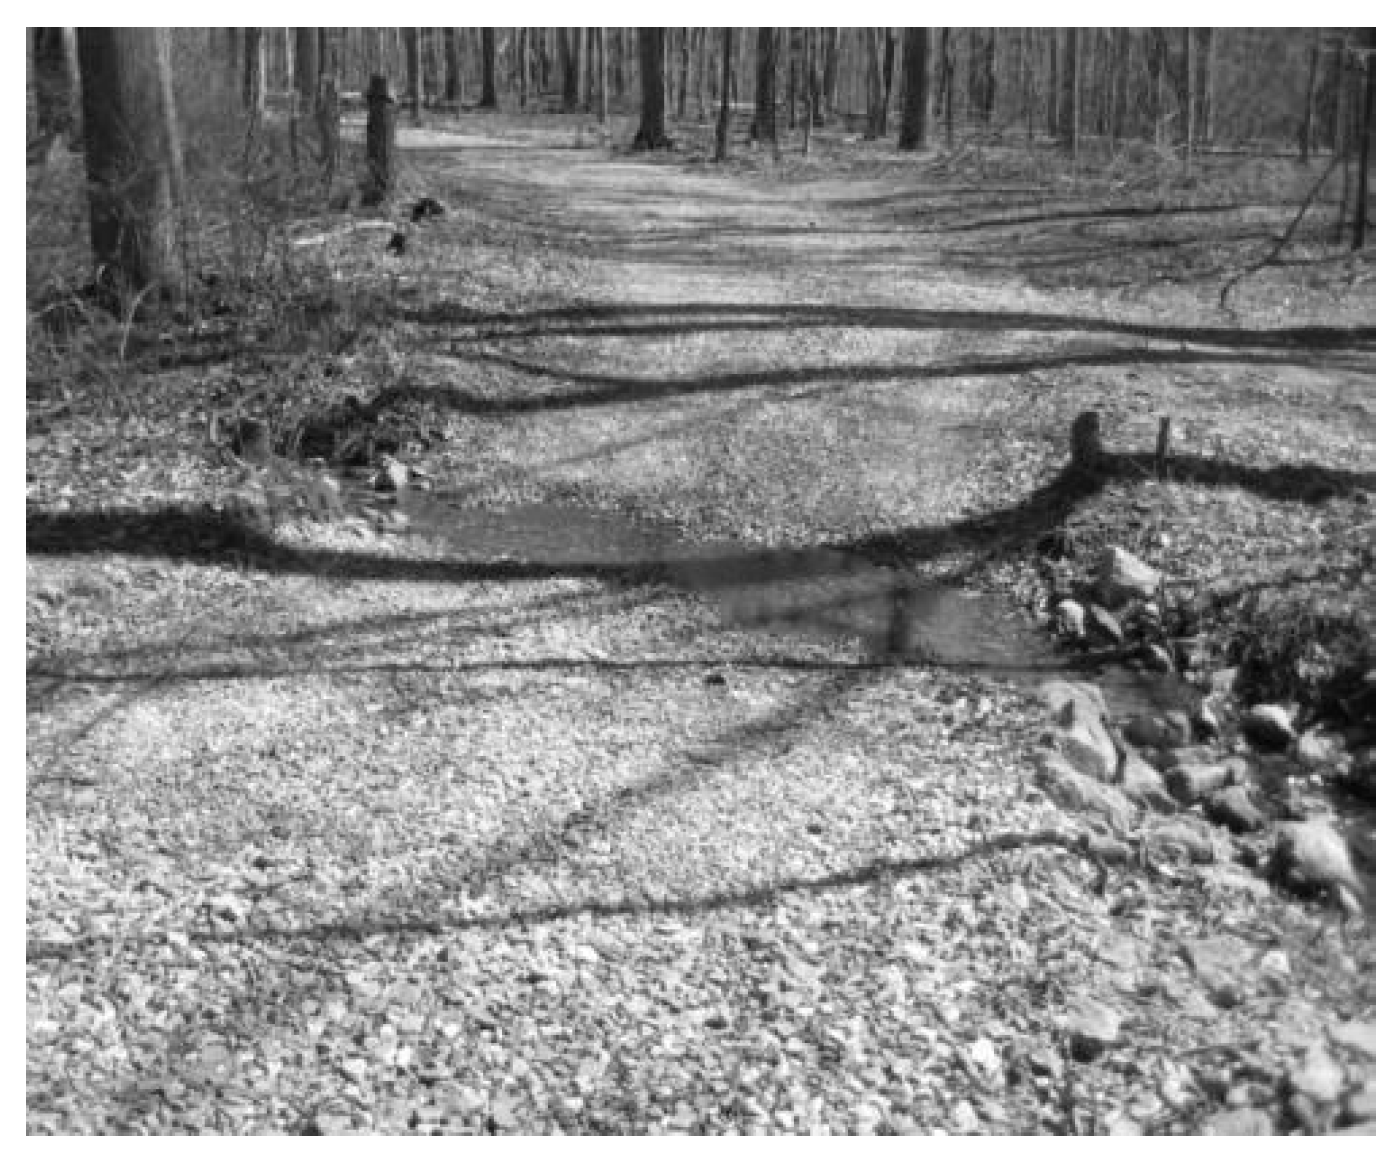
The medium rainfall intensity simulation on the culvert BMP− treatment caused a small pool to develop between the fill slope and the abandoned road. During culvert rainfall simulations, the small soil barrier that was holding the pool was overtopped and allowed the small pool to drain directly into the channel, increasing the sediment loading at that point. Visual observations suggested that this increase in sediment concentration was only present during and immediately after the break in the soil barrier. Although the pool was an unforeseen problem with the initial construction and was not a designed portion of the treatment, similar instances may occur for other such crossings.
BMPs used in this study were effective at reducing sediment delivery and reinforce the findings of previous BMP studies [21,22,23,24,39,41]. For all three stream crossings, peak sediment delivery occurred later than the BMP− treatment with increased BMP levels, suggesting that they are effective at slowing or reducing overland flow. Altered overland flow could be due to increased surface roughness, depression storage, and changes in infiltration rates. There is evidence that BMPs are effective at reducing stream sedimentation on the culvert and ford crossings when the BMP−, BMP-std, and BMP+ treatments for all crossings were compared, while the mere use of a bridge stream crossing is an excellent BMP. Significant differences were found between the BMP− level and the BMP-std and BMP+ levels when all crossings were combined. The combined results suggest that the application of BMPs will reduce stream sedimentation, and the application of additional BMPs may further reduce stream sediment levels.
Reduction of in-stream sediment with increased BMPs is similar to findings of other studies for skid trail erosion [24,31] and haul road stream crossing approaches [33,34]. The BMP+ treatment in this study was designed to minimize bare soil and to armor as much disturbed soil as practically possible. Soil disturbance was found to alter the effectiveness of stream crossing approach BMPs [33] when the equipment used for the road surfacing BMP treatment left large ruts in the roadway due to muddy conditions. In these cases, BMPs were effective unless there was substantial soil disturbance in an area that could drain to the stream channel. A lack of water control structures on a stream approach may increase the volume of water flowing onto and over a crossing structure, which could increase soil erosion and possibly sedimentation.
Increased levels of BMPs resulted in decreased sediment delivery on the culvert and ford crossings, with the BMP+ treatment resulting in the greatest sediment reduction efficiency. The BMP-std treatment for the ford resulted in the best BMP cost-effectiveness ratio ($124 Mg1 of sediment reduced), followed by the ford BMP+ treatment ($410 Mg1 of sediment reduced), and the culvert BMP-std treatment ($972 Mg1 of sediment reduced). The bridge BMP− treatment resulted in a cost-effectiveness ($1,221 Mg1 of sediment reduced) similar to that of the culvert BMP+ treatment ($1,016 Mg1 of sediment reduced), suggesting that the bridge crossing type may be an appropriate BMP for crossing locations in which a bridge can be properly installed. For all three crossings, lower levels of BMPs resulted in decreased costs when compared to BMP+ treatments; however, the level of sediment delivery from the BMP- treatment may not be acceptable.
Due to the progression of rainfall simulations from the lowest level of BMP implementation to the highest, it is possible that erosion rates could have decreased due to time since disturbance as well as increased erosion protection measures. In addition, these experiments were designed to test BMP treatments immediately following construction activities. Increased time since disturbance would likely result in increased vegetative and organic matter cover through grass germination and leaf fall from the surrounding hardwood forest. This increased cover, coupled with increased stability, will likely alter erosion rates into the future.

5. Conclusions

Channel disturbances during construction increased downstream sediment concentrations, and the only stream crossing treatment that consistently minimized in-stream disturbances was the bridge treatment. The bridge produced the least stream sediment during construction, but it was the most expensive treatment considered in this study. However, the cost per use of a bridge is reduced when portable temporary bridges are used. The bridge treatment alone (BMP−) was still a better BMP option than the other stream crossings tested for minimizing in-stream sediment concentrations.
Increased levels of BMPs were associated with decreased stream sediment for ford and culvert stream crossings. However, in some cases, increased costs associated with higher levels of BMPs for the crossings were growing at a greater rate than the sediment reduction. In situations where funds are limited, it might be more beneficial to target the larger sediment problems first. For example, BMPs applied to the culvert were more beneficial than those applied to the bridge.
Each crossing type has unique advantages and disadvantages, and downstream sediment can be acceptable below all types of crossings as long as appropriate location and erosion control measures are utilized. Further research that can identify which portions of a crossing structure pose the greatest risk for erosion could further improve cost-effectiveness of BMPs by focusing efforts on areas with greatest risk. Individual site characteristics may warrant installation of one crossing over another. In these cases, landowners and managers must determine which crossing best fits their needs and budgets and then apply appropriate BMPs.

Acknowledgments

This project received logistical and financial support from the Virginia Department of Forestry, the U.S. Department of Agriculture National Needs Fellowship, the National Council for Air and Stream Improvement, the Virginia Tech Reynolds Homestead Forest Resources Research Center, the McIntire-Stennis Program of the National Institute of Food and Agriculture, the U.S. Department of Agriculture, the Virginia Tech Forest Operations and Business Research Cooperative, and the Virginia Tech Department of Forest Resources and Environmental Conservation. The authors also acknowledge the Virginia Tech Open Access Subvention Fund for supporting this work.

Author Contributions

Brian C. Morris was the graduate student who collected and analyzed field data and prepared the manuscript. M. Chad Bolding was his graduate advisor, who oversaw the study design and structure of the manuscript while reviewing multiple versions. W. Michael Aust served as a graduate committee member and provided guidance on the study design and data analysis, and reviewed several versions of the manuscript. Kevin J. McGuire, Erik B. Schilling and Jay Sullivan served as graduate committee members, advised the student, and edited several versions of the manuscript.

Conflicts of Interest

The authors declare no conflict of interest.

References

  1. Patric, J.H. Soil erosion in the eastern forest. J. For. 1976, 74, 671–677. [Google Scholar]
  2. Yoho, N.S. Forest management and sediment production in the south—A review. South. J. Appl. For. 1980, 4, 27–36. [Google Scholar]
  3. Kochenderfer, J.N.; Helvey, J.D. Using gravel to reduce soil losses from minimum-standard forest roads. J. Soil Water Conserv. 1987, 42, 46–50. [Google Scholar]
  4. Binkley, D.; Brown, T.C. Forest practices as nonpoint sources of pollution in North America1. J. Am. Water Resour. Assoc. 1993, 29, 729–740. [Google Scholar] [CrossRef]
  5. Lakel, W.A.; Poirot, M. Silvicultural Best Management Practices Implementation Monitoring for Virginia, 2012; Virginia Department of Forestry: Charlottesville, VA, USA, 2013. [Google Scholar]
  6. Megahan, W.F. Logging, erosion, sedimentation—Are they dirty words? J. For. 1972, 70, 403–407. [Google Scholar]
  7. Croke, J.; Mockler, S. Gully initiation and road-to-stream linkage in a forested catchment, southeastern Australia. Earth Surf. Process. Landf 2001, 26, 205–217. [Google Scholar] [CrossRef]
  8. Croke, J.; Mockler, S.; Fogarty, P.; Takken, I. Sediment concentration changes in runoff pathways from a forest road network and the resultant spatial pattern of catchment connectivity. Geomorphology 2005, 68, 257–268. [Google Scholar] [CrossRef]
  9. Surfleet, C.G. Road runoff and sediment sampling for determining road sediment yield at the watershed scale. Can. J. For. Res. 2011, 41, 1970–1980. [Google Scholar] [CrossRef]
  10. Trimble, G.R.; Sartz, R.S. How far from a stream should a logging road be located? J. For. 1957, 55, 339–341. [Google Scholar]
  11. Kochenderfer, J.N. Erosion Control on Logging Roads in the Appalachians; USDA Forest Service Northeastern Forest Experiment Station: Upper Darby, PA, USA, 1970. [Google Scholar]
  12. Douglass, J.E.; Swank, W.T. Streamflow Modifications through Management of Eastern Forests; USDA Forest Service Southeastern Forest Experiment Station: Asheville, NC, USA, 1972. [Google Scholar]
  13. Ursic, S.J. Hydrologic effects of clearcutting and stripcutting loblolly pine in the coastal plain. J. Am. Water Resour. Assoc. 1991, 27, 925–937. [Google Scholar] [CrossRef]
  14. Beschta, R.L. Long-term patterns of sediment production following road construction and logging in the Oregon coast range. Water Resour. Res. 1978, 14, 1011–1016. [Google Scholar] [CrossRef]
  15. Reid, L.M.; Dunne, T. Sediment production from forest road surfaces. Water Resour. Res. 1984, 20, 1753–1761. [Google Scholar] [CrossRef]
  16. Kennedy, A.M. Decker v. Northwest Environmental Defense Center. 133 S. Ct. 1326, 568 U.S., 185 L. Ed. 2d 447; Supreme Court of the United States: Washington, DC, USA, 2013.
  17. Anderson, C.; Lockaby, B. Research gaps related to forest management and stream sediment in the United States. Environ. Manag. 2011, 47, 303–313. [Google Scholar] [CrossRef] [PubMed]
  18. Boston, K. Impact of the ninth circuit court ruling (Northwest Environmental Defense Center v. Brown) regarding forest roads and the Clean Water Act. J. For. 2012, 110, 344–346. [Google Scholar] [CrossRef]
  19. Loehle, C.; Wigley, T.B., Jr.; Lucier, A., Jr.; Schilling, E.; Danehy, R.J.; Ice, G. Toward improved water quality in forestry: Opportunities and challenges in a changing regulatory environment. J. For. 2014, 112, 41–47. [Google Scholar] [CrossRef]
  20. Aust, W.M.; Shaffer, R.M.; Burger, J.A. Benefits and costs of forestry best management practices in virginia. South. J. Appl. For. 1996, 20, 23–29. [Google Scholar]
  21. Aust, W.M.; Blinn, C.R. Forestry best management practices for timber harvesting and site preparation in the eastern United States: An overview of water quality and productivity research during the past 20 years (1982–2002). Water Air Soil Pollut. Focus 2004, 4, 5–36. [Google Scholar] [CrossRef]
  22. Arthur, M.A.; Coltharp, G.B.; Brown, D.L. Effects of best management practices on forest streamwater quality in eastern Kentucky. J. Am. Water Resour. Assoc. 1998, 34, 481–495. [Google Scholar] [CrossRef]
  23. Ice, G.G.; Schilling, E.G.; Vowel, J.G. Trends for forestry best management practices implementation. J. For. 2010, 108, 267–273. [Google Scholar]
  24. Wade, C.R.; Bolding, M.C.; Aust, W.M.; Lakel, W.A. Comparison of five erosion control techniques for bladed skid trails in Virginia. South. J. Appl. For. 2012, 36, 191–197. [Google Scholar] [CrossRef]
  25. Cristan, R.; Aust, W.M.; Bolding, M.C.; Barrett, S.M.; Munsell, J.F.; Schilling, E. Effectiveness of forestry best management practices in the United States: Literature review. For. Ecol. Manag. 2016, 360, 133–151. [Google Scholar] [CrossRef]
  26. Ice, G.G.; Stuart, G.W.; Waide, J.B.; Irland, L.C.; Ellefson, P.V. Twenty-five years of the Clean Water Act: How clean are forest practices? J. For. 1997, 95, 9–13. [Google Scholar]
  27. Aust, W.M.; Bolding, M.C.; Barrett, S.M. Best management practices for low-volume forest roads in the piedmont region. J. Transport. Res. Board 2015, 2472, 51–55. [Google Scholar] [CrossRef]
  28. Grace, J.M.; Rummer, B.; Stokes, B.J.; Wilhoit, J. Evaluation of erosion control techniques on forest roads. Trans. ASABE 1998, 4, 383–391. [Google Scholar] [CrossRef]
  29. Rothwell, R.L. Erosion and sediment control at road-stream crossings. For. Chron. 1983, 59, 62–66. [Google Scholar] [CrossRef]
  30. Megahan, W.F.; Wilson, M.; Monsen, S.B. Sediment production from granitic cutslopes on forest roads in Idaho, USA. Earth Surf. Process. Landf. 2001, 26, 153–163. [Google Scholar] [CrossRef]
  31. Sawyers, B.C.; Bolding, M.C.; Aust, W.M.; Lakel, W.A. Effectiveness and implementation costs of overland skid trail closure techniques in the Virginia piedmont. J. Soil Water Conserv. 2012, 67, 300–310. [Google Scholar] [CrossRef]
  32. Swift, L.W. Gravel and grass surfacing reduces soil loss from mountain roads. For. Sci. 1984, 30, 657–670. [Google Scholar]
  33. Brown, K.R.; Aust, W.M.; McGuire, K.J. Sediment delivery from bare and graveled forest road stream crossing approaches in the Virginia piedmont. For. Ecol. Manag. 2013, 310, 836–846. [Google Scholar] [CrossRef]
  34. Brown, K.R.; McGuire, K.J.; Aust, W.M.; Hession, W.C.; Dolloff, C.A. The effect of increasing gravel cover on forest roads for reduced sediment delivery to stream crossings. Hydrol. Process. 2015, 29, 1129–1140. [Google Scholar] [CrossRef]
  35. Edwards, P.J.; Williard, K.W.J. Efficiencies of forestry best management practices for reducing sediment and nutrient losses in the eastern United States. J. For. 2010, 108, 245–249. [Google Scholar]
  36. Taylor, S.E.; Rummer, R.B.; Yoo, K.H.; Welch, R.A.; Thompson, J.D. What we know—And don’t know—About water quality at stream crossings. J. For. 1999, 97, 12–17. [Google Scholar]
  37. Thompson, J.D.; Taylor, S.E.; Yoo, K.H.; Brinker, R.; Tufts, R.A. Water Quality Impacts from Different Road Stream Crossings. In Proceedings of the Council on Forest Engineering: Sustainability, Forest Health, and Meeting the Nations Needs For Wood Products, Cashiers, NC, USA, 5–8 June 1995.
  38. Aust, W.M.; Carroll, M.B.; Bolding, M.C.; Dolloff, C.A. Operational forest stream crossings effects on water quality in the Virginia piedmont. South. J. Appl. For. 2011, 35, 123–130. [Google Scholar]
  39. Wear, L.R.; Aust, W.M.; Bolding, M.C.; Strahm, B.D.; Dolloff, C.A. Effectiveness of best management practices for sediment reduction at operational forest stream crossings. For. Ecol. Manag. 2013, 289, 551–561. [Google Scholar] [CrossRef]
  40. Nolan, L.; Aust, W.M.; Barrett, S.M.; Bolding, M.C.; Brown, K.; McGuire, K. Estimating costs and effectiveness of upgrades in forestry best management practices for stream crossings. Water 2015, 7, 6946–6966. [Google Scholar] [CrossRef]
  41. McKee, S.E.; Shenk, L.A.; Bolding, M.C.; Aust, W.M. Stream crossing methods, costs, and closure best management practices for Virginia loggers. South. J. Appl. For. 2012, 36, 33–37. [Google Scholar] [CrossRef]
  42. Visser, R.; Aust, W.M.; Gallagher, T.; Roberts, T.; Poirot, M. Cost of six different stream crossing options in the Appalachian area. South. J. Appl. For. 2003, 27, 66–70. [Google Scholar]
  43. Conrad, J.L.; Ford, W.S.; Groover, M.C.; Bolding, M.C.; Aust, W.M. Virginia Tech forest road and bladed skid trail cost estimation method. South. J. Appl. For. 2012, 36, 26–32. [Google Scholar] [CrossRef]
  44. Mendoza, C.; Abt, S.R.; Ruff, J.F. Headwall influence on scour at culvert outlets. J. Hydraul. Eng. 1983, 109, 1056–1060. [Google Scholar] [CrossRef]
  45. Lim, S.Y. Scour below unsubmerged full-flowing culvert outlets. Proc. Inst. Civ. Eng. Water Marit. Energy 1995, 112, 136–149. [Google Scholar]
  46. Lakel, W.A.; Aust, W.M.; Bolding, M.C.; Dolloff, C.A.; Keyser, P.; Feldt, R. Sediment trapping by streamside management zones of various widths after forest harvest and site preparation. For. Sci. 2010, 56, 541–551. [Google Scholar]
  47. Lang, A.J.; Aust, W.M.; Bolding, M.C.; Barrett, S.M.; McGuire, K.J.; Lakel, W.A. Streamside management zones compromised by stream crossings, legacy gullies, and over-harvest in the Piedmont. J. Am. Water Resour. Assoc. 2015, 51, 1153–1164. [Google Scholar] [CrossRef]
  48. Lane, P.N.J.; Sheridan, G.J. Impact of an unsealed forest road stream crossing: Water quality and sediment sources. Hydrol. Process. 2002, 16, 2599–2612. [Google Scholar] [CrossRef]
  49. Fletcher, W.A. Northwest Environmental Defense Center v. Brown; No. 07-35266; United States Court of Appeals for the Ninth District: Portland, OR, USA, 2011; p. 44. [Google Scholar]
  50. Natural Resource Conservation Service. Web Soil Survey 2016. Available online: http://websoilsurvey.sc.egov.usda.gov/App/HomePage.htm (accessed on 15 January 2016.).
  51. Virginia Department of Forestry. Virginia's Forestry Best Management Practices for Water Quality; Virginia Department of Forestry: Charlottesville, VA, USA, 2009.
  52. Kincaid, D.C. Spraydrop kinetic energy from irrigation sprinklers. Trans. ASABE 1996, 36, 847–853. [Google Scholar] [CrossRef]
  53. Eaton, A.D.; Clesceri, L.S.; Rice, E.W.; Greenberg, A.E.; Franson, M.H. Total Suspended Solids Dried at 103–105 C. Standard Methods for the Examination of Water and Wastewater; American Public Health Association: Washington, DC, USA, 2005. [Google Scholar]
  54. Moore, R. Introduction to salt dilution gauging for streamflow measurement: Part 1. Streamline Watershed Manag. Bull. 2004, 7, 20–23. [Google Scholar]
  55. Moore, R.D.D. Slug injection using salt in solution. Streamline Watershed Manag. Bull. 2005, 8, 1–6. [Google Scholar]
  56. Zar, J.H. Biostatistical Analysis, 4th ed.; Prentice Hall: Upper Saddle River, NJ, USA, 1999. [Google Scholar]
  57. Abt, S.R.; Kloberdanz, R.L.; Mendoza, C. Unified culvert scour determination. J. Hydraul. Eng. 1984, 110, 1475–1479. [Google Scholar] [CrossRef]
  58. Warren, M.L.; Pardew, M.G. Road crossings as barriers to small-stream fish movement. Trans. Am. Fish. Soc. 1998, 127, 637–644. [Google Scholar] [CrossRef]
Figure 1. Left: Bridge during rainfall simulation on best management practice (BMP+) treatment with gabion basket (A) as an abutment (left of stream) with the native slope as the opposite abutment (B) and the road running surface and bare soil rocked; Right: Bridge prior to application of rock over the geotextile fabric (C) on the running surface of the road (BMP-std); picture shows geotextile prior to rock application which completed the BMP-std treatment.
Water 08 00092 g001
Figure 2. Left: Culvert after installation and during BMP− rainfall simulation; Right: Culvert prior to BMP+ rainfall simulation with rocked running surface and fill slopes and seed and mulch on bare soil.
Water 08 00092 g002
Figure 3. Ford crossing with BMP+ treatment, including rocked running surface and Geo-Web in the channel.
Water 08 00092 g003
Figure 4. Total sediment delivery (Mg) during the 50-min period beginning with initiation of the 30-min rainfall simulation and for 20 min after completion of rainfall simulation by crossing and BMP level.
Water 08 00092 g004
Table 1. Stream characteristics by crossing structure installed. Watershed area measured from crossing location. Stream slope, bankfull width, and depth measured immediately upstream of installed crossing location. All three crossing locations had a streambed slope of 2%. Streambed material composition based on 40 bed material samples.
CrossingWatershed Area (ha)Bankfull Width (m)Bankfull Depth (m)Bed Material
Silt/Clay (%)Sand (%)Gravel (%)Cobble (%)Boulder (%)
Bridge40.42.650.2810.027.545.017.50.0
Culvert17.02.290.167.525.042.525.00.0
Ford32.43.410.267.319.546.319.57.3
Table 2. BMP treatment description by crossing type. Rock on road surface is #357 (1.90–2.54 cm) stone; rock in stream bed (used in Geo-Web) is VDOT #5 (1.25–5 cm) stone; and rock on fill slopes is #3-0 (approximately 10–30 cm) stone.
Stream CrossingBMP−BMP-stdBMP+
Fordsloped banks bare road surface bare fillsloped banks rocked road surface rocked fillGeo-Web rocked stream bed rocked road surface rocked fill
Culvertbare road surface bare fillrocked road surface bare fillrocked road surface rocked fill mulch seed
Bridgebare road surface bare fillrocked road surface bare fillrocked road surface rocked fill
Table 3. Crossing and BMP construction materials and costs required for construction of a wood panel bridge.
BMP LevelMaterialsQuantityCost/UnitTotal Cost
BMP−Bridge1$2,325$2,325
Bridge transportation (h)7$85$595
Gabion basket (0.9 × 2.7 m)2$95$190
Gabion basket (0.3 × 2.7 m)2$60$120
Geo-textile (m)12.2$1.50$60
Rock 3-0s (Mg)13.6$22.10$300
Rock VDOT #5 (Mg)4.5$22.10$100
Excavator (h)4$85$340
Labor (h)42.5$20$660
Bulldozer (h)2$95 1$190
Backhoe (h)7.5$65 1$488
BMP− Application Total (including bridge purchase)$5,368
BMP-stdLabor (h)2$20$40
Geo-textile (m)30.5$4.92$150
Rock VDOT #5 (Mg)4.5$22.10$100
BMP-std Additional Application Total$290
BMP-std Application Total (including BMP−)$5,658
BMP+Labor5$20$100
Rock 3-0s (Mg)4.5$22.10$100
BMP+ Application Total$200
Bridge Installation with BMP+ Total Cost$5,858
Note: 1 Bulldozer and backhoe costs are hourly rates for local contractors in Patrick County, VA, USA.
Table 4. Crossing and BMP construction materials and costs required for installation of a culvert on a 17-ha watershed.
BMP LevelMaterialsQuantityCost/UnitTotal Cost
BMP−Culvert (6.1 m)2$565$1,130
Labor (h)19.5$20$390
Bulldozer (h)13$95 1$1,235
Backhoe (h)12.5$65 1$813
BMP− Application Total (including installation)$3,568
BMP-stdLabor (h)2$20$40
Geo-textile (m)32$4.94$158
Rock #357 (Mg)18.1$22.10$400
BMP-std Application Addition Total$598
BMP-std Application Total$4,166
BMP+Labor (h)5$20$100
Straw (bales)5$10$50
Seed (22.7-kg bags)2$40$80
Rock 3-0s (Mg)9.1$22.10$200
BMP+ Application Total$430
Total Construction plus BMP Cost$4,595
Note: 1 Bulldozer and backhoe costs are hourly rates for local contractors in Patrick County, VA, USA.
Table 5. Crossing materials and costs for construction of an improved ford stream crossing using Geo-Web.
BMP LevelMaterialsQuantityCost/UnitTotal Cost
Labor (h)1$20$20
Bulldozer (h)1$95 1$95
Backhoe (h)1$65 1$65
BMP− Application Total$180
BMP-stdLabor (h)2$20$40
Rock #357 (Mg)9.0$22.10$200
BMP-std Application Addition Total$240
BMP-std Application Total$420
BMP+Labor (h)21$20$420
Geo-Web (0.15 m × 3.6 m × 4.6 m)1$277.90$278
Backhoe (h)9$65 1$585
Rock VDOT #5 (Mg)9$22.10$200
BMP+ Application Total$1,483
Total Construction plus BMP Cost$1,903
Note: 1 Bulldozer and backhoe costs are hourly rates for local contractors in Patrick County, VA, USA.
Table 6. Total sediment delivery by crossing and BMP level during rainfall simulations and sediment reduction efficiency by BMP level for each crossing.
CrossingBMP LevelSediment Delivery during Construction and by Rainfall IntensitySediment Reduction Efficiency 1
Construction SedimentLow RainMedium RainHigh RainTotal SedimentBMPs 2
Mg%
BridgeBMP−0.170.050.350.560.960
BMP-std00.060.360.741.16−20
BMP+00.220.280.801.31−36
CulvertBMP−12.950.392.251.313.940
BMP-std00.170.310.661.1471
BMP+0.030.090.210.600.9077
FordBMP−00.381.623.255.250
BMP-std01.370.521.413.3137
BMP+13.040.140.370.531.0480
Note: 1 Sediment reduction efficiency is defined as the ratio between the sediment delivery of a given treatment divided by the treatment with the greatest sediment delivery (i.e., Culvert (BMP−)—Culvert (BMP+)/Culvert (BMP−) = Culvert (BMP+) Sediment Reduction Efficiency); 2 BMP Sediment Reduction Efficiency compares each treatment within a crossing type.
Table 7. Crossing and BMP costs and sediment production with associated cost-effectiveness ratio for sediment reduction (U.S. $·Mg1 of sediment prevented).
Crossing and BMP Level Cost and Sediment Production for Construction and All Levels of RainfallBMP Cost-Effectiveness by CrossingCrossing and BMP Efficiency (All Crossings/BMP Levels)
CrossingBMP LevelBMP Cost ($)Total Cost ($)MgMg Prevented$·Mg−1Mg Prevented$·Mg−1
BridgeBMP−536853680.96------4.281211
BMP-std29056581.16−0.19−1,4954.091340
BMP+20058581.31−0.35−1,4103.941443
CulvertBMP−356835683.94------1.312590
BMP-std59841661.142.792144.10972
BMP+43045960.903.043384.341016
FordBMP−1801805.25------------
BMP-std2404203.311.941241.94124
BMP+148319031.044.204104.20410

