
Assessment of the Impacts of Global Climate Change and Regional Water Projects on Streamflow Characteristics in the Geum River Basin in Korea


Abstract
:1. Introduction
2. Materials and Methodology
2.1. Climate Model and Scenarios
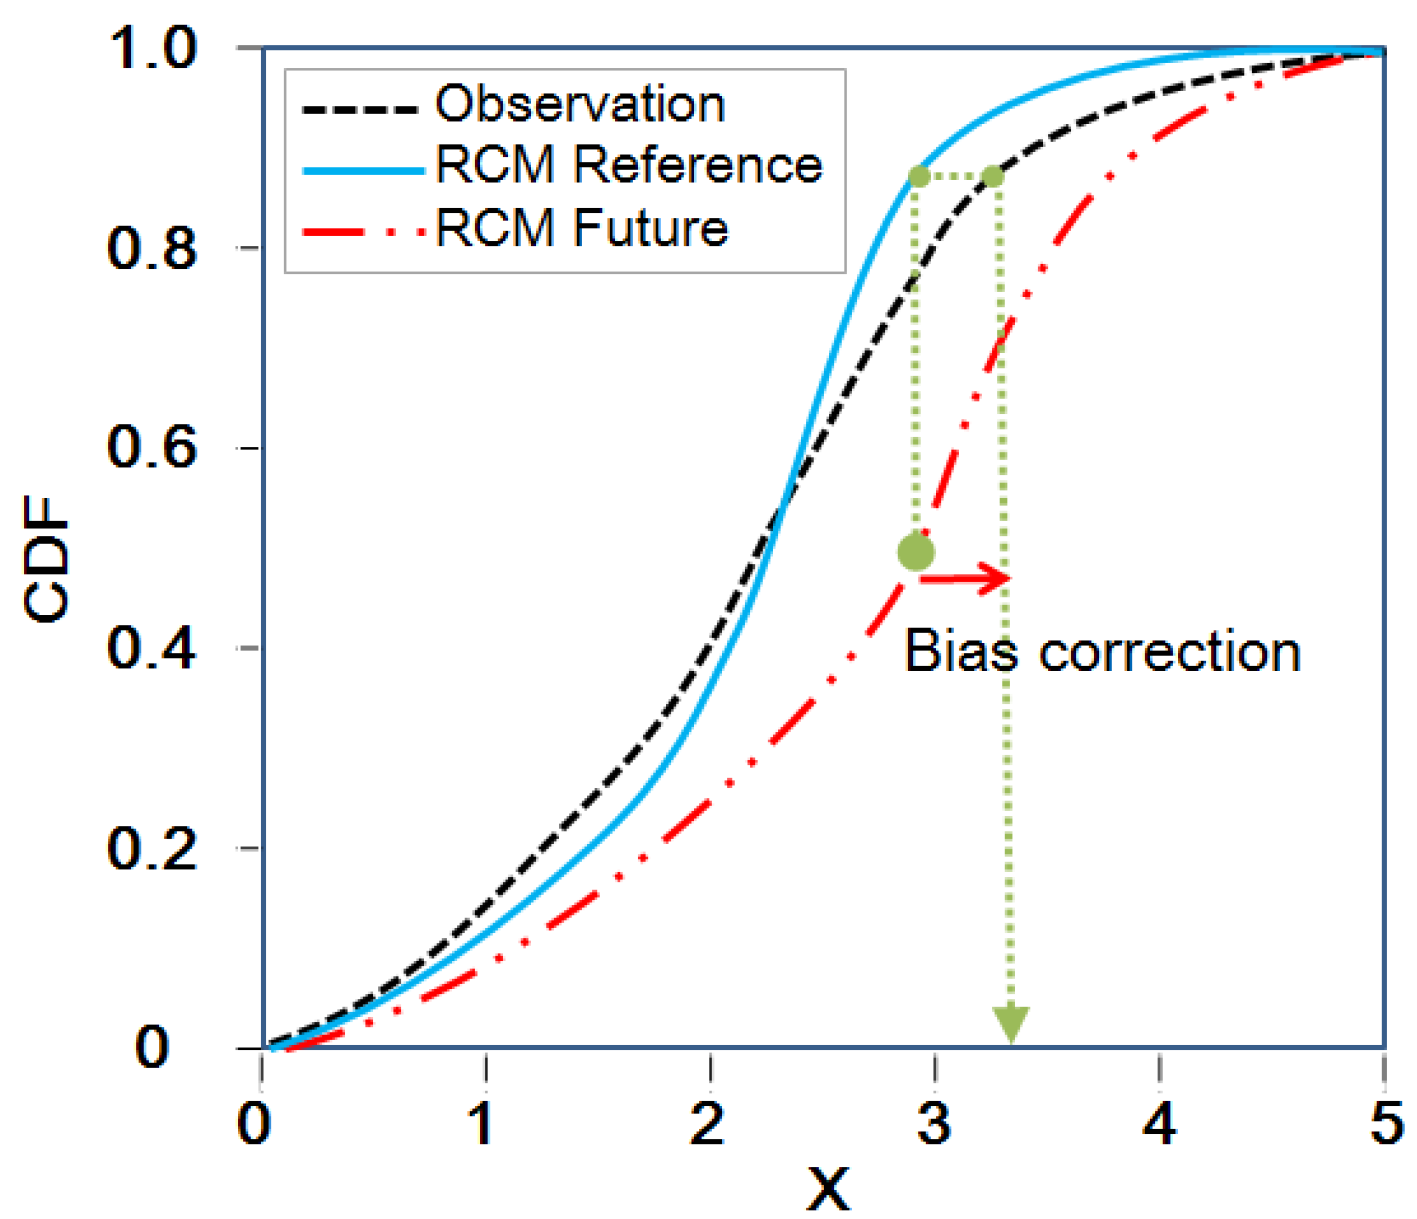
2.2. Bias Correction by Using Quantile Mapping
2.3. SWAT for Runoff Simulation
2.4. Indicators of Hydrologic Alteration to Assess the Runoff Characteristics
3. Application and Results
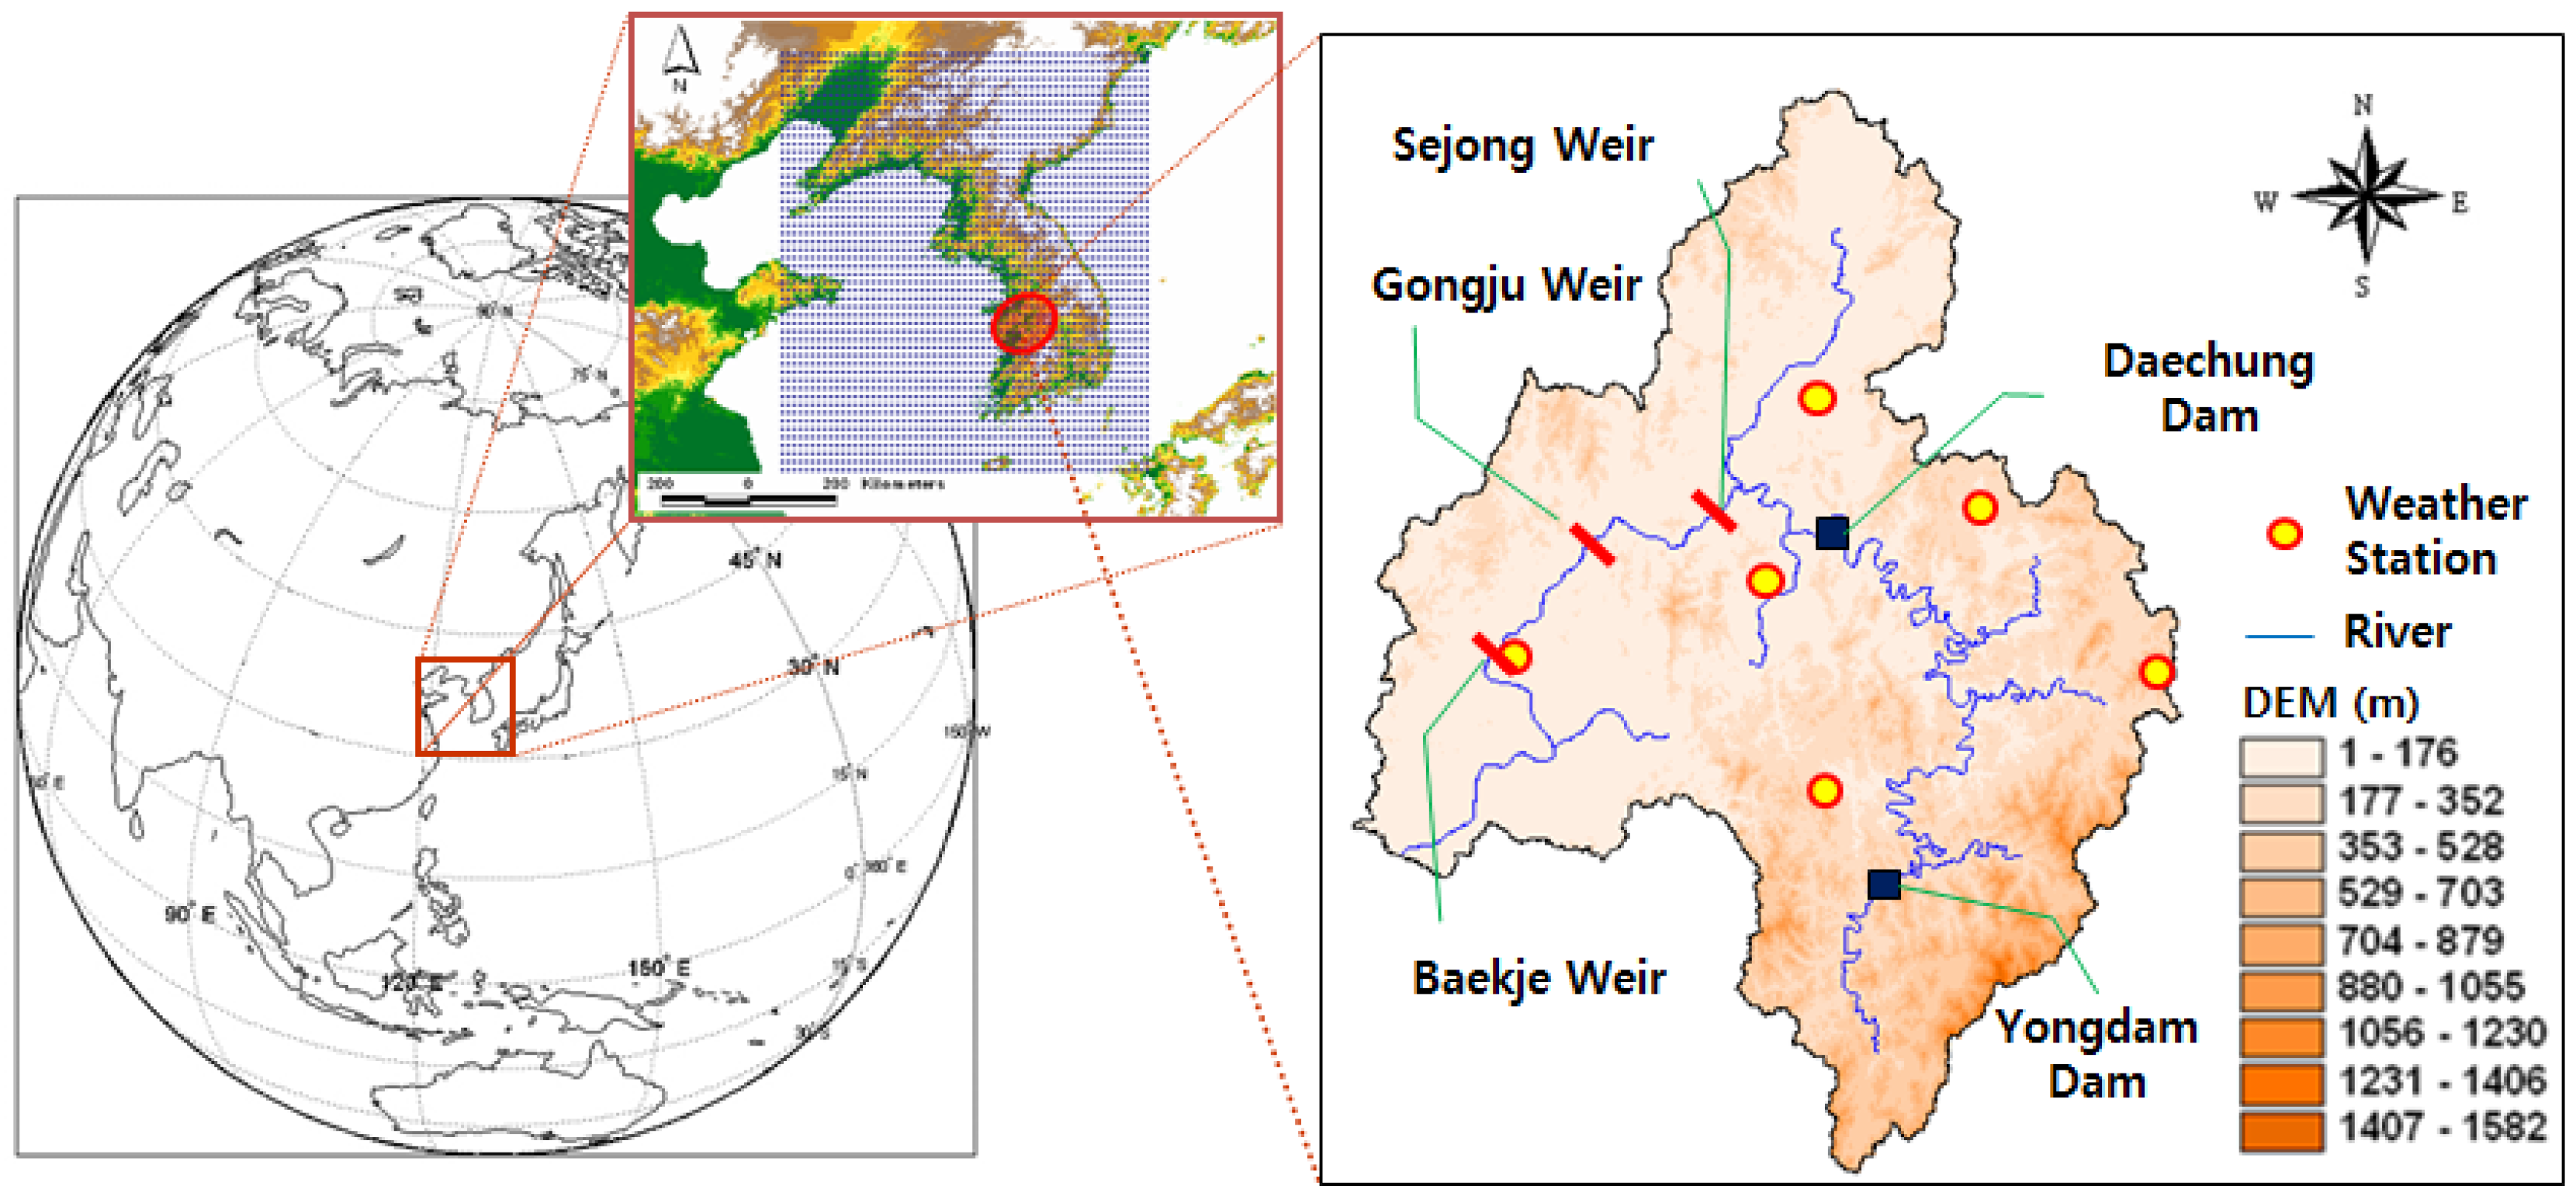
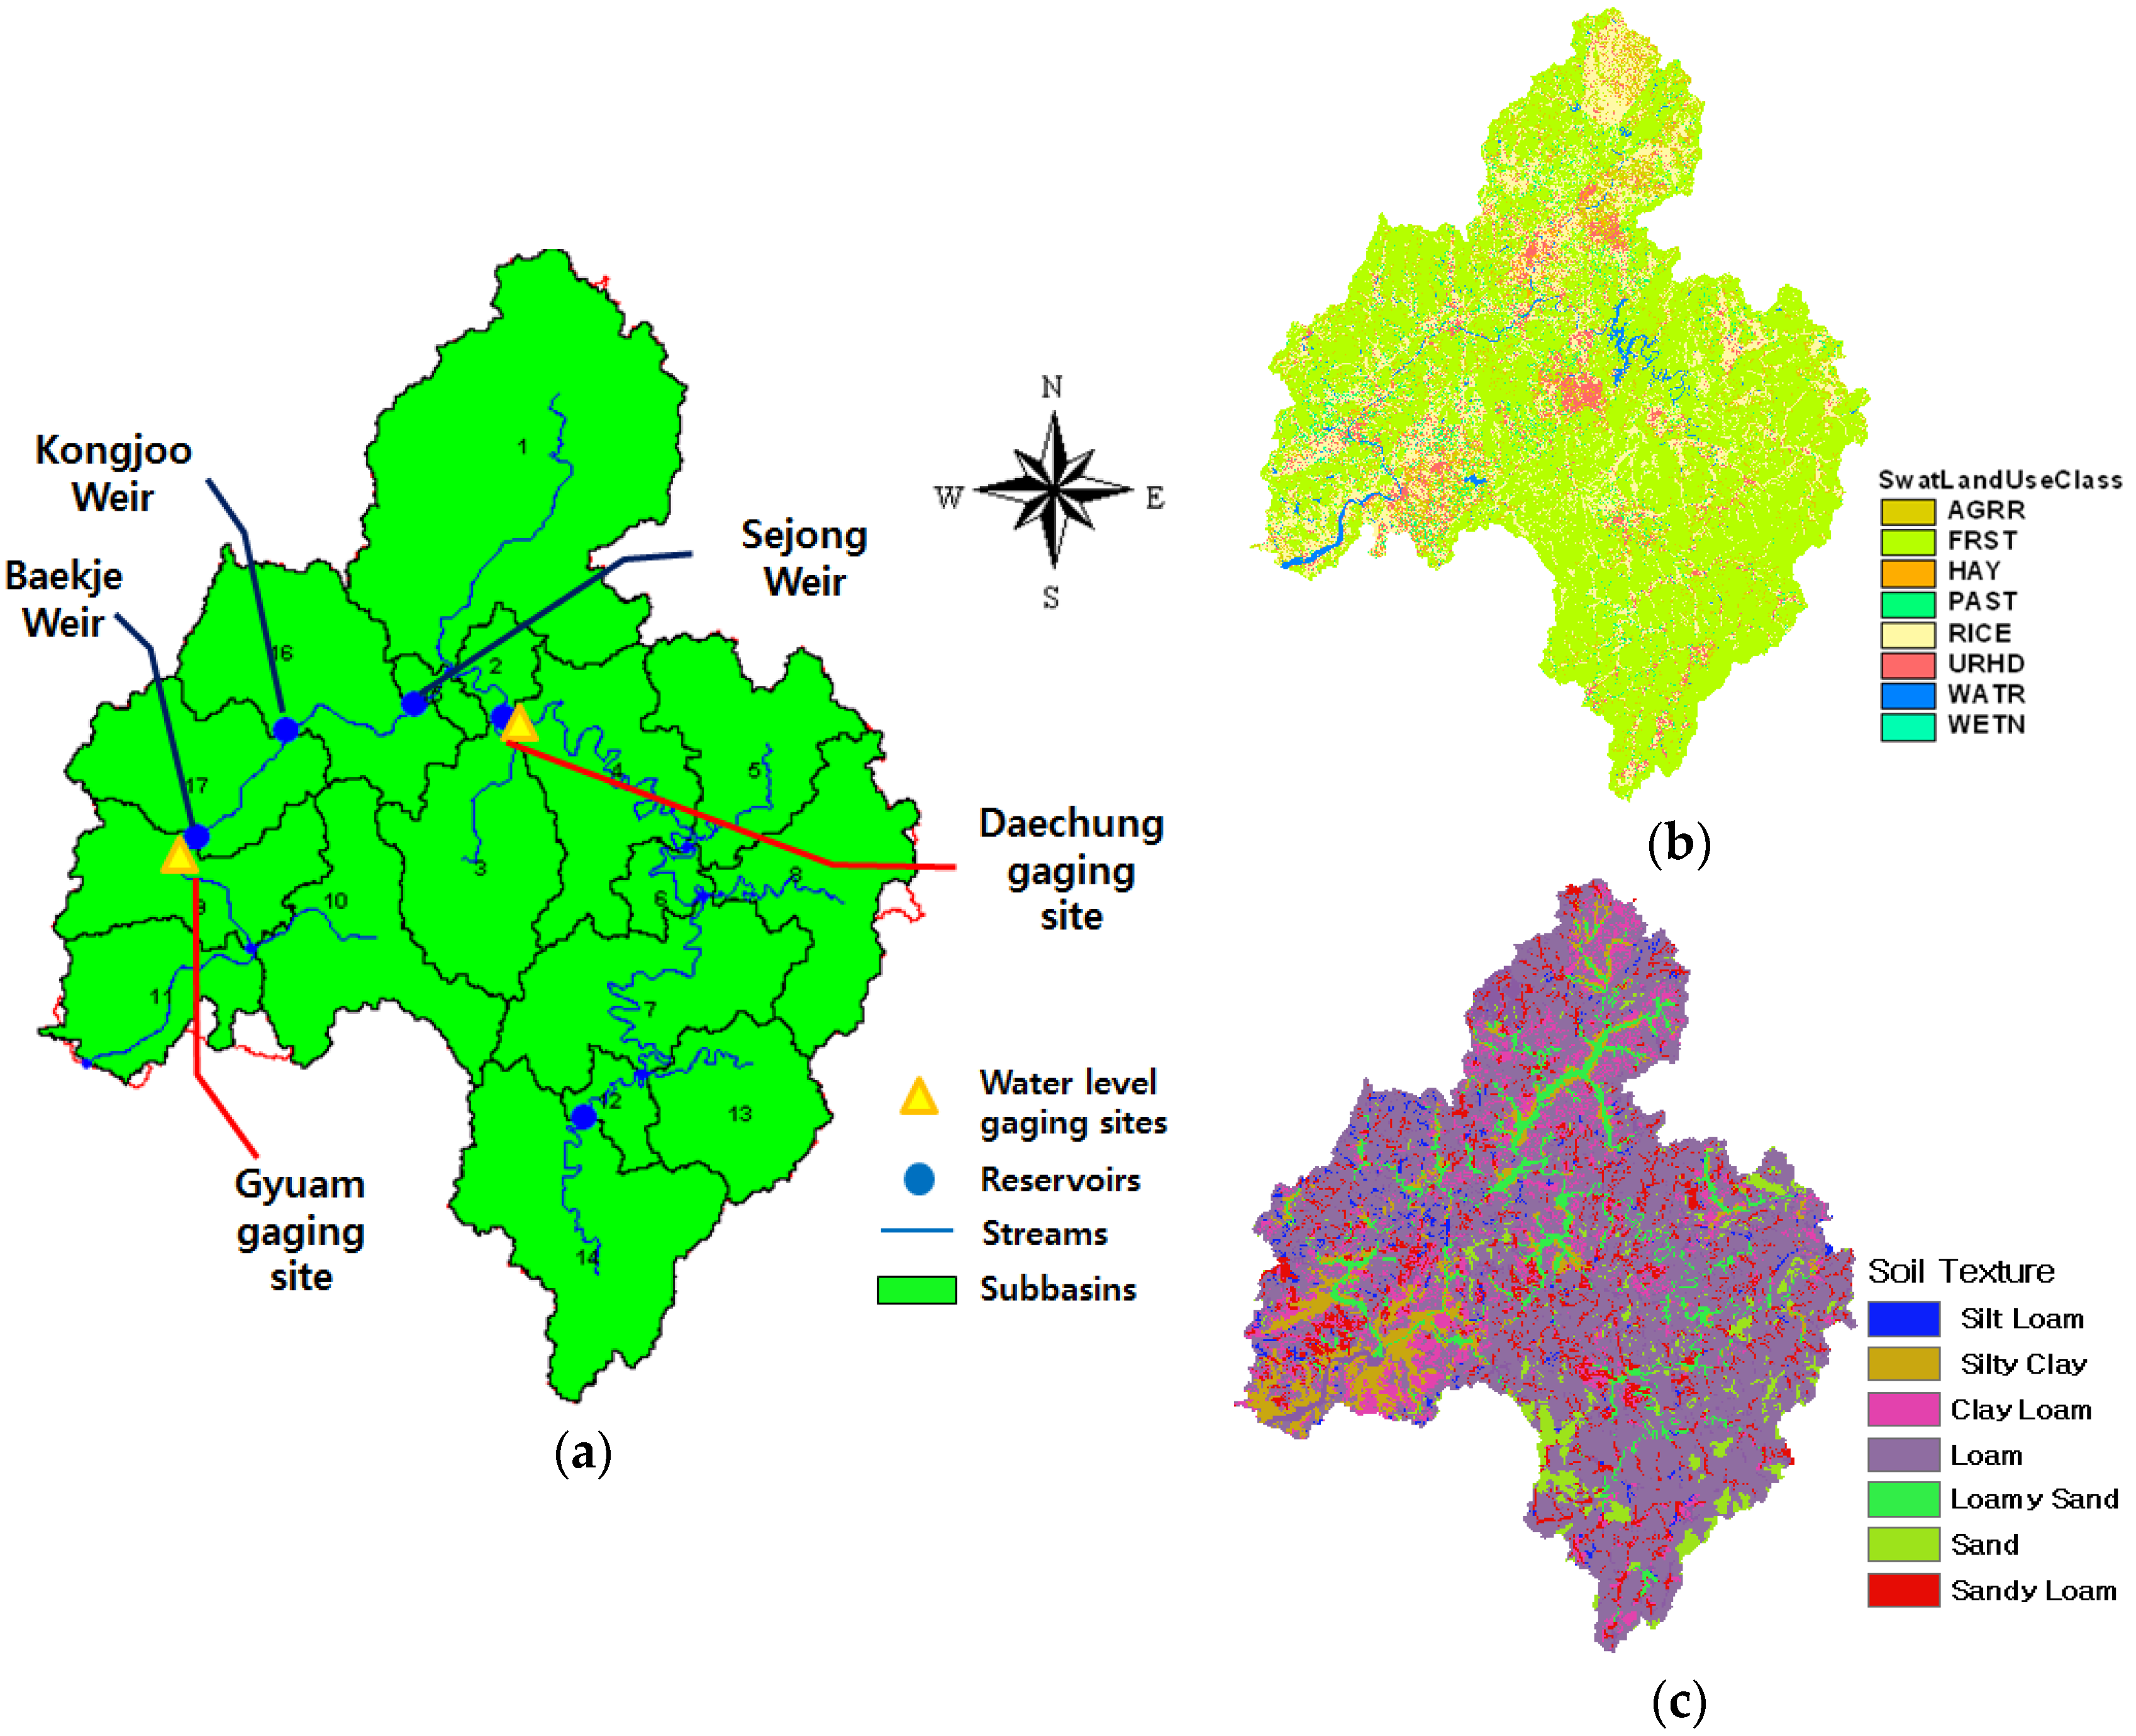
3.1. Study Basin
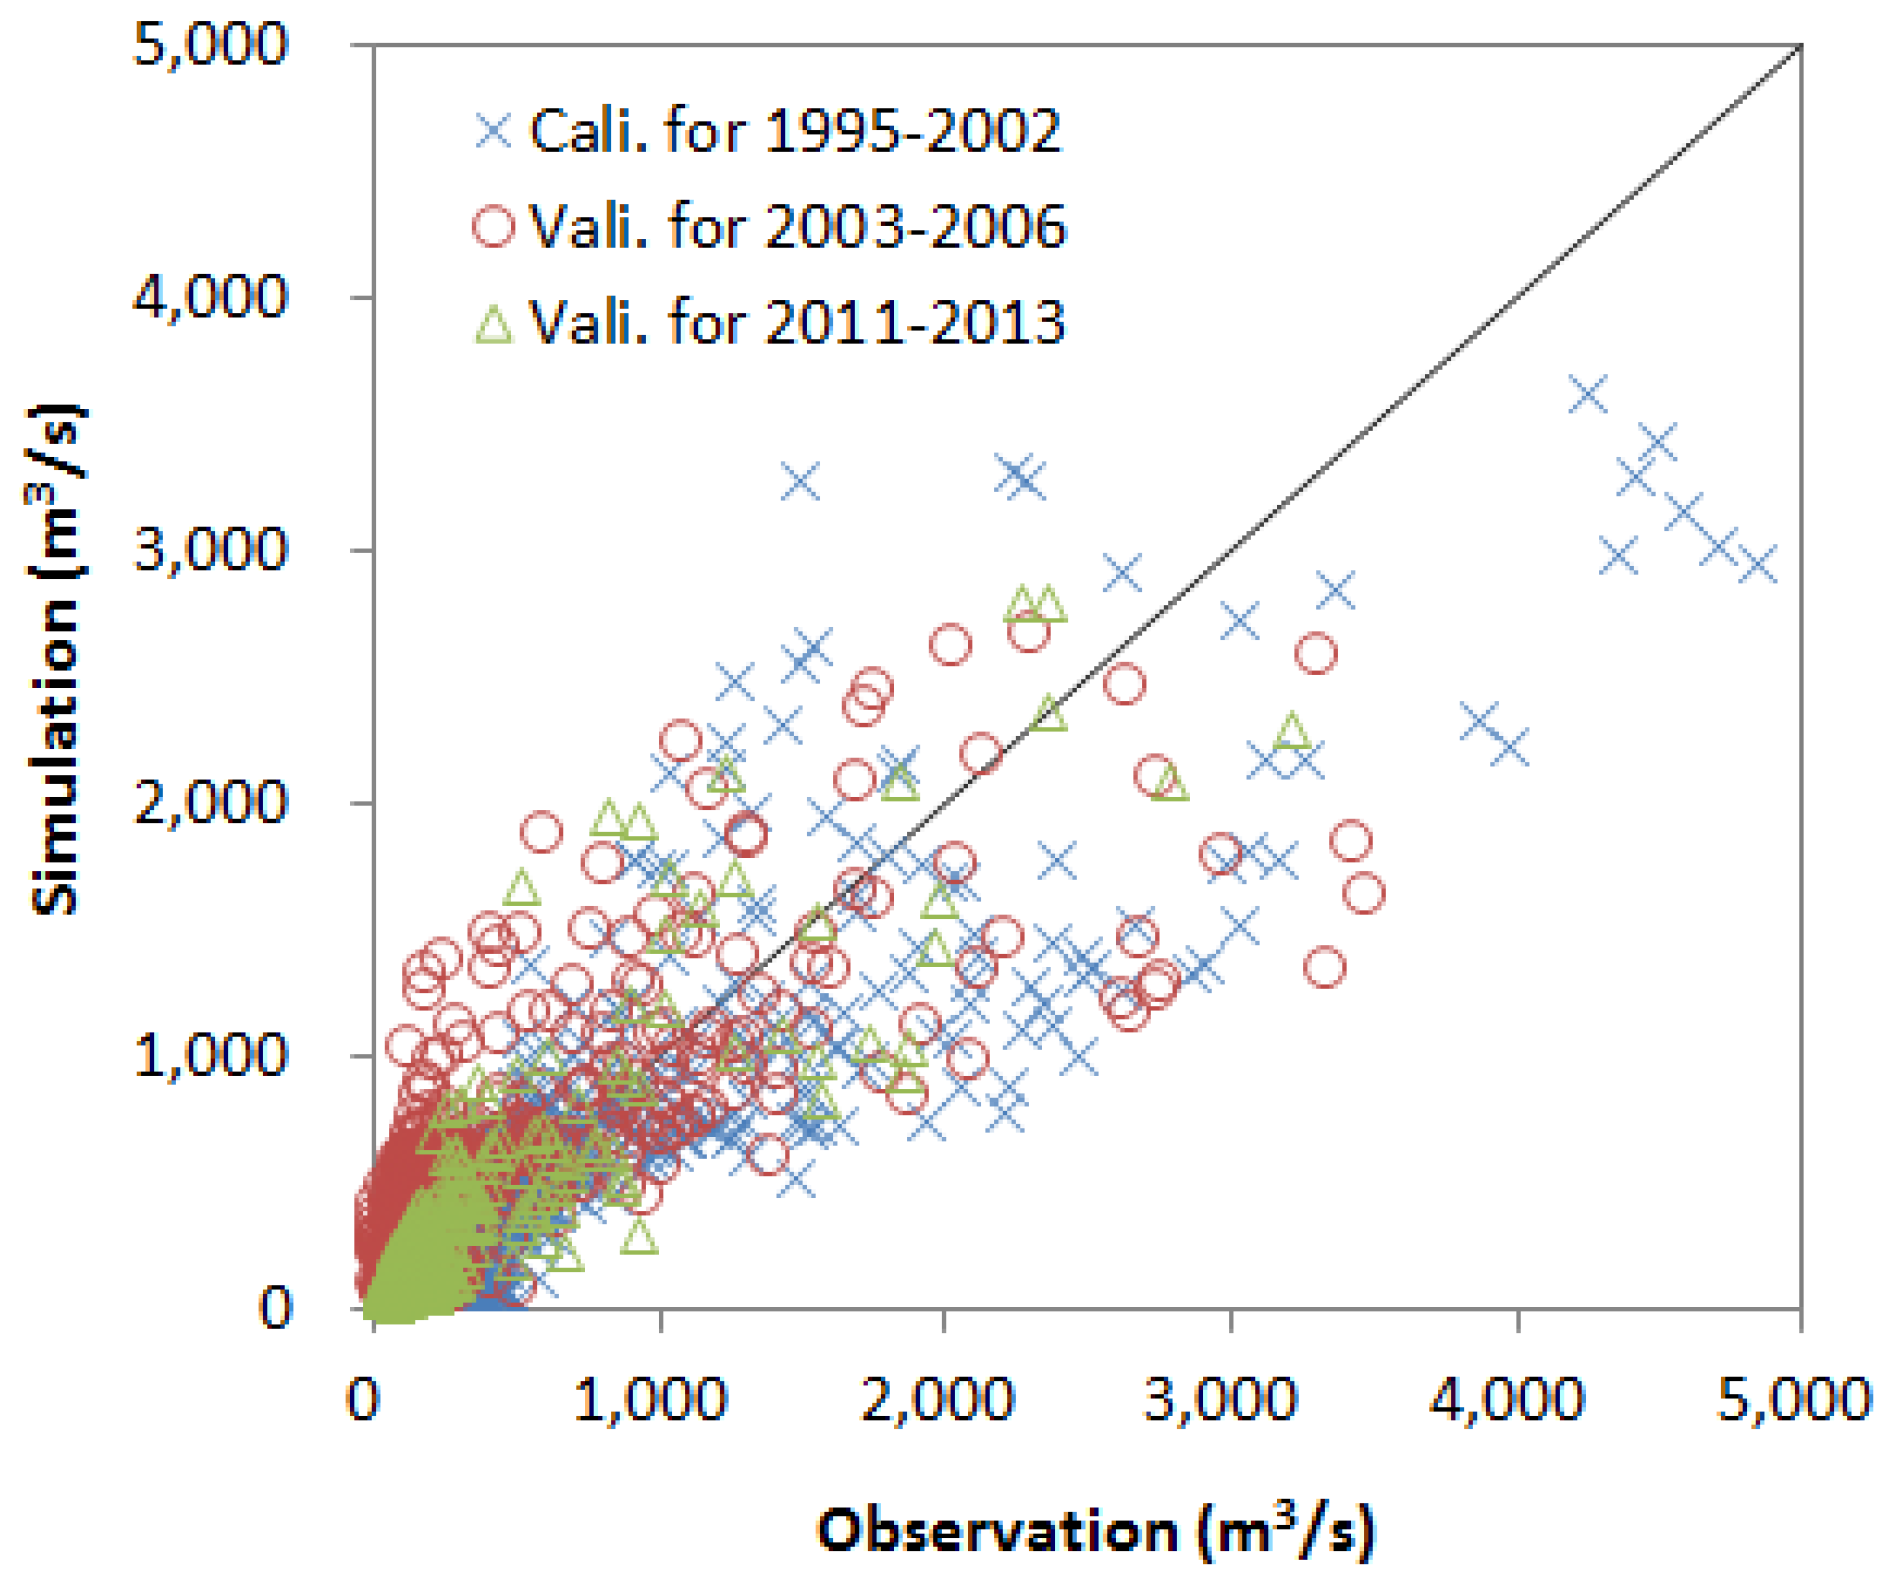
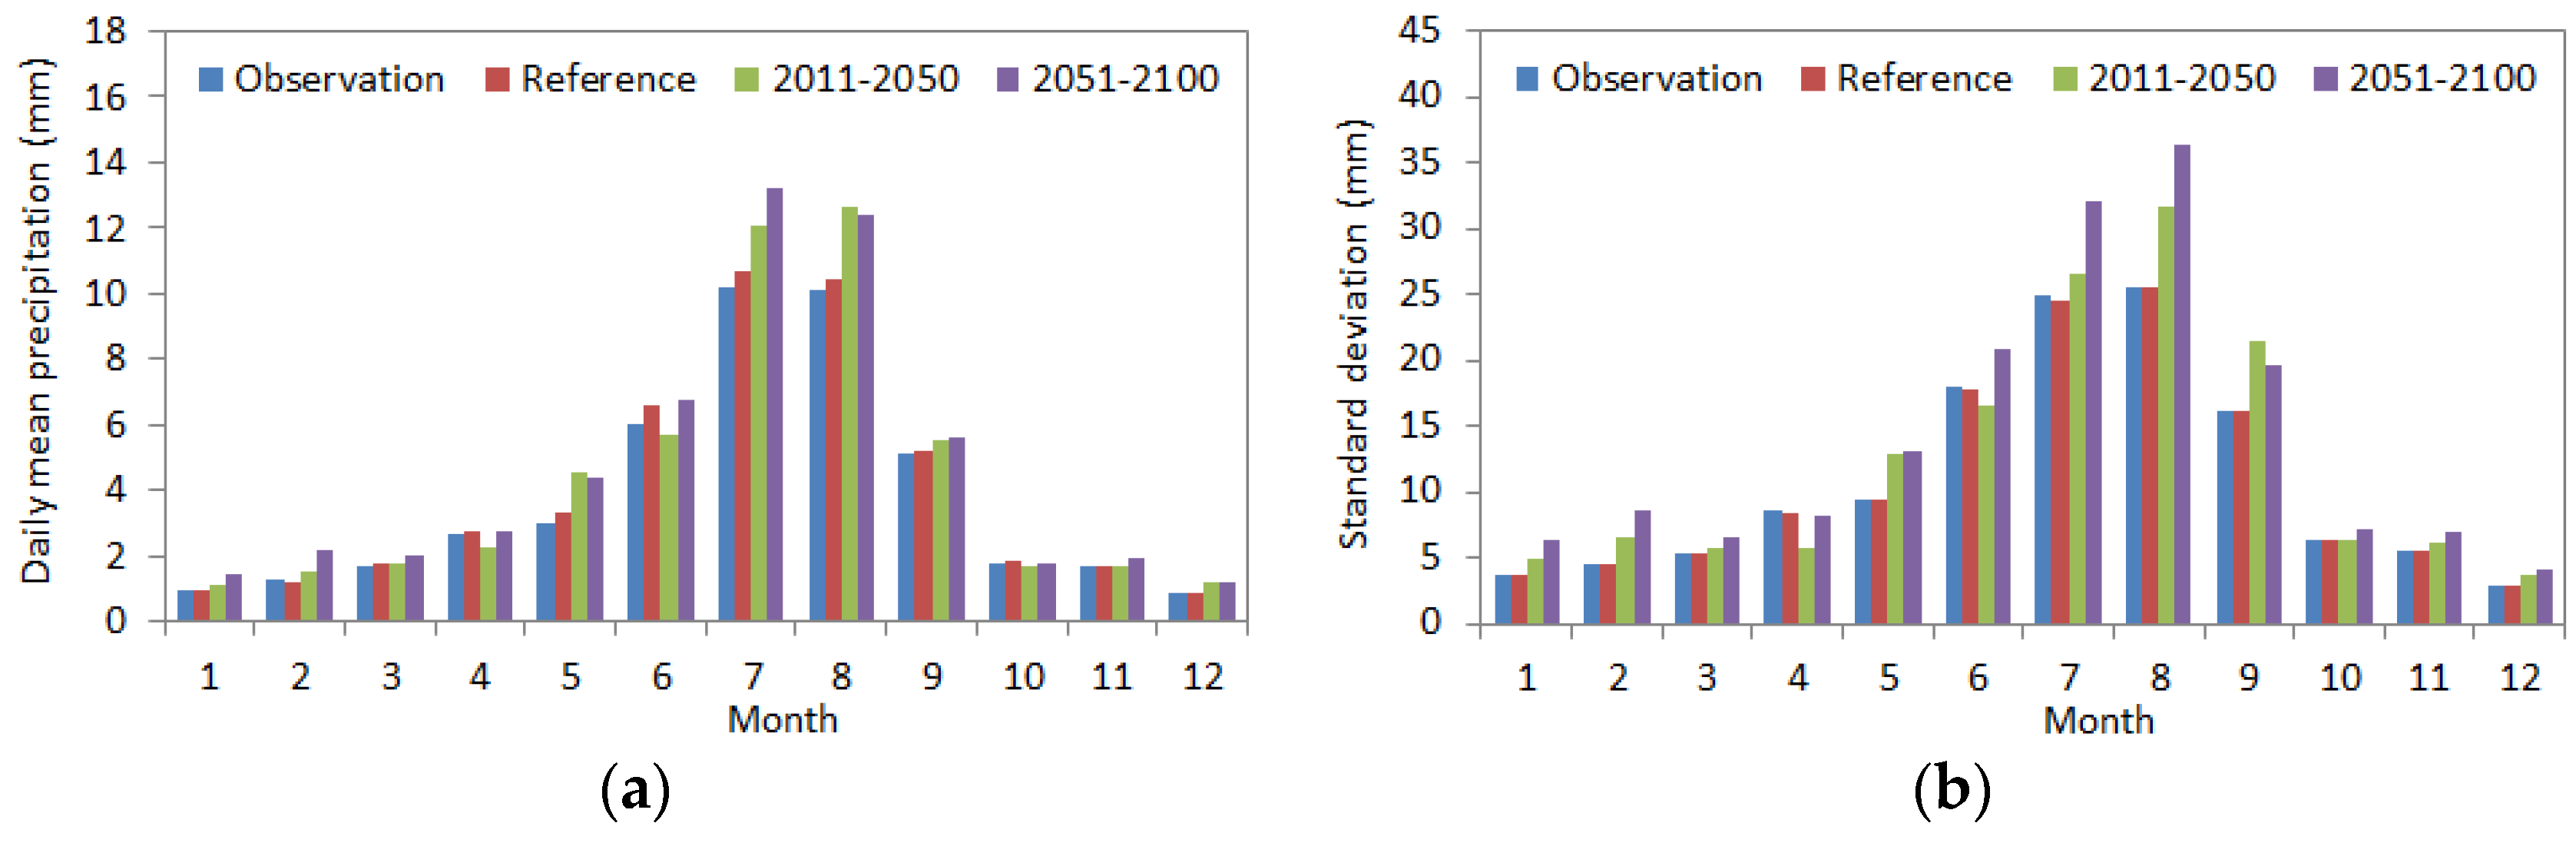
3.2. Runoff Simulation
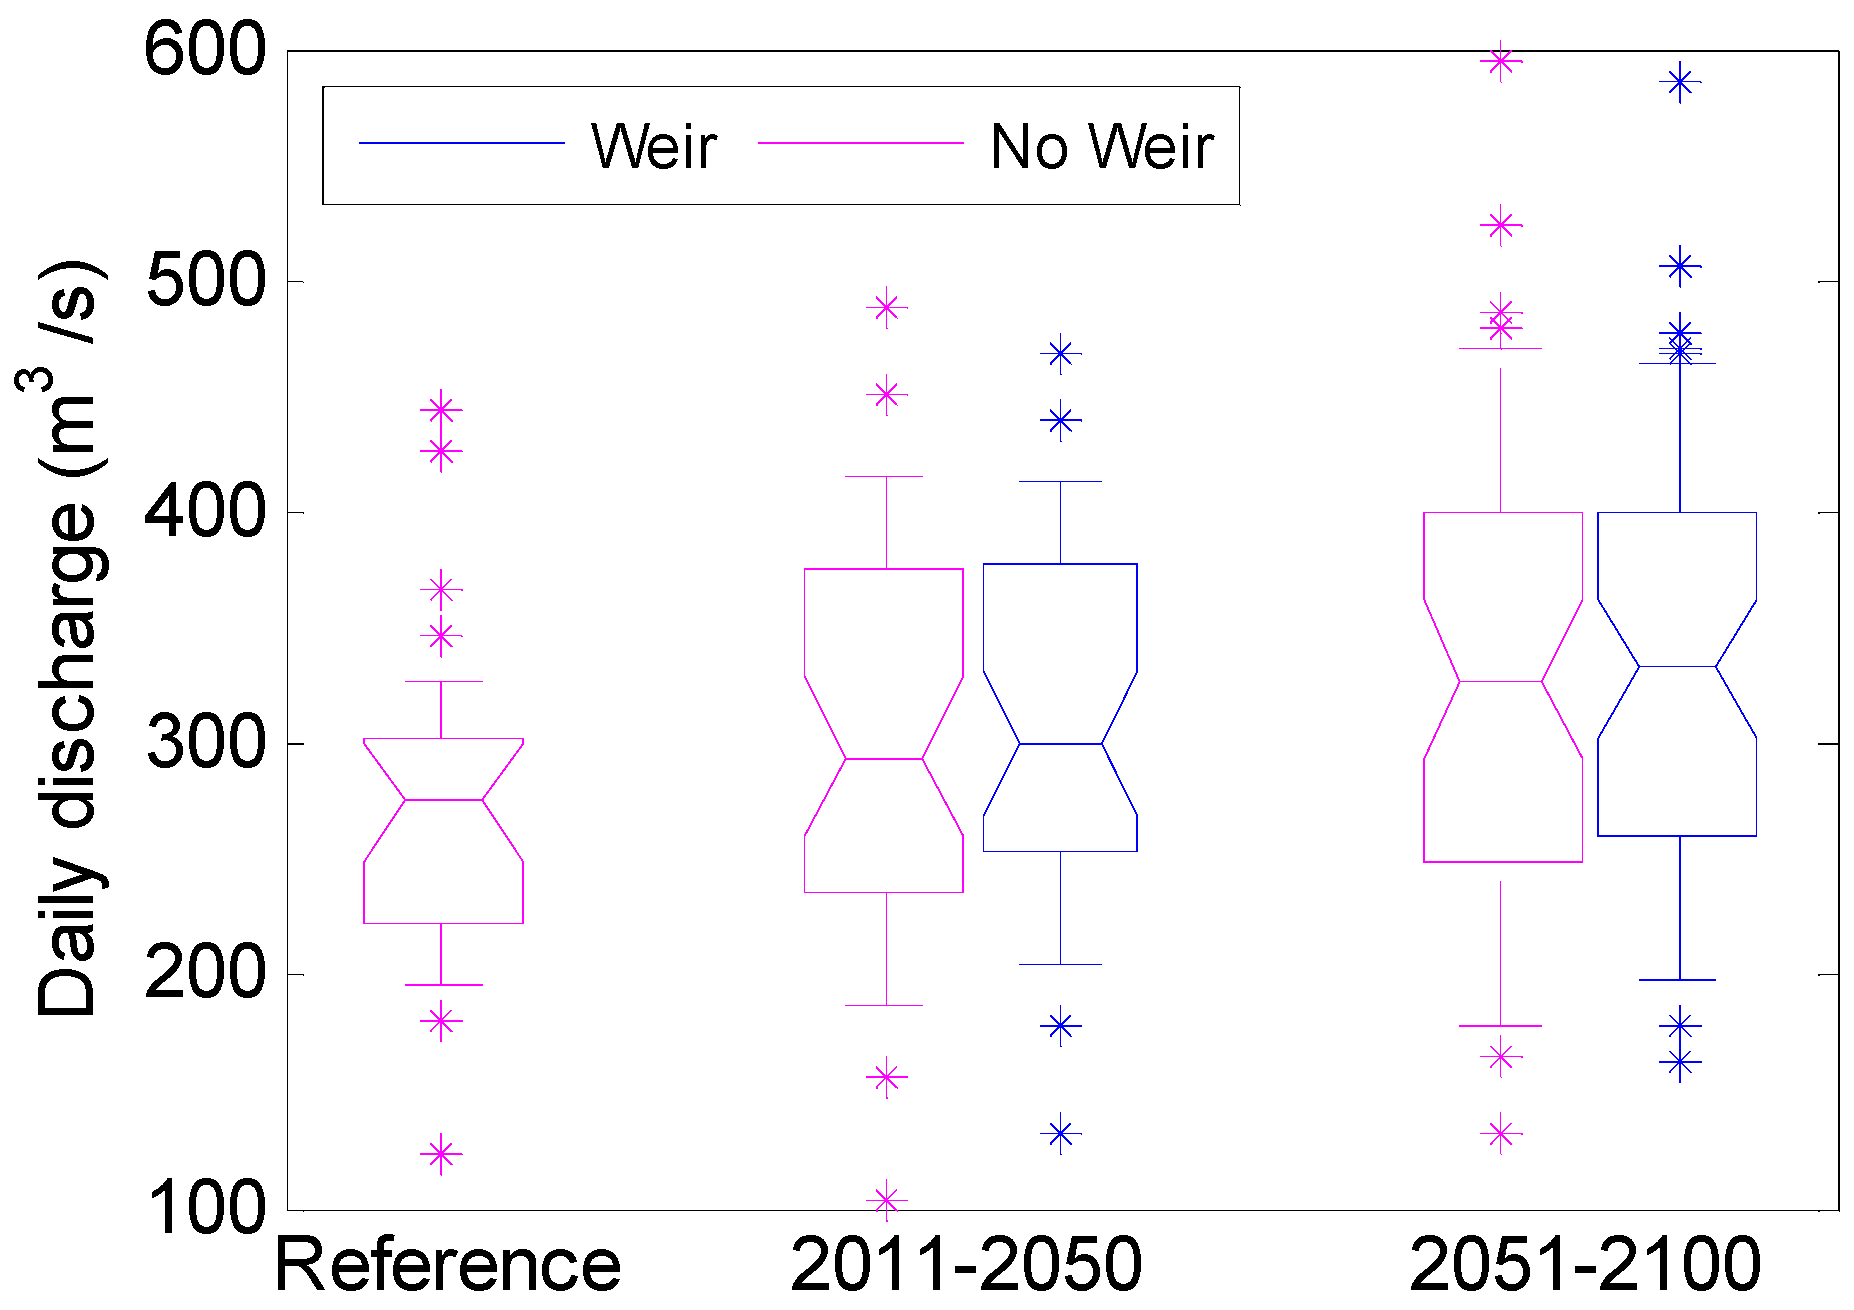
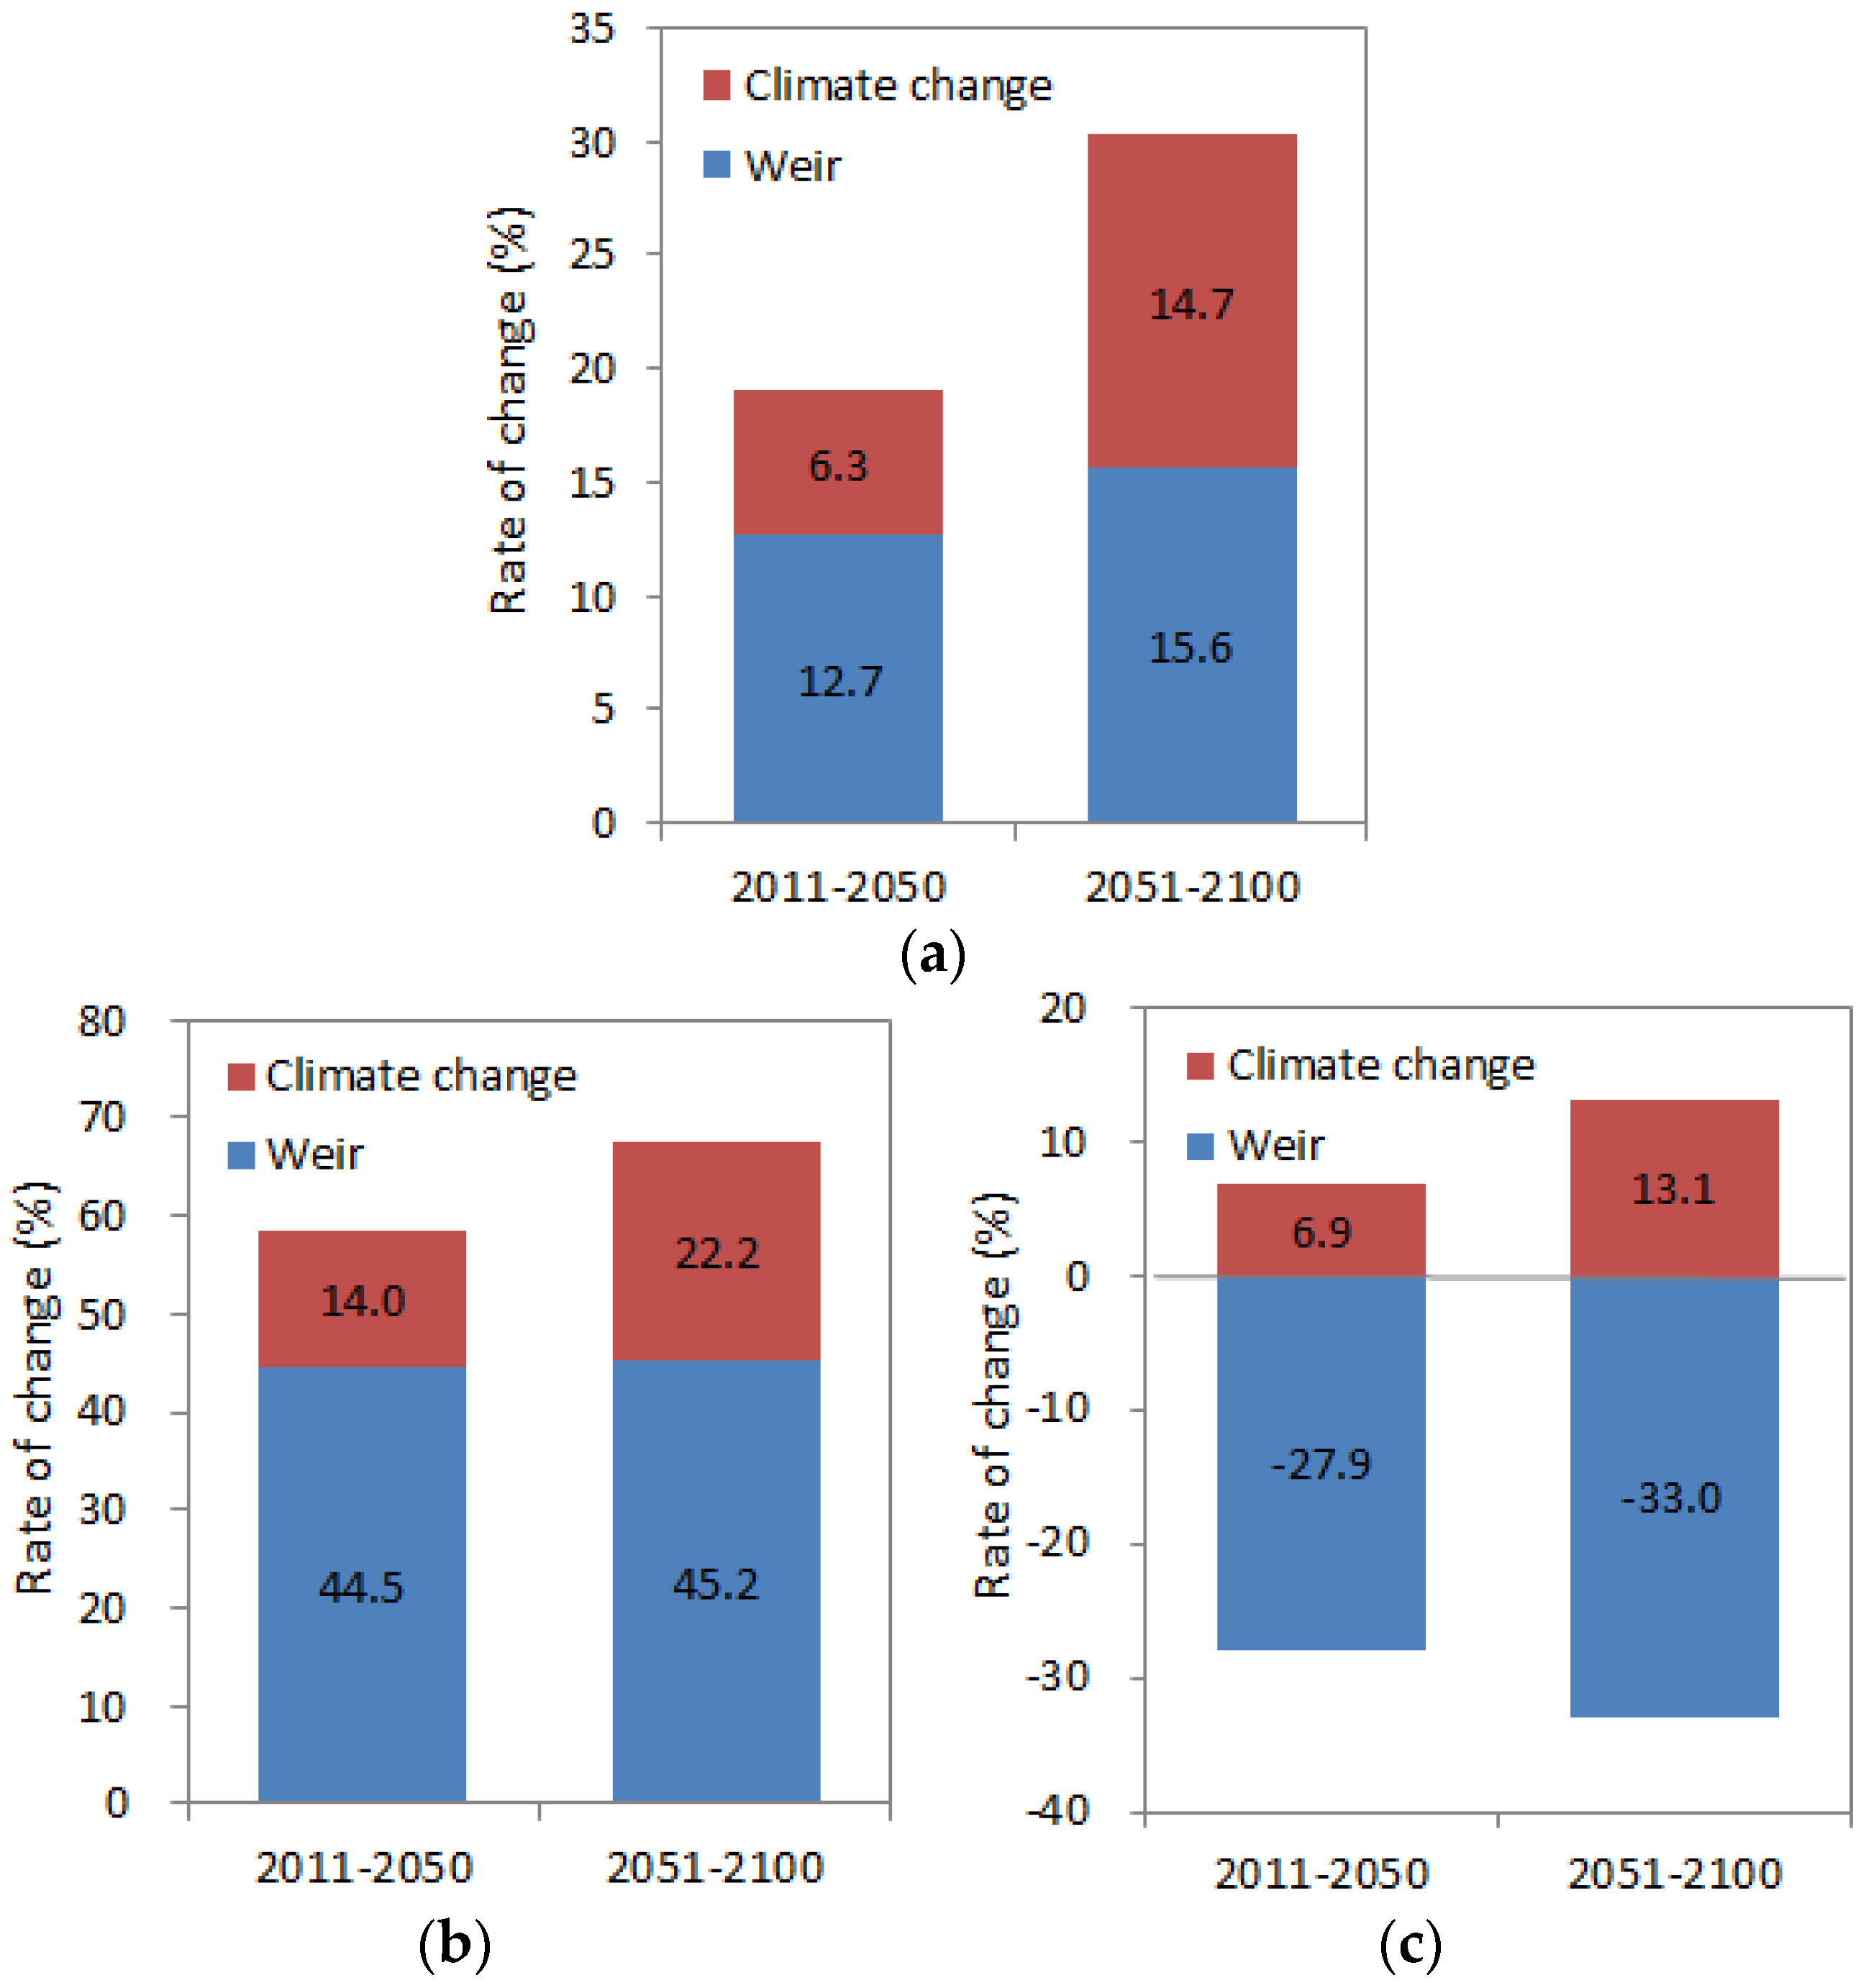
3.3. Assessment of Future Runoff Characteristics by IHA
4. Conclusions
Acknowledgments
Author Contributions
Conflicts of Interest
References
- McCool, S.F.; Clark, R.N.; Stankey, G.H. Water and People: Challenges at the Interface of Symbolic and Utilitarian Values; United States Department of Agriculture: Portland, OR, USA, 2008.
- Ripl, W. Water: The bloodstream of the biosphere. Philos. Trans. R. Soc. Lond. 2003, 358, 1921–1934. [Google Scholar] [CrossRef] [PubMed]
- World Meteorological Organization (WMO). Intergovernmental Panel on Climate Change; Climate Change 2007; Synthesis Report of WMO: Geneva, Switzerland, 2007. [Google Scholar]
- United Nations Office for Disaster Risk Reduction (UNISDR). Climate Change and Disaster Risk Reduction; The United Nations International Strategy for Disaster Reduction; UNISDR: Geneva, Switzerland, 2008. [Google Scholar]
- Gleick, P.H. The development and testing of a water-balance model for climate impact assessment: Modeling the Sacramento Basin. Water Resour. Res. 1987, 23, 1049–1061. [Google Scholar] [CrossRef]
- Yates, D.N.; Strzepek, K.M. Modeling the Nile Basin Under Climate Change. J. Hydrol. Eng. 1998, 3, 98–108. [Google Scholar] [CrossRef]
- Guo, S.; Wang, J.; Xiong, L.; Ying, A.; Li, D. A macro-scale and semi-distributed monthly water balance model to predict climate change impacts in China. J. Hydrol. 2002, 268, 1–15. [Google Scholar] [CrossRef]
- Franczyk, J.; Chang, H.J. The impacts of climate change and urbanization on the runoff of the Rock Creek basin in the Portland metropolitan area, Oregon, USA. Hydrol. Process. 2009, 23, 805–815. [Google Scholar] [CrossRef]
- Cuo, L.; Beyene, T.K.; Voisin, N.; Su, F.; Lettenmaier, D.P.; Alberti, M.; Richey, J.E. Impacts of mid-twenty-first century climate and land cover change on the hydrology of the Puget Sound basin, Washington. Hydrol. Process. 2010. [Google Scholar] [CrossRef]
- Purkey, D.R.; Joyce, B.; Vicuna, S.; Hanemann, M.W.; Dale, L.L.; Yates, D.; Dracup, J.A. Robust analysis of future climate change impacts on water for agriculture and other sectors: A case study in the Sacramento Valley. Clim. Chang. 2008, 87 (Suppl. S1), S109–S122. [Google Scholar] [CrossRef]
- Obeysekera, J.; Irizarry, M.; Park, J.; Barnes, J.; Dessalegne, T. Climate change and its implications for water resources management in south Florida. Stoch. Environ. Res. Risk Assess. 2011, 25, 495–516. [Google Scholar] [CrossRef]
- Kim, S.; Kim, B.S.; Jun, H.; Kim, H.S. Assessment of future water resources and water scarcity considering the factors of climate change and social-environmental change in Han River basin, Korea. Stoch. Environ. Res. Risk Assess. 2014, 28, 1999–2014. [Google Scholar] [CrossRef]
- Qiao, L.; Hong, Y.; McPherson, R.; Shafer, M.; Gade, D.; Williams, D.; Chen, S.; Lilly, D. Climate Change and Hydrological Response in the Trans-State Oologah Lake Watershed-Evaluating Dynamically Downscaled NARCCAP and Statistically Downscaled CMIP3 Simulations with VIC Model. Water Resour. Manag. 2014, 28, 3291–3305. [Google Scholar] [CrossRef]
- Qiao, L.; Pan, Z.; Herrmann, R.B.; Hong, Y. Hydrological Variability and Uncertainty of Lower Missouri River Basin Under Changing Climate. J. Am. Water Resour. Assoc. 2014, 50, 246–260. [Google Scholar] [CrossRef]
- Shin, J.H.; Chung, J.Y. The four major rivers restoration project in South Korea. Proc. ICE Civ. Eng. 2011, 164, 19–26. [Google Scholar] [CrossRef]
- Davies, T.; Cullen, M.J.P.; Malcolm, A.J.; Mawson, M.H.; Staniforth, A.; White, A.A.; Wood, N. A new dynamical core for the Met Office’s global and regional modeling of the atmosphere. Q. J. R. Meteorol. Soc. 2005, 131, 1759–1782. [Google Scholar] [CrossRef]
- Martin, G.M.; Ringer, M.A.; Pope, V.D.; Jones, A.; Dearden, C.; Hinton, T.J. The physical properties of the atmosphere in the new Hadley Centre Global Environmental Model (HadGEM1). Part I: Model description and global climatology. J. Clim. 2006, 19, 1274–1302. [Google Scholar] [CrossRef]
- Giorgi, F.; Jones, C.; Asrar, G.R. Addressing climate information needs at the regional level: The CORDEX framework. World Meteorol. Organ. Bull. 2009, 58, 175–183. [Google Scholar]
- Panofsy, H.A.; Brire, G.W. Some application of Statistics to Meteorology; Pennsylvania State University: University Park, PA, USA, 1963; p. 224. [Google Scholar]
- Wood, A.W.; Leung, L.R.; Sridhar, V.; Lettenmaier, D.P. Hydrologic implications of dynamical and statistical approaches to downscaling climate model outputs. Clim. Chang. 2004, 62, 189–216. [Google Scholar] [CrossRef]
- Hashino, T.; Bradley, A.A.; Schwartz, S.S. Evaluation of bias-correction methods for ensemble streamflow volume forecasts. Hydrol. Earth Syst. Sci. 2007, 11, 939–950. [Google Scholar] [CrossRef]
- Palmer, R.; Wiley, M.; Kameenui, A. Will Climate Change Impact Water Supply and Demand in the Puget Sound? Department of Civil and Environmental Engineering, University of Washington: Seattle, WA, USA, 2004. [Google Scholar]
- Durman, C.F.; Gregory, J.M.; Hassell, D.C.; Jones, R.G.; Murphy, J.M. A comparison of extreme European daily precipitation simulated by a global and a regional climate model for present and future climates. Q. J. R. Meteorol. Soc. 2001, 127, 1005–1015. [Google Scholar] [CrossRef]
- Kyoung, M.S.; Lee, J.K.; Kim, H.S. Downscaling Technique of Monthly GCM Using Daily Precipitation Generator. Korean Soc. Civ. Eng. 2009, 29, 441–452. [Google Scholar]
- Maurer, E.P.; Pierce, D.W. Bias correction can modify climate model simulated precipitation changes without adverse effect on the ensemble mean. Hydrol. Earth Syst. Sci. 2014, 18, 915–925. [Google Scholar] [CrossRef]
- Cannon, A.J.; Sobie, S.R.; Murdock, T.Q. Bias Correction of GCM Precipitation by Quantile Mapping: How Well Do Methods Preserve Changes in Quantiles and Extremes? J. Clim. 2015, 28, 6938–6959. [Google Scholar] [CrossRef]
- Maraun, D. Bias Correction, Quantile Mapping, and Downscaling: Revisiting the Inflation Issue. J. Clim. 2013, 26, 2137–2143. [Google Scholar] [CrossRef]
- Wilby, R.L.; Dawson, C.W.; Barrow, E.M. SDSM—A decision support tool for the assessment of regional climate change impacts. Environ. Model. Softw. 2002, 17, 145–157. [Google Scholar] [CrossRef]
- Khalil, A.F.; Kwon, H.H.; Lall, U.; Kaheil, Y.H. Predictive downscaling based on non-homogeneous hidden Markov models. Hydrol. Sci. J. 2010, 55, 333–350. [Google Scholar] [CrossRef]
- Frias, M.D.; Zorita, E.; Fernandez, J.; Rodriguez-Puebla, C. Testing statistical downscaling methods in simulated climates. Geophys. Res. Lett. 2006, 33. [Google Scholar] [CrossRef]
- Kilsby, C.G.; Jones, P.D.; Burton, A.; Ford, A.C.; Fowler, H.J.; Harpham, C.; James, P.; Smith, A.; Wilby, R.L. A daily weather generator for use in climate change studies. Environ. Model. Softw. 2007, 22, 1705–1719. [Google Scholar] [CrossRef]
- Robertson, A.W.; Amor, V.M.I.; James, W.H. Downscaling of Seasonal Precipitation for Crop Simulation. J. Appl. Meteorol. Climatol. 2007, 46, 677–693. [Google Scholar] [CrossRef]
- Arnold, J.G.; Srinivasan, R.; Muttiah, R.S.; Williams, J.R. Large area hydrologic modeling and assessment: Part I. Model development. J. Am. Water Resour. Assoc. 1998, 34, 73–89. [Google Scholar] [CrossRef]
- Soil and Water Assessment Tool (SWAT). Available online: http://swatmodel.tamu.edu/ (accessed on 6 March 2016).
- Neitsch, S.L.; Arnold, J.G.; Kiniry, J.R.; Williamas, J.R.; King, K.W. Soil and Water Assessment Tool Theoretical Documentation; Texas Water Resources Institute: College Station, TX, USA, 2002. [Google Scholar]
- Ward, A.D.; Elliot, W.J. Environmental Hydrology; Lewis Publishers, CRC Press, Inc.: Boca Raton, FL, USA, 1995. [Google Scholar]
- Richter, B.D.; Baumgartner, J.V.; Powell, J.; Braun, D.P. A method for assessing hydrologic rate of change within ecosystems. Conserv. Biol. 1996, 10, 1163–1174. [Google Scholar] [CrossRef]
- Richter, B.D.; Braun, D.P.; Mendelson, M.A.; Master, L.L. Threats to imperiled freshwater fauna. Conserv. Biol. 1997, 11, 1081–1093. [Google Scholar] [CrossRef]
- Richter, B.D.; Baumgartner, J.V.; Braun, D.P.; Powell, J. A spatial assessment of hydrologic alteration within a river network. Regul. Rivers Res. Manag. 1998, 14, 329–340. [Google Scholar] [CrossRef]
- Shin, H.S. Ministry of Land, Transport and Maritime Affairs; Construction Guidelines of Urban Flood Forecasting and Warning System: FFC-G11, Report of Research Trends; Korea Institute of Construction & Transportation Technology Evaluation and Planning (KICTEP): Gyeonggi-Do, Korea, 2009. [Google Scholar]
- Water Resources Management Information System (WAMIS). Available online: http://www.wamis.go.kr/ (accessed on 6 March 2016).
- Monteith, J.L. Evaporation and the environment. In The State and Movement of Water in Living Organisms. 19th Symposia of the Society for Experimental Biology; Cambridge University Press: London, UK, 1965; pp. 205–234. [Google Scholar]
- Gao, B.; Yang, D.; Yang, H. Impact of the Three Gorges Dam on flow regime in the middle and lower Yangtze River. Quat. Int. 2013, 304, 43–50. [Google Scholar] [CrossRef]
- Jiang, L.; Ban, X.; Wang, X.; Cai, X. Assessment of Hydrologic Rate of Changes Caused by the Three Gorges Dam in the Middle and Lower Reaches of Yangtze River, China. Water 2014, 6, 1419–1434. [Google Scholar] [CrossRef]
- The Nature Conservancy. Indicators of Hydrologic Rate of Change Version 7; User’s Manual; The Nature Conservancy: Arlington, VA, USA, 2006. [Google Scholar]


| Model | HadGEM3-RA |
|---|---|
| Scenarios | RCP 4.5, 8.5 |
| Time period | 1950–2100 |
| Grid size | 12.5 km |
| Meteorological factor | Temperature (maximum, minimum, average), precipitation, near-surface wind speed, surface upwelling longwave radiation, surface downwelling shortwave radiation, surface air pressure, near-surface specific humidity |
| Time scale | Daily average, monthly average |
| Name | Latitude (°) | Longitude (°) | Elevation (m) | Meteorological Data |
|---|---|---|---|---|
| Cheongjoo | 36.6364 | 127.4428 | 57.4 | Min. air temperature Max. air temperature Relative humidity Wind speed Solar radiation (Daily, 1981–2006) |
| Daejeon | 36.3691 | 127.3743 | 68.3 | |
| Chuphung | 36.2171 | 127.9965 | 242.5 | |
| Boeun | 36.4848 | 127.7363 | 170 | |
| Buyeo | 36.2694 | 126.923 | 16 | |
| Geumsan | 36.1027 | 127.4838 | 170.7 |
| Weir | Weir Height (m) | Water Level (EL.m) | Average Depth (m) | Surface Area (106 m2) | Increased River Width (m) | Increased Storage Volume (106 m3) |
|---|---|---|---|---|---|---|
| Sejong | 4 | 11.4 | 2.1 | 3.0 | 72 | 1.3 |
| Gongju | 7 | 8.8 | 4.2 | 4.7 | 78 | 10.4 |
| Baekje | 7 | 4.2 | 4.6 | 6.8 | 131 | 18.1 |
| Daechung | Gyuam | ||||
|---|---|---|---|---|---|
| Calibration, 1995–2002 | Validation, 2003–2006 | Calibration, 1995–2002 | Validation, 2003–2006 | Validation, 2011–2013 | |
| CC | 0.79 | 0.77 | 0.78 | 0.75 | 0.75 |
| R2 | 0.62 | 0.59 | 0.60 | 0.57 | 0.56 |
| ME | 0.53 | 0.49 | 0.56 | 0.55 | 0.52 |
| RMSE (m3/s) | 153.92 | 185.29 | 202.70 | 312.08 | 132.25 |
| Scenarios | Reference (1981–2006) | Climate Change (2011–2100) | ||
|---|---|---|---|---|
| RCP 4.5 | RCP 8.5 | |||
| Water project | No Weir | √ | √ | √ |
| Weir | - | √ | √ | |
| Periods | 1981–2006 | 2011–2050 (Future 1) | 2051–2100 (Future 2) | |||
|---|---|---|---|---|---|---|
| Scenarios | Reference | RCP4.5 | RCP8.5 | RCP4.5 | RCP8.5 | |
| No Weir | Average | 271.1 | 293.6 | 296.2 | 315.4 | 339.6 |
| 294.9 (+8.7%) | 327.5 (+20.8%) | |||||
| Standard deviation | 371.4 | 431.6 | 442.5 | 424.8 | 540.1 | |
| 437.1 (+17.7%) | 482.4 (+29.9%) | |||||
| Weir | Average | 271.2 | 298.5 | 300.3 | 319.7 | 345.5 |
| 299.4 (+10.4%) | 332.6 (+22.6%) | |||||
| Standard deviation | 371.4 | 330.7 | 354.0 | 320.5 | 410.8 | |
| 342.4 (−7.8%) | 365.7 (−1.6%) | |||||
| IHA | Reference | Future 1 (2011–2050) | Future 2 (2051–2100) | ||||
|---|---|---|---|---|---|---|---|
| No Weir Value/Unit | No Weir % (HA) | Weir % (HA) | No Weir % (HA) | Weir % (HA) | |||
| Parameter Group #1 | |||||||
| Monthly average flow rate | January | 31.2 | m3/s | +10.3 (L) | +42.2 (M) | +34.8 (M) | +83 (H) |
| February | 23.0 | m3/s | +17.8 (L) | +36.2 (M) | +51.5 (M) | +65.2 (M) | |
| March | 48.8 | m3/s | +13.5 (L) | +15.4 (L) | +21.2 (L) | +31.2 (L) | |
| April | 91.9 | m3/s | −2.3 (L) | −1.7 (L) | +7.7 (L) | +10.4 (L) | |
| May | 134.8 | m3/s | +5.3 (L) | +0.8 (L) | +9.5 (L) | +11.5 (L) | |
| June | 163.2 | m3/s | +10.8 (L) | +11.8 (L) | +8.6 (L) | +13 (L) | |
| July | 463.3 | m3/s | +4.5 (L) | +6.7 (L) | +7.4 (L) | +14.1 (L) | |
| August | 491.1 | m3/s | +8.7 (L) | +16 (L) | +7.2 (L) | +15.1 (L) | |
| September | 392.1 | m3/s | +4.3 (L) | +32.6 (L) | +10.2 (L) | +31.7 (L) | |
| October | 255.3 | m3/s | +0.9 (L) | +21.8 (L) | +4.9 (L) | +25.3 (L) | |
| November | 155.9 | m3/s | −3.5 (L) | +17.9 (L) | +3.5 (L) | +24 (L) | |
| December | 72.5 | m3/s | +6.1 (L) | +28.7 (L) | +9.3 (L) | +39 (M) | |
| Parameter Group #2 | |||||||
| 1-day minimum | 11.3 | m3/s | +14 (L) | +58.5 (M) | +22.2 (L) | +67.4 (H) | |
| 3-day minimum | 11.6 | m3/s | +14.1 (L) | +56 (M) | +22.2 (L) | +65.6 (M) | |
| 7-day minimum | 16.5 | m3/s | +0.9 (L) | +28.4 (L) | +7.1 (L) | +37.4 (M) | |
| 30-day minimum | 19.1 | m3/s | +13.6 (L) | +31.8 (L) | +25.3 (L) | +49.1 (M) | |
| 90-day minimum | 50.4 | m3/s | +6.7 (L) | +5.7 (L) | +24.2 (L) | +25.2 (L) | |
| 1-day maximum | 2031 | m3/s | +6.9 (L) | −21.1 (L) | +13.1 (L) | −19.8 (L) | |
| 3-day maximum | 1945 | m3/s | +5 (L) | −20.3 (L) | +9.4 (L) | −19 (L) | |
| 7-day maximum | 1711 | m3/s | +3.8 (L) | −17.8 (L) | +7.3 (L) | −16.3 (L) | |
| 30-day maximum | 960 | m3/s | +0.6 (L) | −3.6 (L) | +4.6 (L) | −2.2 (L) | |
| 90-day maximum | 703 | m3/s | +0 (L) | −1 (L) | +5.1 (L) | +0.9 (L) | |
| Base flow index | 0.0595 | – | −4.6 (L) | +19.8 (L) | +7 (L) | +35.8 (M) | |
| Parameter Group #3 | |||||||
| Date of minimum | 49 | Julian d. | +3 (L) | +3.5 (L) | +2 (L) | +2.4 (L) | |
| Date of maximum | 203 | Julian d. | +5.3 (L) | +5.8 (L) | +4.7 (L) | +5.1 (L) | |
| Parameter Group #4 | |||||||
| Low pulse count | 4 | ea. | +2.5 (L) | −30 (L) | +2.5 (L) | −30 (L) | |
| Low pulse duration | 16 | d | −15.9 (L) | +28.4 (L) | −7.8 (L) | +17.7 (L) | |
| High pulse count | 5 | ea. | +4 (L) | −32 (L) | +4 (L) | −32 (L) | |
| High pulse duration | 7 | d | +9.3 (L) | +72.1 (H) | +2.9 (L) | +87.1 (H) | |
| Parameter Group #5 | |||||||
| Rise rate | 15.1 | m3/s | +3.7 (L) | −28.8 (L) | +12.2 (L) | −26.9 (L) | |
| Fall rate | −6.2 | m3/s | +2.5 (L) | −17.8 (L) | +6.1 (L) | −14.8 (L) | |
| Num. of reversals | 65 | ea. | −2 (L) | −32 (L) | −5.2 (L) | −32 (L) | |
© 2016 by the authors; licensee MDPI, Basel, Switzerland. This article is an open access article distributed under the terms and conditions of the Creative Commons by Attribution (CC-BY) license (http://creativecommons.org/licenses/by/4.0/).
Share and Cite
Kim, S.; Noh, H.; Jung, J.; Jun, H.; Kim, H.S. Assessment of the Impacts of Global Climate Change and Regional Water Projects on Streamflow Characteristics in the Geum River Basin in Korea. Water 2016, 8, 91. https://doi.org/10.3390/w8030091
Kim S, Noh H, Jung J, Jun H, Kim HS. Assessment of the Impacts of Global Climate Change and Regional Water Projects on Streamflow Characteristics in the Geum River Basin in Korea. Water. 2016; 8(3):91. https://doi.org/10.3390/w8030091
Chicago/Turabian StyleKim, Soojun, Huiseong Noh, Jaewon Jung, Hwandon Jun, and Hung Soo Kim. 2016. "Assessment of the Impacts of Global Climate Change and Regional Water Projects on Streamflow Characteristics in the Geum River Basin in Korea" Water 8, no. 3: 91. https://doi.org/10.3390/w8030091
APA StyleKim, S., Noh, H., Jung, J., Jun, H., & Kim, H. S. (2016). Assessment of the Impacts of Global Climate Change and Regional Water Projects on Streamflow Characteristics in the Geum River Basin in Korea. Water, 8(3), 91. https://doi.org/10.3390/w8030091