Article

Constraining Parameter Uncertainty in Simulations of Water and Heat Dynamics in Seasonally Frozen Soil Using Limited Observed Data

1
State Key Laboratory of Water Resources and Hydropower Engineering Science, Wuhan University, Wuhan 430072, China
2
Department of Sustainable Development, Environmental Science and Engineering, KTH Royal Institute of Technology; Stockholm SE-10044, Sweden
*
Author to whom correspondence should be addressed.
Water 2016, 8(2), 64; https://doi.org/10.3390/w8020064
Submission received: 20 November 2015 / Revised: 5 February 2016 / Accepted: 14 February 2016 / Published: 18 February 2016

Abstract

:
Water and energy processes in frozen soils are important for better understanding hydrologic processes and water resources management in cold regions. To investigate the water and energy balance in seasonally frozen soils, CoupModel combined with the generalized likelihood uncertainty estimation (GLUE) method was used. Simulation work on water and heat processes in frozen soil in northern China during the 2012/2013 winter was conducted. Ensemble simulations through the Monte Carlo sampling method were generated for uncertainty analysis. Behavioral simulations were selected based on combinations of multiple model performance index criteria with respect to simulated soil water and temperature at four depths (5 cm, 15 cm, 25 cm, and 35 cm). Posterior distributions for parameters related to soil hydraulic, radiation processes, and heat transport indicated that uncertainties in both input and model structures could influence model performance in modeling water and heat processes in seasonally frozen soils. Seasonal courses in water and energy partitioning were obvious during the winter. Within the day-cycle, soil evaporation/condensation and energy distributions were well captured and clarified as an important phenomenon in the dynamics of the energy balance system. The combination of the CoupModel simulations with the uncertainty-based calibration method provides a way of understanding the seasonal courses of hydrology and energy processes in cold regions with limited data. Additional measurements may be used to further reduce the uncertainty of regulating factors during the different stages of freezing–thawing.

1. Introduction

It has been demonstrated that soil freezing and thawing processes play vital roles in the surface water and energy balance in cold regions [1]. Furthermore, research on water and heat transport in cold regions could provide a better understanding on regional hydrology and agricultural water resources management with respect to climate change [2,3]. However, the water and energy processes in cold regions are very complicated due to seasonal variations in the upper and lower boundary conditions [4,5], even though accurate estimation of water and energy balance on the surface of seasonally frozen soil is important for the water and heat flow in soil [6] as well as for a better understanding of the interactions between groundwater, surface water, and climate change in cold regions [7].
Previously, various numerical models were established based on field and laboratory experiments in order to study transport in frozen soils. A coupled model (CoupModel) for water and heat transport was presented by Jansson and Halldin [8]. Alvenäs and Jansson [9] provided a soil energy balance approach to calculate the surface water and heat exchange fluxes, and a review of the model was provided by Jansson and Karlberg [10]. Other numerical models, such as SHAW [11], FROSTB [12], and HYDRUS-1D [13], also represented the soil freezing and thawing processes.
However, due to the complexity of frozen soil-related processes, some parameters related to soil water and heat flow cannot be directly obtained or are not sufficiently known. For example, the hydraulic conductivity, thermal properties, and surface conditions add uncertainties to the modeling work. A practical solution for addressing the uncertainty in parameters is to calibrate the related parameters using some already known variables (e.g., soil water and temperature data). Accordingly, Zhang and Sun [14] studied the changes in the surface energy and water balance in frozen soils with a soil freezing model. Wu et al. [15] modeled the surface water and heat balance in a seasonally frozen clay soil in northeast China and analyzed the uncertainties in energy balance modeling using CoupModel combined with the generalized likelihood uncertainty estimation (GLUE) method.
GLUE is widely used to estimate uncertainty in parameters, measurements, and model structures [16]. Instead of obtaining an optimal value for each calibrated parameter, GLUE provides a set of parameter values by dividing all model simulations into behavioral and non-behavioral models [17]. Only the behavioral models are accepted as reliable results after the application of one or more specific subjective criteria on certain performance indicators. This will result in an ensemble of simulation results containing equally good representations of the simulated system (known as “equifinality”). However, the choice of performance indicators is subjective, and the chosen parameters could substantially impact the selection of behavioral models. Accordingly, several studies have emphasized the importance of the choice of criteria for defining the acceptable runs when using the GLUE method for uncertainty analysis [18].
In cold regions, soil temperature is sometimes easy to obtain with high precision using well-calibrated temperature sensors. For water content, the time-domain reflectometry (TDR) method could result in uncertainties or even failures in measurement due to the existence of solutes in soil. Total water content could be obtained by frequent sampling and then determined with oven-dry method. Eddy covariance (EC) data is sometimes difficult to obtain for most regions, thus flux data are also not common for some study sites. However, basic meteorological data such as precipitation, air temperature, global radiation, humidity, and pressure could be easily obtained from micro-meteorology stations in study site or local meteorological stations. Modeling with these commonly available data would be of interest for research in similar conditions. It is also important to analyze how the combination of a process-based model with an uncertainty analysis method could help us in understanding freezing/thawing processes.
In the Hetao Irrigation District, Inner Mongolia, northern China, the water and energy balance during the winter is particularly challenging due to an uneven distribution of irrigation and precipitation as well a high evaporation rate. Soil freezing/thawing often occurs from November to April of the following year. Since the 1990s, it has been an agricultural water management practice to implement irrigation from October to November of each year after harvest in order to store water in the frozen soil and leach surplus salt from the root zone. The high groundwater table during the wintertime may cause a large discharge to the upper layer, which influences the hydrology as well as the energy cycles in the frozen soil. For this region, it is highly important to investigate the interactions between soil water and heat flow and atmosphere, which could play an important role in the design of proper water resources management in cold, arid regions facing climate change issues. Besides, due to dry conditions in the winter, diurnal and seasonal changes in soil freezing/thawing are strong and could also influence surface water and energy balance. In this study, the commonly available data (e.g., meteorological data, soil temperature, and soil total water content) for cold region experiments were used for analysis of seasonal freezing/thawing processes. The objectives of this study are to: (i) analyze uncertainty in modeling the water and energy balance in seasonally frozen soils with limited data; (ii) identify the influential parameters based on the GLUE uncertainty analysis method; and (iii) analyze seasonal and diurnal courses in water and energy partitioning during the soil freezing and thawing periods.

2. Materials and Methods

2.1. Study Site Description

The study site is located at Yichang Experimental Station, Hetao Irrigation District in Inner Mongolia, China (40°12′ N, 108°08′ E), which is a typical Yellow River irrigated district. It is also a salinization-affected district. After annual crop harvest in autumn, irrigation is conducted (called “Autumn Irrigation”, abbreviated as AI hereafter) before soil freezing in order to leach salt from the root zone and store water in the frozen soil profile for seeding in the next spring. The agricultural field, which covers an area of 20 ha, is cultivated with sunflowers from May to early October every year and is equipped with drainage ditches and irrigation canals.

2.2. Experimental Design

Experiments were carried out from 1 October 2012 to 30 April 2013. The study period included AI practice and freezing/thawing (FT) processes. AI practice occurred from 8 November 2012 through 10 November 2012, with an irrigation rate of 86 mm·day−1 for 3 day (totally 258 mm). The groundwater table depth was measured every day from 7 November 2012 to 15 November 2012, and then it was measured for every five days during the FT periods. The soil water was sampled every 10 days during experiments; the sample interval was 10 cm from the surface to a depth of 140 cm. In addition, the soil gravimetric water content was measured by an oven-dry method at 105 °C for 8 h.
An automatic meteorological station (RR9100, Rainboot Co., Ltd, Beijing, China) was installed in the plot 10 m away from the field, to record the hourly precipitation, global radiation, air temperature, wind speed, relative humidity, and soil temperature at depths of 5, 15, 25, and 35 cm. The physical properties of the soil at different depths were determined in a laboratory, as shown in Table 1. The hydraulic parameters based on the Brooks–Corey equation and the Mualem equation [19] were estimated by the sand, silt, and clay percentages in the soil, according to methods by Rawls and Brakensiek [20].
During the wintertime (1 October 2012 to 30 April 2013), five periods were defined according to air temperature changes, as shown in Figure 1. The periods are detailed in the following. Period I (1 October 2012 to 31 October 2012) was the cooling period, in which the air temperature decreased rapidly to approximately zero and the accumulated air temperature reached its peak value. Period II (1 November 2012 to 16 December 2012) was the freezing period, in which the air temperature fluctuated from above zero to below zero, and the accumulated air temperature decreased gradually from peak value to zero. Period III (17 December 2012 to 24 February 2013) was the deep freezing period, in which the air temperature remained at low negative values, and the accumulated air temperature greatly decreased to its lowest value. Period IV (25 February 2013 to 9 April 2013) was the thawing period, in which the air temperature increased to above zero and the accumulated air temperature increased gradually. Period V (10 April 2013 to 30 April 2013) was the thawed period, in which the air temperature was above zero and the accumulated air temperature increased rapidly.

2.3. Model Description

The CoupModel is a one-dimensional soil-vegetation-atmosphere model used for simulating water and heat processes in soil as well as in the atmosphere. A detailed technical description of this model can be found in Jansson and Karlberg [10]. In this study, the water and heat processes for bare soil were considered so as to evaluate surface water–groundwater interactions and heat transport in seasonally frozen soils.

2.3.1. Soil Water Processes

Soil water flux was calculated by Richard’s equation, which considers vapor flow (Equation (1)). The water transport in partially frozen soil was described using a two-domain approach. Drainage was considered by using an empirical linear drainage equation:
q w = k w ( ψ z 1 ) q v ,
where k w is the unsaturated conductivity (m·s−1), ψ is the water tension (m), and q v is the vapor flux (m·s−1).
Water vapor flow in the model is mainly based on Fick’s law of diffusion, modified for soils:
q v = d v a p D 0 f a C v z ,
where d v a p is a parameter accounting for tortuosity, D 0 is the diffusion coefficient for free air (m2·s−1), f a is the soil air content (m3·m−3), C v is the concentration of vapor in the soil air (kg·m−1), and D v is the diffusion coefficient for vapor in the soil (m2·s−1).

2.3.2. Soil Heat Processes

Soil heat flux consisted of soil conductive heat flux and convective heat fluxes by water and vapor flow (Equation (2)). The upper boundary was determined by heat flow in the uppermost layer, and the lower boundary was determined by annual mean air temperature and amplification. Soil thermal properties were determined by equations adapted from Kersten [21] that consider the soil frozen/unfrozen conditions:
q h = k h T z + C w T q w + L v q v ,
where the indices h , v , and w refer to heat, vapor, and liquid water, respectively; q is the flux (m·s−1); k is the conductivity (m·s−1); T is the soil temperature (°C); C is the heat capacity (J·kg−1·°C−1); L is the latent heat (J·kg−1); and z is the depth (m).

2.3.3. Soil Evaporation and Radiation Processes

Soil sensible and latent heat fluxes as well as surface heat flux are taken to balance the net radiation (Equation (4)):
R n s = L v E s + H s + q h ,
where L v E s is the sum of latent heat flux (J·m−2·s−1), H s is the sensible heat flux (J·m−2·s−1), and q h is the heat flux to the soil (J·m−2·s−1).
Sensible, latent, and soil heat fluxes could be calculated as below:
H s = ρ a c p ( T s T a ) r a s
L v E s = ρ a c p γ ( e s u r f e a ) r a s
q h = k h ( T s T 1 ) Δ z 1 / 2 + L v q v , s ,
where T s is the soil surface temperature (°C), T a is the air temperature (°C), r a s is the aerodynamic resistance (s·m−1), e s u r f is the vapor pressure at the soil surface (m), e a is the actual vapor pressure in the air (m), ρ a is the air density (kg·m−3), c p is the heat capacity of air (J·kg−1·°C−1), L v is the latent heat of vaporization (J·kg−1) and γ is the psychometric constant (Pa·°C−1), k h is the thermal conductivity of the topsoil layer (W·m−1·°C−1), T s is the soil surface temperature (°C), T 1 is the middle of the uppermost soil compartment temperature (°C), Δ z 1 is the depth of the uppermost soil compartment (m), and q v , s is the latent water vapor flow from soil surface to the central point of the uppermost soil layer (m·s−1).
The surface vapor pressure, e s , was expressed as:
e s u r f = e s ( T s ) e ( ψ 1 M g e c o r r R ( T s + 273.15 ) ) ,
where e s ( T s ) is the saturated vapor pressure at the surface temperature (m), ψ 1 is the water tension at the uppermost soil layer (m), g is the acceleration due to gravity (m·s−2), M is the molecular mass of water (g·mol−1), and T s is the soil surface temperature (°C). e c o r r is an empirical correction factor used to compensate for the difference between the soil water potential in the uppermost layer and the surface water potential, expressed as:
e c o r r = 10 ( δ s u r f ψ e g ) ,
where δ s u r f is the surface water balance based on the difference between precipitation, evaporation, and vapor flux; and ψ e g is a parameter that determines the steepness of soil water potential gradient from the middle of the top layer to the surface. δ s u r f is defined as:
δ s u r f ( t ) = max { s d e f , min [ s e x c e s s , δ s u r f ( t 1 ) ] + W p o o l + [ q i n E s q v , s + i d r i p ( z 1 ) ] Δ t } ,
where s d e f is maximum surface water deficit (m), s e x c e s s is the maximum surface water excess (m), W p o o l is the surface water pool (m), q i n is the infiltration water flux (m·s−1), E s is the evaporation rate (m·s−1), q v , s is the vapor flux (m·s−1), and i d r i p is the irrigation rate (m·s−1).
In solving the energy balance equation, soil surface temperature T s in Equation (7) was adjusted during the iterations of Equation (4) to make it balanced. Equations (5)–(10) connected energy processes to soil water processes in the calculation of soil evaporation because the determination of surface vapor pressure was related to surface water potential (Equation (8)) as well as surface water balance (Equation (10)).
In the setup of the model, hourly meteorological data including air temperature, humidity, global radiation, wind speed, and precipitation as well as irrigation were used for driving the model. The soil profile was divided into 16 layers, with increased thickness from 0.1 m to 1 m within the 0 to 6 m soil column depth. The modeling period was from 1 October 2012 to 30 April 2013 with hourly resolution. To avoid numerical problems because of influences of soil compartment sizes, soil properties, and boundary conditions, and also to improve the model efficiency, the number of iterations for each day was set as 384 and the time step was adjusted empirically based on calculations of flux, frost, and groundwater conditions.

2.4. GLUE Method Uncertainty Analysis

Model parameters related to soil water and heat processes were selected with reasonable ranges for calibration, as shown in Table 2. The calibrated parameters and their ranges were determined based on previous studies [10] as well as the conditions of the study site. Parameters that were not included in the calibration framework were set as fixed values based on the model manual. The soil temperature and total water content from 1 October 2012 to 30 April 2013 at depths of 5, 15, 25, and 35 cm were used to evaluate the performance of the model. Hourly mean soil temperature (5088 data points) and daily mean total water content at 14 measurement dates (irregular, event-based) at each layer were used. Three model performance indices (R2, the determination coefficient; RMSE, the root mean square error of the model; and ME, the mean error of the model) were chosen to describe the simulation performance efficiency in representing the observed data. These three indices were selected to control dynamics and deviations of simulation results with respect to soil temperature and total water content at different soil layers. For soil temperature, R2 and RMSE were good indicators for model performance, while for total water content, the adding of ME as an index was necessary for lowering discrepancies between simulated and measured data.
To obtain approximately 100 accepted simulations out of 20,000 samplings with the Monte Carlo method, R2 > 0.9 and 0.4 were chosen for the soil temperature and water content, respectively. The RMSE for the soil temperature and total water content was constrained to the top third of the prior ranges. For ME, the top quarter of the prior range was applied to constrain the soil temperature and total water content. The prior and posterior ranges for the selected indices are shown in Table 3. Finally, 73 behavioral models were selected (Table 3).

3. Results

3.1. Model Calibration Performance

The model performance is given in Table 4 for both the prior total and behavioral models. R2 values for behavioral models increased in performance for the calibrated soil temperature and especially for the total water content. The mean R2 for the behavioral models reached 0.67. The RMSE for behavioral models also increased slightly at the 5 and 15 cm depths for the soil temperature with increases of 0.06 and 0.01 °C, respectively. The RMSE for the total water content was well-constrained for all calibrated layers, with a decreased range of 3.34 to 9.11 cm3·cm−3. The ME for both the soil temperature and the total water content significantly decreased for all layers, which indicates that ME was effectively constrained by the selected criteria.
Model performance for the total water content simulation showed significant increase. The constraint of R2, RMSE, and ME for the soil temperature was shown to be less significant in comparison with the changes in model performance in soil total water content (Table 4). This was mainly because the modeling of soil temperature was less uncertain in comparison with modeling of soil water, and the measurements for soil temperature were more reliable with an automatic data logger, given the precision of temperature sensors. In contrast, the water process in the seasonally frozen soil could result in some uncertainties in this study due to the measurements and the complicated freezing/thawing processes. Meanwhile, performance indices for the total water content showed that ME was negative for all layers, indicating that the simulated water content was generally lower than the observed content. Wu and Jansson [15] also found that a trade-off effect existed when searching for a model for both temperature and moisture.
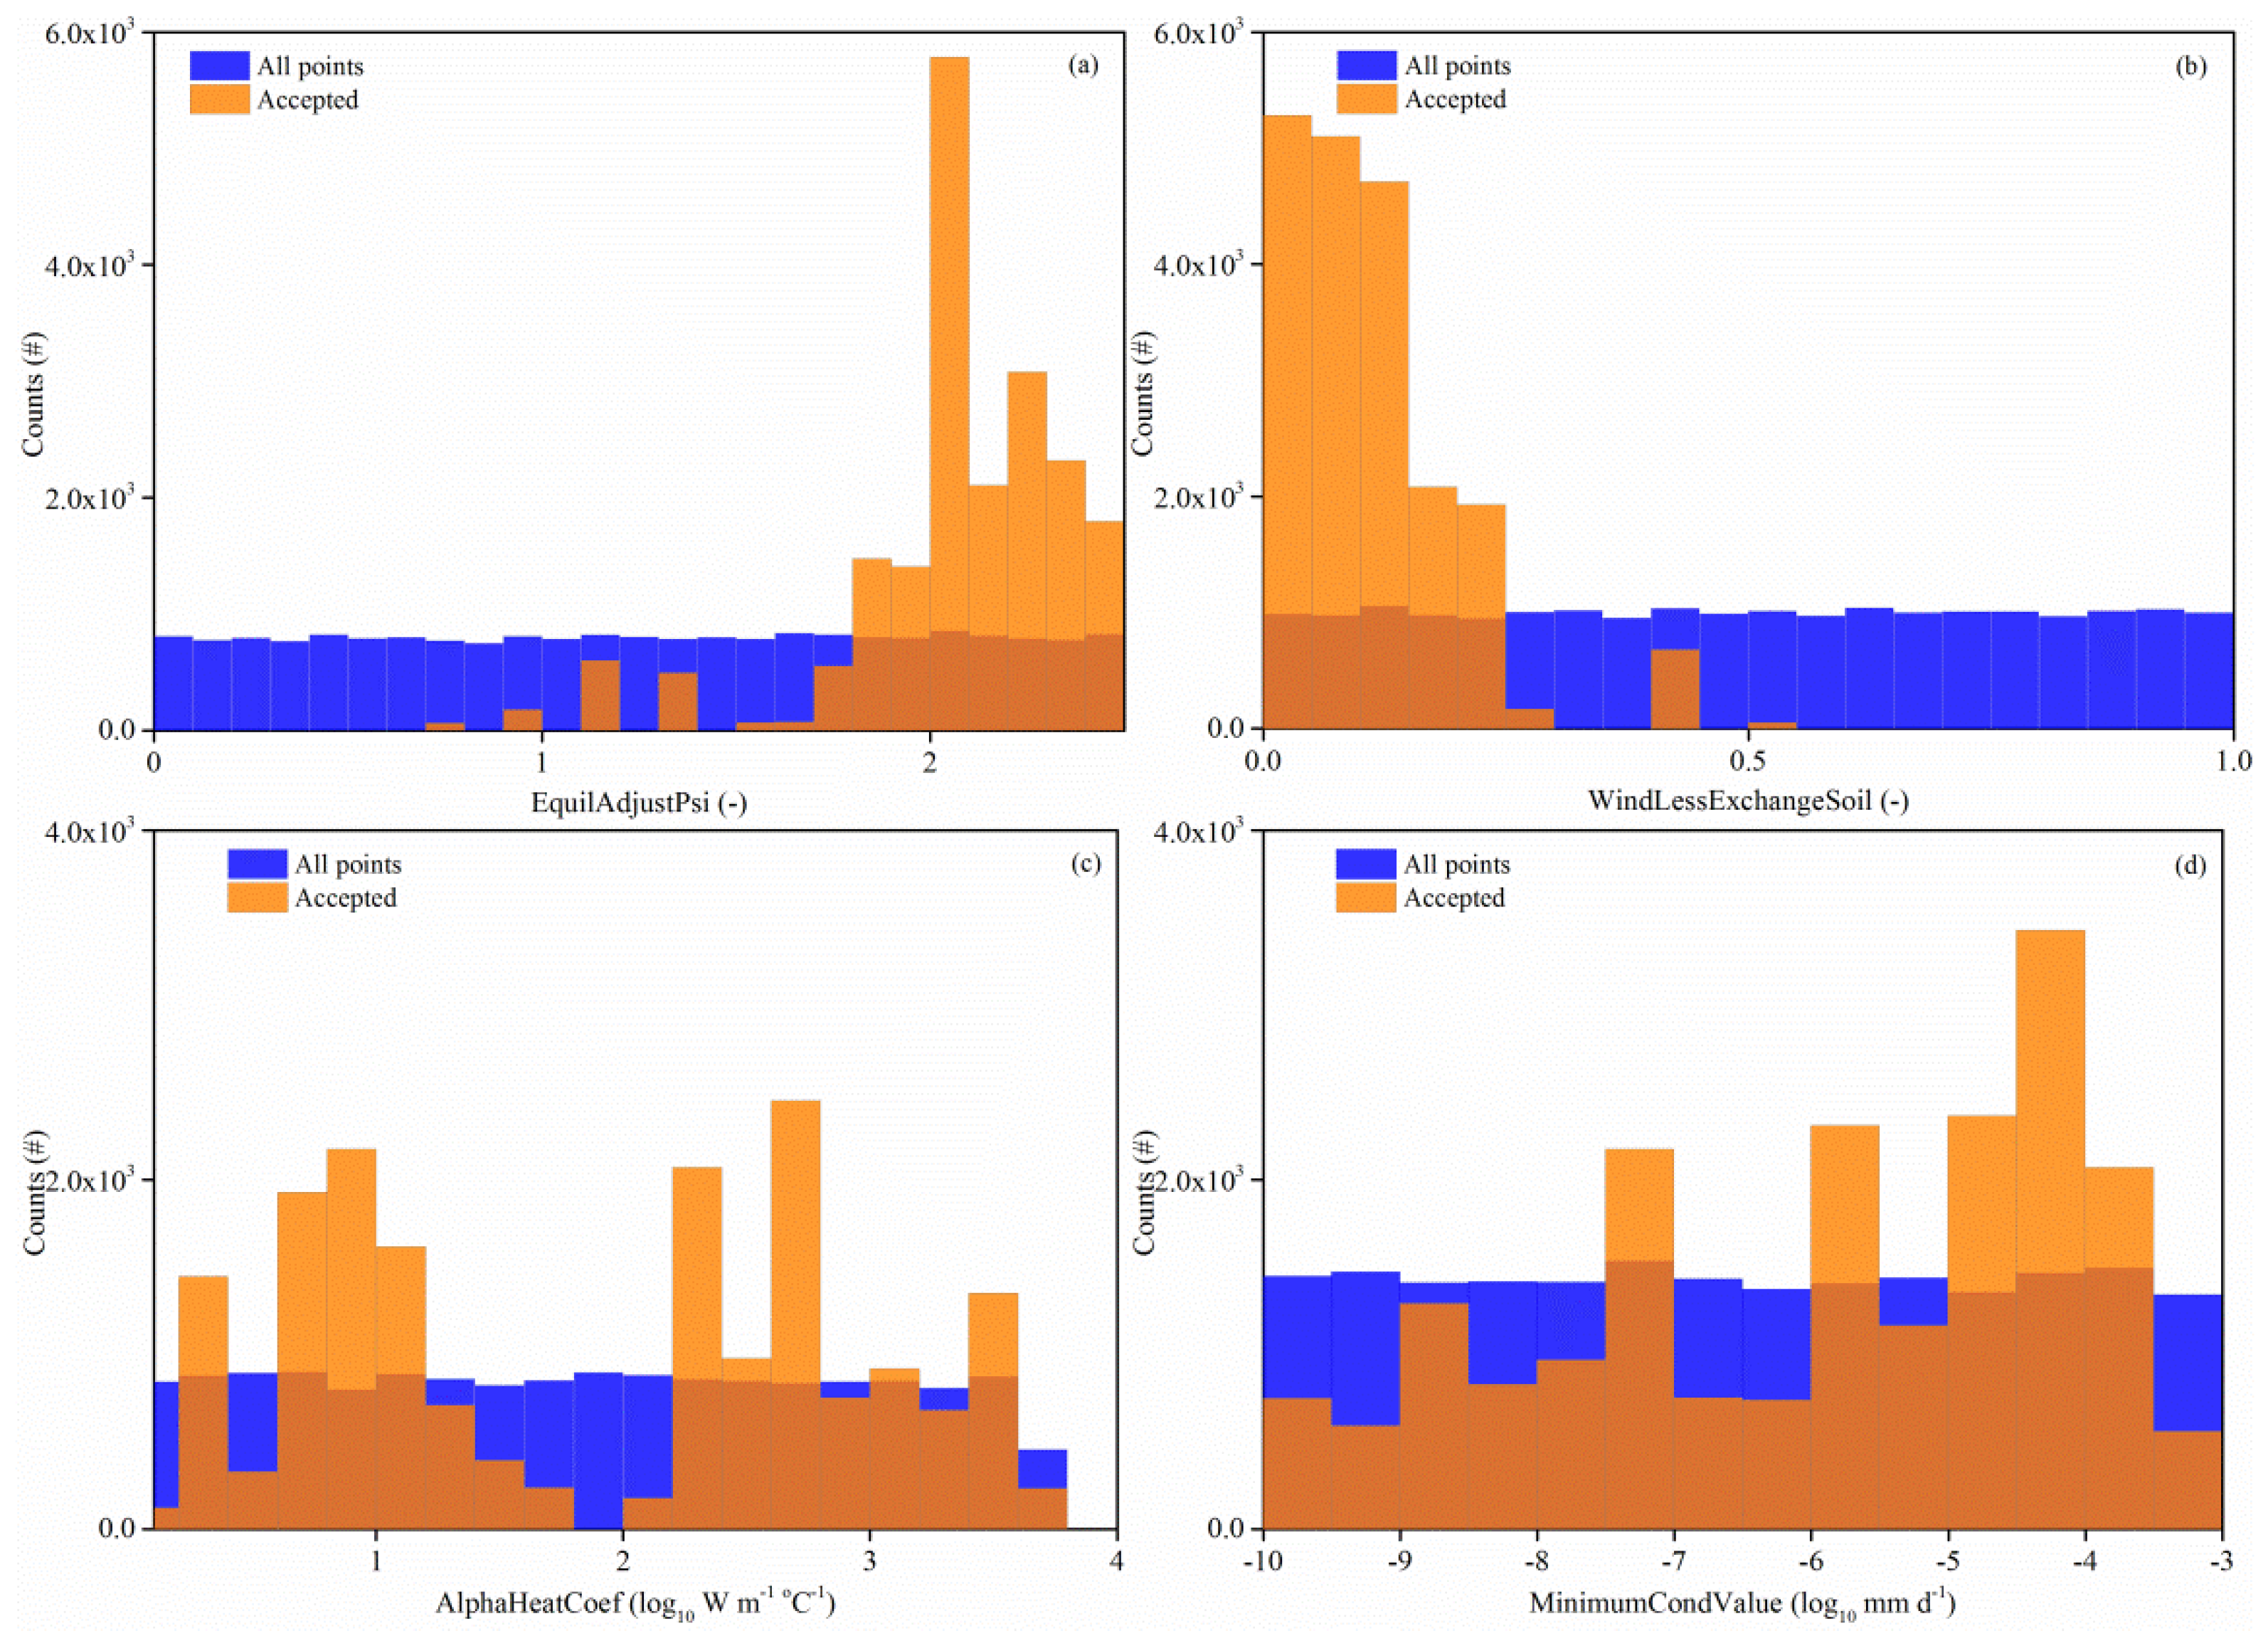
Table 2 shows the mean values for the parameters in all 20,000 simulations as well as the selected 73 behavioral simulations, with the posterior range ratios of the parameters. Among the 19 calibrated parameters, four parameters exhibited large differences: EquilAdjustPsi ( ψ e g ), WindLessExchangeSoil ( r a , max 1 ), AlphaHeatCoef ( α h ), and MinimumCondValue ( k min c ) with posterior range ratios of 0.69, 0.55, 0.82, and 0.36, respectively.
As shown in Figure 2, these four parameters in posterior simulation ensemble did not show uniform distributions and were constrained to certain ranges. ψ e g and r a , max 1 were two parameters that related to soil evaporation. A higher ψ e g value indicated larger differences between the surface vapor pressure and the liquid water potential of the uppermost soil layer. The posterior distribution for ψ e g tended to accumulate toward the upper limit, which indicated a large difference between surface water potential and uppermost soil layer. Alvenäs and Jansson [9] also indicated that a higher value (e.g., above 1.2) for ψ e g should be used to prevent soil evaporation from being too high. In this study, the surface soil layer would be very dry during freezing, and the value for ψ e g was suggested to be around 2.
r a , max 1 can be adjusted in order to avoid an exaggerated cooling of the surface under extremely stable or windless conditions. Low values correspond to a very small exchange during stable atmospheric conditions, whereas high values allow a heat exchange during stable atmospheric conditions. The lowering of the r a , max 1 range for behavioral models indicated that during soil freezing and thawing periods, the stable or windless conditions during the nighttime should be taken into consideration since they strongly impact the energy balance of the soil surface.
The parameter α h controlled the refreezing of water in the high flow domain. In this study, the α h value tended to be low, which indicated that water refreezing was not that common in the study site. This was because infiltration into frozen soil was not common in the study site because there was very little precipitation during the winter, except for the AI period.
The parameter k min c was used to estimate the unsaturated hydraulic conductivity during dry conditions, which are typical for partially frozen soil. As previously studied, the hydraulic conductivity can decrease to very low values [22]. The relatively low value of this parameter indicated that redistribution during freezing was not strong at the study site.

3.2. Simulation Results Based on Mean Values of Behavioral Parameters

The mean values for each calibrated parameter were used for a single simulation to analyze the water and energy processes in the study site instead of using one of the behavioral models. However, due to the complexity of the system and the limited Monte Carlo sampling times, using the mean values for the parameter sets could risk missing global or local peaks in the model space [23], although it is necessary for quantifying model outputs and check of balances. To test the accessibility of the single simulation based on the mean values of the parameter sets in the behavioral models, a comparison work was conducted. The small changes in Table 5 indicated that using the mean parameter values of the behavioral models to represent measurements was acceptable. Thus, the results from the single simulation based on the mean parameter values in the behavioral models were used to analyze the water and energy balance in the study site.
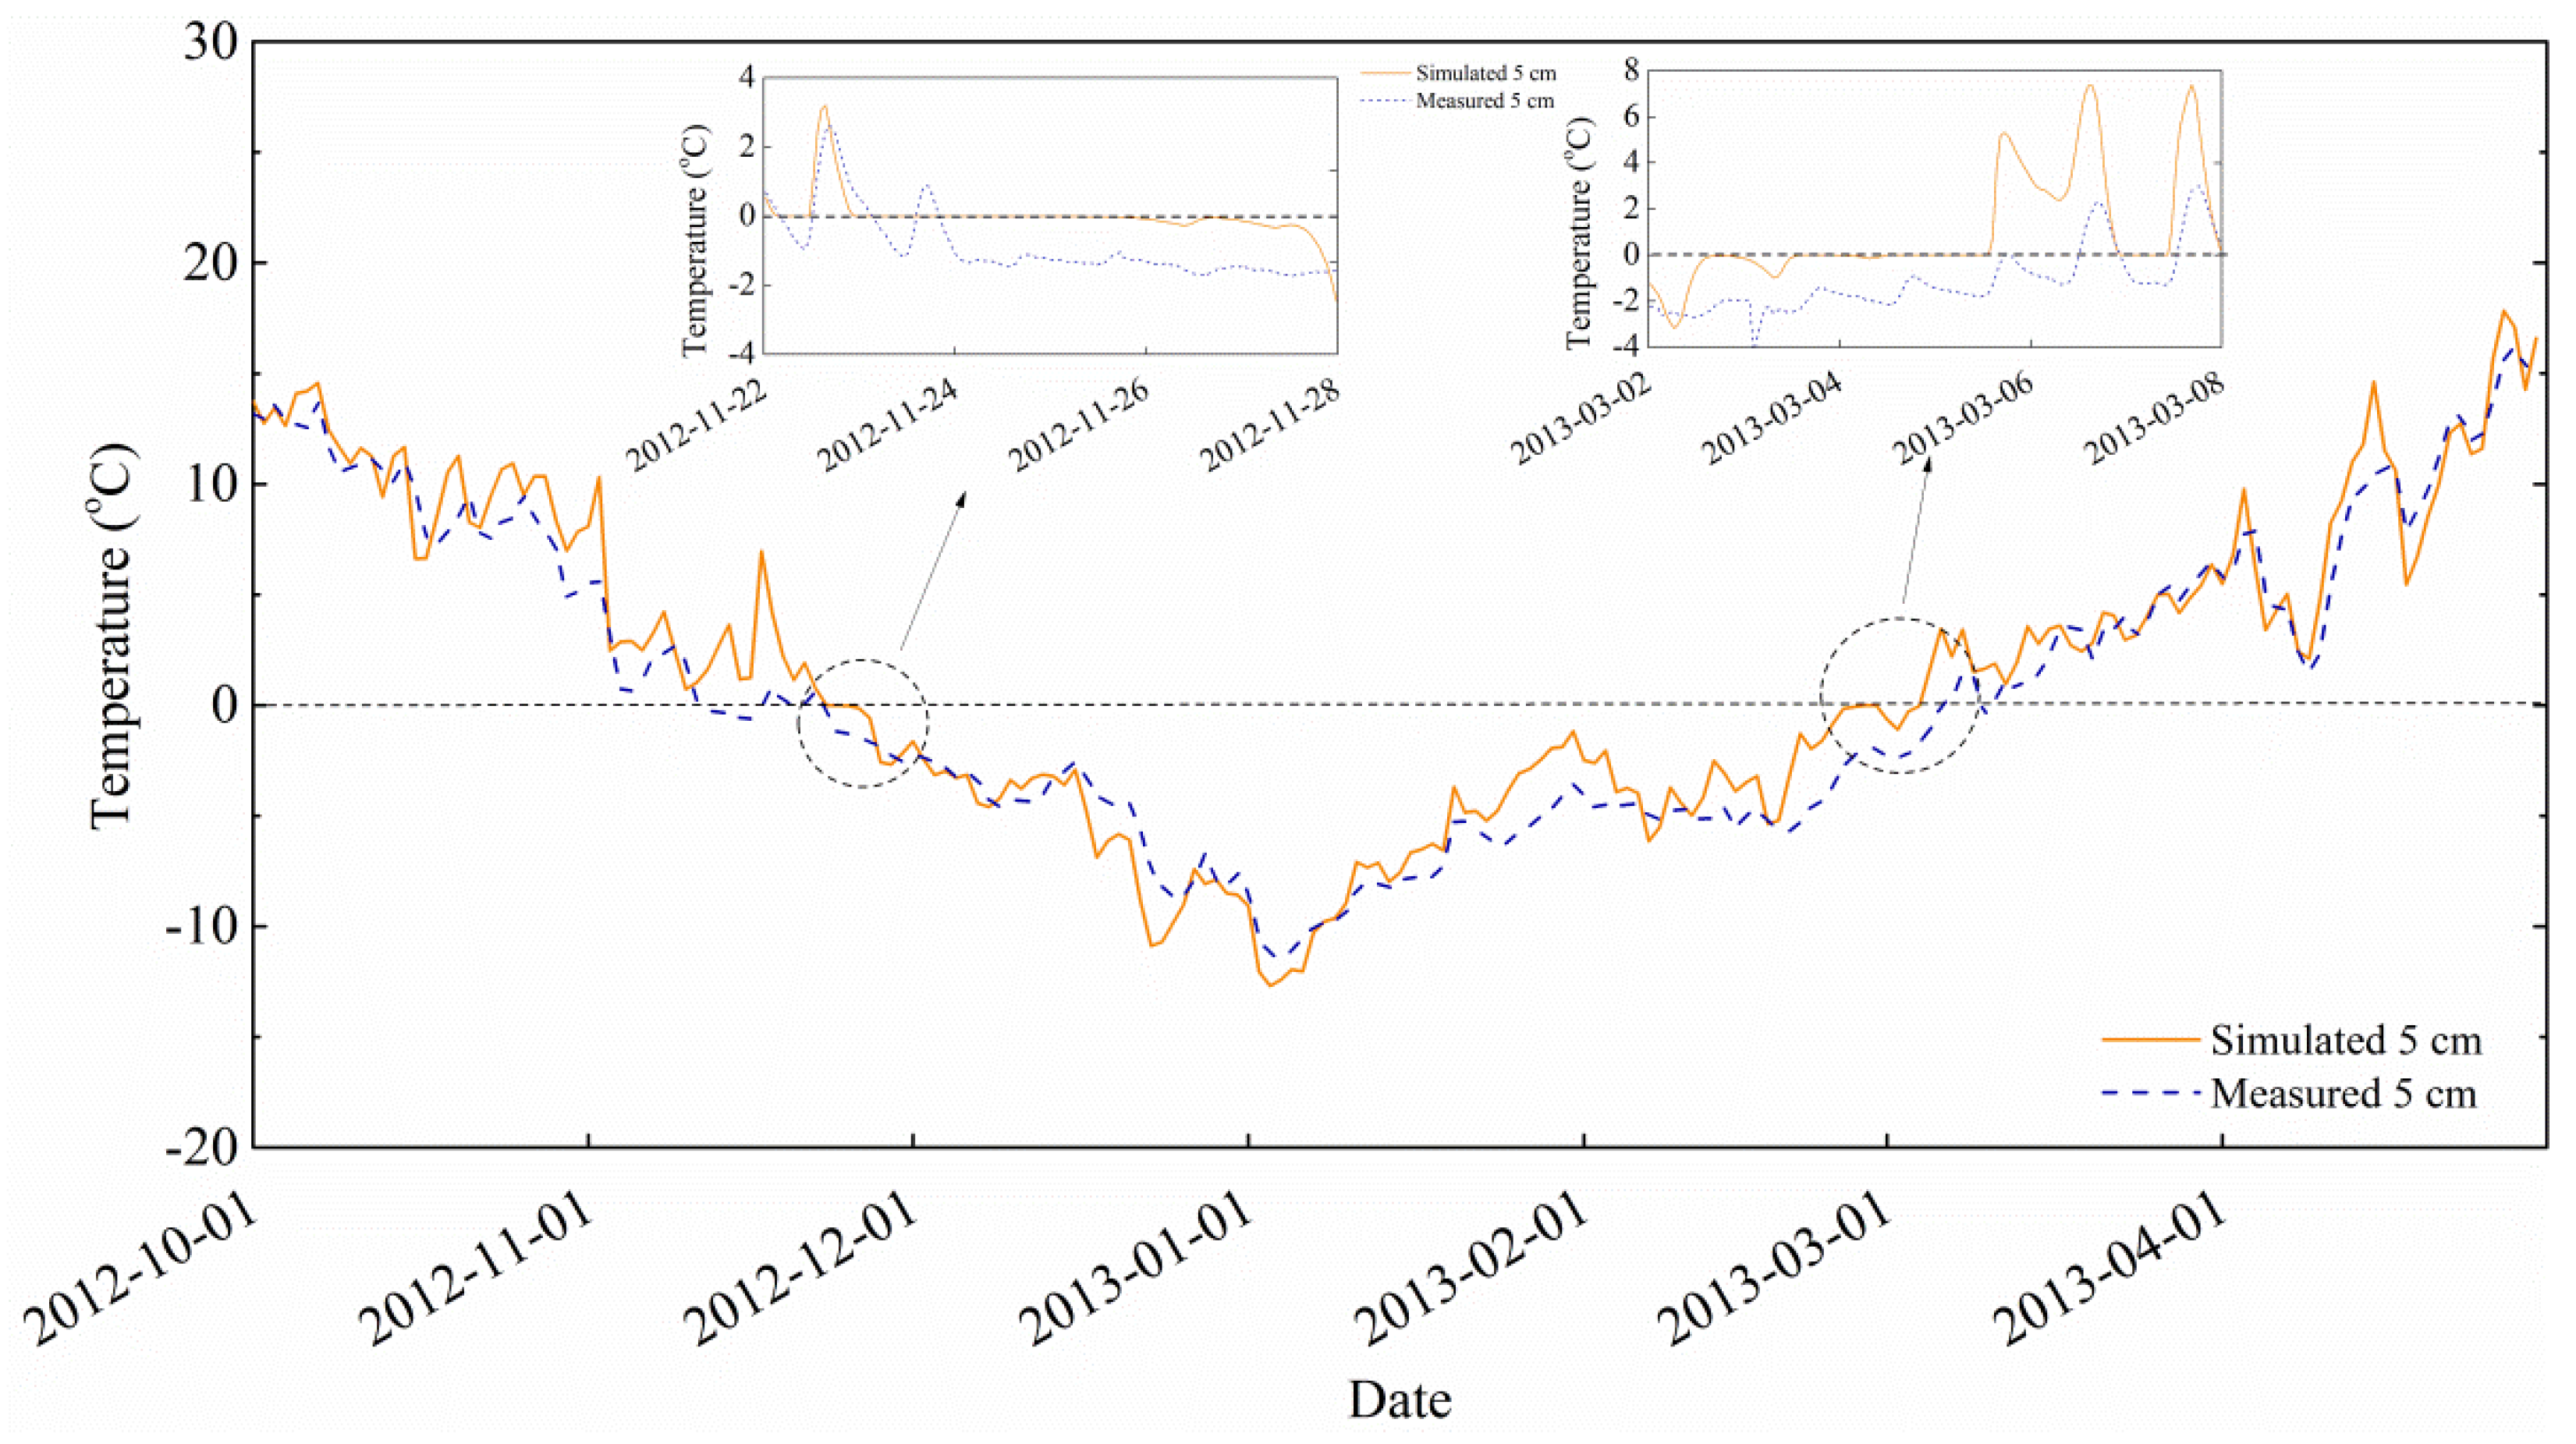
The model performance for soil temperature in the calibrated layers (5, 15, 25, and 35 cm) is depicted in Table 5. The simulated soil temperature could reflect the actual soil temperature dynamics well during the study period, and the lower layer showed better simulated results than the surface layer, which was because the surface layer was more influenced by the atmosphere, with more rapid fluctuations. However, the simulated soil temperature had an obvious constant period (about one week) when the temperature showed a positive–negative shift during freezing and a negative–positive shift during thawing (Figure 3). This indicated that continuous phase transitions occurred when the soil began freezing or thawing. During these periods, the available energy was mainly used for phase transition, and the soil temperature would keep steady at zero during these periods. Furthermore, another constant soil temperature “platform” was detected in the measured soil temperature, and it occurred earlier but was shorter than the simulated one. This indicated that in soil that contained solute, the freezing point depression could not be neglected in calculating the frozen soil energy and water balance.
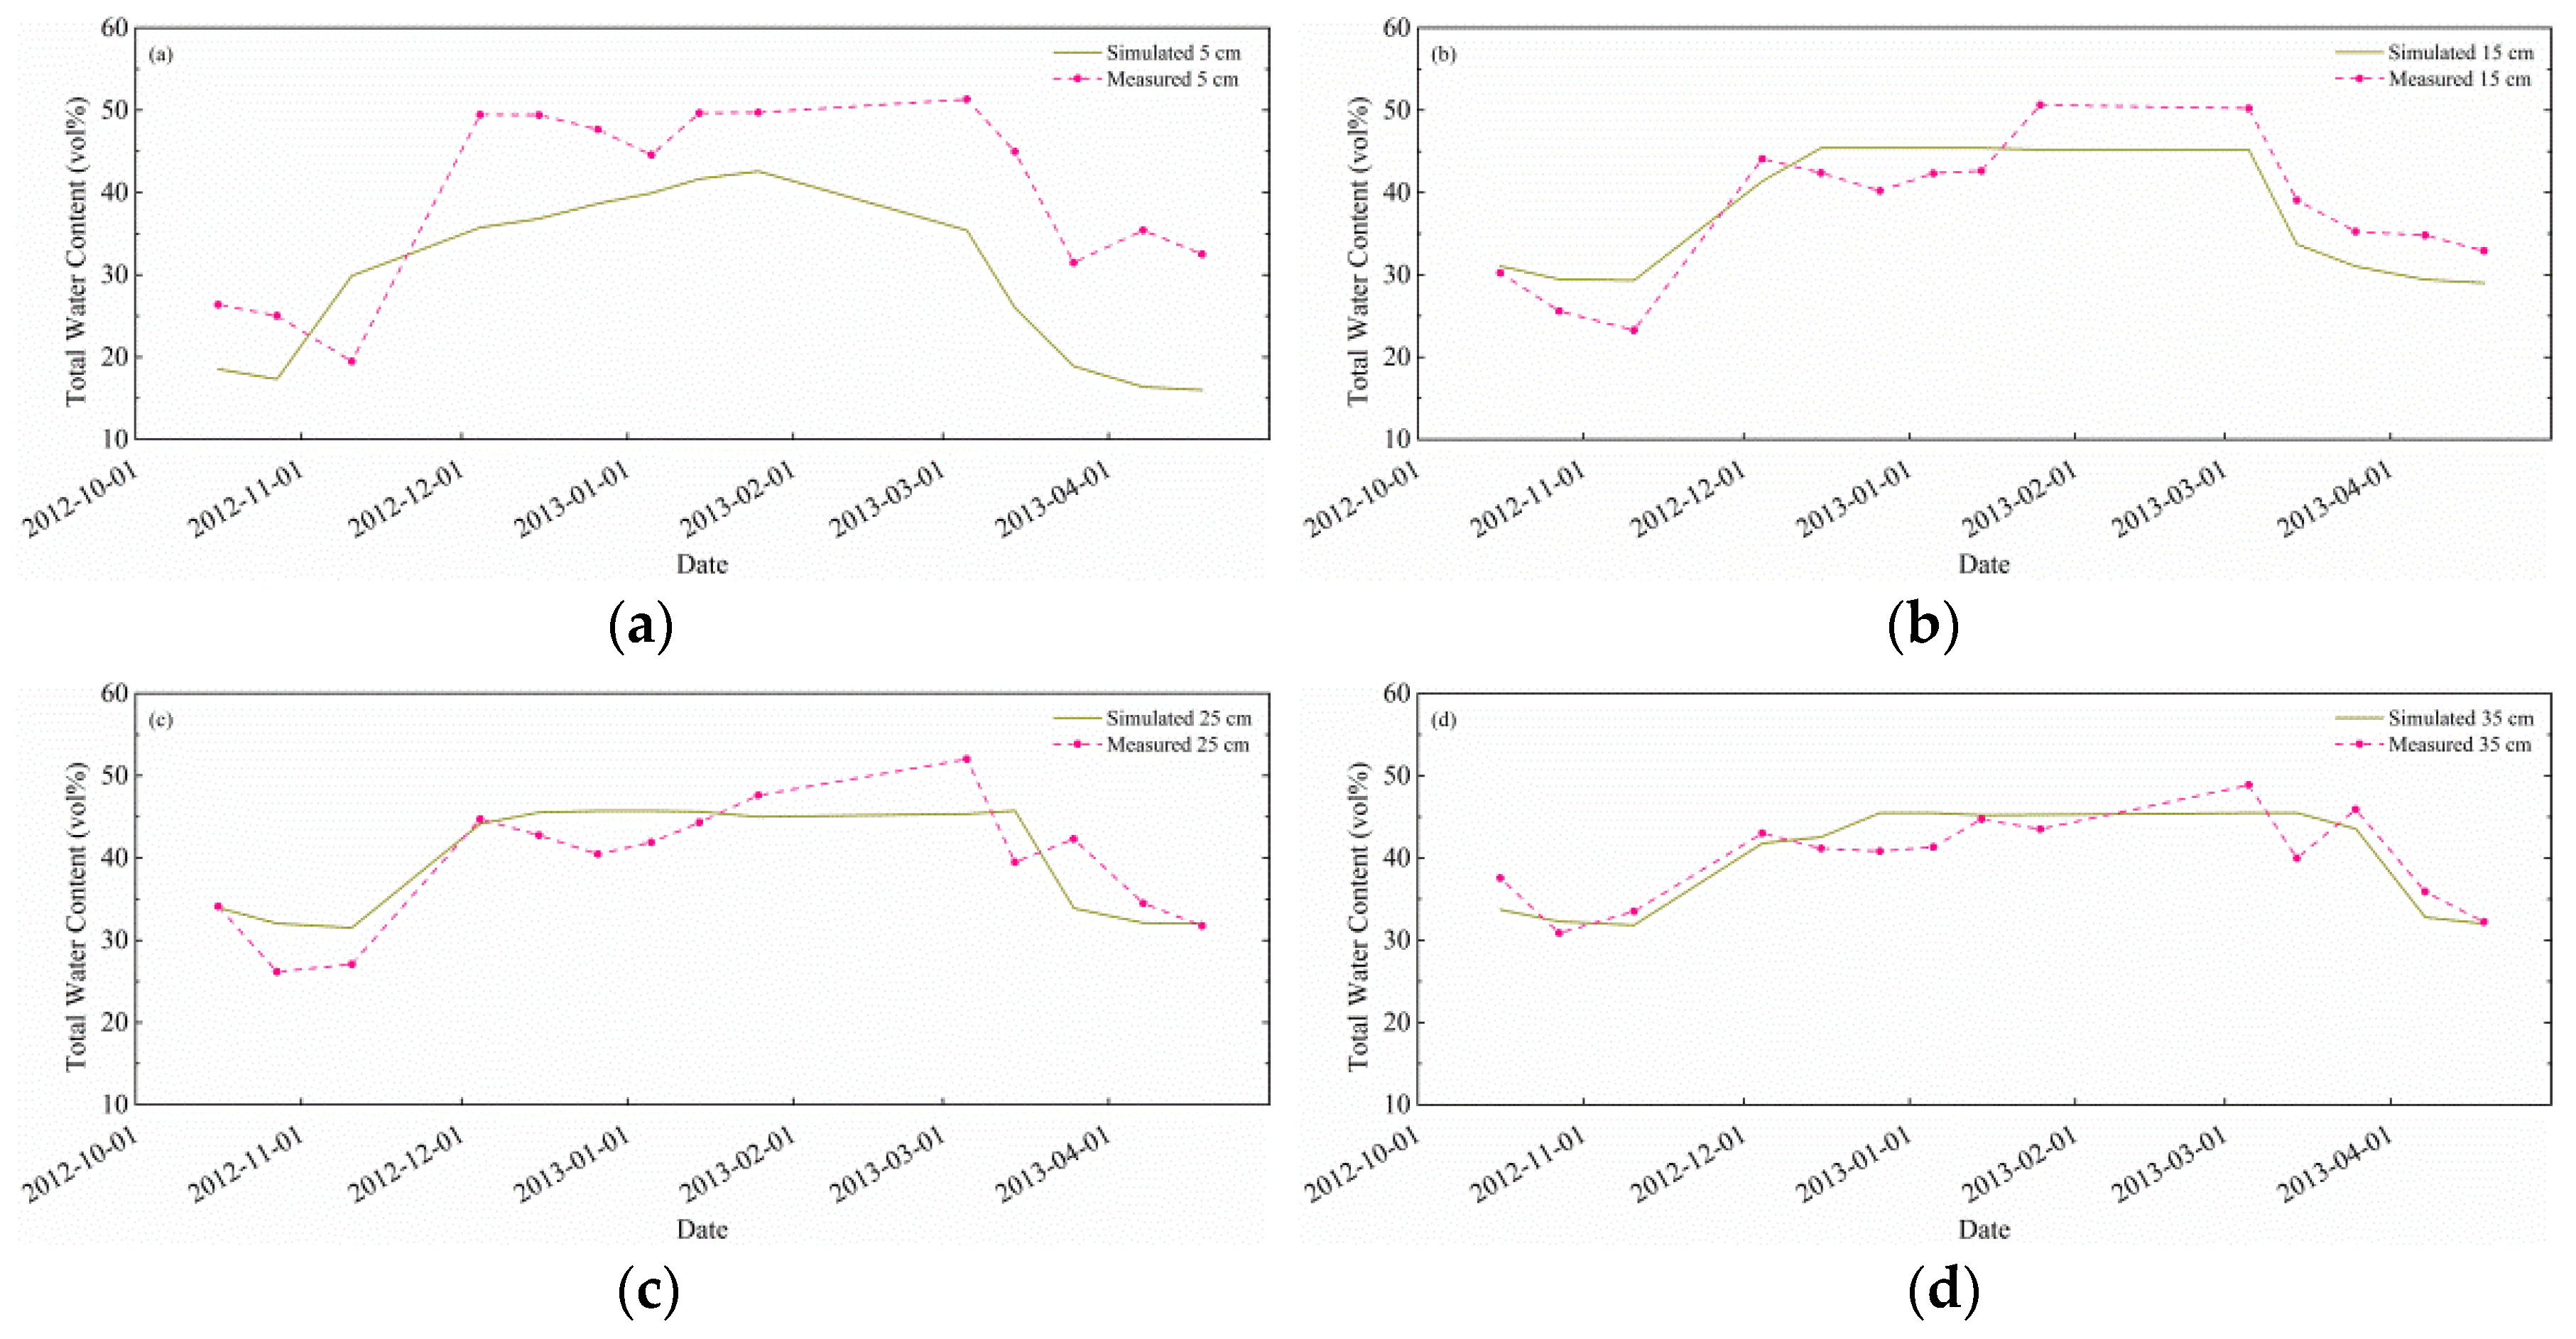
The simulated total water content also showed good performance as compared to the measured total water content (Figure 4), while in the surface layers (e.g., 0–10 and 10–20 cm) the total water content was underestimated during FT. This might be due to the fact that the surface layer had more extensive water and heat exchange with the atmosphere. Additionally, during FT, the energy and water exchange would also be influenced by an ice layer cover on the surface due to the remaining irrigation water in the ponds, and the cyclic FT during day and night would result in the exchange of water between the surface layer and ice layer. Besides, a trade-off effect existed when choosing a model with good performance for both water and temperature because of the non-linearity of the model. Further work should be conducted by using multiple measurements to constrain the model performance, and the water and heat processes in frozen soil should be more fully investigated, especially under saline conditions.

3.3. Water Balance during Soil Freezing/Thawing

For a bare soil system, the water balance could be described as follows:
P + I E R O = Δ S ,
where P is the precipitation (mm), I is the irrigation (mm), E is the evaporation (mm), R O is the runoff (including the surface and subsurface flow) (mm), and Δ S is the water storage change in the soil (mm).
Figure 5a shows the water balance results of the single simulation based on the mean parameter values from the behavioral models. Evaporation and runoff occupied 45% and 55% of the water losses, respectively, during the wintertime. The modeled accumulated evaporation from 1 October 2012 to 1 May 2013 was 137.23 mm, and the accumulated evaporation amount from 1 December 2012 to 1 May 2013 was 53.60 mm. Evaporation during the soil freezing/thawing period showed large fluctuations and when soil was deeply frozen from December 2012 to February 2013, the evaporation rate was very small in comparison with other periods but extensive diurnal evaporation/condensation could be observed (Figure 5b). Large surface runoff and drainage only occurred during the irrigation period (around 9 November 2012). Kaneko et al. [24] estimated an average evaporation rate of 0.50 mm·day−1 and an accumulated evaporation amount of 60 mm during 23 November 2004 to 23 March 2005 after irrigation with the aerodynamic method in the agricultural field of Inner Mongolia. Thus, it could be concluded that evaporation during the whole winter for bare soil was rather small in comparison with the unfrozen season, but diurnal fluctuations were strong for this site.
The water storage change in the soil obviously increased during the irrigation period and then decreased during the FT period. In total, the water storage decreased by 31.77 mm during the simulated period. However, for the upper 0 to 40 cm soil layer, water storage seemed to be more related to soil FT. After the peak during the AI period, the water storage increased gradually during soil freezing from the beginning of December to the end of February. This indicated that during the soil freezing periods, there was an obvious accumulation of water in the upper layer, and the redistribution of water in the soil profile was strong.
The dynamic pattern of the seasonal water balance was obtained in the simulations using the accepted posterior parameter distributions (Table 6). Evaporation dominated the water consumption in Period I, with an average evaporation rate of 53 mm, and 92% of this was used to lower the soil water storage. However, for Period II, due to intensive irrigation, the runoff and evaporation increased rapidly, and the water storage simultaneously increased in the soil. During this period, the surface runoff and subsurface drainage were the main consumptions of water for irrigation. For Period III, the water loss from evaporation and runoff mainly came from water stored in the soil, and there was a low evaporation amount (only 1.17 mm) in this period. Finally, for Periods IV and V, when the soil began thawing and eventually totally thawed, more radiation and liquid water in the upper layer resulted in increased evaporation, which occupied 79% and 65%, respectively, of the water consumption in the soil.

4. Discussion

4.1. Equifinality in Calibration of Frozen Soil Model

“Equifinality” is the inability to meaningfully distinguish one single “best” parameter set given inherent uncertainties and errors in the available data and model structures and typical over-parameterization of model structures [25]. Among the 73 posterior parameter sets, equifinality was detected. For the total (soil temperature and total water content for four layers) RMSE of 4.45, three parameter sets were observed, and the outputs for some processes showed large discrepancies.
Table 7 shows the total evaporation and total runoff as well as the total soil latent and sensible heat qualities (cumulative heat amount, in J·m−2) during the simulation period for three parameter sets. The total evaporation and runoff under three parameter sets showed large discrepancies due to a combination of various parameter values. The same situation occurred for total latent and sensible heat. The sum of the cumulative evaporation and cumulative runoff were similar for parameter sets 1 and 3 at 365.61 and 350.68 mm, respectively; however, both were smaller than the sum of the cumulative evaporation and runoff for parameter set 2, which was 532.50 mm. As for the energy components, the sum of the cumulative latent and sensible heat was 8.52 × 10⁸, 11.7 × 10⁸, and 5.97 × 10⁹ J·m−2 for parameter sets 1, 2, and 3, respectively. Models with parameter sets 1 and 2 demonstrated similar results for the sum of the cumulative latent and sensible heat; however, the sum of the cumulative latent and sensible heat was much larger for parameter set 3.
This demonstrated that the data from the experiment and the selected criteria did not provide a single explanation of the measurements and that there will still be substantial uncertainty in the explanation of the specific physical processes related to water and heat transport. The obtained posterior distributions of the parameters are of high interest and would merit testing for longer periods and for other similar sites. It is likely that the obtained equifinality was due to uncertainties with respect to errors in the water and temperature measurements or to errors in the assumed model structure for water and energy processes. Additional measured data for calibrating output variables from different processes could reduce the equifinality of complicated models [26], such as using measured data from an eddy covariance to calibrate energy balance outputs and using measured evaporation and runoff data for calibrating water transport processes. However, such data are not available for this study due to difficulties in measuring the evaporation from frozen soil and in the installation of additional instruments in frozen soils. Further work will increase our understanding of what trade-offs might exist between constraining model outputs to different measurements and which measurements are most important for reducing the parameter uncertainty.

4.2. Seasonal and Diurnal Courses in Surface Energy Balance

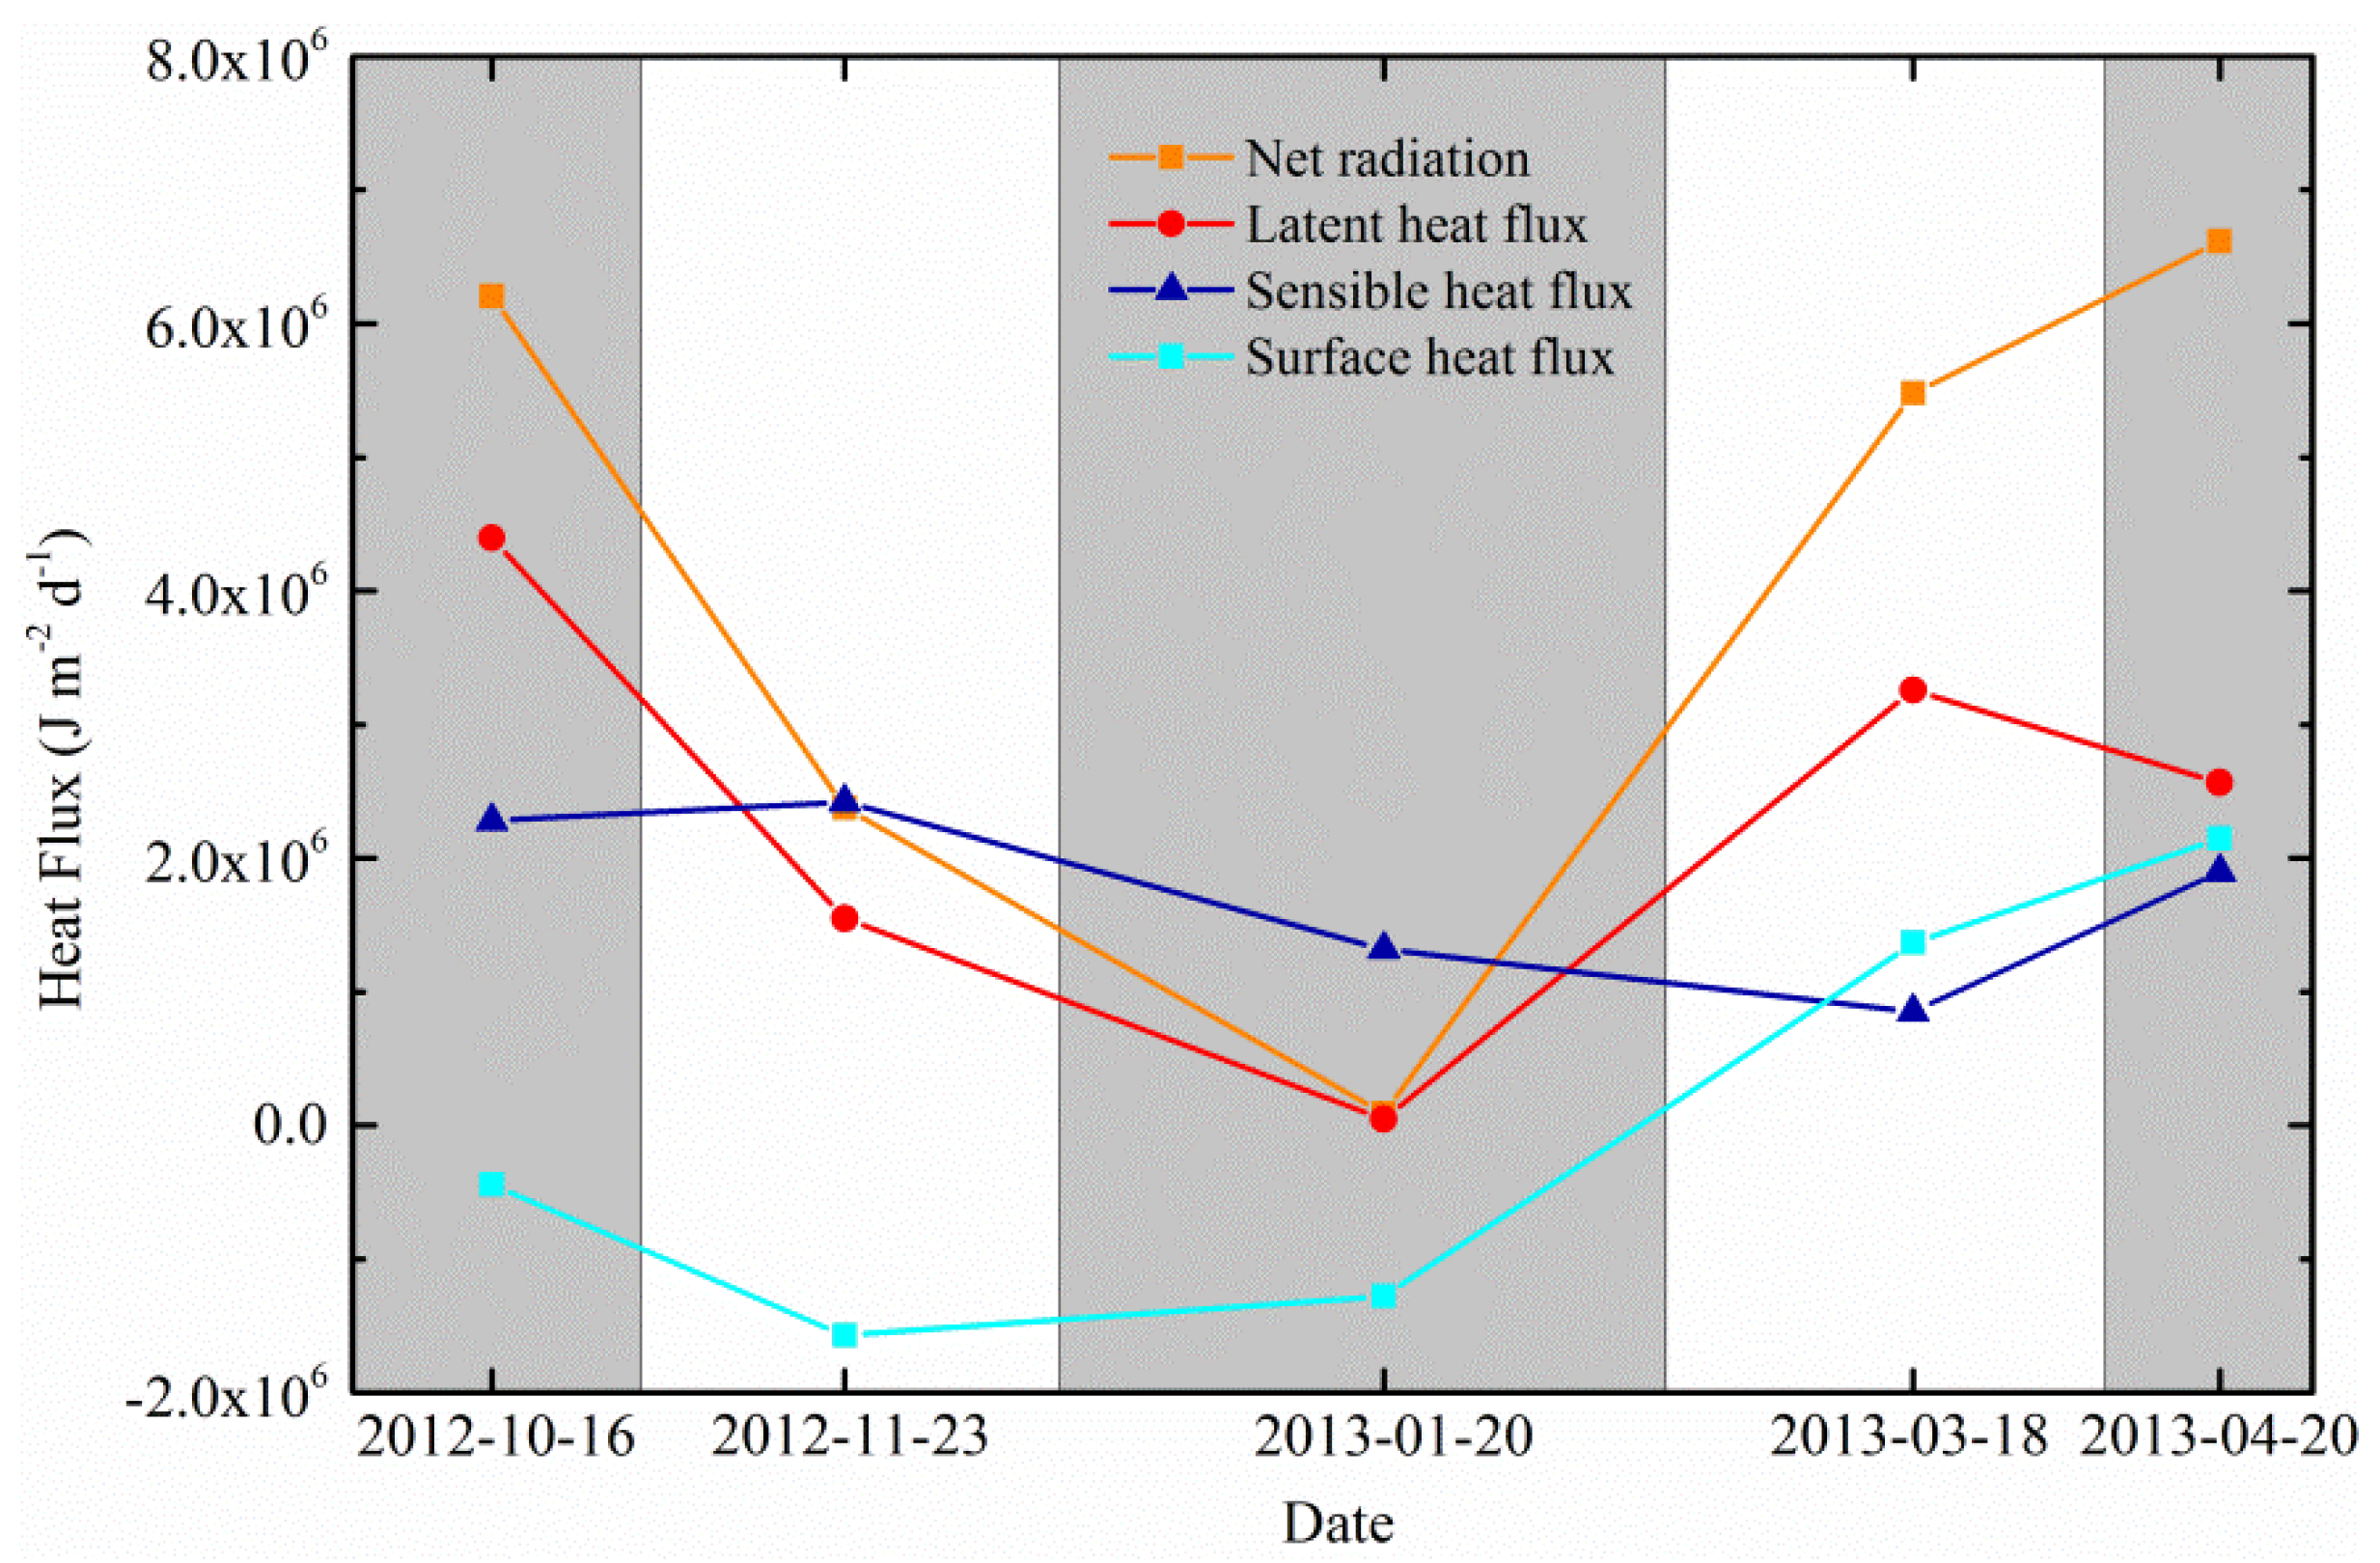
Figure 6 shows the mean heat flux for different patterns as it changes with the soil FT period based on the single simulation with mean parameter values in the behavioral models. The net radiation and latent heat flux changed simultaneously during the simulation period; the values were large for Periods I and II, and then decreased to their lowest points in Period III before the increase in Periods IV and V as the soil thawed. The sensible heat flux also exhibited a similar change, although it was not as obvious. The surface heat flux was generally negative (upward) during Periods I to III when the air temperature continuously decreased and was at low values, and then the surface heat flux turned downwards due to more radiation for surface heating during the thawing periods (Periods IV and V).
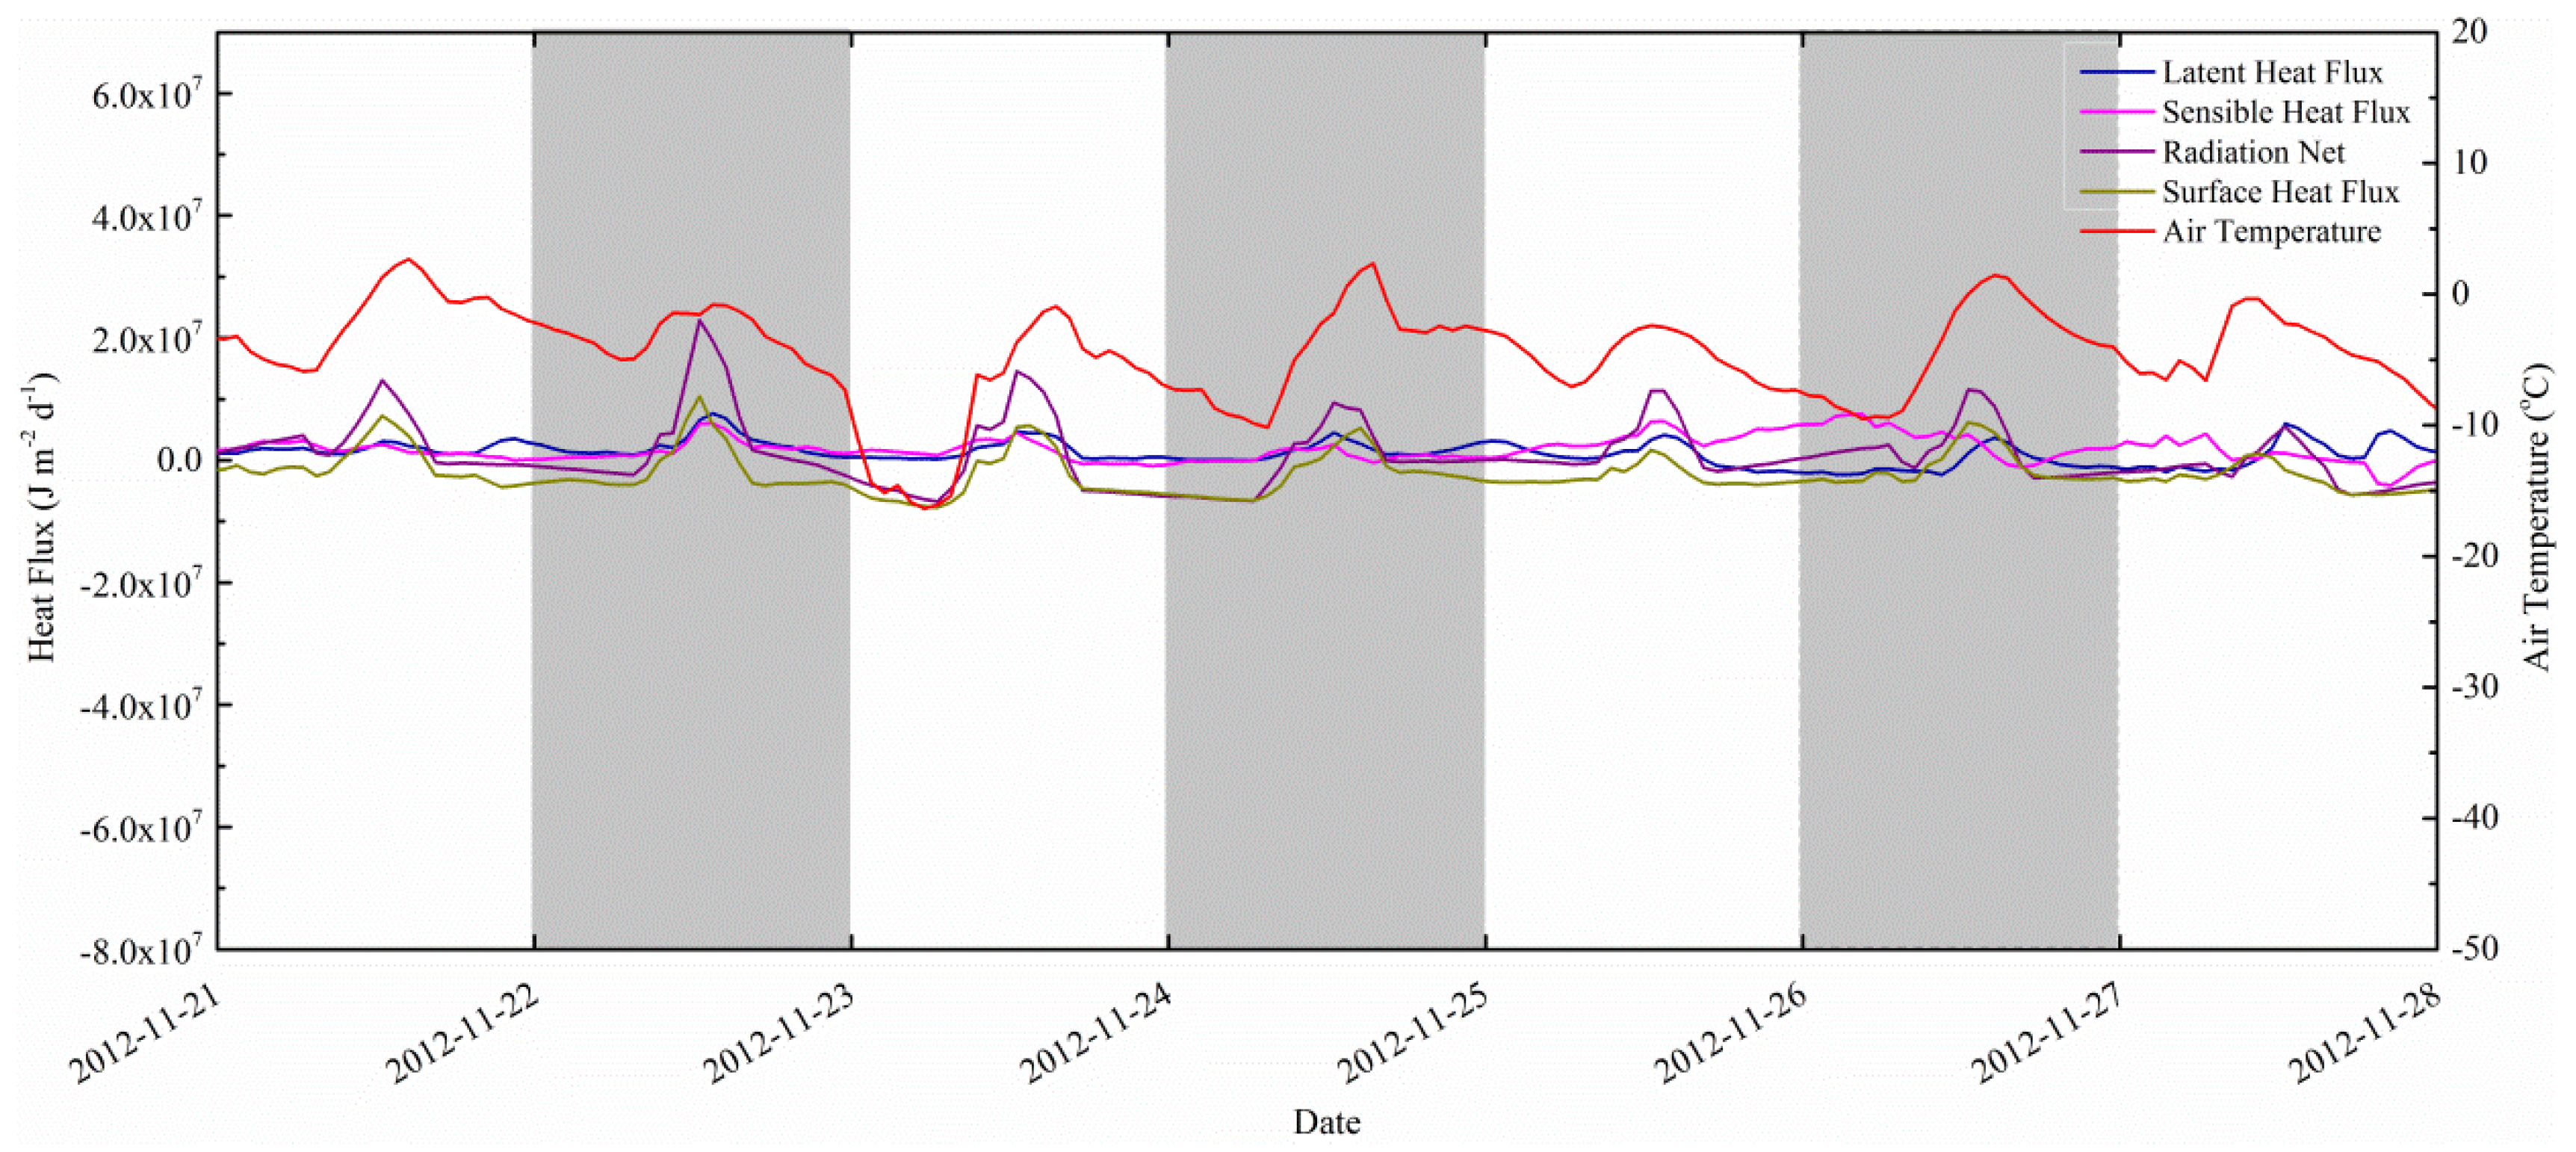
The simulated changes in the heat fluxes, the air temperature during soil freezing, and the diurnal changes in energy partitioning show large oscillations (Figure 7). When the soil began freezing, the air temperature gradually decreased to below zero, and more intensive changes in energy partitioning were observed. At the beginning of this period (23 November 2012), two peaks were observed for energy components. However, the energy balance components reached the first peak around 10:30. Then, the energy balance components remained stable from 12:00 to 15:00 before the second peak occurred. When the air temperature was stable below zero for the whole day (25 November 2012), the energy balance system seemed to be more stable. Furthermore, the sensible heat flux seemed to be compensated for by the latent heat flux at night time (e.g., before 7:00 and after 18:00), when the net radiation was small. Additionally, the negative values for the latent heat flux after 18:00 indicated that condensation of air vapor occurred due to low air temperature.
Changes in the longwave radiation at different dates exhibited large differences during the day, which eventually influenced the energy partitioning on the soil surface. However, due to a lack of measured heat flux for calibration, the correlation between the atmospheric conditions and the energy partitioning on the surface needs to be investigated in the future with more detailed eddy covariance flux data. In addition, the calibrated albedo of the surface soil showed higher ranges, with mean values of 57% for the wintertime as compared to the normal range for soil, which is 20% to 35%. However, the values for the calibrated albedo indicated the possible existence of snow on the surface because the albedo of snow ranges from 35% to 90%. In this study, the snow cover was not included due to the sparse snowfall during the winter, but ice cover was observed due to the pond water freezing over after irrigation, and this cover existed on the surface for three months. Ice can have a larger albedo value than bare soil due to its special properties in reflecting energy, and it can also block energy exchange between the atmosphere and the soil surface. However, only the snow layer energy balance was considered in the CoupModel, and the energy balance for the ice layer was not explicit in the model structure. Thus, more work on the energy balance in the ice layer during soil FT is needed for understanding water and heat transport in an atmosphere-surface canopy-snow-soil system in winter.

5. Conclusions

In this study, a process-based model (CoupModel) was used in combination with the GLUE uncertainty analysis method to simulate surface water and energy balance for seasonally frozen soil. The soil temperature simulation performed better than the corresponding soil water contents. A trade-off effect between the performance for soil water and temperature was also clearly demonstrated. Parameters related to soil evaporation/radiation and water flow showed a strong dependence on the measurements and criteria applied to accept simulations by performance. Equifinality was detected with the same total RMSE but very different water and energy balance results for this highly non-linear process-based model. Parameters related to water and energy processes needed to be taken into consideration carefully and the choice of a single representative simulation should be undertaken cautiously. The water and energy partitioning showed great seasonal differences due to climatic conditions and phase transition. There was a strong diurnal cycle in the surface energy balance and freeze–thaw processes, which has to be accounted for in surface water balance simulation.
The modeling study demonstrated that the design of the measurements can be improved so as to allow a more precise interpretation and quantification of the different physical processes. The most interesting improvement will be the addition of flux measurements of latent and sensible heat flux as well as soil heat flux and ensuring that a closure of the energy balance is provided by measurements. More detailed independent measurements of the soil moisture characteristics and the unsaturated hydraulic conductivity will be important for clarifying the role of water redistribution due to freezing.

Acknowledgments

This research was funded by the National Natural Science Foundation of China (Grant Nos. 51279142, 51379151) and the Twelve-five Science and Technology Support Project (Grant No. 2011BAD25B07). We would also like to thank the China Scholarship Council (CSC) for funding the study in KTH. In addition, we would like to thank Ai’ping Chen and Yang Xu from the Yichang Experimental Site for supplying meteorological data for the studied sites. The authors also appreciate Jingjing Liu and Xia Tan for their help in analyzing the soil samples and processing data in the laboratory.

Author Contributions

Mousong Wu conducted the major field experiments and modeling work and wrote the manuscript. Per-Erik Jansson suggested the modeling approach and was part of the interpretations and formulation of the results obtained. Xiao Tan conducted the field measurements. Jingwei Wu revised the manuscript’s structure and contributed to its professionalism. Jiesheng Huang evaluated the manuscript with respect to the study’s goals and gave suggestions on connecting the study to related topics.

Conflicts of Interest

The authors declare no conflict of interest.

References

  1. Intergovernmental Panel on Climate Change (IPCC). Climate Change 2007—The Physical Science basis: Working Group I Contribution to the Fourth Assessment Report of the IPCC; Cambridge University Press: Cambridge, UK, 2007; Volume 4. [Google Scholar]
  2. Al-Faraj, F.A.M.; Scholz, M.; Tigkas, D. Sensitivity of surface runoff to drought and climate change: Application for shared river basins. Water 2014, 6, 3033–3048. [Google Scholar] [CrossRef]
  3. Wang, X. Vapor Flow Resistance of Dry Soil Layer to Soil Water Evaporation in Arid Environment: An Overview. Water 2015, 7, 4552–4574. [Google Scholar] [CrossRef]
  4. Lunardini, V.J. Heat Transfer in Cold Climates; Van Nostrand Reinhold Co.: New York, NY, USA, 1981. [Google Scholar]
  5. Wu, M.; Huang, J.; Wu, J.; Tan, X.; Jansson, P.-E. Experimental study on evaporation from seasonally frozen soils under various water, solute and groundwater conditions in Inner Mongolia, China. J. Hydrol. 2016. [Google Scholar] [CrossRef]
  6. Miller, T.W. The surface heat balance in simulations of permafrost behavior. J. Energy Resour. Technol. 1979, 101, 240–250. [Google Scholar] [CrossRef]
  7. Kurylyk, B.L.; MacQuarrie, K.T.B.; McKenzie, J.M. Climate change impacts on groundwater and soil temperatures in cold and temperate regions: Implications, mathematical theory, and emerging simulation tools. Earth Sci. Rev. 2014, 138, 313–334. [Google Scholar] [CrossRef]
  8. Lundin, L.-C. Hydraulic properties in an operational model of frozen soil. J. Hydrol. 1990, 118, 289–310. [Google Scholar] [CrossRef]
  9. Alvenäs, G.; Jansson, P.-E. Model for evaporation, moisture and temperature of bare soil: Calibration and sensitivity analysis. Agric. Forest Meteorol. 1997, 88, 47–56. [Google Scholar] [CrossRef]
  10. Jansson, P.-E.; Karlberg, L. CoupModel: Coupled Heat and Mass Transfer Model for Soil-Plant-Atmosphere Systems; TRITA-LWR Report 3087; Department of Land and Water Resources Engineering, Royal Institute of Technology: Stockholm, Sweden, 2004. [Google Scholar]
  11. Flerchinger, G.N.; Saxton, K.E. Simultaneous heat and water model of a freezing snow-residue-soil system I. Theory and development. Trans. ASAE 1989, 32, 565–571. [Google Scholar] [CrossRef]
  12. Shoop, S.A.; Bigl, S.R. Moisture migration during freeze and thaw of unsaturated soils: Modeling and large scale experiments. Cold Reg. Sci. Technol. 1997, 25, 33–45. [Google Scholar] [CrossRef]
  13. Hansson, K.; Simunek, J.; Mizoguchi, M.; van Genuchten, M.T. Water flow and heat transport in frozen soil: Numerical solution and freeze-thaw applications. Vadose Zone J. 2004, 3, 693–704. [Google Scholar] [CrossRef]
  14. Zhang, X.; Sun, S. The impact of soil freezing/thawing processes on water and energy balances. Adv. Atmos. Sci. 2011, 28, 169–177. [Google Scholar] [CrossRef]
  15. Wu, S.H.; Jansson, P.E.; Zhang, X.Y. Modelling temperature, moisture and surface heat balance in bare soil under seasonal frost conditions in China. Eur. J. Soil Sci. 2011, 62. [Google Scholar] [CrossRef]
  16. Dean, S.; Freer, J.; Beven, K.; Wade, A.J.; Butterfield, D. Uncertainty assessment of a process-based integrated catchment model of phosphorus. Stoch. Environ. Res. Risk Assess. 2009, 23, 991–1010. [Google Scholar] [CrossRef]
  17. Beven, K.; Binley, A. The future of distributed models: model calibration and uncertainty prediction. Hydrol. Process. 1992, 6, 279–298. [Google Scholar] [CrossRef]
  18. Mo, X.; Beven, K. Multi-objective parameter conditioning of a three-source wheat canopy model. Agric. Forest Meteorol. 2004, 122, 39–63. [Google Scholar] [CrossRef]
  19. Brooks, R.H.; Corey, A.T. Hydraulic properties of porous media. Hydrol. Paper 1964, 3, 1–27. [Google Scholar]
  20. Rawls, W.J.; Brakensiek, D.L. Estimation of soil water retention and hydraulic properties. In Unsaturated Flow in Hydrologic Modeling; Springer: Berlin, Germany, 1989; pp. 275–300. [Google Scholar]
  21. Kersten, M.S. Laboratory Research for the Determination of the Thermal Properties of Soils; DTIC Document: Fort Belvoir, VA, USA, 1949. [Google Scholar]
  22. Burt, T.P.; Williams, P.J. Measurement of hydraulic conductivity of frozen soils. Can. Geotech. J. 1976, 11, 647–650. [Google Scholar]
  23. Beven, K. Environmental Modelling: An Uncertain Future? CRC Press: Boca Raton, Florida, FL, USA, 2010. [Google Scholar]
  24. Kaneko, T.; Kobayashi, T.; Wang, W.; Cho, H. Estimating evaporation in winter at a field irrigated late in autumn in Inner Mongolia, China. J. Fac. Agric. Kyushu Univ. 2006, 51, 407–411. [Google Scholar]
  25. Shafiei, M.; Ghahraman, B.; Saghafian, B.; Davary, K.; Pande, S.; Vazifedoust, M. Uncertainty assessment of the agro-hydrological SWAP model application at field scale: A case study in a dry region. Agric. Water Manag. 2014, 146, 324–334. [Google Scholar] [CrossRef]
  26. Wagener, T.; McIntyre, N.; Lees, M.J.; Wheater, H.S.; Gupta, H.V. Towards reduced uncertainty in conceptual rainfall-runoff modelling: Dynamic identifiability analysis. Hydrol. Process. 2003, 17, 455–476. [Google Scholar] [CrossRef]
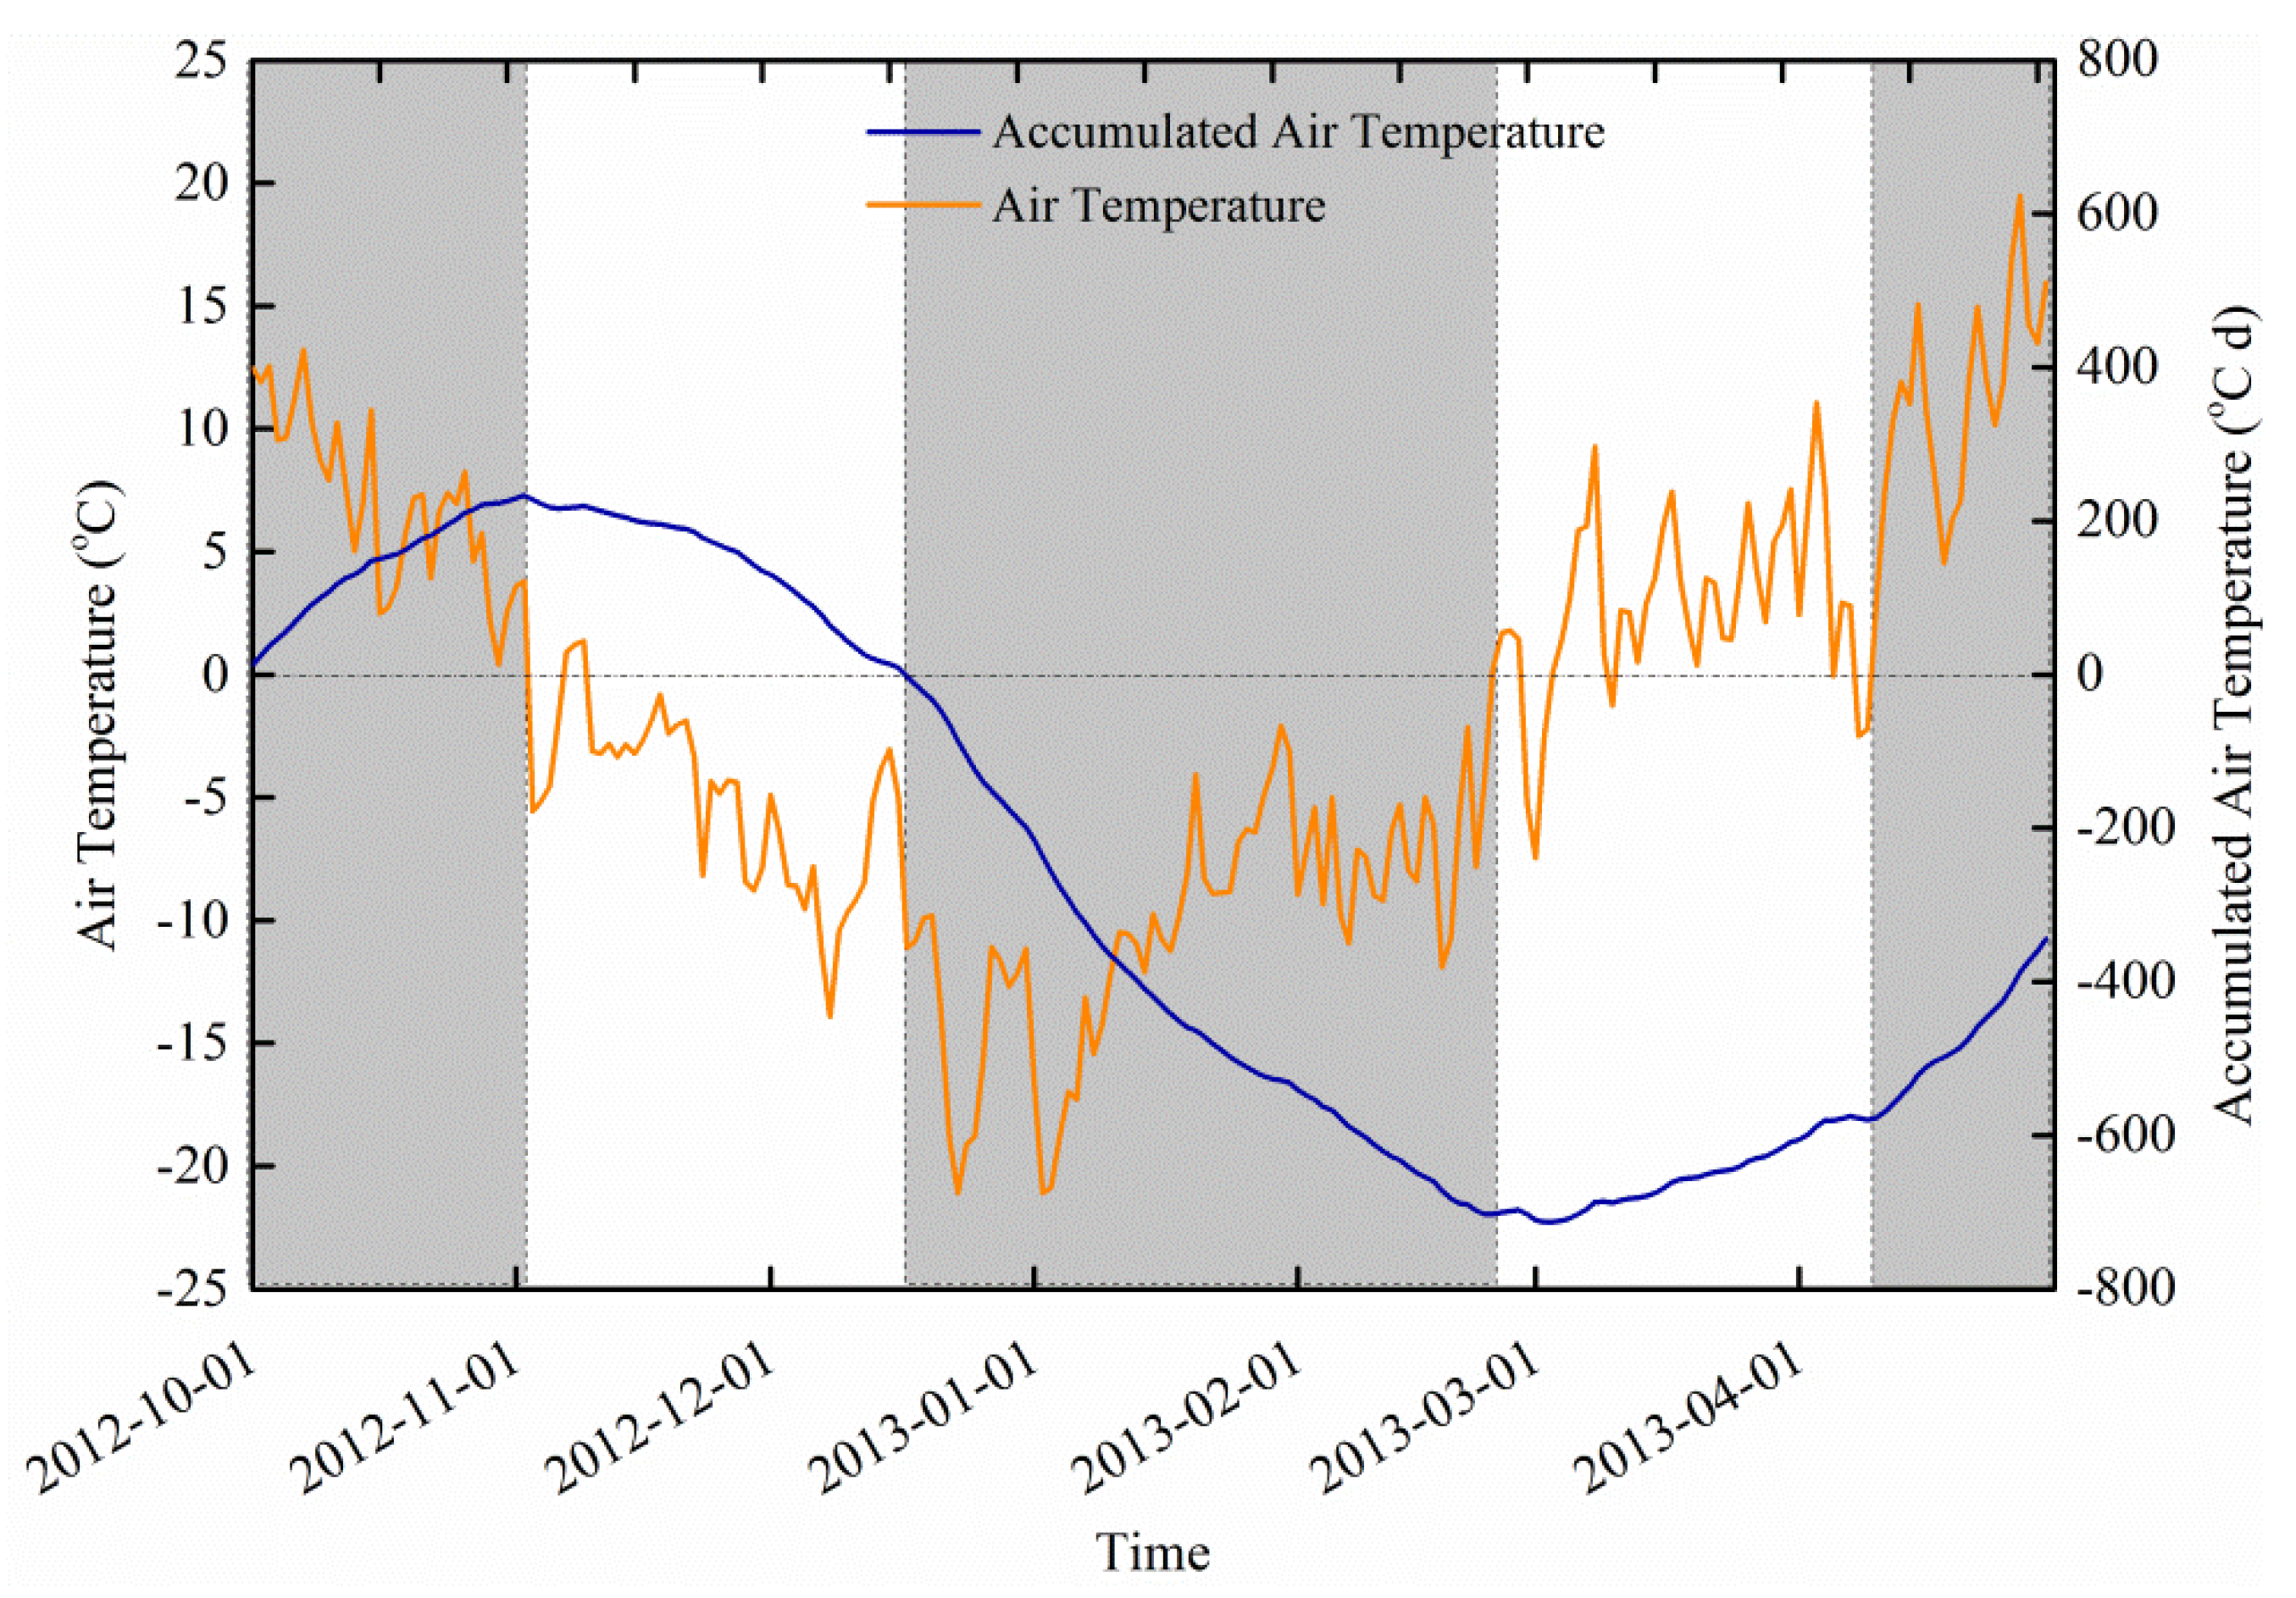
Figure 1. Air temperature variation and period divisions. The blue line is accumulated air temperature, and the orange line is air temperature.
Water 08 00064 g001
Figure 2. Posterior distributions of sensitive parameters. Blue for the prior distribution of parameters, and orange for the posterior distribution of parameters.
Water 08 00064 g002
Figure 3. Comparison of modeled freezing point with measured freezing point at 5 cm depth. The orange line denotes simulated soil temperature and the blue dashed line is the measured soil temperature at 5 cm depth.
Water 08 00064 g003
Figure 4. Comparison of the simulated and measured total water contents for different depths. The dark yellow line shows the simulated total water content at various depths; the magenta line with circles denotes the measured total water content at various depths.
Water 08 00064 g004
Figure 5. Water balance for the soil profile during the 2012/2013 winter. (a) Accumulated water amount: the black, red, green, blue, and orange lines denote precipitation/irrigation, evaporation, runoff, whole soil profile water storage change, and 0–40 cm soil layer water storage change, respectively; (b) water flux: the black, orange, and blue dashed lines are for drainage, surface runoff, and evaporation rate, respectively.
Water 08 00064 g005
Figure 6. Seasonal energy partitioning during the 2012–2013 winter. The orange, red, blue, and cyan lines with symbols denote net radiation, latent heat, sensible heat, and surface heat flux, respectively.
Water 08 00064 g006
Figure 7. Diurnal changes in energy partitioning. The blue, magenta, purple, dark yellow, and red lines are for latent heat, sensible heat, net radiation, surface heat flux, and air temperature, respectively.
Water 08 00064 g007
Table 1. Soil physical and hydraulic properties for the study site.
Soil LayerClaySiltSandBulk Density
cm%g·cm−3
0–1027.9117.2054.891.17
10–2037.4621.6540.901.57
20–3031.6948.3919.921.50
30–4034.0834.3231.611.61
40–6028.7434.8536.401.45
60–8034.6730.4534.881.53
80–10017.6518.4663.881.52
100–12014.8135.0550.151.57
Table 2. Prior and posterior ranges and values for selected parameters. For detailed descriptions of parameters and related equations, refer to Jansson and Karlberg [10].
ParameterSymbolUnitPrior RangePosterior MeanRange Ratio a
Radiation/evaporation process
AlbedoDry k a -30.00–80.0057.540.97
EquilAdjustPsi ψ e g -0.00–2.502.060.69
MaxSoilCondens e max , c o n d mm·day−11.00–4.002.770.93
MaxSurfDeficit s d e f mm−4.00–0.00−2.420.96
MaxSurfExcess s e x c e s s mm0.00–3.001.220.96
RoughLBareSoilMom z 0 M m1.00 × 10−5–0.05 b4.26 × 10−30.96
WindLessExchangeSoil r a , max 1 -0.00–1.000.110.55
KBMinusOne k B 1 -0.00–2.501.320.96
Soil heat process
AlphaHeatCoef α h W·m−1·°C−10.01–5.00 × 10³ b483.330.82
FreezepointF1 d 2 -0.00–2.000.940.98
FreezepointFWi d 1 -0.01–1.000.520.99
TempDiffPrec_Air Δ T P a °C−5.00–5.000.23 0.99
CFrozenMaxDamp C m d -0.50–0.900.760.92
SandFrozenC4 b 4 -0.01–1.000.540.96
SandUnfrozenC2 a 2 -0.01–1.000.500.94
Soil water process
DVapTortuosity d v a p b -0.01–2.000.970.99
InitialPressuredHead cm1.00–200.00119.910.99
MinimumCondValue k min u c mm·day−11.0 × 10⁻¹⁰–1.0 × 10⁻³ b2.85 × 10−50.36
TempFacLinIncrease r A 1 T °C−10.02–0.030.020.97
Notes: a Range ratio denotes the ration between posterior and prior ranges; b The stochastic logarithm sampling method was used for parameters with prior range; the stochastic linear method was used for the others.
Table 3. Prior and posterior ranges for soil temperature and total water content at various depths.
Depth (cm)Soil TemperatureTotal Water Content
Prior RangePosterior RangePrior RangePosterior Range
RLaRHbRLRHRLRHRLRH
R2
50.71.00.91.00.00.70.40.7
150.71.00.91.00.00.90.40.9
250.71.00.91.00.00.90.40.9
350.71.00.91.00.00.80.40.8
ME
5−6.08.7−1.52.2−34.4−2.0−10.1−2.0
15−5.38.2−1.32.1−30.03.6−7.40.9
25−5.17.4−1.31.8−31.04.1−7.70.9
35−4.66.9−1.11.7−30.21.5−7.50.4
RMSE
51.610.41.63.87.136.57.114.4
151.09.21.13.13.431.13.610.4
250.98.20.92.73.631.93.610.6
350.77.70.72.43.030.83.010.0
Notes: a RL denotes the lowest value for the range; b RH denotes the highest value for the range.
Table 4. Comparison of model performance indices for calibrated variables.
Variable/DepthR2RMSEME
Pmean aSmean bChangePmeanSmeanChangec Pwidthd SwidthChange
Soil temperature
5 cm0.880.910.032.922.980.0614.633.06−11.57
15 cm0.930.950.022.082.090.0113.522.82−10.70
25 cm0.950.960.011.751.70−0.0512.482.60−9.88
35 cm0.960.960.001.511.48−0.0311.492.39−9.10
Total water content
5 cm0.200.410.2119.7910.68−9.1132.446.26−26.17
15 cm0.420.620.209.686.34−3.3433.645.77−27.87
25 cm0.380.670.299.456.02−3.4335.106.41−28.69
35 cm0.270.480.219.245.80−3.4431.646.18−25.48
Notes: a Pmean denotes mean values for prior performance. b Smean denotes mean values for performance of selected behavioral simulations. c Pwidth denotes the prior range width, which is the difference between maximum ME and minimum ME. d Swidth denotes the posterior range width, which is the difference between maximum ME and minimum ME.
Table 5. Comparison of performance indices for single simulation with mean value of parameters with mean performance indices for behavioral models.
Variable/DepthR2RMSEME
SSmean aChangeSSmeanChangeSSmeanChange
Soil temperature
5 cm0.920.012.37−0.600.950.35
15 cm0.960.011.74−0.361.130.49
25 cm0.950.001.66−0.050.940.62
35 cm0.95−0.021.720.241.060.75
Total water content
5 cm0.420.0214.523.85−12.06−5.55
15 cm0.670.054.85−1.49−1.680.28
25 cm0.59−0.085.01−1.00−1.600.24
35 cm0.42−0.065.11−0.68−3.200.82
Note: a SSmean denotes performance index from single simulation with mean values of parameters in behavioral models.
Table 6. Water balance check for different periods of soil FT.
PeriodP+IEROΔSE/(P+I-ΔS)RO/(P+I-ΔS)
mm
I14.8353.424.83−43.420.920.08
II259.4029.66114.31115.430.210.79
III0.001.1732.88−34.050.030.97
IV1.1041.0411.23−51.170.790.21
V0.0011.946.57−18.510.650.35
Total275.33137.23169.87−31.770.450.55
Table 7. Water and energy balance comparison for the three parameter sets.
Output VariablesUnitParameter Set 1Parameter Set 2Parameter Set 3
Total evaporationmm157.9263.7788.98
Total runoffmm207.69468.73261.30
Total latent heatJ·m−22.93 × 10⁸−1.49 × 10⁹−1.87 × 10⁹
Total sensible heatJ·m−25.59 × 1082.66 × 1097.84 × 109