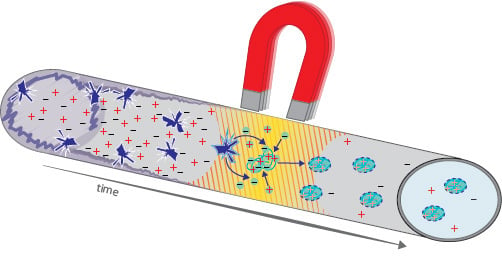
Strong Gradients in Weak Magnetic Fields Induce DOLLOP Formation in Tap Water
Abstract
:1. Introduction
1.1. Magnetic Water Treatment
1.2. Water Core Magnets (WCMs)
1.3. Electrical Impedance Spectroscopy (EIS)
1.4. Motivation for the Research Presented
1.4.1. WCM as Treatment Device
1.4.2. Tap Water as Sample
2. Materials and Methods
2.1. Treatment Procedure
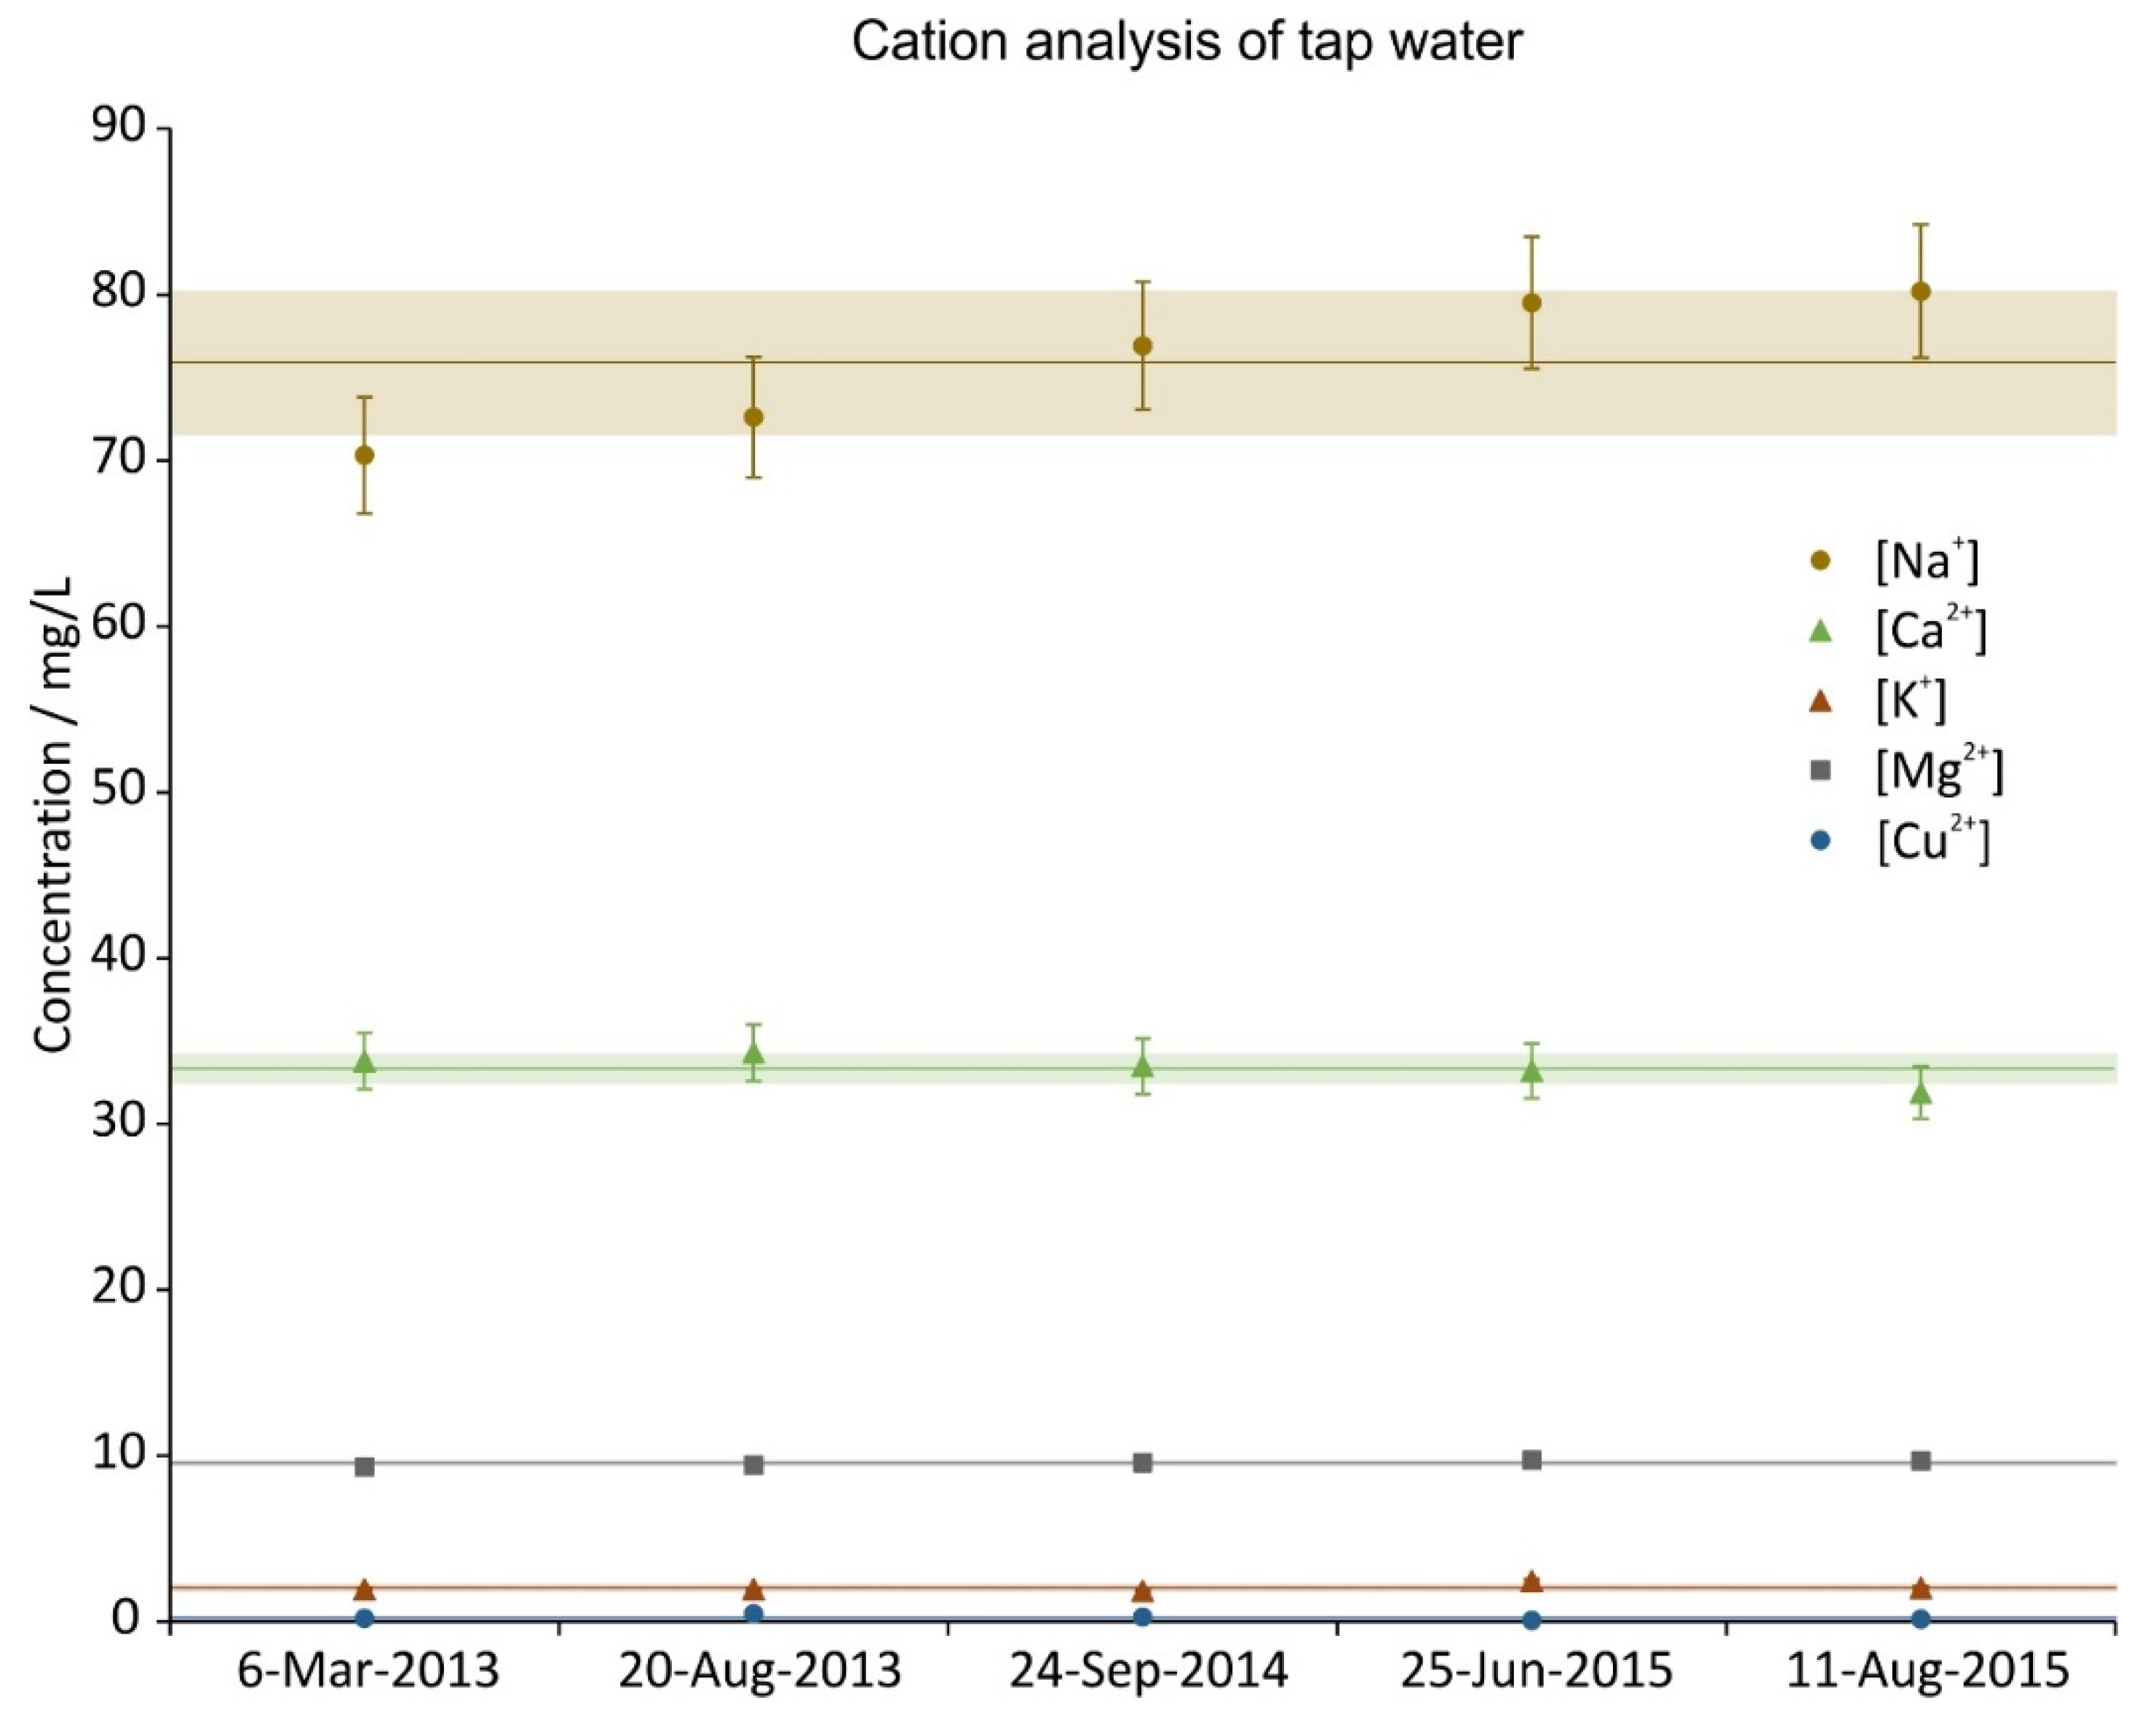
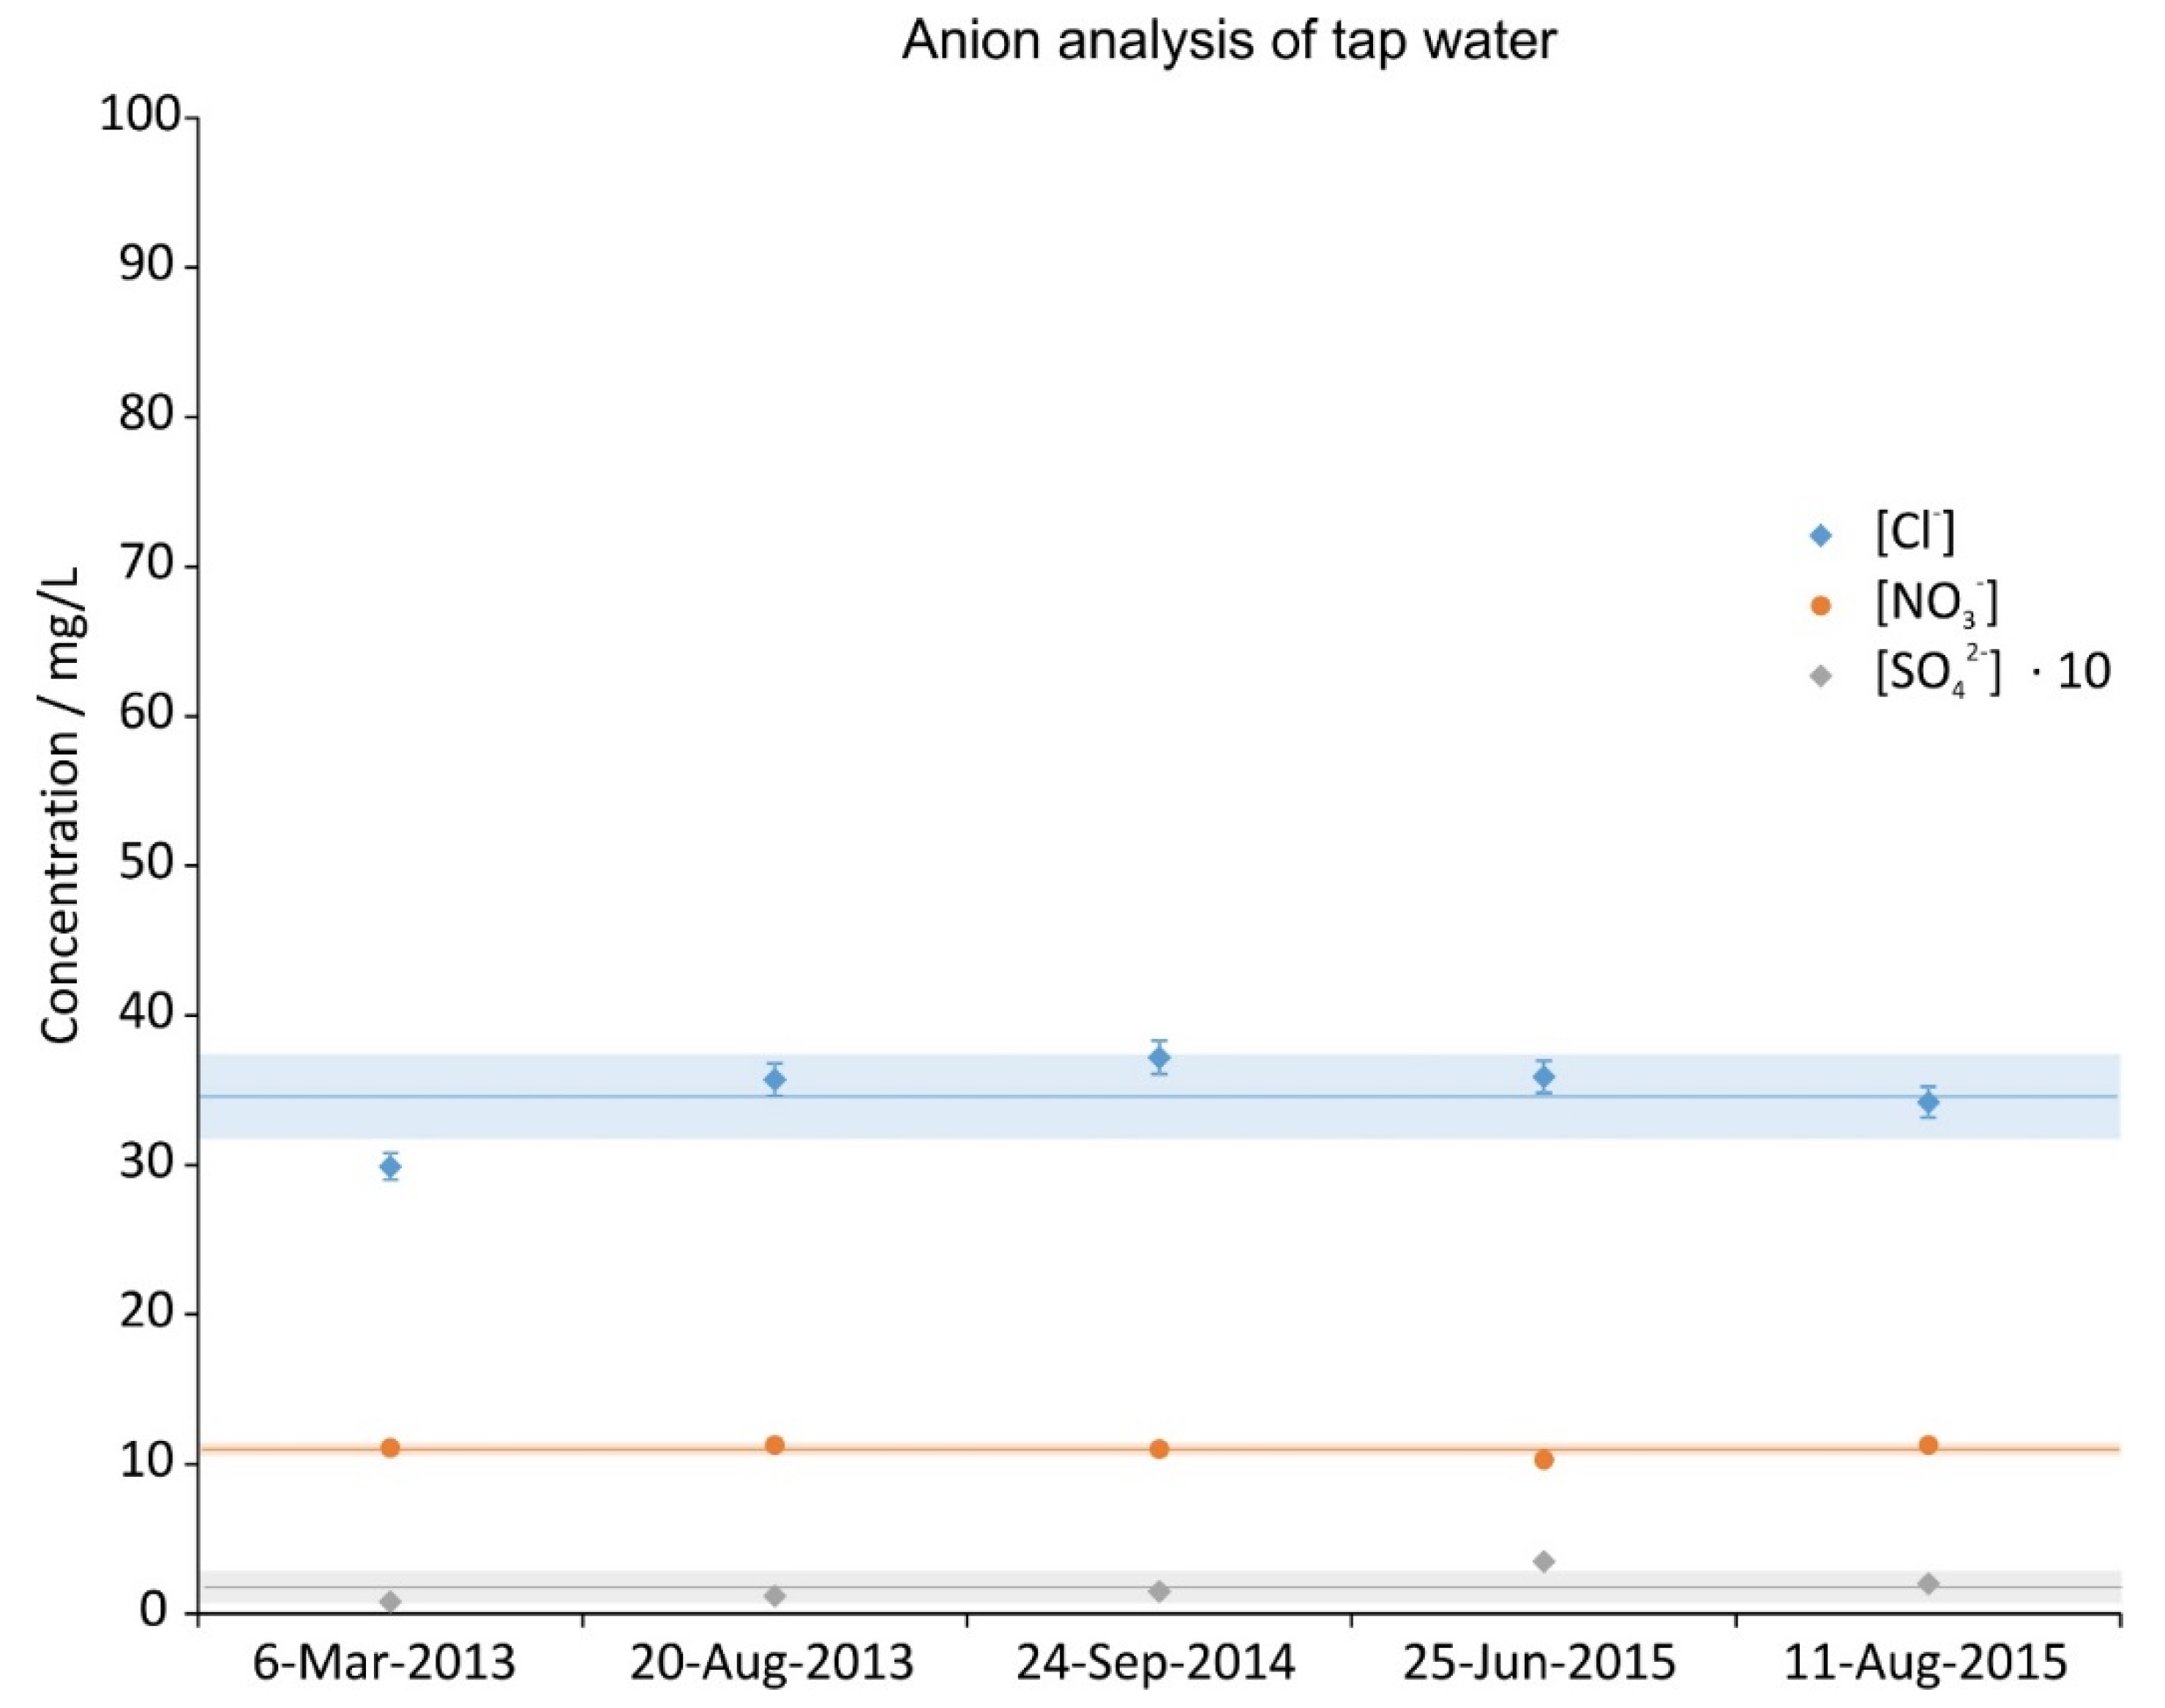
2.2. Tap Water Analysis
2.3. Impedance Analysis
2.4. SEM/EDX
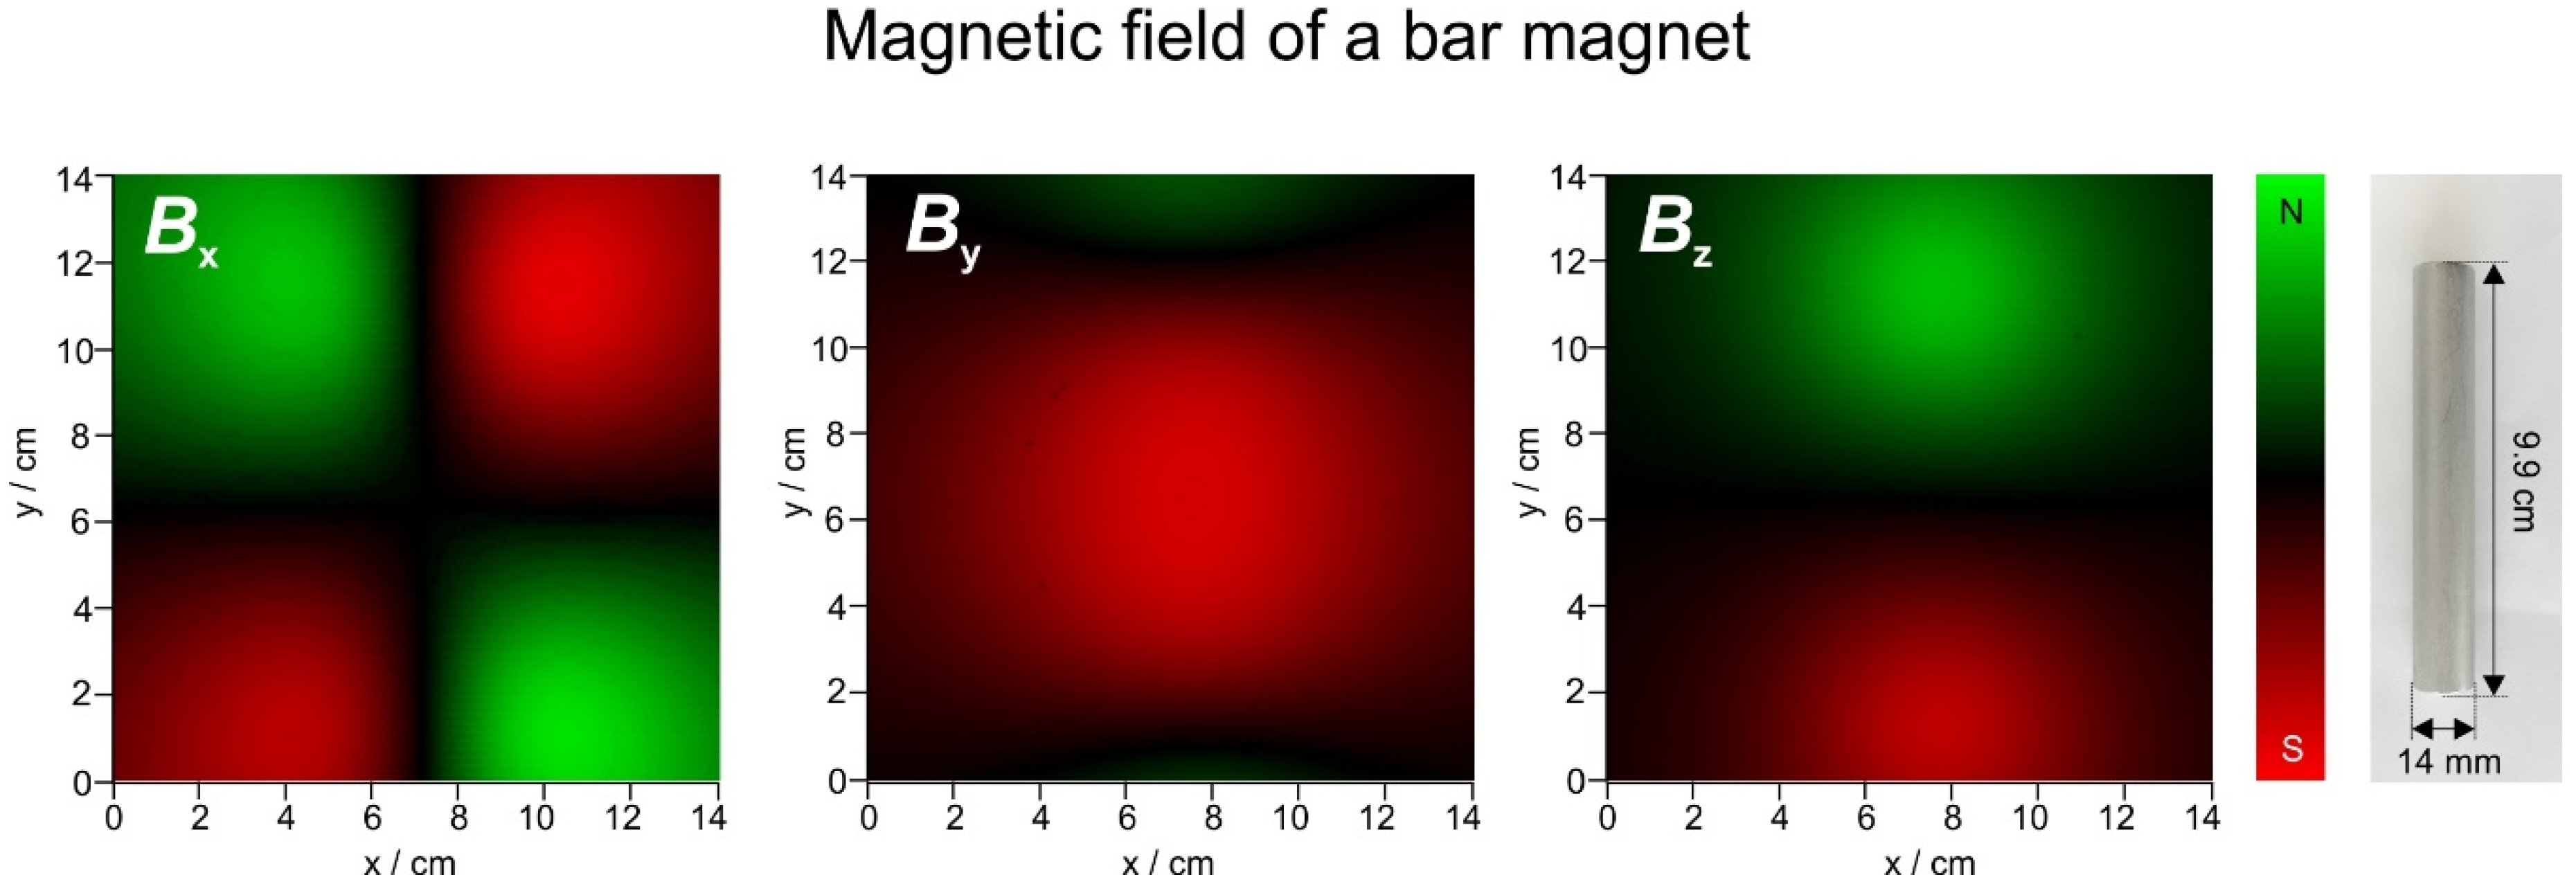
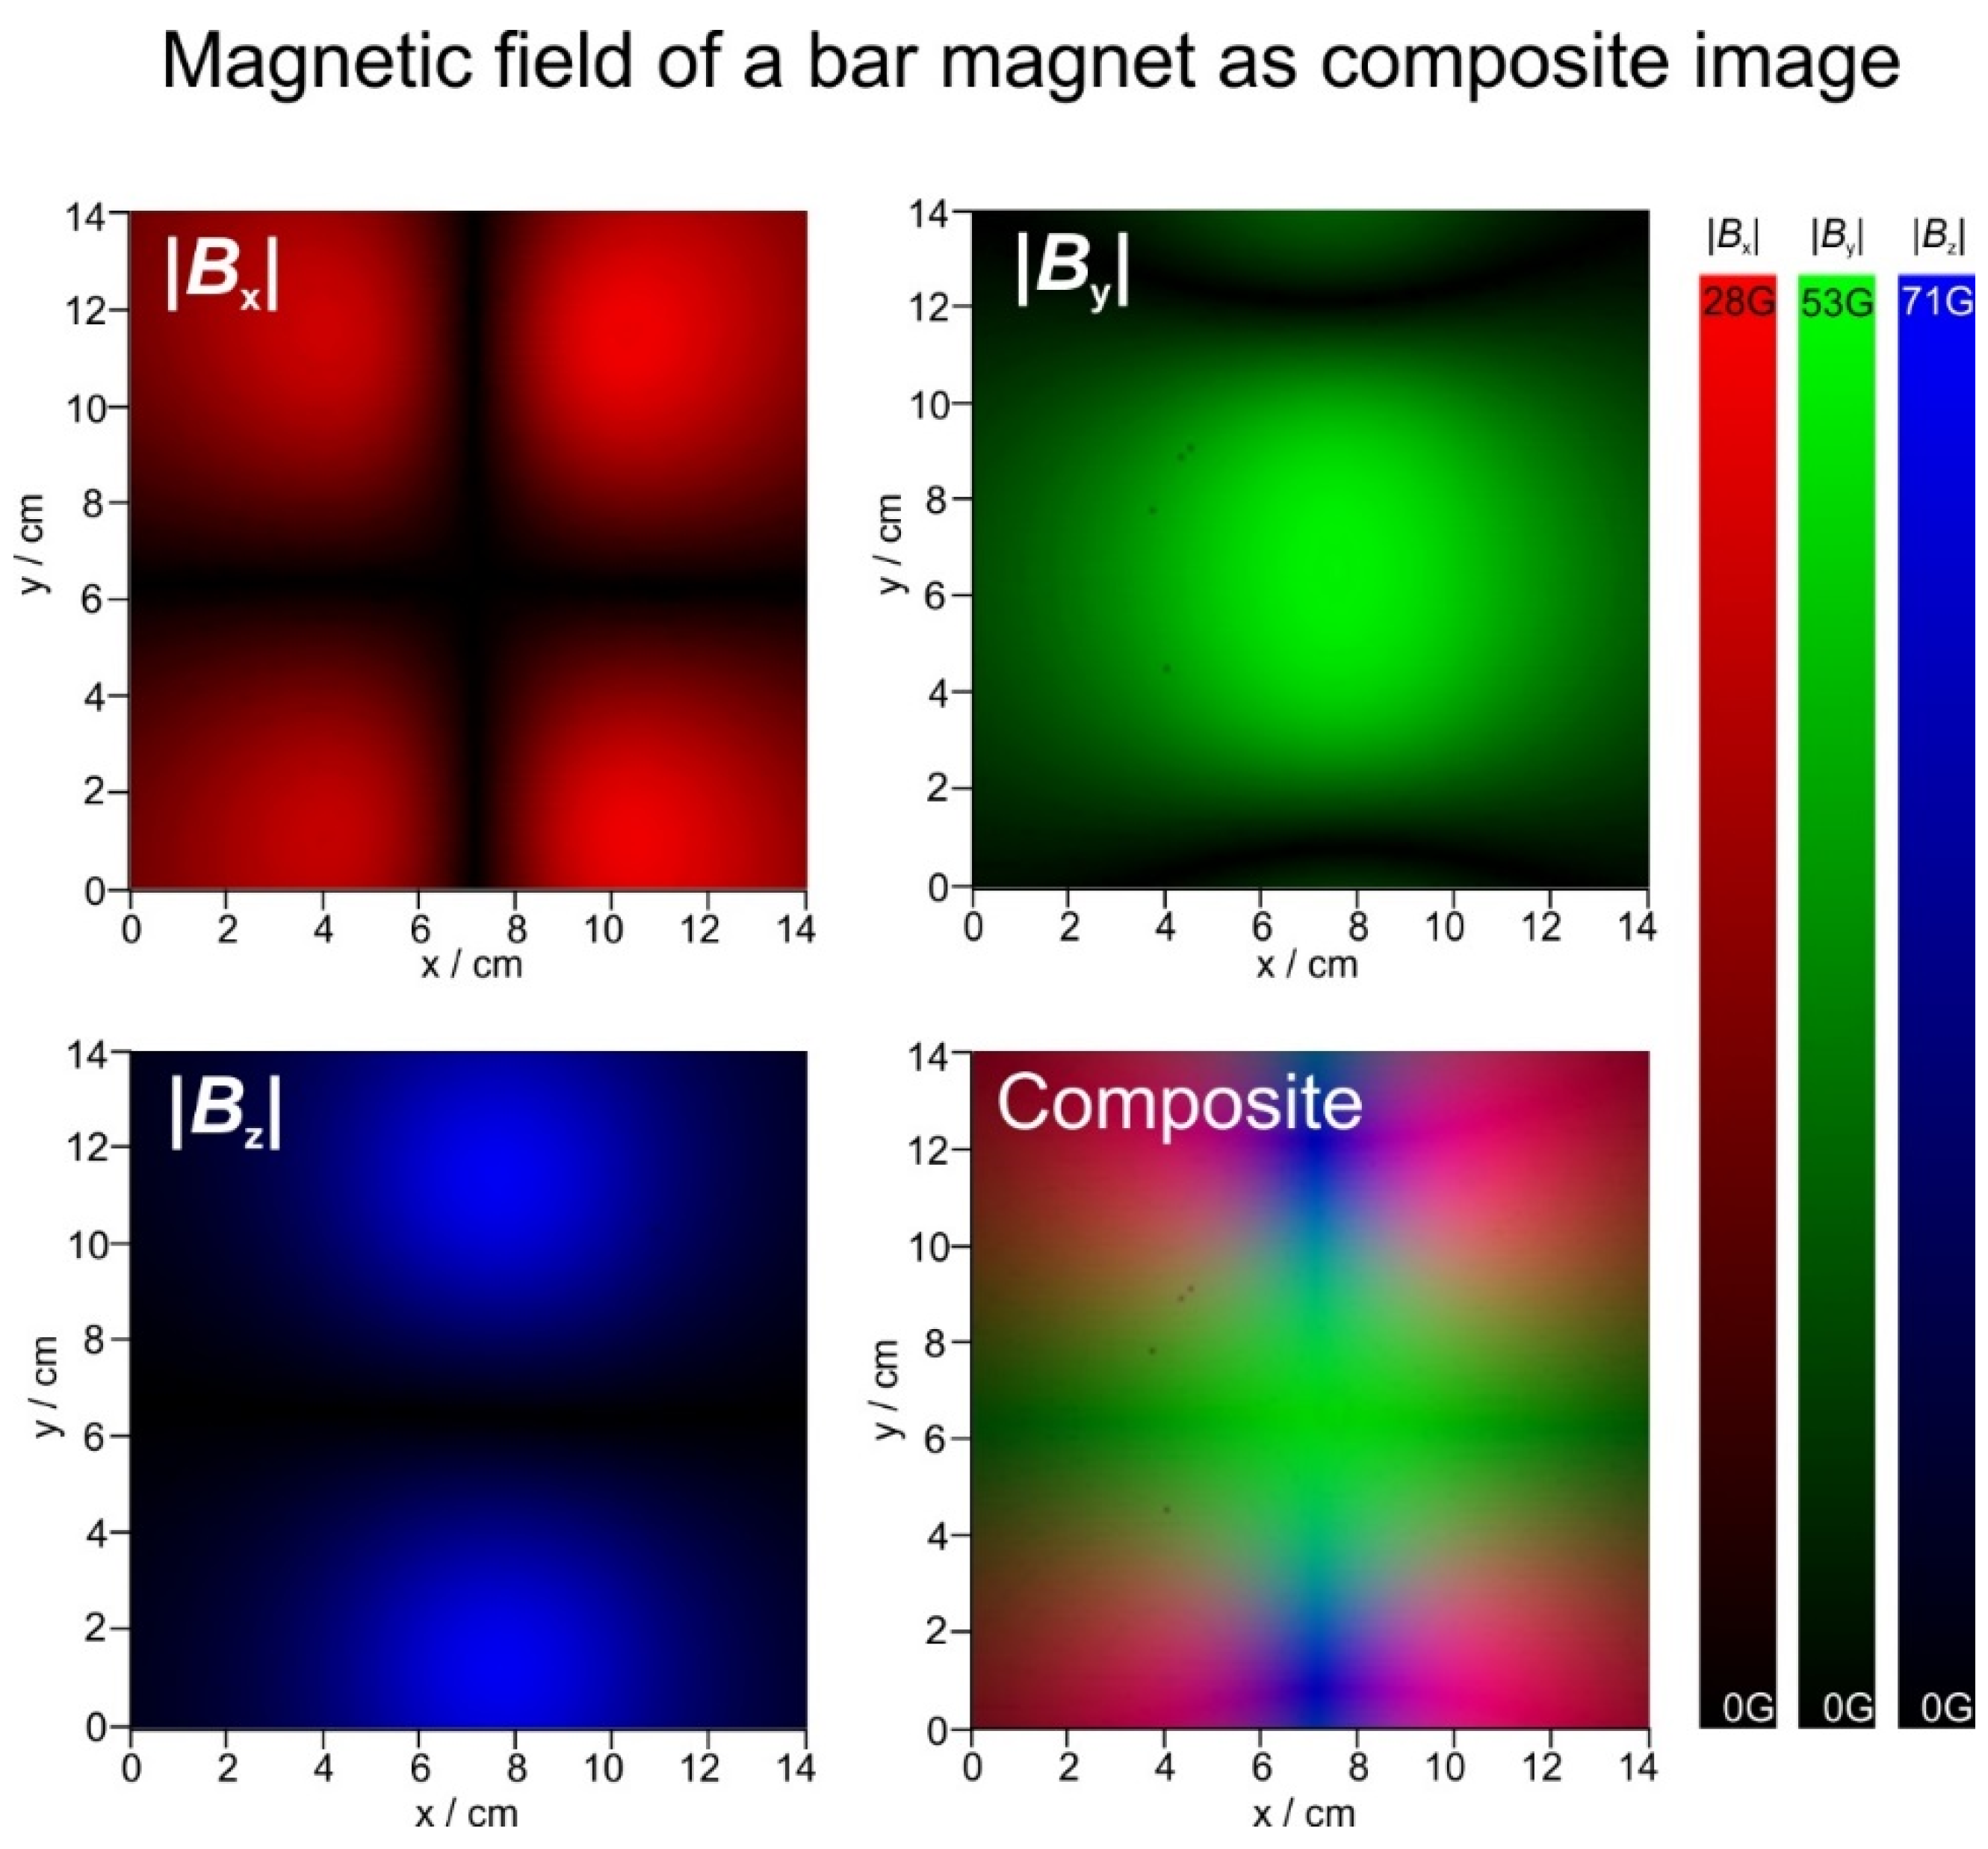
2.5. Magnetic Field Measurements and Visualisations
2.6. Laser Scattering Measurements
2.7. Statistical Analysis
3. Results
3.1. Tap Water Analysis
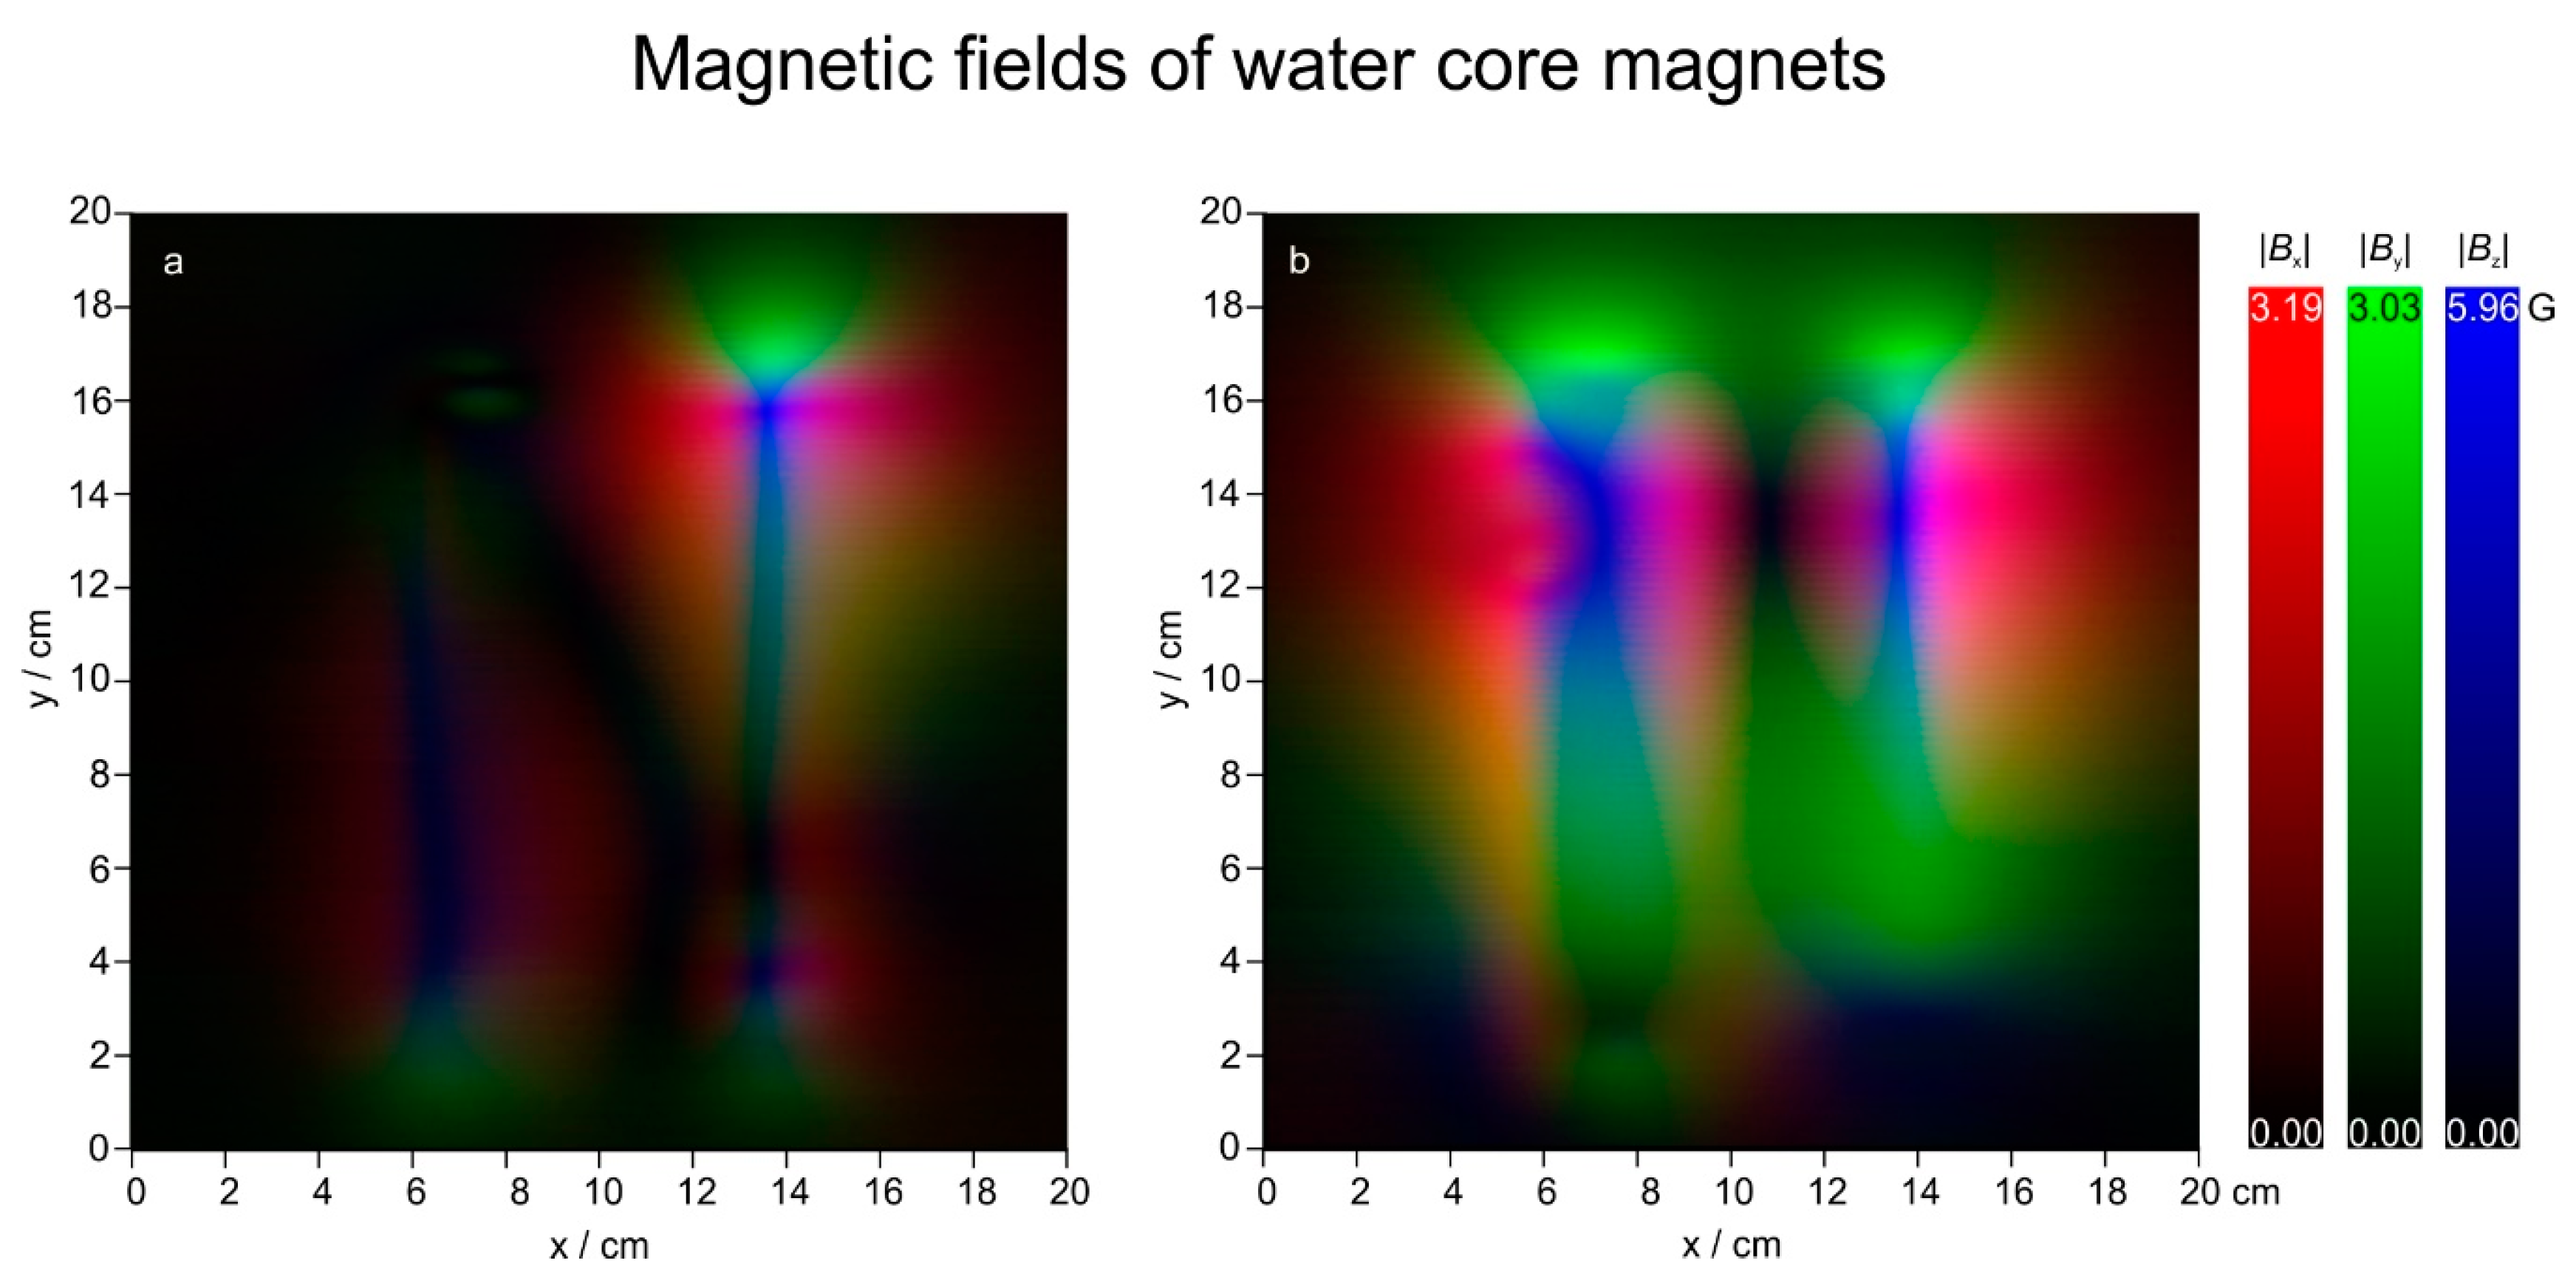
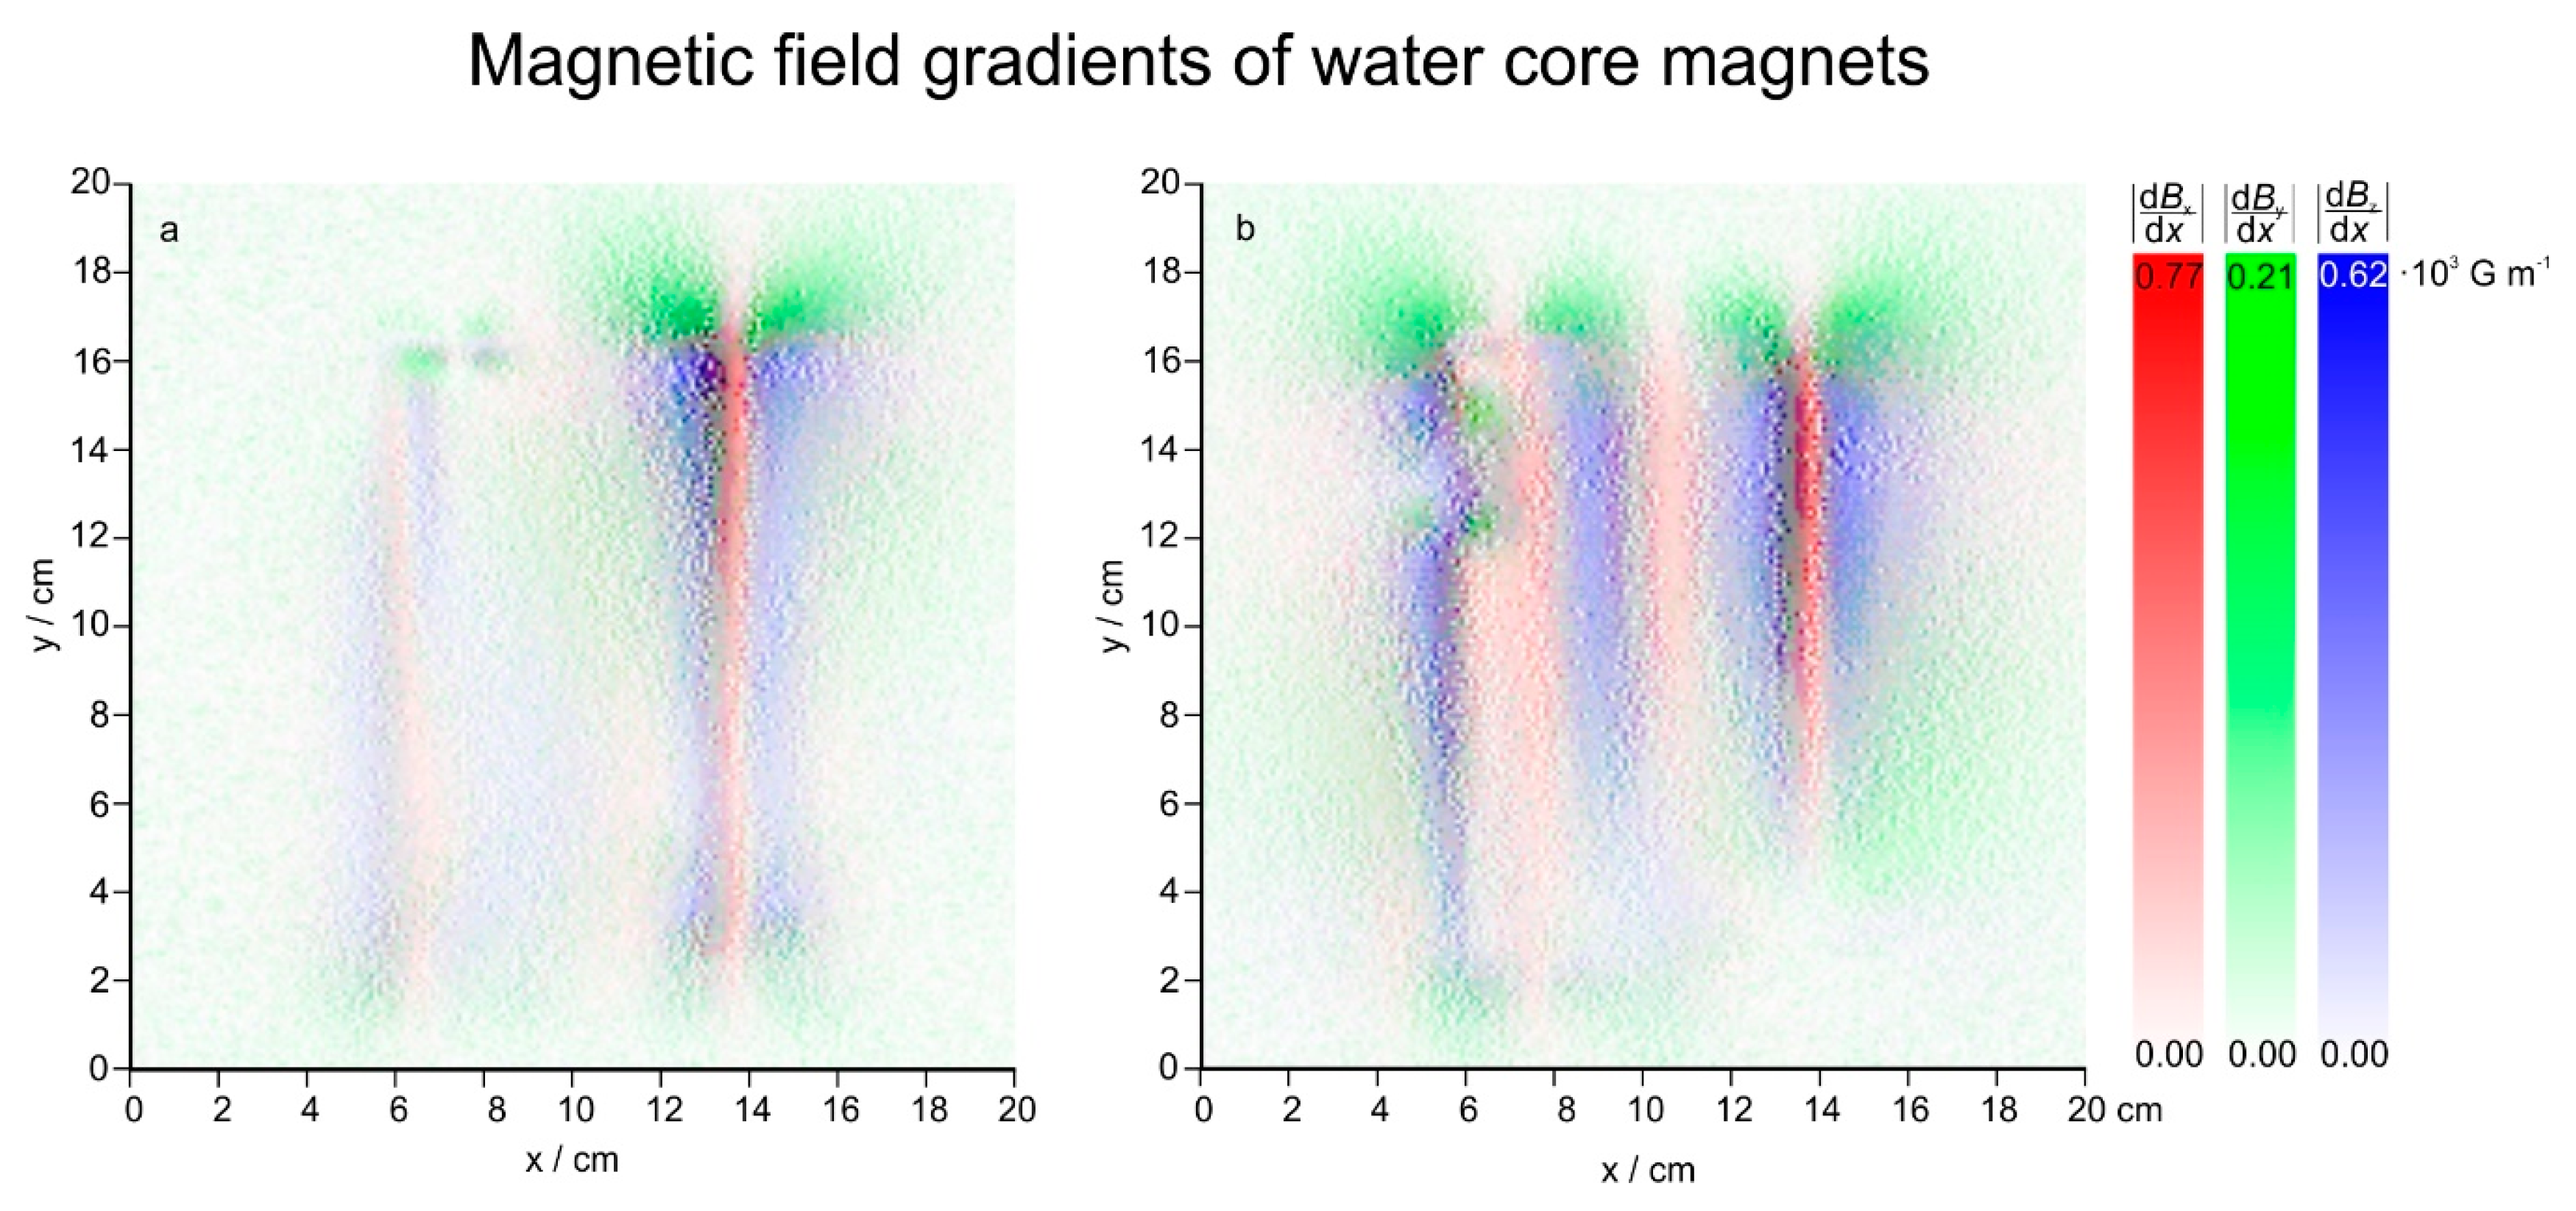
3.2. Magnetic Fields
3.3. Evaporation
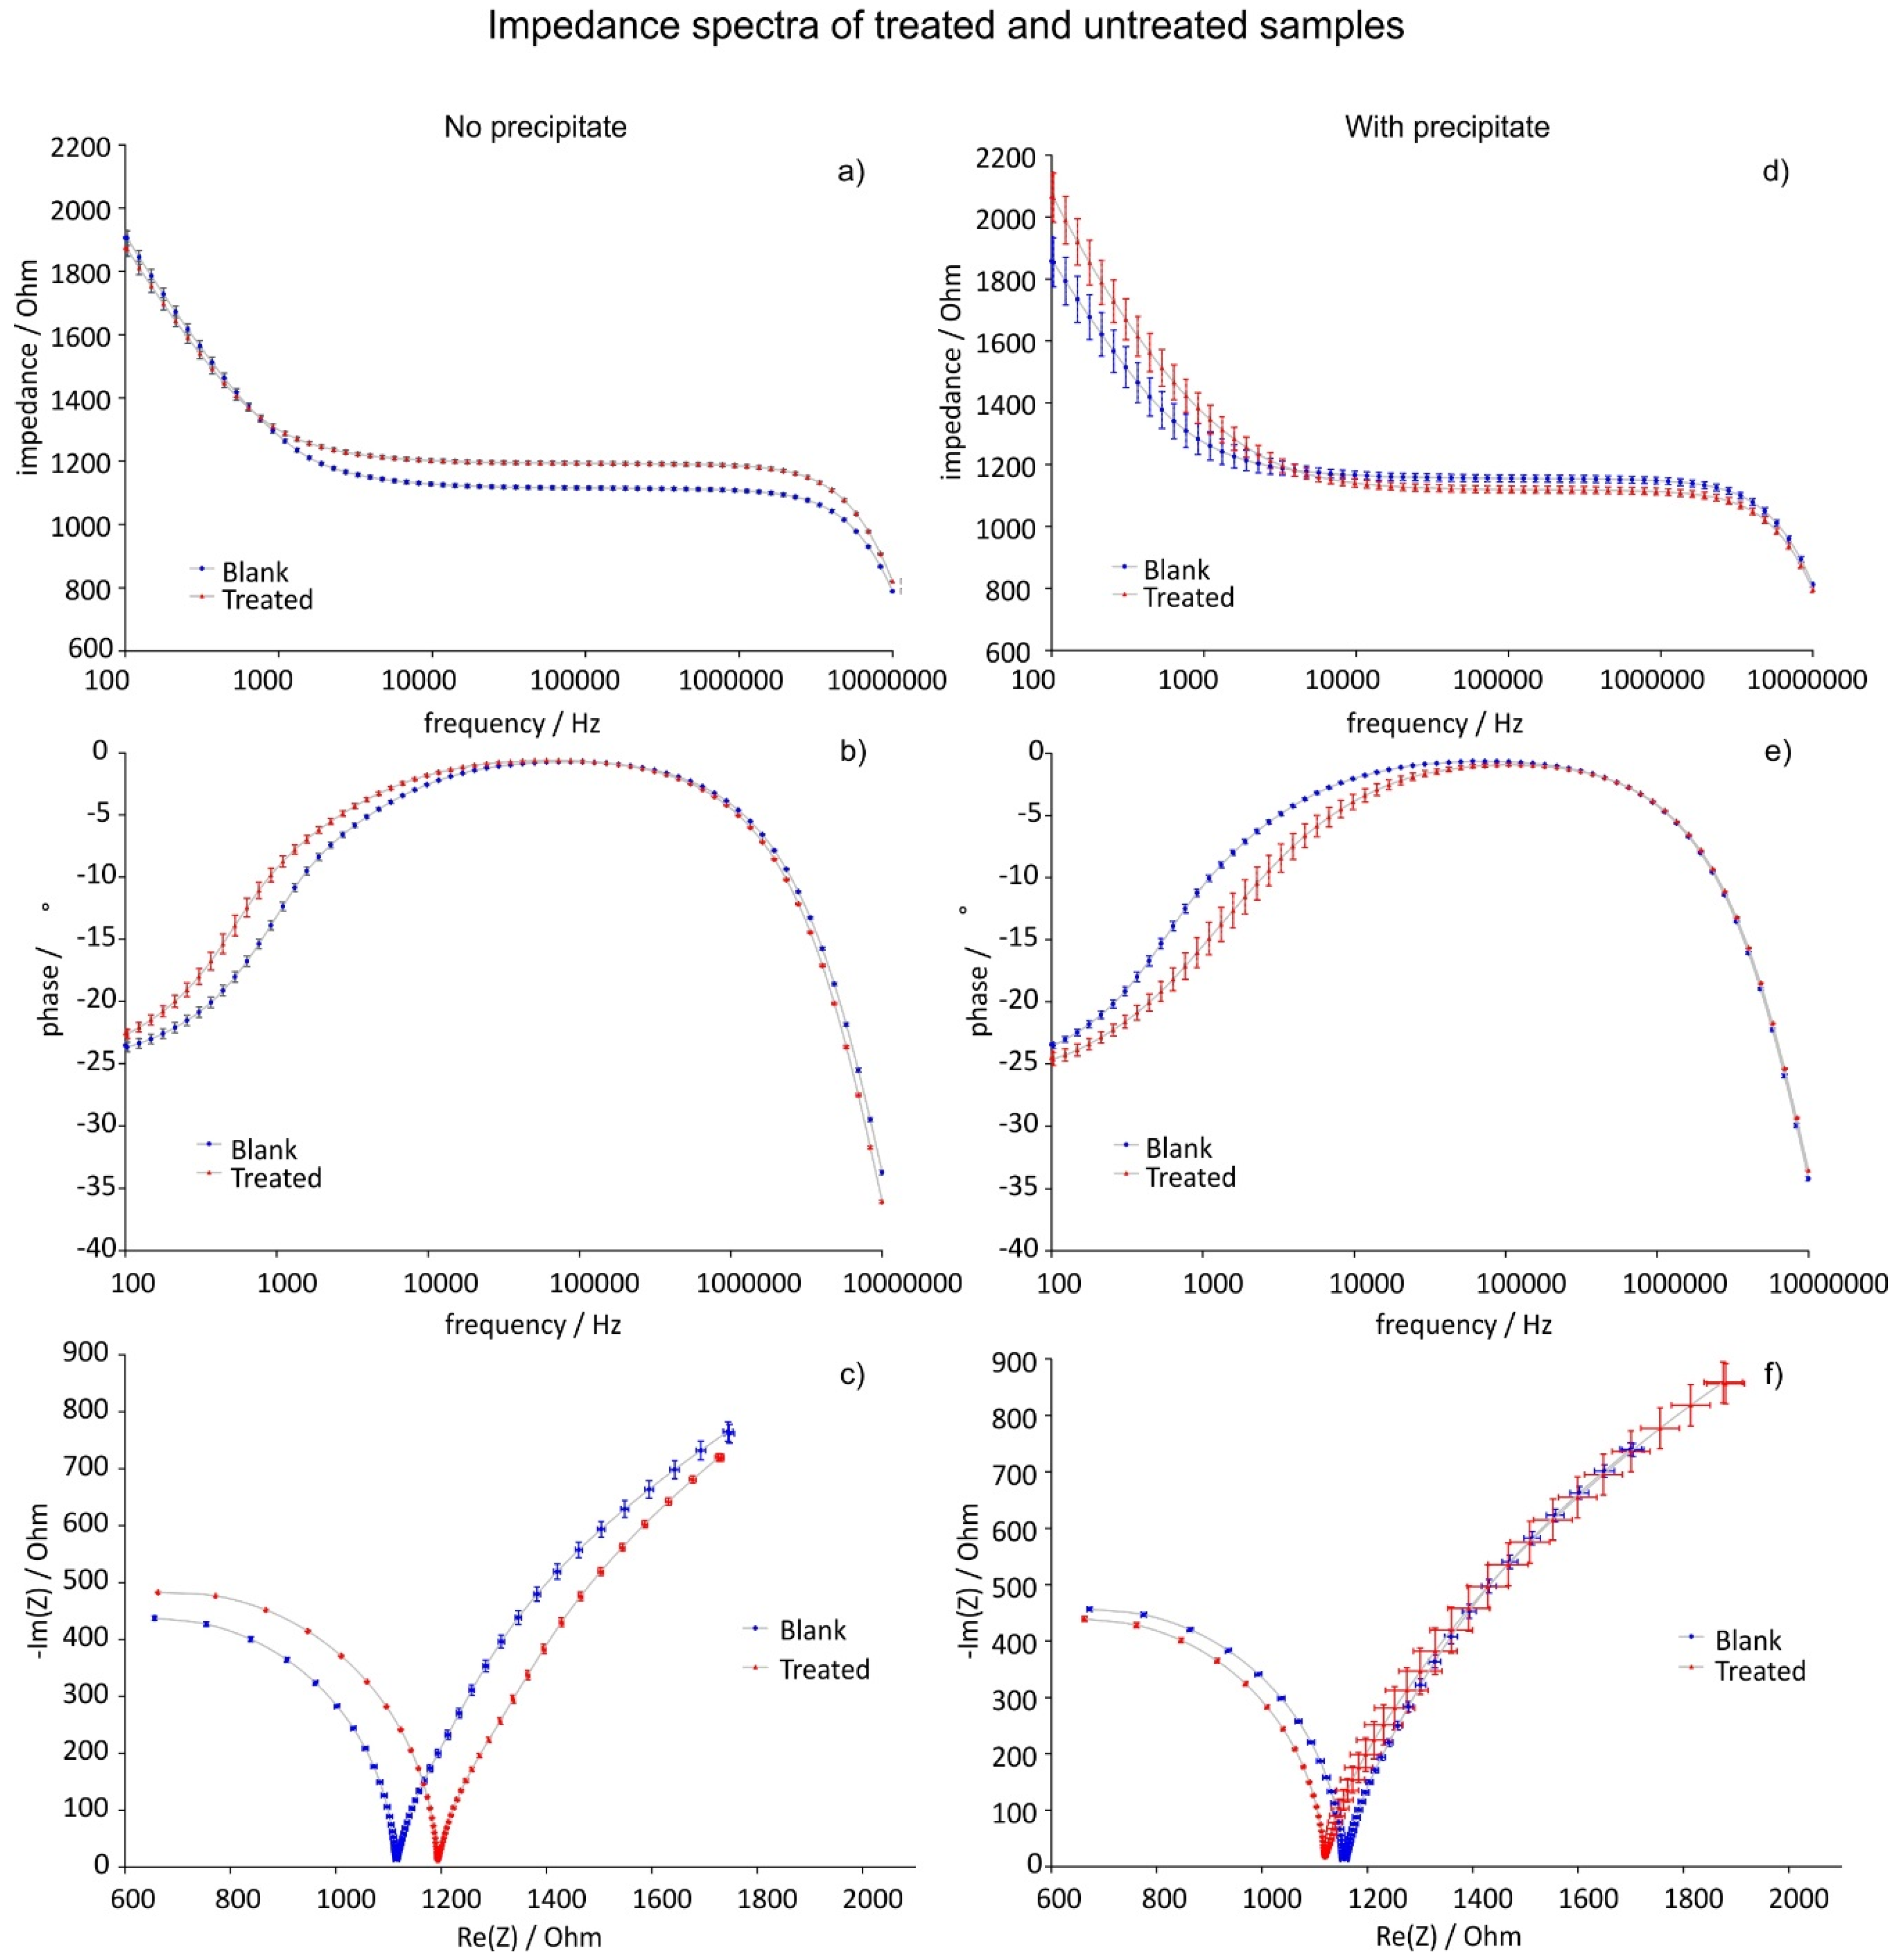
3.4. Complex Impedance
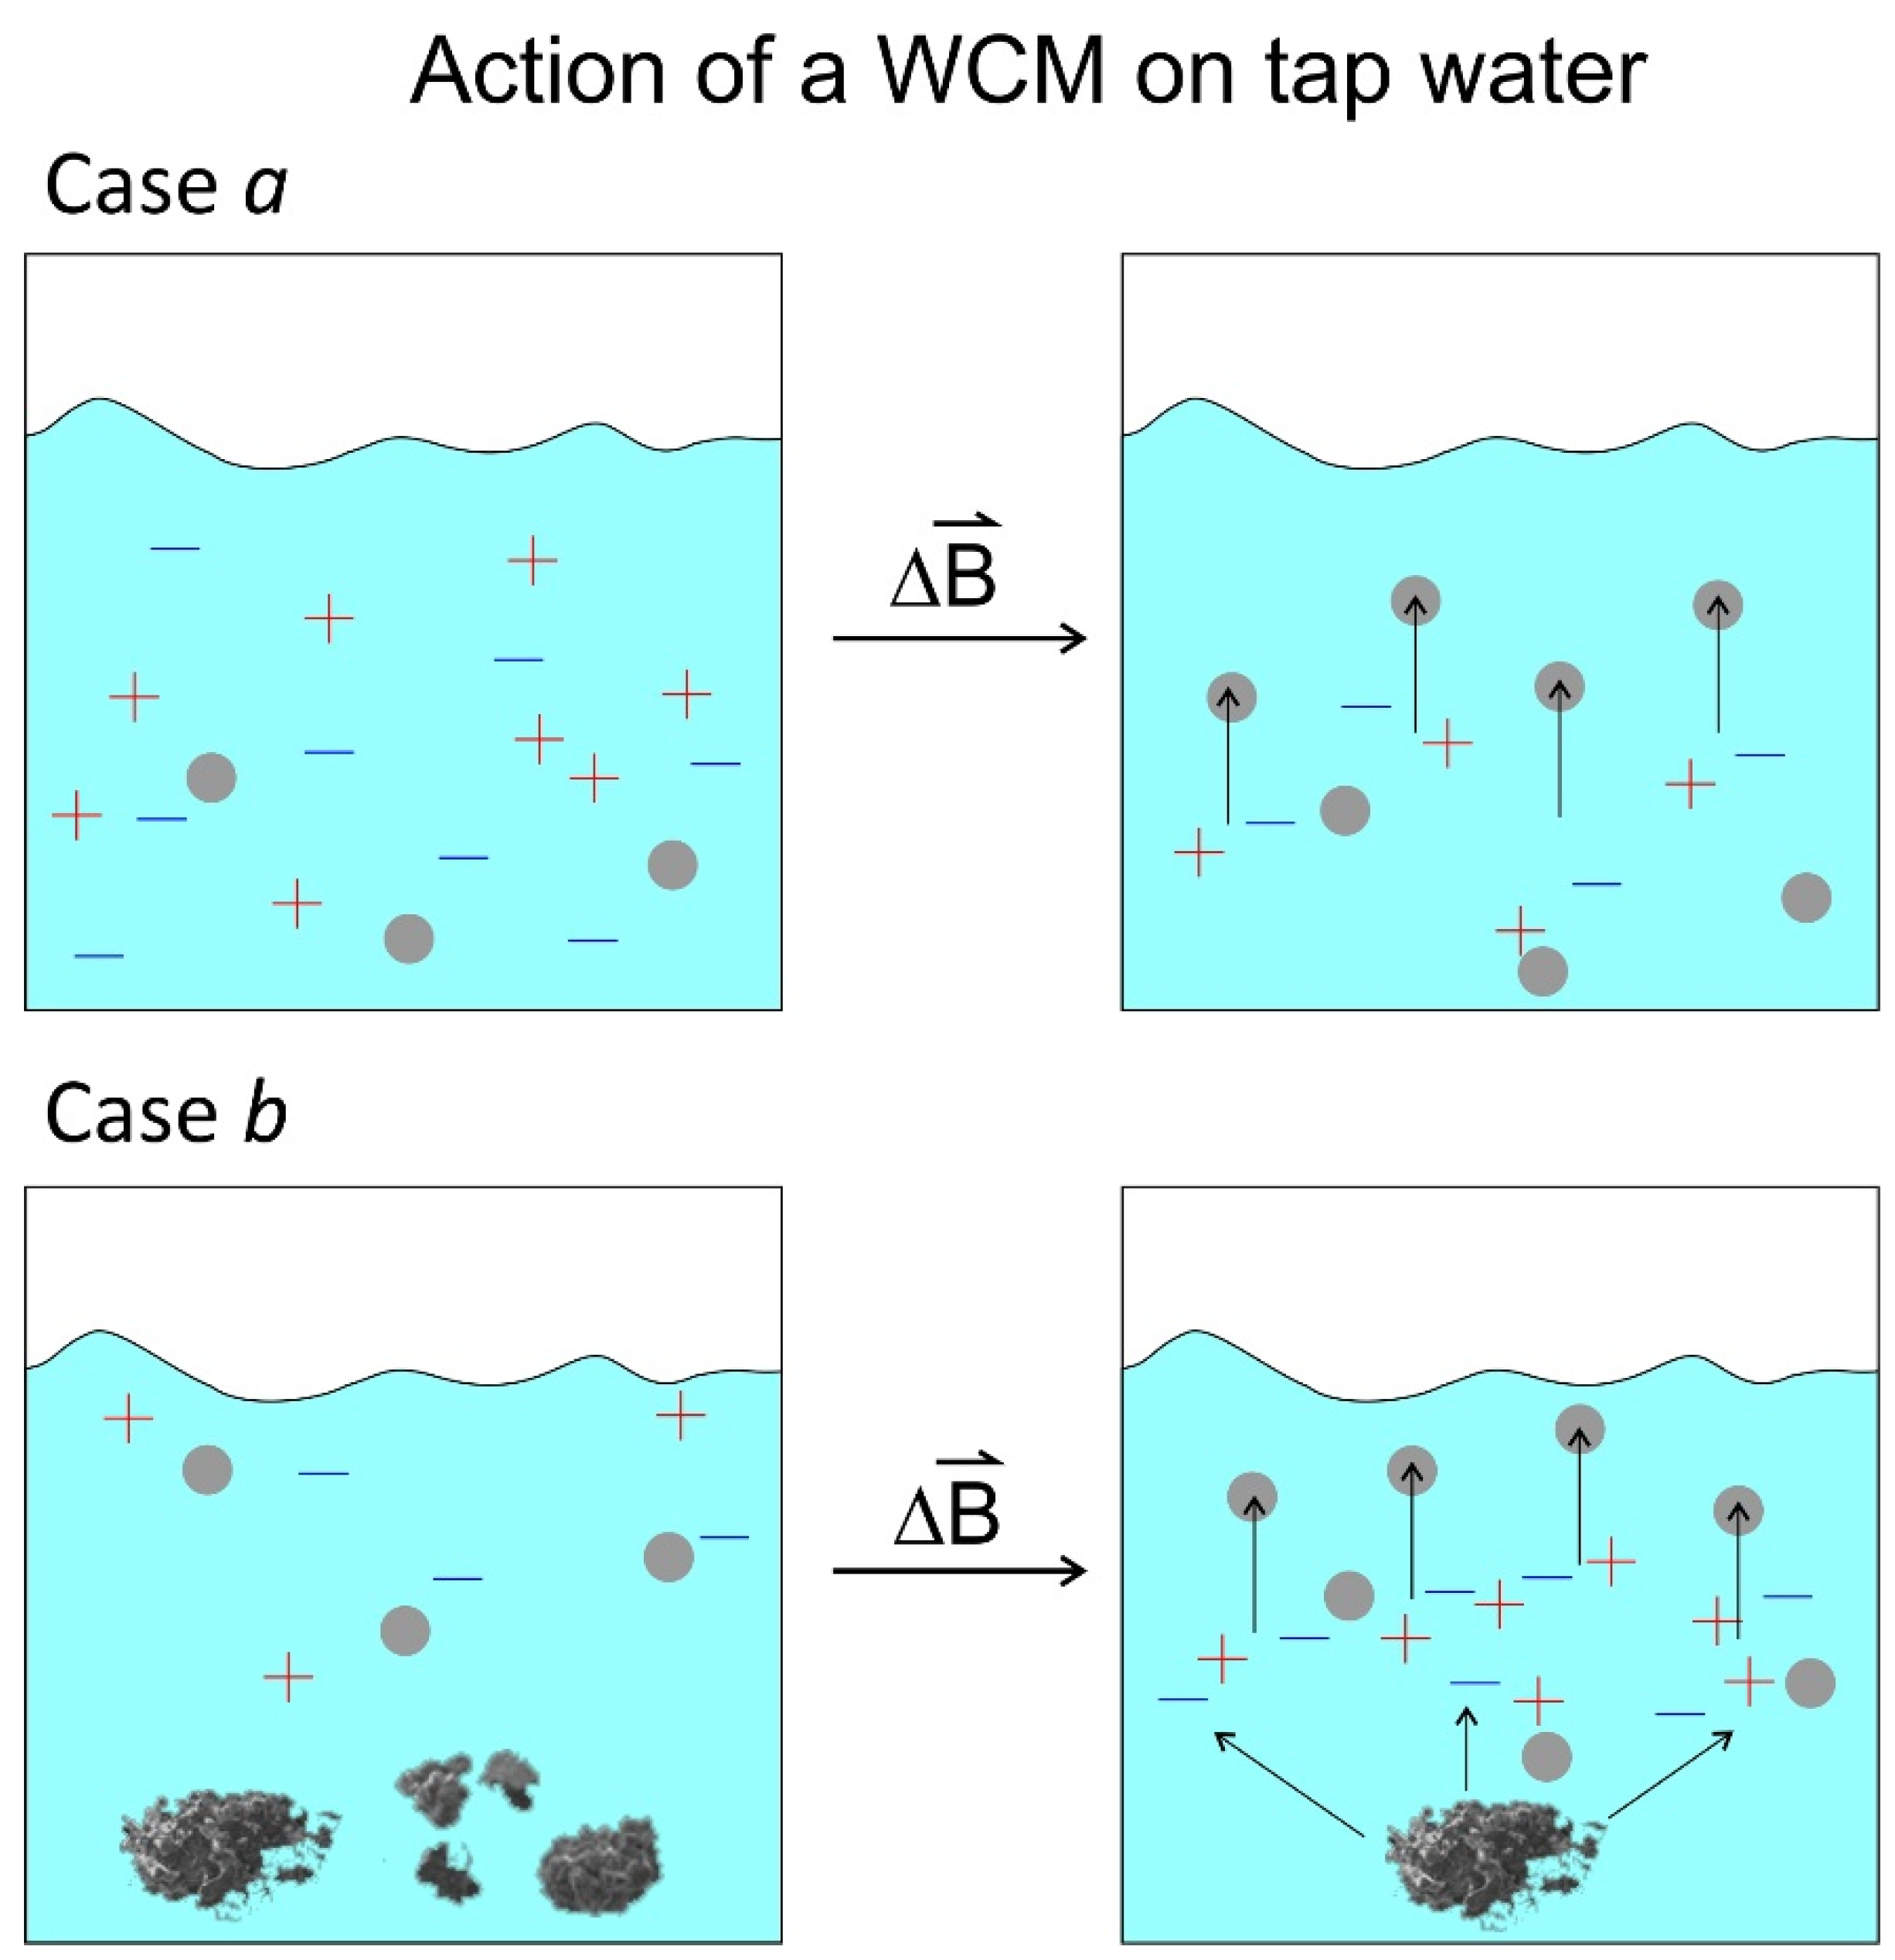
- Case a: No precipitation
- Case b: precipitation
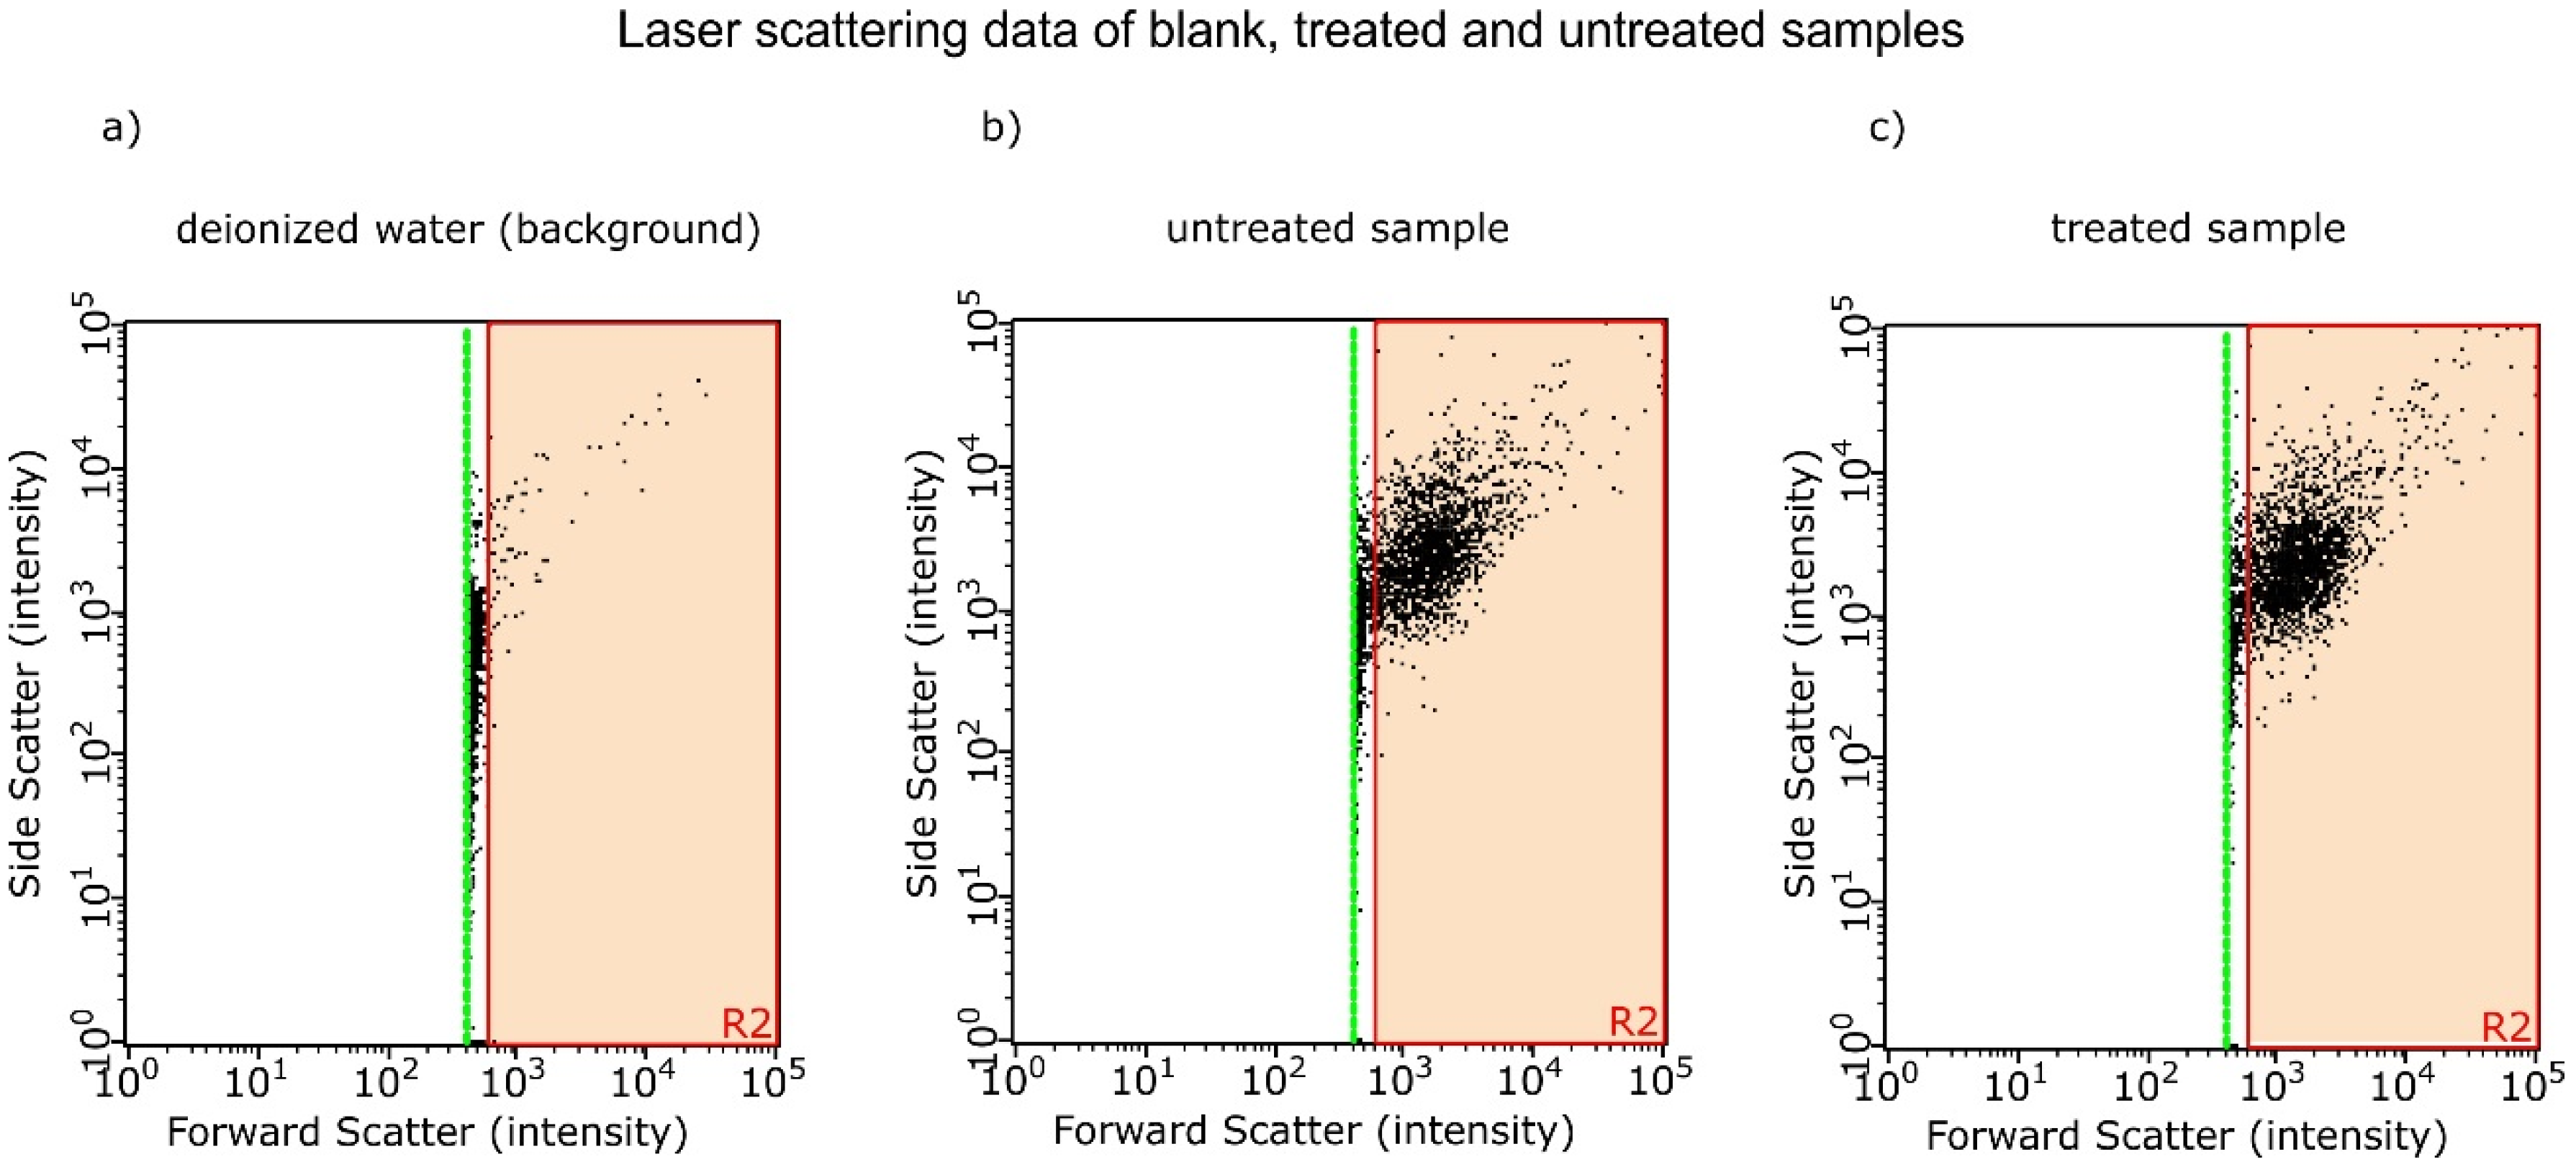
3.5. Laser Scattering
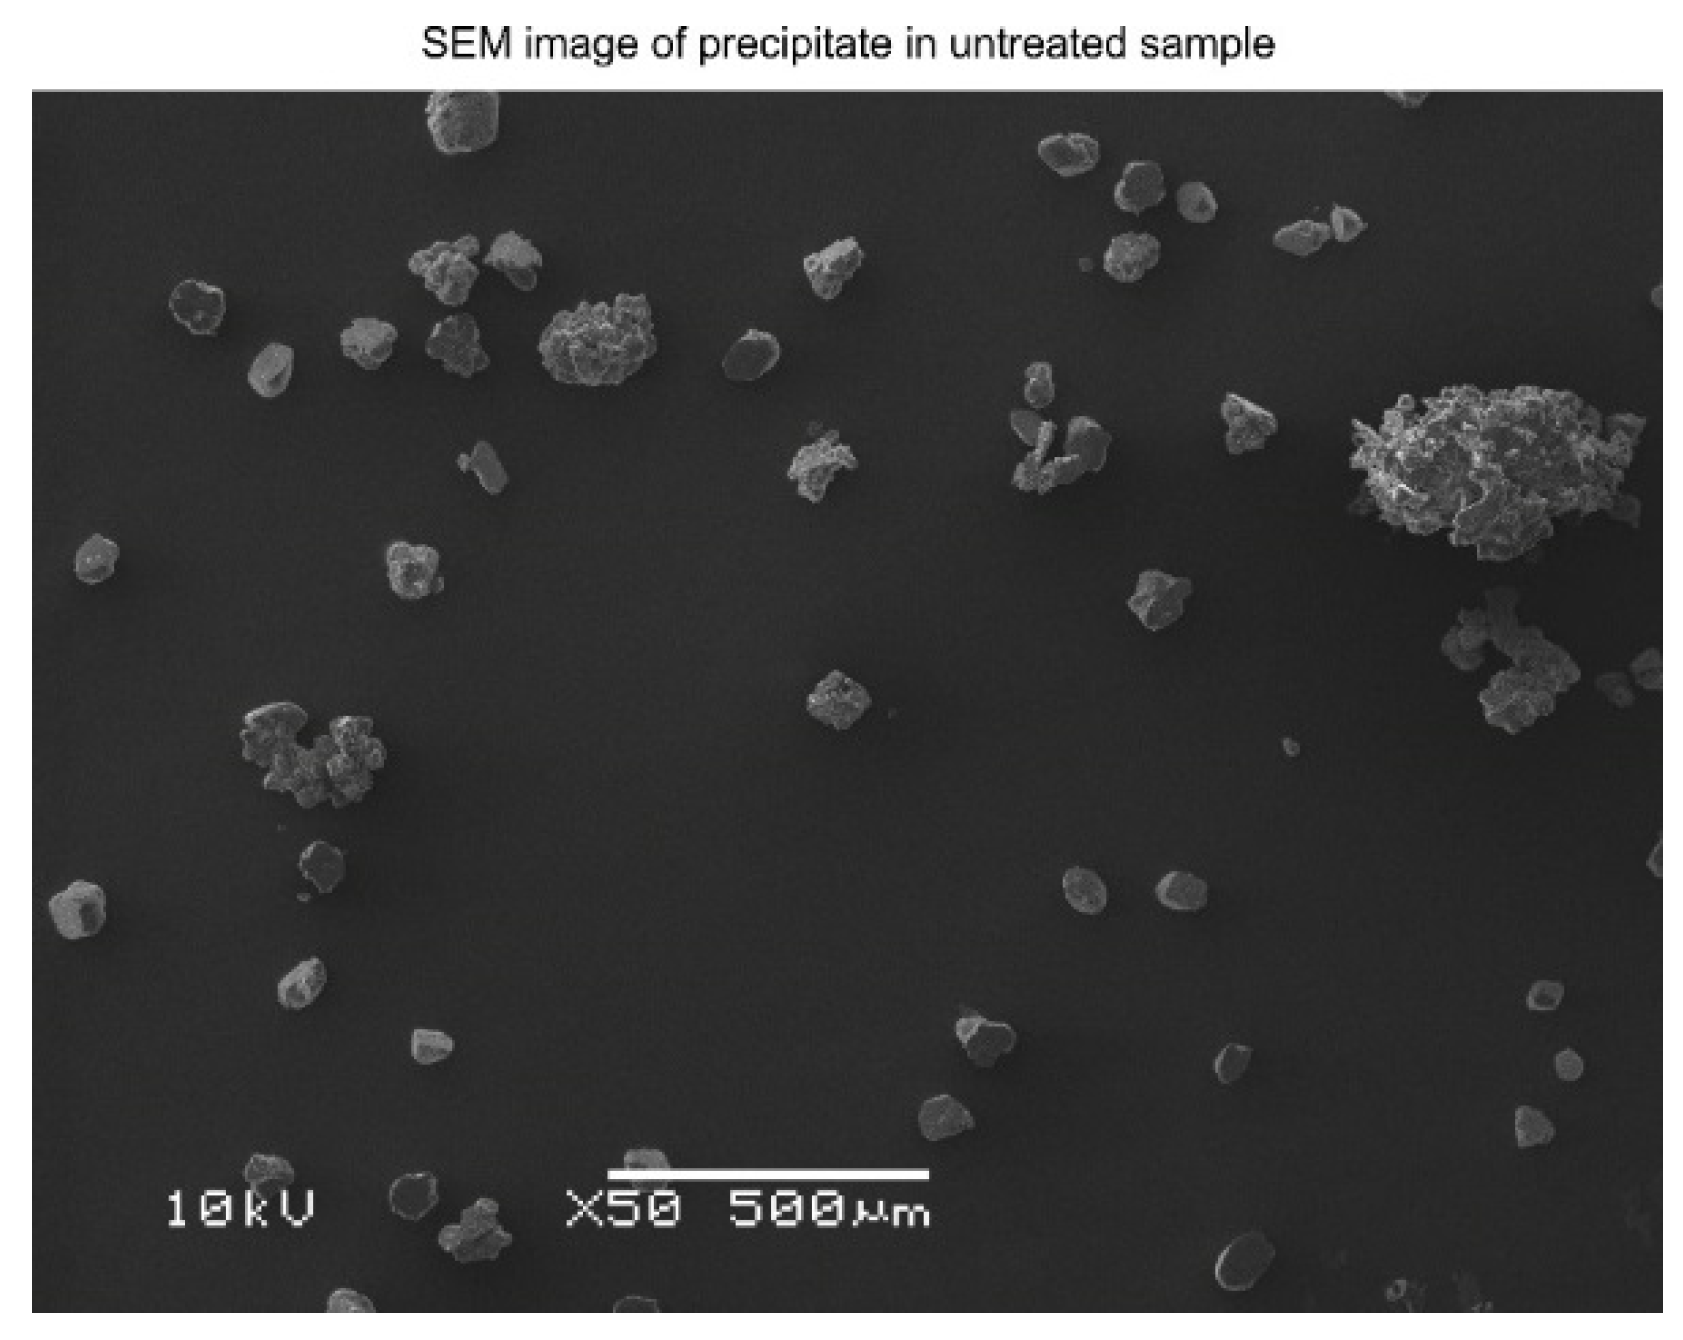
3.6. SEM/EDX
4. Conclusions
Acknowledgments
Author Contributions
Conflicts of Interest
Abbreviations
| BNC | Bayonet Neill–Concelman connector |
| C | Capacitance |
| C | Coey criterion |
| CPE | Constant phase element |
| cryo-TEM | Cryo transmission electron microscopy |
| DOLLOP | liquid-like oxyanion polymer |
| EDX | Energy-dispersive X-ray spectroscopy |
| EIS | Electrical impedance spectroscopy |
| IC | Ion chromatography |
| IC | Inorganic carbon |
| ICP | Inductively coupled plasma spectroscopy |
| K | X-ray electron shell notation |
| L | X-ray electron shell notation |
| LOQ | Limit of quantification |
| Milli-Q | trademark created by Millipore Corporation to describe 'ultrapure' water of "Type 1", as defined by ISO 3696 |
| MDPI | Multidisciplinary Digital Publishing Institute |
| NPOC | Non-purgable organic carbon |
| R | Resistance |
| Raq | Resistance of water |
| RGB | Red,green, blue (additive colour model) |
| SEM | Scanning electron microscopy |
| TC | Total carbon |
| TOC | Total organic carbon |
| W | Warburg impedance |
| WCM | Water core magnet |
| Z | complex impedance |
| φ | phase |
References
- Josh, K.M.; Kamat, P.V. Effect of magnetic field on the physical properties of water. J. Ind. Chem. Soc. 1966, 43, 620–622. [Google Scholar]
- Duffy, E.A. Investigation of Magnetic Water Treatment Devices. Ph.D. Thesis, Clemson University, Clemson, SC, USA, 1977. [Google Scholar]
- Lin, I.; Yotvat, J. Exposure of irrigation and drinking water to a magnetic field with controlled power and direction. J. Mag. Magn. Mat. 1990, 83, 525–526. [Google Scholar] [CrossRef]
- Higashitani, K.; Kage, A.; Katumura, S.; Imai, K.; Hatade, S. Effects of a magnetic field on the formation of CaCO3 particles. J. Colloid Interface Sci. 1993, 156, 90–95. [Google Scholar] [CrossRef]
- Gehr, R.; Zhai, Z.A.; Finch, J.A.; Rao, S.R. Reduction of soluble mineral concentrations in CaSO4 saturated water using a magnetic field. Water Res. 1995, 29, 933–940. [Google Scholar] [CrossRef]
- Baker, J.S.; Judd, S.J. Magnetic amelioration of scale formation. Water Res. 1996, 30, 247–260. [Google Scholar] [CrossRef]
- Pach, L.; Duncan, S.; Roy, R.; Komarneni, S. Effects of a magnetic field on the precipitation of calcium carbonate. J. Mater. Sci. Lett. 1996, 15, 613–615. [Google Scholar] [CrossRef]
- Wang, Y.; Babchin, A.J.; Chernyi, L.T.; Chow, R.S.; Sawatzky, R.P. Rapid onset of calcium carbonate crystallization under the influence of a magnetic field. Water Res. 1997, 31, 346–350. [Google Scholar] [CrossRef]
- Parsons, S.A.; Wang, B.L.; Judd, S.J.; Stephenson, T. Magnetic treatment of calcium carbonate scale-effect of pH control. Water Res. 1997, 31, 339–342. [Google Scholar] [CrossRef]
- Barrett, R.A.; Parsons, S.A. The influence of magnetic fields on calcium carbonate precipitation. Water Res. 1998, 32, 609–612. [Google Scholar] [CrossRef]
- Colic, M.; Morse, D. The elusive mechanism of the magnetic 'memory'of water. Colloid Surface A 1999, 154, 167–174. [Google Scholar] [CrossRef]
- Goldsworthy, A.; Whitney, H.; Morris, E. Biological effects of physically conditioned water. Water Res. 1999, 33, 1618–1626. [Google Scholar] [CrossRef]
- Coey, J.M.D.; Cass, S. Magnetic water treatment. J. Magn. Magn. Mater. 2000, 209, 71–74. [Google Scholar] [CrossRef]
- Hołysz, L.; Chibowski, E.; Szcześ, A. Influence of impurity ions and magnetic field on the properties of freshly precipitated calcium carbonate. Water. Res. 2003, 37, 3351–3360. [Google Scholar] [CrossRef]
- Kobe, S.; Dražić, G.; McGuiness, P.J.; Meden, T.; Sarantopolou, E.; Kollia, Z.; Sefalas, A.C. Control over nanocrystalization in turbulent flow in the presence of magnetic fields. Mater. Sci. Eng. 2003, 23, 811–815. [Google Scholar] [CrossRef]
- Knez, S.; Pohar, C. The magnetic field influence on the polymorph composition of CaCO3 precipitated from carbonized aqueous solutions. J. Colloid Interface Sci. 2005, 281, 377–388. [Google Scholar] [CrossRef] [PubMed]
- Fathia, A.; Mohamed, T.; Claude, G.; Maurin, G.; Mohamed, B.A. Effect of a magnetic water treatment on homogeneous and heterogeneous precipitation of calcium carbonate. Water Res. 2006, 40, 1941–1950. [Google Scholar] [CrossRef] [PubMed]
- Li, J.; Liu, J.; Yang, T.; Xiao, C. Quantitative study of the effect of electromagnetic field on scale deposition on nanofiltration membranes via UTDR. Water Res. 2007, 41, 4595–4610. [Google Scholar] [CrossRef] [PubMed]
- Katsir, Y.; Miller, L.; Aharanov, Y.; Jacob, E.B. The effect of rf-irradiation on electrochemical deposition and its stabilization by nanoparticle doping. J. Electrochem. Soc. 2007, 154, 249–259. [Google Scholar] [CrossRef]
- Hołysz, L.; Szcześ, A.; Chibowski, E. Effects of a static magnetic field on water and electrolyte solutions. J. Colloid Interface Sci. 2007, 316, 996–1002. [Google Scholar] [CrossRef] [PubMed]
- Coey, J.M.D. Magnetic water treatment-how might it work? Phil. Mag. 2012, 92, 3857–3865. [Google Scholar] [CrossRef]
- Gebauer, D.; Völkel, A.; Cölfen, H. Stable prenucleation calcium carbonate clusters. Science 2008, 322, 1819. [Google Scholar] [CrossRef] [PubMed]
- Pouget, E.M.; Bomans, P.H.H.; Goos, J.A.C.M.; Frederik, P.M.; de With, G.; Sommerdijk, N.A.J.M. The Initial Stages of Template-Controlled CaCO3 Formation Revealed by Cryo-TEM. Science 2009, 323, 1455–1458. [Google Scholar] [CrossRef] [PubMed]
- Raiteri, P.; Gale, J.D. Water is the key to nonclassical nucleation of amorphous calcium carbonate. J. Am. Chem. Soc. 2010, 132, 17623–17634. [Google Scholar] [CrossRef] [PubMed]
- Gebauer, D.; Cölfen, H. Prenucleation clusters and non-classical nucleation. Nano Today 2011, 6, 564–584. [Google Scholar] [CrossRef]
- Wolf, S.E.; Müller, L.; Barrea, R.; Kampf, C.J.; Leiterer, J.; Panne, U.; Hoffmann, T.; Emmerling, F.; Tremel, W. Carbonate-coordinated metal complexes precede the formation of liquid amorphous mineral emulsions of divalent metal carbonates. Nanoscale 2011, 3, 1158–1165. [Google Scholar] [CrossRef] [PubMed]
- Demichelis, R.; Raiteri, P.; Quigley, J.D.; Gebauer, D. Stable prenucleation mineral clusters are liquid-like ionic polymers. Nat. Commun. 2011, 2, 590. [Google Scholar] [CrossRef] [PubMed]
- Donaldson, J.D. Magnetic treatment of fluids-preventing scale. Finish 1988, 12, 22–32. [Google Scholar]
- Spear, M. The growing attraction of magnetic treatment. Process. Eng. 1992, 73, 143. [Google Scholar]
- Zunkovič, K. Wasserbelebung am Beispiel Grander-Technologie: Eine Empirische Erhebung unter industriellen Anwendern. Diploma Thesis, University of Graz, Graz, Austria, 2007. [Google Scholar]
- Busch, K.W.; Busch, M.A.; Parker, D.H.; Darling, R.E.; McAtee, J.L., Jr. Studies of a water treatment device that uses magnetic fields. Corrosion 1986, 42, 211–221. [Google Scholar] [CrossRef]
- Goldman, A. Modern Ferrite Technology; Springer: New York, NY, USA, 2006. [Google Scholar]
- Sammer, M.; Laarhoven, B.; Mejias, E.; Yntema, D.; Fuchs, E.C.; Holler, G.; Brasseur, G.; Lankmayr, E. Biomass measurement of living Lumbriculus variegatus with impedance spectroscopy. J. Electrical Bioimpedance 2014, 5, 92–98. [Google Scholar] [CrossRef]
- Brug, G.; van den Eeden, A.L.G.; Sluyters-Rehbach, M.; Sluyters, J.H. The analysis of electrode impedances complicated by the presence of a constant phase element. J. Electroanal. Chem. Interfacial Electrochem. 1984, 176, 275–295. [Google Scholar] [CrossRef]
- Santos, M.B.D.; Agusil, J.P.; Prieto-Simón, B.; Sporer, C.; Teixeira, V.; Samitier, J. Highly sensitive detection of pathogen Escherichia coli O157: H7 by electrochemical impedance spectroscopy. Biosens. Bioelectron. 2013, 45, 174–180. [Google Scholar] [CrossRef] [PubMed]
- Bondarenko, A.S.; Ragoisha, G.A. Inverse Problem in Potentiodynamic Electrochemical Impedance. In Progress in Chemometrics Research; Pomerantsev, A.L., Ed.; Nova Science Publishers: New York, NY, USA, 2005; pp. 89–102. [Google Scholar]
- Powell, M. An efficient method for finding the minimum of a function of several variables without calculating derivatives. Comput. J. 1964, 7, 155–162. [Google Scholar] [CrossRef]
- Martynova, O.I.; Tebenekhin, E.F.; Gusev, B.T. Conditions and mechanism of deposition of the solid calcium carbonate phase from aqueous solutions under the influence of a magnetic field. Colloid J. USSR 1967, 29, 512–514. [Google Scholar]
- Chechel, P.S.; Annenkova, G.V. Influence of magnetic treatment on solubility of calcium sulphate. Coke Chem. R 1972, 8, 60–61. [Google Scholar]
- Kronenberg, K.J. Experimental evidence for effects of magnetic fields on moving water. IEEE Trans. Magn. 1985, 21, 2059–2061. [Google Scholar] [CrossRef]
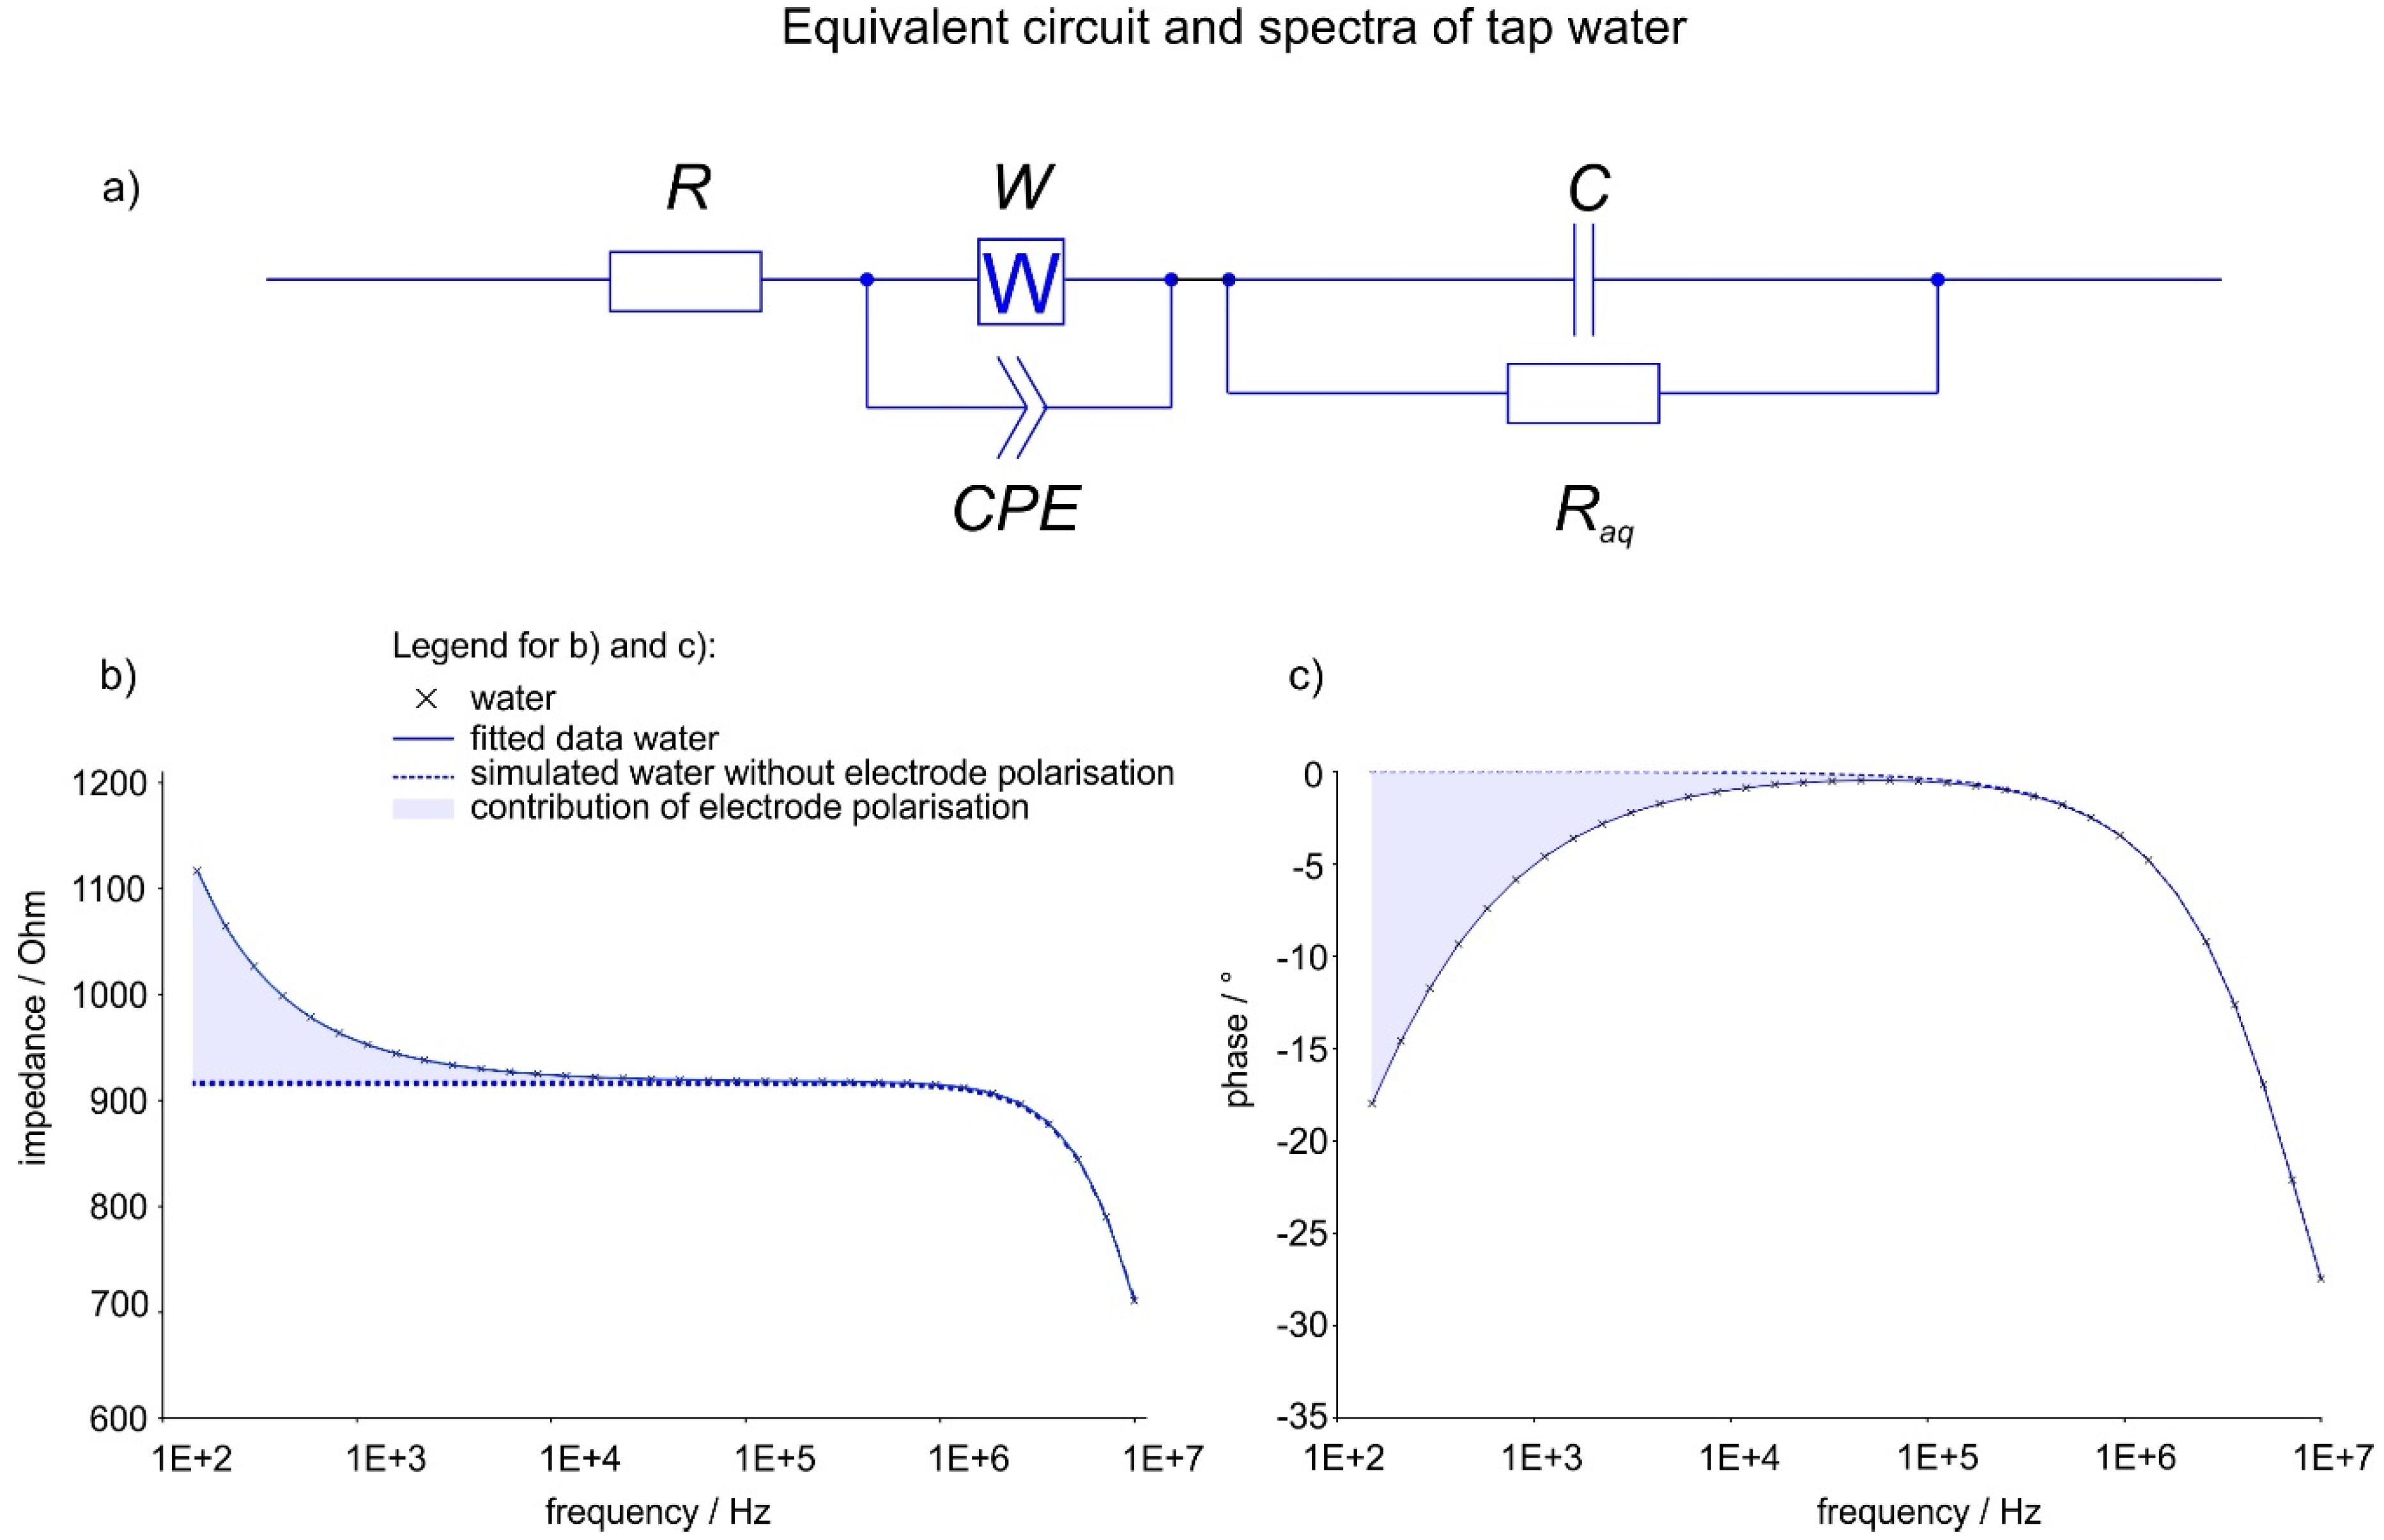
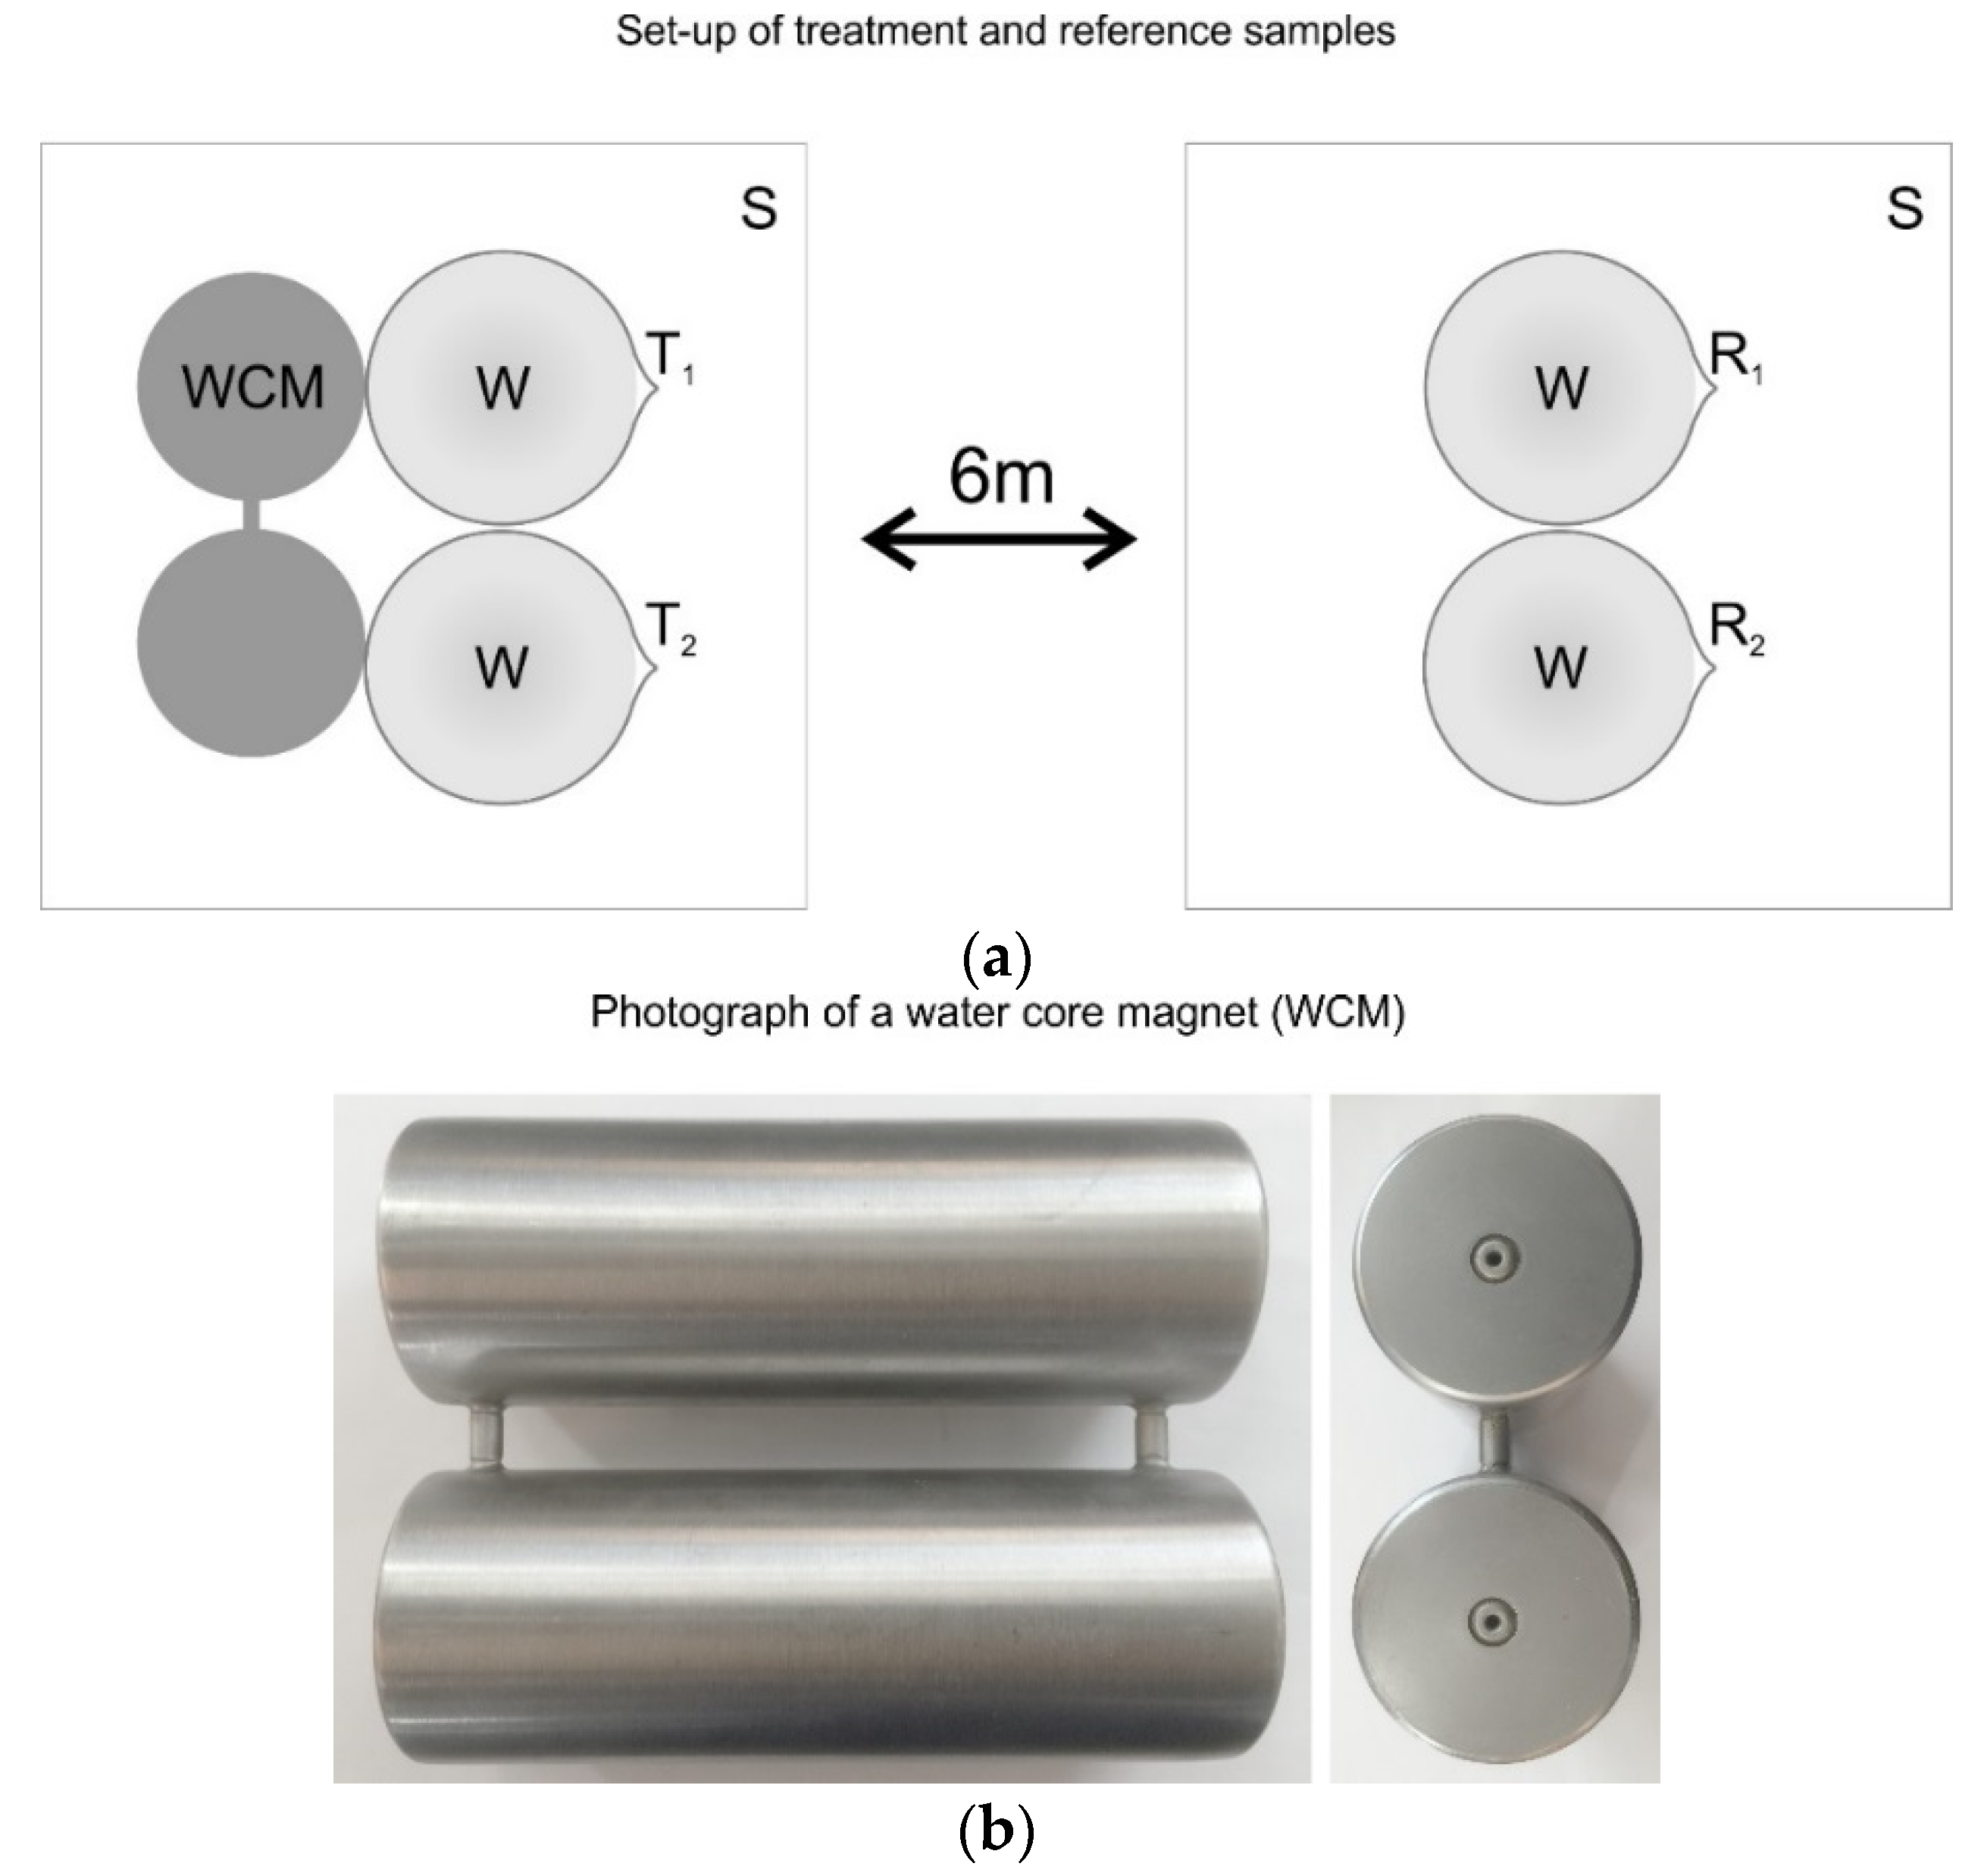
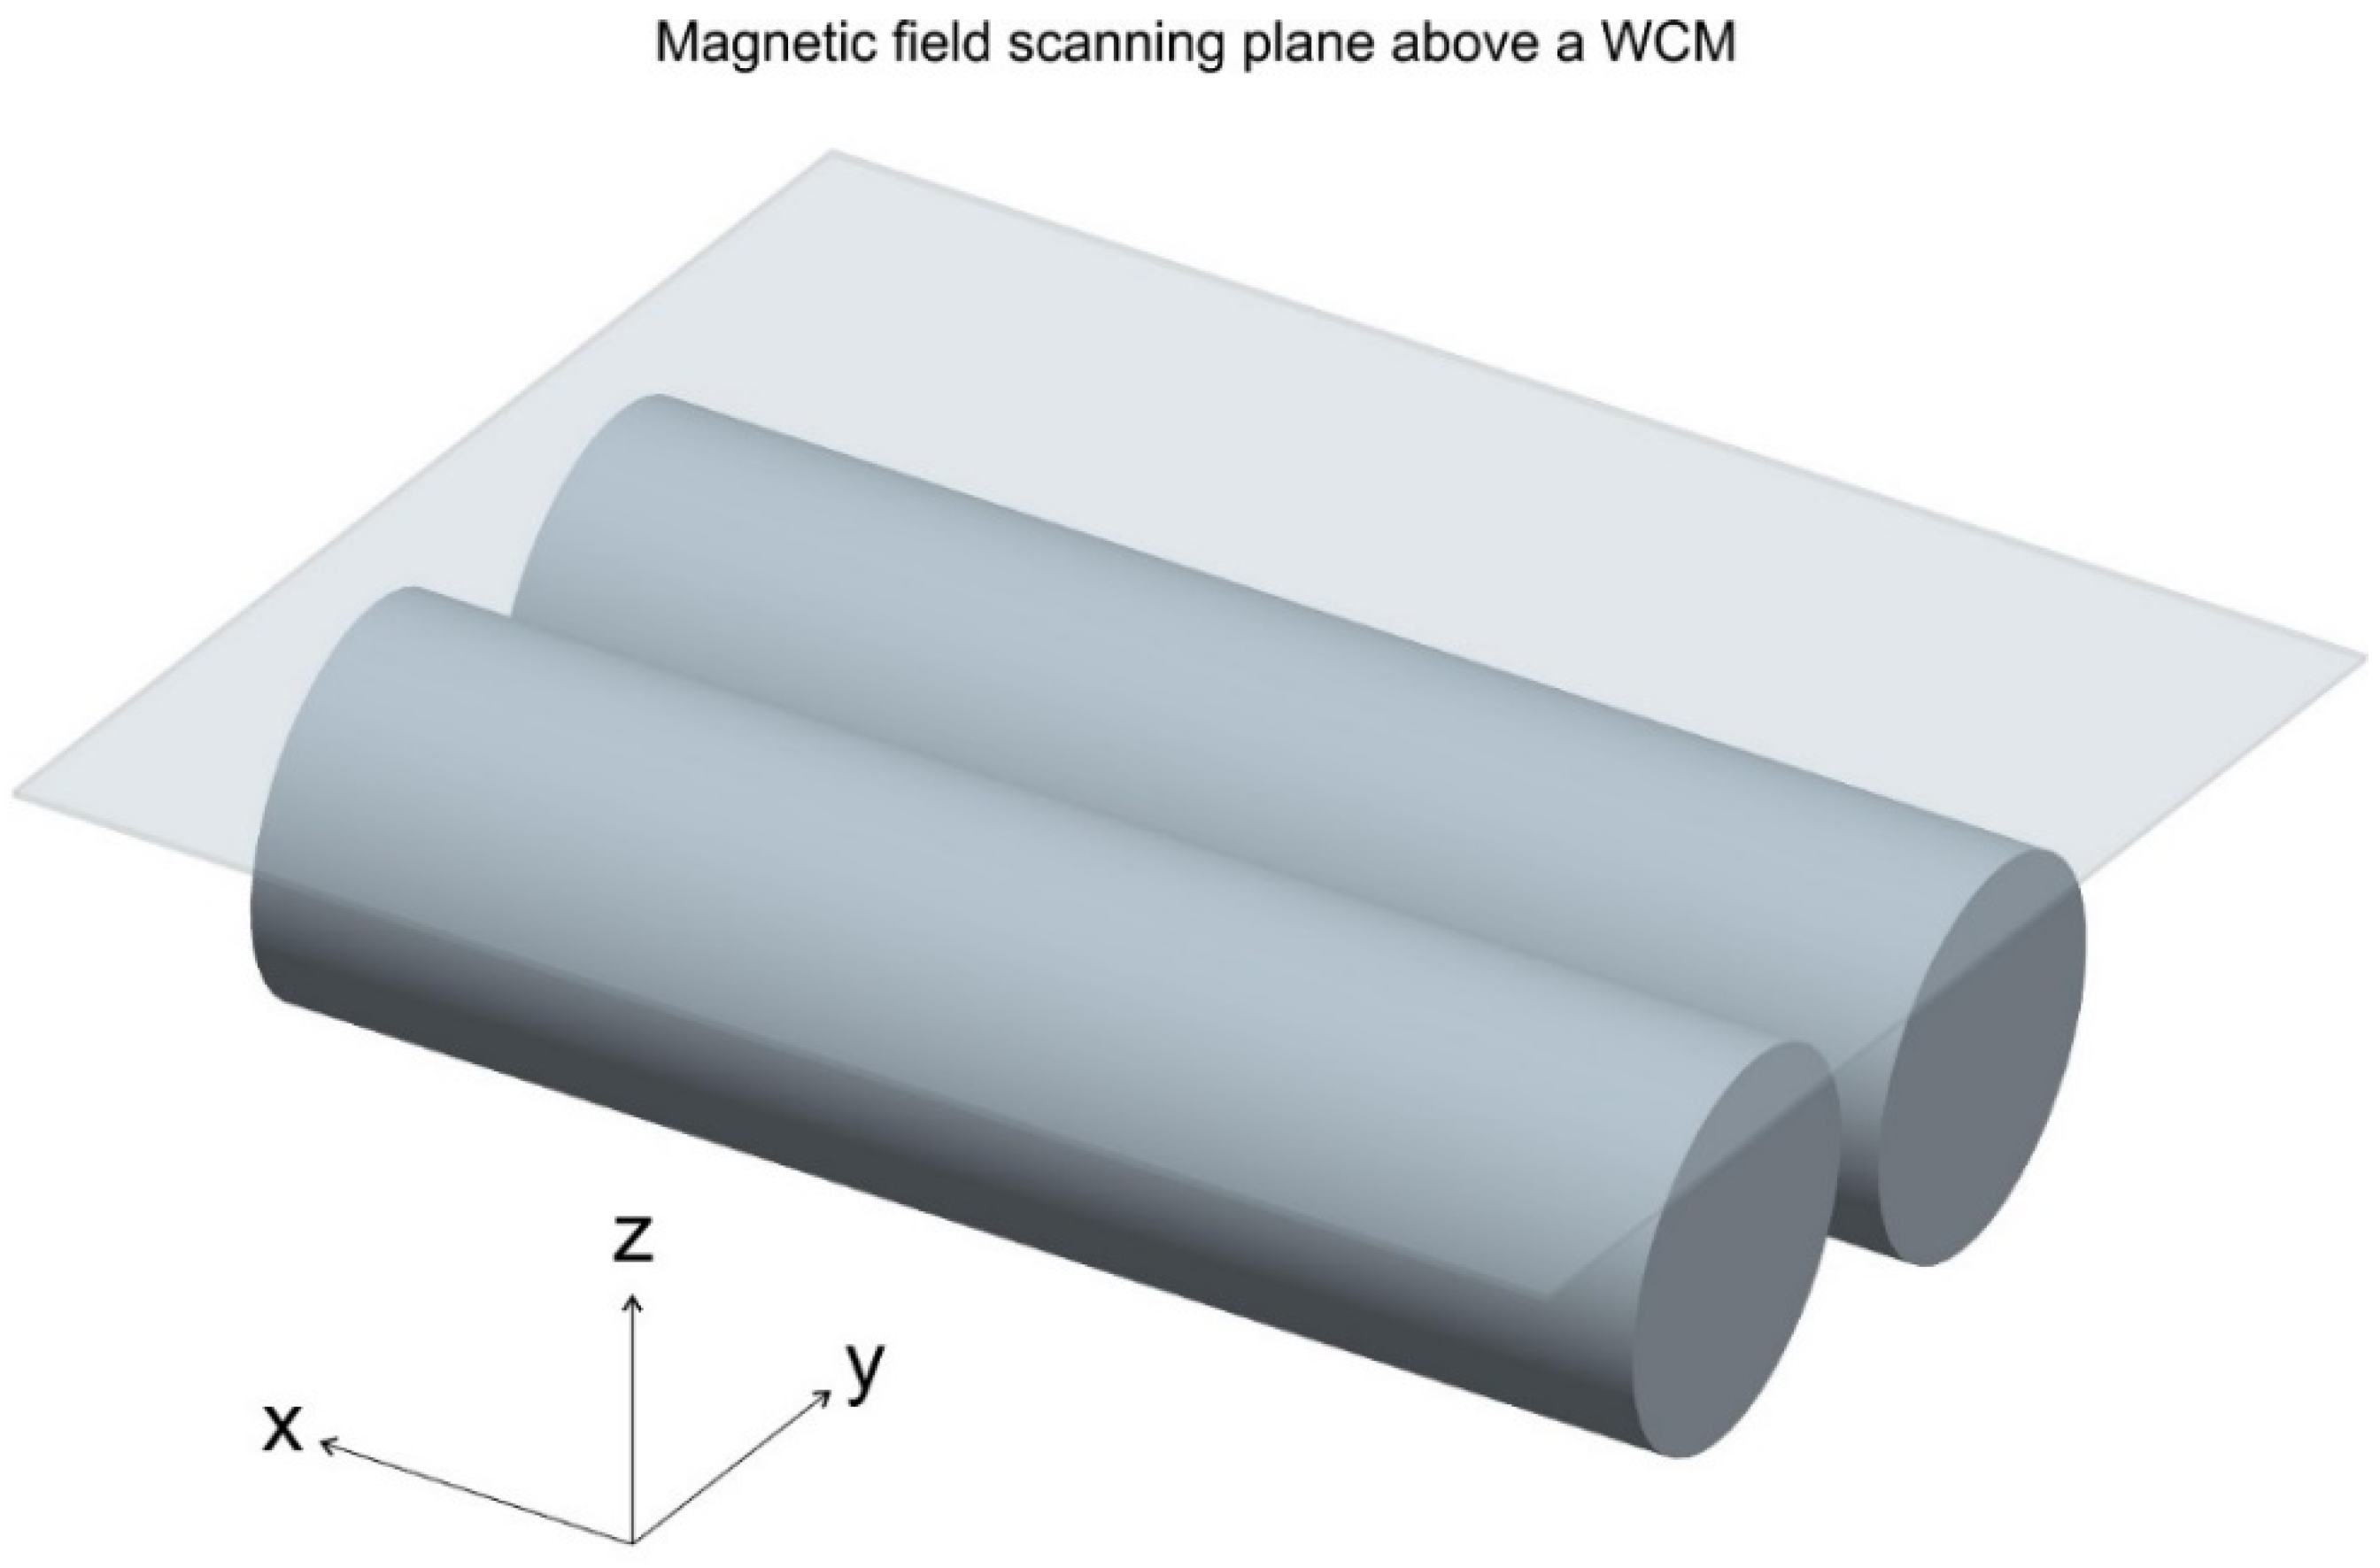

| Parameter | Number |
|---|---|
| Number of experiments | 16 |
| Measurements per sample | ≥3 |
| Frequencies per measurement | 65 |
| Parameters per frequency | 2 |
| Significant difference (95% confidence interval) | 15 |
| Parameter | Untreated | Treated | Absolute Difference | Relative Difference | ||
|---|---|---|---|---|---|---|
| R/Ω | 238 | ±9 | 238 | ±6 | 0 | 0% |
| Aw/Ω·s−0.5 | 22,593 | ±11 | 21,202 | ±511 | −1391 | −6% |
| CPE P × 107 | 2.01 | ±0.32 | 4.37 | ±0.37 | 2.36 | +118% |
| CPE n | 1.00 | ±0.02 | 0.97 | ±0.01 | −0.031 | −3% |
| C/pF | 17.7 | ±0.98 | 16.8 | ±1.4 | −0.989 | −6% |
| Raq/Ω | 870 | ±9 | 951 | ±8 | 81 | +9% |
| Parameter | Untreated | Treated | Absolute Difference | Relative Difference | ||
|---|---|---|---|---|---|---|
| R/Ω | 232 | ±7 | 232 | ±10 | 0 | 0% |
| Aw/Ω·s−0.5 | 21,721 | ±10 | 24,967 | ±1064 | 3246 | +15% |
| CPE P · 107 | 3.63 | ±0.34 | 1.10 | ±0.25 | −2.53 | −70% |
| CPE n | 0.98 | ±0.01 | 1.00 | ±0.03 | 0.019 | +2% |
| C/pF | 16.9 | ±0.65 | 17.3 | ±1.1 | 0.342 | +2% |
| Raq/Ω | 917 | ±7 | 877 | ±11 | −40 | −4% |
| Case | Δ Raq, av /Ω | ERaq, av /Ω |
|---|---|---|
| a (8 experiments) | 31 ± 9 | 14 ± 3 |
| b (8 experiments) | −39 ± 9 | 13 ± 2 |
| Experiment | Untreated/104 Counts mL−1 | Treated/104 Counts mL−1 | Difference Treated vs. Untreated |
|---|---|---|---|
| Experiment 1 | 2.72 ± 0.02 | 3.01 ± 0.04 | P < 0.001 |
| Experiment 2 | 5.17 ± 0.02 | 7.00 ± 0.10 | P < 0.001 |
| Element, Line | Weight % | Atom % |
|---|---|---|
| Carbon, K | 13.23 | 18.87 |
| Oxygen, K | 68.28 | 73.11 |
| Magnesium, K | 0.40 | 0.28 |
| Phosphorus, K | 0.00 | 0.00 |
| Sulfur, K | 0.01 | 0.01 |
| Potassium, K | 0.06 | 0.02 |
| Calcium, K | 18.03 | 7.71 |
| Iron, L | 0.00 | 0.00 |
| Total | 100.00 | 100.00 |
© 2016 by the authors; licensee MDPI, Basel, Switzerland. This article is an open access article distributed under the terms and conditions of the Creative Commons by Attribution (CC-BY) license (http://creativecommons.org/licenses/by/4.0/).
Share and Cite
Sammer, M.; Kamp, C.; Paulitsch-Fuchs, A.H.; Wexler, A.D.; Buisman, C.J.N.; Fuchs, E.C. Strong Gradients in Weak Magnetic Fields Induce DOLLOP Formation in Tap Water. Water 2016, 8, 79. https://doi.org/10.3390/w8030079
Sammer M, Kamp C, Paulitsch-Fuchs AH, Wexler AD, Buisman CJN, Fuchs EC. Strong Gradients in Weak Magnetic Fields Induce DOLLOP Formation in Tap Water. Water. 2016; 8(3):79. https://doi.org/10.3390/w8030079
Chicago/Turabian StyleSammer, Martina, Cees Kamp, Astrid H. Paulitsch-Fuchs, Adam D. Wexler, Cees J. N. Buisman, and Elmar C. Fuchs. 2016. "Strong Gradients in Weak Magnetic Fields Induce DOLLOP Formation in Tap Water" Water 8, no. 3: 79. https://doi.org/10.3390/w8030079
APA StyleSammer, M., Kamp, C., Paulitsch-Fuchs, A. H., Wexler, A. D., Buisman, C. J. N., & Fuchs, E. C. (2016). Strong Gradients in Weak Magnetic Fields Induce DOLLOP Formation in Tap Water. Water, 8(3), 79. https://doi.org/10.3390/w8030079


