Abstract
Food security, specifically in water scarce regions, is an increasing local and global challenge. Finding new ways to increase agricultural production in a sustainable manner is required. The current study suggests a conceptual model to integrate established recirculating aquaculture practices into a near-zero discharge aquaponic system that efficiently utilizes water, excreted nutrients and organic matter for energy. The suggested model allows to significantly extend the planted area and recover energy in the form of biogas to operate the system off-grid. A mass balance model of nitrogen, carbon and energy was established and solved, based on data from the literature. Results demonstrate that a fish standing stock of about 700 kg would produce 3.4 tons of fish annually and enough nutrients to grow about 35 tons of tomatoes per year (chosen as a model plant) and recover sufficient energy (70 kWh/day) to run the system on biogas and use less water. If proven successful, this approach may play a major role in sustainably enhancing food security in rural and water scarce regions.
1. Introduction
The discrepancy between the predicted global demand for food and the existence (or lack thereof) of renewable resources for food production will require innovations in sustainable agricultural methods [1]. Existing conventional monoculture systems for food production need to be assessed for their potential to accommodate a variety of multi-trophic solutions that are being developed globally for both freshwater and marine aquaculture [2–5]. Aquaponics integrates conventional aquaculture with hydroponics in a symbiotic arrangement and addresses resource and environmental issues, showing extremely high production efficiency when compared to traditional agriculture in the use of water [6] nutrients [7], and yield per unit area with limited outflow of pollutants [8,9].
The advantages of advancing aquaponics research and subsequent production of vegetables and fish, thus offering an alternative to present monoculture are:
- Water usage—Aquaponic systems are nearly closed systems with some water loss through evapotranspiration [10]. When the aquaponic system is operationally balanced, little water exchange is required to maintain water quality that is conducive for the growth of both fish and vegetables. Thus, the overall volume of water to produce a combined biomass of fish and vegetables [11,12] is significantly reduced when compared to conventional agriculture [13].
- Fertilizer usage—None, or only limited micronutrient fertilizers, are required to produce the vegetables in aquaponics as nearly all the nutrients are available in the water from the waste of the fish production unit [14,15].
- Use of organic practices—The production is a priori organic, as chemical treatments are often designed for monoculture systems and are frequently toxic to either the fish or the plants. Therefore, the aquaponics grower is encouraged to use integrated pest management (mainly biological or natural controls) [16]. It should be noted that the while the fish can be organically grown, use of hydroponics (soilless substrate), does not comply with organic practice regulation for vegetable growth [17].
- Land usage—Aquaponics does not require fertile land and can be performed in deserts or even in urban areas [18].
- Smallholder welfare—The smallholder farmer population is the poorest sector worldwide. They are a significant percentage of the population in developing economies and the highest percentage with deficiency malnutrition, mainly resulting from a lack of vitamins and protein in their diet, with subsequent high infant mortality rates [19,20]. Typically, smallholder farms are not larger than two hectares [19]. Small aquaponic units such as the one described in this model fit this definition and could potentially alleviate the issue of malnutrition “in-house”.
Modern aquaponics and aquaculture were formed at the same time in the 1960s and several designs for these systems have been suggested since [21]. Basic aquaponic systems consist of four major components (Figure 1), through which the water is recirculated:
- (1)
- Fish biomass converter—The tanks where fish are grown. These need to be designed to allow for the removal of as much fish waste as possible, directly from the tanks into the solids filter [22].
- (2)
- Fish waste processor—A solids filter used for the removal of suspended solids from the water that mainly consists of fish excretions and a small portion (typically <5%) of uneaten feed [23,24].
- (3)
- Aerobic converter—A bio-filter unit used to oxidize toxic ammonia secreted by the fish to less toxic nitrate, thus allowing recycling of the system water without continuous replacement [25].
- (4)
- Phototrophic (plant biomass) converter—Plant beds which use the largest area of the system. Plants are grown to produce vegetables while removing essential nutrients (e.g., nitrogen and phosphorus) through assimilation to plant biomass, thus stabilizing the water quality for the fish [12,15].
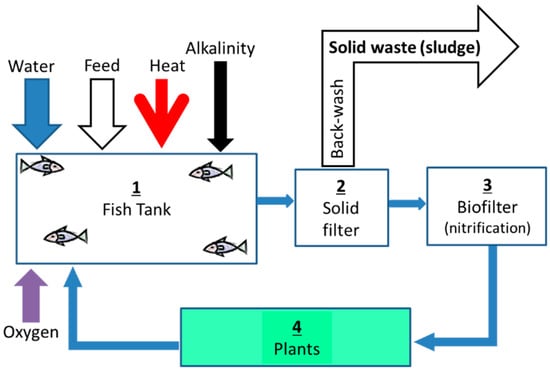
Figure 1.
Schematic Aquaponic systems.
When examining the fate of nutrients and carbon supplied from fish feed in aquaculture systems, it appears that about 25% is assimilated as fish biomass [26,27,28]. Roughly 35% is excreted by the fish as total ammonia nitrogen (TAN) [29], which is then oxidized in the aerobic bio-filter and potentially available to plants, and the remaining 40% is discharged as “sludge” from the system [27,30]. This highlights the issue of “organic matter separation” in aquaponic systems, which requires continuous removal and treatment (or it might otherwise pollute or increase costs). To date solid fish waste has ultimately been either applied to field crops, composted or discharged to natural waters with or without treatment [31]. Thus, wasting the sludge in conventional aquaponic systems results in losing about a half of the available input nutrients that theoretically could be used for plant biomass production. Several recent suggestions to recycle nutrients from this waste have been made [32,33,34], but information is still limited, thus hindering the aquaponic system from becoming a mainstream agricultural method.
The majority of aquaponic systems require a constant and reliable source of energy for continuous operation of their pump/s and aeration, and it should be noted that this issue has largely been neglected in reviewable literature. Aside from its cost, the system’s energy demand restricts the use of this farming method in many areas where food security issues related to water, land, energy and climate change mitigation are critical. In many such rural places there is limited, unreliable or no traditional power grid at all.
The aim of the current study is to suggest a conceptual model that demonstrates a closed three-loop aquaponic system with near-zero water discharge, recovery of the system’s waste as energy (e.g., biogas) for off-grid operation, and reclaims nearly all nitrogen to allow for significant expansion of the vegetable crops in comparison with typical aquaponic systems.
2. Materials and Methods
A recent quantitative description of a near-zero exchange Recirculating Aquaculture System (RAS) with energy recovery composing a fish tank, a solid filter, nitrification, denitrification and upflow anaerobic sludge blanket (UASB) reactor [27], was used as the skeleton for the design of the suggested aquaponic system (Figure 2).
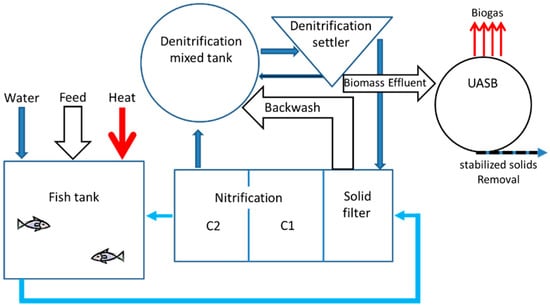
Figure 2.
Scheme of three treatment loops recirculating aquatic system (RAS) including biofilter (nitrification), nitrogen removal unit (denitrification), and anaerobic digester for biogas production (After [27]).
In the suggested aquaponic model, there are three major modifications (Figure 3):
- (1)
- Introduction of an aerated plant bed (instead of the denitrification reactor) for removal of nitrogen and enhanced plant growth. The model plant used in this model is tomato (Lycopersicon esculentum) and the model fish used is tilapia (Oreochromis sp.), as it represents the fish most commonly cultured in aquaponic systems [12,21].
- (2)
- Conversion of the fish sludge and inedible plant biomass (e.g., stalks and roots) into methane rich biogas in two separate anaerobic digesters.
- (3)
- Introduction of a rich effluent of fish sludge from the anaerobic digester into the vegetable “hydroponic reactor”. Improvements in plant growth using anaerobic digestion effluent was demonstrated previously (e.g., [32]). Therefore, in this model effluents from the UASB were assumed to improve plant growth according to their nitrogen flux. This will also enable some control of the TAN:NO3− ratio allowing for optimal plant growth and nutrient uptake from the fish waste by the plants.
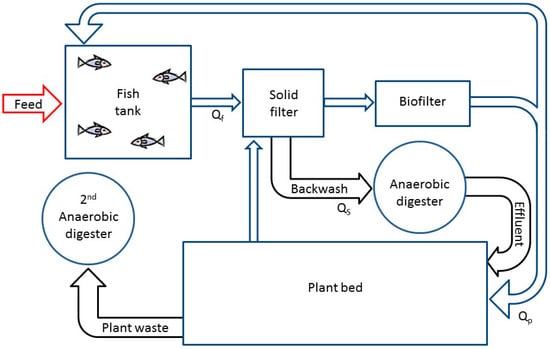
Figure 3.
Scheme of the suggested three treatment loops aquaponic system model. The first loop includes a fish tank, a solid filter and an aerobic biofilter. The second loop is the plant growing unit. The third loop consists of two anaerobic digesters, one for fish sludge digestion and the second for uneaten plant biomass. Each one of the treatment loops operates under different recirculation rates and therefore different retention times. Qf is the water flux in the first loop, Qs is the sludge flux removed from the solid filter and Qp is the water flux from the biofilter into the plant bed.
Nitrogen, carbon and energy mass balance equations were established [35] for the suggested system, using constants/coefficients from relevant literature (Table 1). The two main assumptions made in the model were that the system operates in a steady state (i.e., no accumulation of nutrients) and that fish feed is the only input of nutrients.

Table 1.
Constants and parameters used in the model.
2.1. Theory and Rational
The rationale for the suggested system is based on the notion that in an aquaponic system fish feed is virtually the only nutrient source continually being put into the system. Since the fate of fish feed in RAS has been well quantified [27,30,45,54,55], the fate of nutrients, solids, and carbonaceous wastes resulting from feed application in RAS can be predicted [56]. Similarly, the water balance is also quantifiable, so the potential availability of all components in the water and the solid phases can be derived [56]. In other words, the potential available nutrients, carbon and energy can be calculated. Optimization of the system design can enhance the availability of nutrients and carbon as well as increase the expected yield and production as summarized below.
2.1.1. Nitrogen, Carbon and Energy Balance
Efficient recovery of nitrogen in the suggested system is expected via: (a) aeration of the plant root environment and consequently minimization of nitrogen losses by denitrification; and (b) by recovery of organic nitrogen from the fish solid waste after its biodegradation to TAN in the anaerobic digester. Through the anaerobic digestion process organic carbon is converted to biogas so energy can be recovered. Additionally, more biogas is expected to be generated by anaerobic digestion of the inedible plant biomass. Another expected benefit of onsite waste treatment relates to minimizing the need for usually expensive offsite treatment. The model assumes that there is a direct correlation between the amount of applied feed and waste produced; and consequently the amount of energy created by biogas production. By upscaling the system size, it is expected to reduce the energy demand per kg of fish produced. This is due to technological advances in recirculating pumps and blowers, where increasing size is related to increased efficiency.
2.1.2. Yield and Production
Combination of an adequate design of the various treatment functions of the RAS (e.g., solid, nitrification, and anaerobic reactors) and improved recovery of nutrients will allow for intensive fish growth (currently designed for 50 kg/m3) and enhanced plant growth. The latter is expected not only because of the higher availability of nutrients and specifically nitrogen, but also because there is an ability to adjust the TAN:NO3− ratio which can significantly improve plant production [52].
3. Results and Discussion
Based on this rational (Section 2.1), the system design was aimed to “utilize” these resources so as to optimize fish performance (i.e., maintaining low toxic ammonia concentrations in the rearing tank), optimize plant production by efficiently recovering nutrients as well as minimizing water and energy use. It should be noted, that in conventional aquaponic systems phosphorus (P) has been found to be a limiting growth factor [57] due to the loss of P into solid complexes, which can reach up to 85% of the feed-P [55], consequently reducing P availability to plants. Yet, the use of an anaerobic reactor (in the suggested system) is expected to increase P availability [58]. Considering the P mass balance, it was postulated that P is not a limiting factor in the suggested system, and therefore it is not discussed further.
3.1. Nitrogen Balance
The nitrogen cycle is a major factor in fish performance (growth rate and survival) as it dictates the presence and concentrations of the various nitrogenous forms including toxic ammonia, toxic nitrite, less-toxic nitrate; and their influence on fish physiology and disease [56]. Nitrogen is also a major limiting factor for plant growth and its availability in its different forms determines the predicted plant biomass, which in turn dictates the proportion of the physical area of the aquaponic system dedicated to plant growth. Moreover, controlling the nitrogen cycle will involve appropriate reactor sizing and water recirculation.
Feed is the exclusive source of nitrogen in the aquaponic system. It is partially assimilated as fish biomass, while the rest is excreted by the fish to the water as dissolved or particulate organic matter. Nitrogen balance in the system can be described by Equation (1):
where V is the fish tank volume, N is the dissolved nitrogen concentration in the fish tank, RFeed is the feeding rate, MFish is the total fish biomass, NFeed is the nitrogen concentration in fish feed, RGrowth is the specific fish growth rate, NFish is the nitrogen concentration in fish biomass, YAnaerobic digestion is the anaerobic bacteria yield, Qs is sludge flow rate into the anaerobic digestion, NSludge is the nitrogen concentration in fish sludge collected in the solid filter, NARPlants is nitrogen assimilation rate by the plants, NDRDenitrification is the nitrogen removal rate through denitrification in the anoxic micro-environments in the system, and NARMicrobial biomass is the nitrogen assimilation rate in the microbial biomass growth in the system.
After establishment of the microbial communities in the bioreactors, it is assumed that the system is operating at a steady state (Equation (2)).
Assuming complete nitrogen assimilation by plants (a design parameter which is determined by plant biomass and the water recirculation rate), the nitrogen assimilation rate by the plants (NARPlants) can be defined as (Equation (3)):
The N flux through the fish feed (RNFeed) can be described by Equation (4) as follows:
As well as N flux into the fish biomass (RNFish) (Equation (5)):
Therefore, Equation (1) can be simplified (Equation (6)) to:
NFeed is a function of the feed protein concentration (Equation (7)), which contains on average about 16% N:
RNFish is a function of the fish biomass, the ratio between feeding rate to fish growth rate, and the nitrogen concentration in the fish. When the feeding rate is optimized for fish growth, the N assimilation rate into fish can be simplified and determined as a function of the applied feed (Equation (8)):
NSludge is a function of the solid filtration efficiency (SFE) as described in Equation (9):
NDRDenitrification is a function of NO3− and dissolved oxygen concentrations, and follows Monod kinetics [59], which can be simplified under the system’s operational conditions to first order kinetics (Equation (10)). In order to maintain an adequate environment for fish growth, the water is well aerated and virtually all of the dissolved N in the water is found in the form of NO3−.
Due to high aeration in the system, denitrification is expected to occur mainly when NO3−-rich water flows through the solid filter that contains at times (e.g., before backwash) a high organic solid concentration and consequently high oxygen demand which might create anoxic micro-environments [60,61]. Introducing the constants presented in Table 1, the nitrogen assimilation rate by the plants (NARPlants) was calculated and found to be 55% of the daily applied N in the feed. Of the 55%, about 45% is available as NO3−-N derived from the N in the water, where the remaining 55% is in the form of TAN resulting from the biodegradation of the fish sludge in the anaerobic digester. Successful control of the TAN:NO3− ratio (~1 for tomatoes) can significantly improve plant growth and specifically can increase tomato growth (the model plant used) by up to 40%, as well as enhance fruit flavor in hydroponic systems when compared with fertilization with TAN or NO3− alone [52]. It should be noted that this ratio may change between plants, but can be controlled by manipulation of the flow from the nitrification bioreactor to the plant bed as well as from the anaerobic digester to the plant bed.
3.2. Carbon Balance
There are three major sources of organic carbon in the aquaponic system: fish feed, plant material (photoautotrophic fixation), and carbon fixation by autotrophic bacteria that are mainly in the nitrification bioreactor. Most of the carbon fixed by the plant is in a solid form (i.e., plant material): roots, shoots, leaves and fruits. The small fraction excreted by the plant roots [49] can be assumed to be oxidized in the rhizosphere, especially since the root environment is aerated and thus aerobic. In the nitrification biofilter, the overall carbon balance is negative as reflected by BOD removal [25] and therefore it can be considered that all fixed carbon is oxidized in the microbial film of the reactor, meaning zero net carbon contribution. Effectively, fish feed-carbon (CFeed) is the only source of organic carbon in the aqueous phase of the system. An additional C source is inedible plant biomass, which is dealt with separately below, see Equations (18)–(21). Carbon balance in the system aqueous phase can be described by Equation (11):
where C is the organic carbon concentration in the system, CFish mass is the carbon concentration in the fish biomass, CERFish is the carbon excretion rate as CO2 by the fish, the two latter are both essential for fish growth, CORAerobic is the carbon oxidation rate in the biofilter, CSludge is the carbon concentration in the sludge that is backwashed from the solid filter, CRRDenitrification is the carbon removal rate during passive denitrification in the system, and CARMicrobial biomass is the carbon assimilating rate in the microbial biomass growth in the system.
After establishment of the microbial communities in the bioreactors, we can assume that the system is operating under steady state (Equation (12)).
The C flux through feed (RCFeed) can be described by Equation (13) as follows:
As well as C flux into fish biomass (RCFish) as demonstrated in Equation (14):
Therefore, Equation (11) can be simplified to Equation (15):
Since the molar ratio between C and N for the denitrification process is approximately 1:1 [62], CRRDenitrification (carbon removal rate) can be described as follows (Equation (16)) and the overall C balance in the water is described in Equation (17).
Solving Equation (17) using the constants in Table 1 suggest that the amount of C in the sludge accounts for 40% of the applied C in the feed. This calculation also coincides with previous observations and estimates [24,25]:
The carbon fixation rate CFRPlant photosynthesis and yield of the plants (tomatoes in this model) were estimated by the reported C/N ratio in tomato plants [42] and the reported N assimilation rate (Equations (3) and (6)).
Knowing that N availability to plants is approximately 57% of the N in the feed (see N balance), the CFRPlant photosynthesis can be estimated as 180% of C in feed (Equations (6) and (19)).
The C in the tomato plants can be further divided into C in the edible (fruit) and non edible parts such as the roots, stems and leaves (Equation (21)). The latter is of interest as it can be further utilized, like the CSludge, for anaerobic digestion and provide a source of energy to run the system (Equation (22)).
Overall, the actual carbon available for energy recovery (Effective CAnaerobic digestion) can be calculated (Equation (23)):
Consequently, it is estimated that the effective total available C for anaerobic digestion is approximately the same amount of C supplied in the fish feed (1.01 × CFeed). A summary of the N and C transformations and balance is depicted in Figure 4.
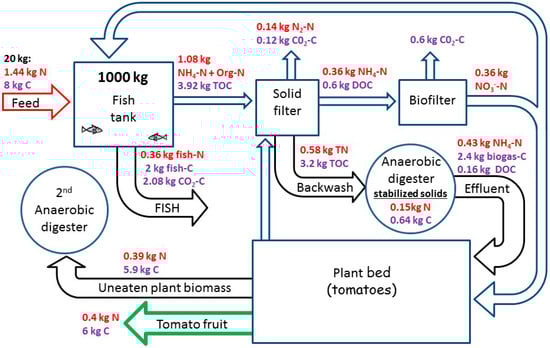
Figure 4.
Predicted mass balance for carbon and nitrogen in the suggested model aquaponic system in a steady state condition. Based on the model results, 10% N is lost (mainly by passive denitrification) and the remaining 90% is recovered as fish and plant biomass.
3.3. Yield and Production
Fish production was predicted using the feeding rate and the fish feed conversion ratio (FCR), (Equation (24)).
Fruit/plant production (ΔMPlants) is was predicted using the nitrogen and water content (%N and %W respectively):
For example, analysis of the model results for a fish standing stock of 1000 kg, predict annual fish production of 4.8 tons and 51 tons of tomatoes (Plant to fish ratio of ~10). Interestingly, this prediction is significantly higher than that observed during production of plants in “traditional“ aquaponic systems which typically report a plant to fish ratio of ~2 [11,12,63]. Four main reasons might be able to explain this discrepancy: (1) a significant reduction in nitrogen loss via denitrification due to improved solids removal and aeration of the plant bed; (2) a higher flux (load and concentration) of nutrients due to mineralization in the anaerobic digester; (3) a significant increase in plant productivity by controlling the TAN:NO3− ratio (species dependent); and (4) increasing plant productivity (by 39% on average) by stimulating compounds that may be found in the fish tank water [64].
3.4. Energy Balance
A system energy balance was conducted to understand the potential energy saving possible through introduction of anaerobic digestion for biogas production as well as testing the possibility to run the system off-grid.
Energy in the aquaponic system is needed to supply oxygen to the water to sustain fish, plants and reactors, as well as to circulate the water between the various reactors. There are numerous means to circulate water and supply oxygen. For each of system dimension tested, a high efficiency commercial pump and blower were chosen based on their published specification sheets. For the purpose of the 1000 kg fish standing stock example (mentioned above), a high-efficiency pump (Sweetwater SHE 2.9, Pentair Aquatic Ecosystems Inc., Apopka, FL, USA) and blower (SV-201, Becker Corp., Cuyahoga Falls, OH, USA) were used. The major oxygen consumers in the system are: fish, plants, microorganisms and the nitrification process. The latter was described by Equation (25) and solved using a differential equation solver in Polymath software (version 6.2). For the purposes of the model we allowed maximum TAN concentration of 3 mg/L. It was also assumed that initially all dissolved nitrogen was released as TAN into the water, meaning the potential TAN concentration (pTAN) in the water is equal to the applied N minus the fraction that is recovered by the fish or removed in the sludge (Equation (26)).
The resulting TAN is transformed via two major paths; nitrification and direct assimilation by the plants. (Equation (27)).
Aeration rate (AR) required for the nitrification of the biofilter, plants bed, and fish tank was estimated as follows (Equations (28)–(30)).
It should be noted that during nitrification, two moles of oxygen are required to oxidize one mole of TAN to NO3− and that the percent O2 in the atmosphere is approximately 20%. Based on the ideal gas equation, a volumetric approximation of 25 L per one mole of gas was used. Finally, an oxygen transfer efficiency (OTE) of 30% was used in the model, which is typical for a standard diffuser [51].
Plant bed aeration is used to oxidize root carbon excretions, ensuring an aerobic environment which minimizes N losses via denitrification (Equation (29)).
Lastly, AR needed for fish respiration and aerobic biodegradation was estimated (Equation (30)).
In summary, the overall AR needed to maintain aerobic conditions in the system is equal to the sum of the three consumers and is approximately 13 m3 air/kgfeed·h.
Lastly, the difference (ΔE) between the system energy demand (EDemand) as estimated for specific water and air flow rates as well as potential energy produced via anaerobic digestion (EBiogas) under the same conditions were estimated (Equation (31)), and then plotted (Figure 5). As suggested, the demand was based on specification sheets of a common air blower and high-efficiency pump.
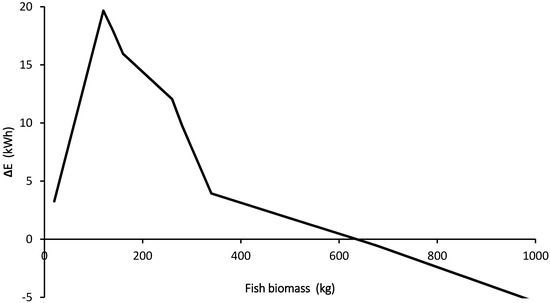
Figure 5.
The effect of fish biomass on the differences between the aquaponic system energy demand and production (ΔE). Negative (ΔE) represents energy gain.
Interestingly, many commercial aquaponic farmers have annual production of less than one ton, which is equivalent to a standing stock of about 200 kg of fish. According to estimations in the model this regime is not energy efficient and may be one reason for aquaponics being less economical than traditional growing methods. Since the biogas production is linearly correlated to annual fish production (i.e., feed load), reduction of ΔE is possible only due to reducing the specific energy demand of the system (e.g., pumps and blowers). To illustrate this point, a water pump with a power of 24 W would be needed to circulate 1 m3/h whereas the power needed to circulate 17 m3/h is only 220 W [56].
Based on the model, an energetically favorable system would be possible for a standing stock greater than about 700 kg, which is equivalent to an annual fish production of ~3.4 tones and ~35 tons of tomatoes. Such an operation would require about 15 m3 fish tanks and 0.5 ha land for the plant bed. According to Love et al. [65], only 5% of the commercial aquaponic systems are equal or larger than this one. Yet the area required for this production, would fall well within the defined area for a smallholder farm of 1–2 ha [19].
4. Conclusions
The proposed hybridization of the aquaponic system and anaerobic digestion technologies into a closed aquaponic system is promising. It has the potential to overcome existing shortcomings related to commonly used techniques in aquaponics and emerging economies. If refined into an operational farming unit, this system could produce a high quality, continuously available, and fresh source of protein and vitamins in an off-grid setting. The absence of an electricity grid and low grid reliability often correlate with desert communities as well as other regions challenged by climate and remoteness. It is these places where aquaponics has the potential to have a high impact on food security and could possibly provide relief from protein and vitamin malnutrition.
The importance of this “off-grid” model is three-fold, as it predicts (based on a mathematical mass balance model, which utilizes published information and constants):
- (1)
- an efficient water and nutrients reuse in a way that significantly increases vegetable production per unit of produced fish as well as reduces potential pollution associated with aquaponics;
- (2)
- under certain scenarios, the amount of waste produced from the aquaponic system, which if efficiently utilized, can potentially supply (via biogas) the energetic demands to run the system off-grid. This may be a “game changer” with regards to the applicability of these systems in rural areas;
- (3)
- what is likely the first quantitative model that aims to describe the N, C, and energy cycles in aquaponic systems and can be used as a benchmark for such studies.
It should be noted that numerous variables may affect the model. For example, growing fish such as catfish (e.g., Clarius sp. and Pangasius sp.), which are air breathers, would reduce the system’s energy requirements, so possibly smaller units may support off-grid operation, whereas using plants such as lettuce that have a smaller fraction of inedible parts would affect the model results negatively and an additional external energy source may be needed.
The promise of an “off-grid aquaponics unit” for smallholder farmers in emerging economies needs to be one of the key motivations for future aquaponics research. To reiterate, this food production technology will supplement both the variety and nutritional value of the producer’s own diet as well as contribute to overall farm output. Ways to introduce such agricultural technologies to smallholder family units, their economics, and the quantitative effect on their nutritional wellbeing should also be assessed so their holistic importance can be fully understood. Further experimental and commercial production studies will be needed to understand the potential of and to implement off-grid aquaponics.
Acknowledgments
This research was partially funded by ICA foundation, Koshland foundation, the British council and the Israeli Ministry of Science, Technology and Space.
Author Contributions
Adrian Barnes suggested the research topic and provided the first draft, Uri Yogev developed the mathematical model and advanced the writing of the final manuscript and Amit Gross suggested the paper frame and overall editing. All co-authors contributed to complete and improve the text of the manuscript.
Conflicts of Interest
The authors declare no conflict of interest.
Abbreviations
| RFeed | feeding rate |
| ΔMFish | fish mass produced over time |
| ΔMPlants | plant mass produced over time |
| AR | aeration rate |
| BOD | biochemical oxygen demand |
| C | organic carbon concentration in the system |
| CARAnaerobic digestion | carbon available for anaerobic degradation for energy recovery |
| CARMicrobial biomass | carbon assimilating rate in the microbial biomass |
| CERFish | carbon excretion rate as CO2 by the fish |
| CFeed | carbon concentration in fish feed |
| CFish mass | carbon concentration in the fish biomass |
| CFRPlant photosynthesis | plants carbon fixation rate |
| CMW | carbon molecular weight |
| CORAerobic | carbon oxidation rate in the biofilter |
| CRRDenitrification | carbon removal rate during passive denitrification in the system |
| CSludge | carbon concentration in the sludge |
| EBiogas | energy produced via anaerobic digestion |
| EDemand | system energy demand |
| fNitrification | specific nitrification rate factor |
| MFish | total fish biomass |
| N | dissolved nitrogen concentration in the fish tank |
| NARMicrobial biomass | nitrogen assimilation rate in the microbial biomass |
| NARPlants | nitrogen assimilation rate by the plants |
| NDRDenitrification | nitrogen removal rate through denitrification in the anoxic micro-environments in the system |
| NFeed | nitrogen concentration in fish feed |
| NFish | nitrogen concentration in fish biomass |
| NMW | nitrogen molecular weight |
| NSludge | nitrogen concentration in fish sludge collected in the solid filter |
| P | phosphorus |
| Ptan | potential TAN concentration |
| Qs | sludge flow rate into the anaerobic digestion |
| RAS | recirculating aquaculture systems |
| RCFeed | carbon flux through feed |
| RCFish | carbon flux into fish biomass |
| RGrowth | specific fish growth rate |
| RNFeed | nitrogen flux through the fish feed |
| RNFish | nitrogen flux into fish biomass |
| TAN | total ammonia nitrogen |
| UASB | upflow anaerobic sludge blanket |
| V | fish tank volume |
| YAnaerobic digestion | anaerobic bacteria yield |
References
- Tilman, D.; Balzer, C.; Hill, J.; Befort, B.L. Global food demand and the sustainable intensification of agriculture. Proc. Natl. Acad. Sci. USA 2011, 108, 20260–20264. [Google Scholar] [CrossRef] [PubMed]
- Chopin, T.; Robinson, S.M.C.; Troell, M.; Neori, A.; Buschmann, A.H.; Fang, J. Multitrophic Integration for Sustainable Marine Aquaculture. In Ecological Engineering; Jørgensen, D.E., Fath, B.D., Eds.; Academic Press: Oxford, UK, 2008; pp. 2463–2475. [Google Scholar]
- Bunting, S.W.; Shpigel, M. Evaluating the economic potential of horizontally integrated land-based marine aquaculture. Aquaculture 2009, 294, 43–51. [Google Scholar] [CrossRef]
- Gelfand, I.; Barak, Y.; Even-Chen, Z.; Cytryn, E.; van Rijn, J.; Krom, M.D. A novel zero discharge intensive Seawater recirculating system for the culture of marine fish. J. World Aquac. Soc. 2003, 34, 344–358. [Google Scholar] [CrossRef]
- Nobre, A.M.; Robertson-Andersson, D.; Neori, A.; Sankar, K. Ecological–economic assessment of aquaculture options: Comparison between abalone monoculture and integrated multi-trophic aquaculture of abalone and seaweeds. Aquaculture 2010, 306, 116–126. [Google Scholar] [CrossRef]
- Mcmurtry, M.R.; Sanders, D.C.; Cure, J.D.; Hudson, R.G.; Haning, B.C.; Amand, P.C.S. Efficiency of water use of an integrated fish/vegetable co-culture system. J. World Aquac. Soc. 1997, 28, 420–428. [Google Scholar] [CrossRef]
- Seawright, D.E.; Stickney, R.R.; Walker, R.B. Nutrient dynamics in integrated aquaculture-hydroponics systems. Aquaculture 1998, 160, 215–237. [Google Scholar] [CrossRef]
- Edwards, P. Environmental issues in integrated agriculture-aquaculture and wastewater-fed culture systems. In Environment and Aquaculture in Developing Countries; Pullin, R.S.V., Rosenthal, H., Maclean, J.L., Eds.; ICLARM: Manila, Philippines, 1993; pp. 139–170. [Google Scholar]
- Food and Agriculture Organization of the United Nations (FAO). Small-Scale Aquaponic Food Production; FAO: Rome, Italy, 2014. [Google Scholar]
- Jensen, M.H. Controlled environment agriculture in deserts, tropics and temperate regions—A world review. Acta Hortic. 2002, 578, 19–25. [Google Scholar] [CrossRef]
- Resources, N. Food Production and Water Conservation in a Recirculating Aquaponic System in Saudi Arabia at Different Ratios of Fish Feed to Plants. J. World Aquac. Soc. 2008, 39, 510–520. [Google Scholar]
- Rakocy, J.E.; Masser, M.P.; Losordo, T.M. Recirculating Aquaculture Tank Production Systems: Aquaponics-Integrating Fish and Plant Culture; SRAC Publication No. 454; South Regional Aquaculture Center: Stoneville, MS, USA, 2006; pp. 1–16. [Google Scholar]
- Effendi, H.; Utomo, B.A.; Darmawangsa, G.M.; Sulaeman, N. Combination of water spinach (Ipomea aquatica) and bacteria for freshwater cryfish red claw (Cherax quadricarinatus) culture wastewater treatment in aquaponic system. J. Adv. Chem. 2015, 6, 1072–1078. [Google Scholar]
- Goddek, S.; Delaide, B.; Mankasingh, U.; Ragnarsdottir, K.V.; Jijakli, H.; Thorarinsdottir, R. Challenges of sustainable and commercial aquaponics. Sustainability 2015, 7, 4199–4224. [Google Scholar] [CrossRef]
- Graber, A.; Junge, R. Aquaponic Systems: Nutrient recycling from fish wastewater by vegetable production. Desalination 2009, 246, 147–156. [Google Scholar] [CrossRef]
- Bernstein, S. Aquaponic Gardening: A Step-by-Step Guide to Raising Vegetables and Fish Together; New Society Publishers: Gabriola Island, BC, Canada, 2011. [Google Scholar]
- International Foundation for Organic Agriculture (IFOAM). Basic Standards for Organic Production and Processing (IFOAM); Technology Analysis & Strategic Management: Victoria, BC, Canada, 2006. [Google Scholar]
- Rothwell, A.; Ridoutt, B.; Page, G.; Bellotti, W. Feeding and housing the urban population: Environmental impacts at the peri-urban interface under different land-use scenarios. Land Use Policy 2015, 48, 377–388. [Google Scholar] [CrossRef]
- Tinsley, R.L. Developing Smallholder Agriculture: A Global Perspective; AgBe Publications: Brussels, Belgium, 2004; p. 585. [Google Scholar]
- Fanzo, J. The Nutrition Challenge in Sub-Saharan Africa; WP 2012-012; United Nations Development Programme, Regional Bureau for Africa: New York, NY, USA, 2012. [Google Scholar]
- Love, D.C.; Fry, J.P.; Genello, L.; Hill, E.S.; Frederick, J.A.; Li, X. An international survey of aquaponics practitioners. PLoS ONE 2014, 9, e102662. [Google Scholar] [CrossRef] [PubMed]
- Klapsis, A.; Burley, R. Flow Distribution Studies in Fish Rearing Tanks. Part 1—Design Constraints. Aquac. Eng. 1984, 3, 103–118. [Google Scholar] [CrossRef]
- Pfeiffer, T.J.; Osborn, A.; Davis, M. Particle sieve analysis for determining solids removal efficiency of water treatment components in a recirculating aquaculture system. Aquac. Eng. 2008, 39, 24–29. [Google Scholar] [CrossRef]
- Cripps, S.J.; Bergheim, A. Solids management and removal for intensive land-based aquaculture production systems. Aquac. Eng. 2000, 22, 33–56. [Google Scholar] [CrossRef]
- Van Rijn, J. The potential for integrated biological treatment systems in recirculating fish culture—A review. Aquaculture 1996, 139, 181–201. [Google Scholar] [CrossRef]
- Boyd, C.E. Overview of aquaculture feeds: Global impacts of ingredient use. In Feed and Feeding Practices in Aquaculture, 1st ed.; Davis, D.A., Ed.; Woodhead Publishing: Cambridge/London, UK, 2015; pp. 3–25. [Google Scholar]
- Yogev, U.; Sowers, K.R.; Mozes, N.; Gross, A. Nitrogen and carbon balance in a novel near-zero water exchange saline recirculating aquaculture system. Aquaculture 2017, 467, 118–126. [Google Scholar] [CrossRef]
- Neori, A.; Krom, M.D.; van Rijn, J. Biogeochemical processes in intensive zero-effluent marine fish culture with recirculating aerobic and anaerobic biofilters. J. Exp. Mar. Biol. Ecol. 2007, 349, 235–247. [Google Scholar] [CrossRef]
- Yuen, K.I.; Chew, S.F. Ammonia production, excretion, toxicity, and defense in fish: A review. Front. Physiol. 2010, 1, 1–20. [Google Scholar]
- Heinsbroek, L.T.N.; Kamstra, A. Design and performance of water recirculation systems for eel culture. Aquac. Eng. 1990, 9, 187–207. [Google Scholar] [CrossRef]
- Summerfelt, S.T.; Adler, P.R.; Glenn, D.M.; Kretschmann, R.N. Aquaculture sludge removal and stabilization within created wetlands. Aquac. Eng. 1999, 19, 81–92. [Google Scholar] [CrossRef]
- Goddek, S.; Schmautz, Z.; Scott, B.; Delaide, B.; Keesman, K.; Wuertz, S. The Effect of Anaerobic and Aerobic Fish Sludge Supernatant on Hydroponic Lettuce. Agronomy 2016, 6, 37. [Google Scholar] [CrossRef]
- Rakocy, J.E.; Bailey, D.S.; Shultz, R.C.; Danaher, J.J. Preliminary Evaluation of Organic Waste from Two Aquaculture Systems as a Source of Inorganic Nutrients for Hydroponics. In Proceeding of the International Conference and Exhibition on Soiless Culture, Singapore, 5 September 2005; International Society for Horticultural Science: Leuven, Belgium, 2007; pp. 201–208. [Google Scholar]
- Nelson, R.L.; Pade, J.S. High-Production, Minimal-Discharge Aquaponic Systems and Methods. U.S. Patent 8,677,686 B1, 25 March 2014. [Google Scholar]
- Kandiyoti, R. Fundamentals of Reaction Engineering; Refael Kandiyoti and Ventus Publishing ApS: Frederiksberg, Denmark, 2009; p. 112. ISBN 978-87-7681-510-3. Available online: www.bookboon.com (accessed on 12 January 2015).
- Islam, M.S. Nitrogen and phosphorus budget in coastal and marine cage aquaculture and impacts of effluent loading on ecosystem: Review and analysis towards model development. Mar. Pollut. Bull. 2005, 50, 48–61. [Google Scholar] [CrossRef] [PubMed]
- Gross, A.; Boyd, C.E.; Wood, C.W. Nitrogen transformations and balance in channel catfish ponds. Aquac. Eng. 2000, 24, 1–14. [Google Scholar] [CrossRef]
- Riche, M.; Garling, D. Feeding Tilapia in Intensive Recirculating Systems. Extension Fact Sheets, Paper 6. North Central Regional Aquaculture Center, 2003; p. 4. Available online: http://lib.dr.iastate.edu/ncrac_factsheets/6 (accessed on 1 September 2016).
- Chen, S.; Stechey, D.; Malone, R. Suspended solids control in recirculating aquaculture systems. In Aquaculture Water Reuse Systems: Engineering Design and Management; Timmons, M.B., Losordo, T.M., Eds.; Elsevier: Amsterdam, The Netherlands, 1994; pp. 61–100. [Google Scholar]
- Endut, A.; Jusoh, A.; Ali, N. Nitrogen budget and effluent nitrogen components in aquaponics recirculation system. Desalination Water Treat. 2014, 52, 744–752. [Google Scholar] [CrossRef]
- Zemach Feed Mill. Aquaculture Feed. 2016. Available online: http://www.zmf.co.il/ (accessed on 1 September 2016).
- Royer, M.; Larbat, R.; Le Bot, J.; Adamowicz, S.; Robin, C. Is the C:N ratio a reliable indicator of C allocation to primary and defence-related metabolisms in tomato? Phytochemistry 2013, 88, 25–33. [Google Scholar] [CrossRef] [PubMed]
- Gebauer, R.; Eikebrokk, B. Mesophilic anaerobic treatment of sludge from salmon smolt hatching. Bioresour. Technol. 2006, 97, 2389–2401. [Google Scholar] [CrossRef] [PubMed]
- Mirzoyan, N.; Ben-gurion, M.; Mcdonald, R.C. Anaerobic Treatment of Brackishwater Aquaculture Sludge: An Alternative to Waste Stabilization Ponds. J. World Aquac. Soc. 2012, 43, 238–248. [Google Scholar] [CrossRef]
- Tal, Y.; Schreier, H.; Sowers, K. Environmentally sustainable land-based marine aquaculture. Aquaculture 2009, 286, 28–35. [Google Scholar] [CrossRef]
- Greco, R.; Evangelou, A.; Komilis, D.; Calabr, P.S. Anaerobic digestion of tomato processing waste: Effect of alkaline pretreatment. J. Environ. Manag. 2015, 163, 49–52. [Google Scholar]
- Heuvelink, E. Growth, development and yield of a tomato crop: Periodic destructive measurements in a greenhouse. Sci. Hortic. 1995, 61, 77–99. [Google Scholar] [CrossRef]
- Demers, D.A.; Dorais, M.; Papadopoulos, A.P. Yield and russeting of greenhouse tomato as influenced by leaf-to-fruit ratio and relative humidity. Hortscience 2007, 42, 503–507. [Google Scholar]
- Bais, H.P.; Weir, T.L.; Perry, L.G.; Gilroy, S.; Vivanco, J.M. The role of root exudates in rhizosphere interactions with plants and other organisms. Annu. Rev. Plant Biol. 2006, 57, 233–266. [Google Scholar] [CrossRef] [PubMed]
- Sunggyu, L.; Speight, J.G.; Loyalka, S.K. Handbook of Alternative Fuel Technologies; CRC Press: Boca Raton, FL, USA, 2007. [Google Scholar]
- Wagner, M.R.; Popel, H.J. Oxygen transfer and aeration efficiency—Influence of diffuser submergence, diffuser density, and blower type. Water Sci. Technol. 1998, 38, 1–6. [Google Scholar] [CrossRef]
- Siddiqi, M.Y.; Malhotra, B.; Min, X.; Glass, A.D.M. Effects of ammonium and inorganic carbon enrichment on growth and yield of a hydroponic tomato crop. J. Plant Nutr. Soil Sci. 2002, 165, 191–197. [Google Scholar] [CrossRef]
- Mitchell, J.P.; Shennan, C.; Grattan, S.R.; May, D.M. Tomato fruit yields and quality under water deficit and salinity. J. Am. Soc. Hortic. Sci. 1991, 116, 215–221. [Google Scholar]
- Davidson, J.; Summerfelt, S.T. Solids removal from a coldwater recirculating system—Comparison of a swirl separator and a radial-flow settler. Aquac. Eng. 2005, 33, 47–61. [Google Scholar] [CrossRef]
- Van Rijn, J. Waste treatment in recirculating aquaculture systems. Aquac. Eng. 2013, 53, 49–56. [Google Scholar] [CrossRef]
- Timmons, M.B.; Ebeling, J.M. Recirculating Aquaculture, 2nd ed.; Northeastern Regional Aquaculture Center (NRAC) Publication: Ithaca, NY, USA, 2007. [Google Scholar]
- Jegatheesan, V.; Zeng, C.; Shu, L.; Manicom, C.; Steicke, C. Technological advances in aquaculture farms for minimal effluent discharge to oceans. J. Clean. Prod. 2007, 15, 1535–1544. [Google Scholar] [CrossRef]
- Suhr, K.I.; Letelier-Gordo, C.O.; Lund, I. Anaerobic digestion of solid waste in RAS: Effect of reactor type on the biochemical acidogenic potential (BAP) and assessment of the biochemical methane potential (BMP) by a batch assay. Aquac. Eng. 2015, 65, 65–71. [Google Scholar] [CrossRef]
- Christensen, M.H.; Harremoes, P. Biological denitrification of sewage—Literature review. Prog. Water Technol. 1977, 8, 509–555. [Google Scholar]
- Rakocy, J.E.; Bailey, D.S.; Martin, J.M.; Shultz, R.C. Tilapia production systems for the lesser antilles and other resource-limited tropical areas. In Tilapia Aquaculture in the 21st Century, Proceedings from the Fifth International Symposium on Tilapia in Aquaculture, Rio de Janeiro, Brazil, 3–7 September 2000; Fitzsimmons, K., Filho, J.C., Eds.; American Tilapia Association and DPA/MA: Rio de Janeiro, Brazil, 2000; pp. 651–662. [Google Scholar]
- Van Rijn, J.; Tal, Y.; Schreier, H.J. Denitrification in recirculating systems: Theory and applications. Aquac. Eng. 2006, 34, 364–376. [Google Scholar] [CrossRef]
- Hamlin, H.J.; Michaels, J.T.; Beaulaton, C.M.; Graham, W.F.; Dutt, W.; Steinbach, P. Comparing denitrification rates and carbon sources in commercial scale upflow denitrification biological filters in aquaculture. Aquac. Eng. 2008, 38, 79–92. [Google Scholar] [CrossRef]
- Endut, A.; Jusoh, A.; Ali, N.; Wan, N.W.B.; Hassan, A. A study on the optimal hydraulic loading rate and plant ratios in recirculation aquaponic system. Bioresour. Technol. 2010, 101, 1511–1517. [Google Scholar] [CrossRef] [PubMed]
- Delaide, B.; Goddek, S.; Gott, J.; Soyeurt, H.; Jijakli, H.M. Lettuce (Lactuca sativa L. var. Sucrine) growth performance in, complemented solution encourages the development of decoupled aquaponics. Water 2016, 8, 467. [Google Scholar] [CrossRef]
- Love, D.C.; Fry, J.P.; Li, X.; Hill, E.S.; Genello, L.; Semmens, K. Commercial aquaponics production and profitability: Findings from an international survey. Aquaculture 2015, 435, 67–74. [Google Scholar] [CrossRef]
© 2016 by the authors; licensee MDPI, Basel, Switzerland. This article is an open access article distributed under the terms and conditions of the Creative Commons Attribution (CC-BY) license (http://creativecommons.org/licenses/by/4.0/).