Article

Tomato Productivity and Quality in Aquaponics: Comparison of Three Hydroponic Methods

1
Institute of Natural Resource Sciences, Zurich University of Applied Sciences, Grüental, 8820 Wädenswil, Switzerland
2
Institute of Agricultural Sciences, ETH Zurich, Universitätsstrasse 2, 8092 Zurich, Switzerland
3
Faculty of Health Sciences, University of Ljubljana, Zdravstvena pot 5, 1000 Ljubljana, Slovenia
*
Authors to whom correspondence should be addressed.
Water 2016, 8(11), 533; https://doi.org/10.3390/w8110533
Submission received: 14 September 2016 / Revised: 5 November 2016 / Accepted: 9 November 2016 / Published: 16 November 2016
(This article belongs to the Special Issue Aquaponics: Toward a Sustainable Water-Based Production System?)

Abstract

:
Aquaponics (AP) is a food production system that combines hydroponic (HP) crop production with recirculating aquaculture. Different types of hydroponic systems have been used for growing crops in aquaponics. However, very few studies have compared their suitability and efficiency in an aquaponic context. The study presented here compares tomato yield, morphological (external) and biochemical (internal) fruit quality, and overall tomato plant vitality from three different HP systems (nutrient film technique, drip irrigation system, and floating raft culture) and examines the distribution of nutrients in different parts of the tomato plant. Three replicate AP systems were set up, each incorporating the three different HP systems coupled with a separate recirculating aquaculture unit growing Nile tilapia. The results showed that the choice of the cultivation system had little influence on most of the above-mentioned properties. Tomato fruit mineral content was found to be in similar range for N, P, K, Ca, Mg, Fe, and Zn as reported in the literature. Yield and fruit quality were similar in all three systems. However, the drip irrigation system did perform slightly better. The slightly higher oxygen radical absorbance capacity (ORAC) of the fruits grown in AP in comparison to commercially produced and supermarket derived tomatoes might indicate a potential for producing fruits with higher health value for humans.

1. Introduction

Due to the increasing demand for food and the need to save freshwater, food production efficiency must be increased. Currently, more than 70% of the world’s freshwater resources are used for agricultural purposes [1], increasing the need for improved water use efficiency and the recycling of water in semi- or closed production systems. Food provision has a significant impact on the environment through greenhouse gas emissions, depletion of phosphorus, use of land and water resources, and release of chemical products [2]. On the other hand, today more than 54% of the world’s population lives in urban areas. It is expected that the urbanization trend will increase to 66% of the global population by 2050 [3].
Urban agriculture can produce food locally, uses resources very efficiently and has a minimum negative impact on the environment [4]. Food producers not only face the challenge of supplying staple foods to meet caloric demand, but also the challenge of producing a wide variety of high quality foods with good nutritional properties. Therefore, it is important to find sustainable food production systems which can also be maintained within settlements or cities.
Aquaponics (AP) is one of the most promising sustainable systems for food production that combines hydroponic systems (HP) with recirculating aquaculture systems (RAS). It has the potential to play a major role in food provision and tackling global challenges such as water scarcity, food security, water pollution, high energy use and excessive food transport miles [5]. If AP is operated in a closed water loop, it has little environmental impact because the food is produced with low water consumption [6,7]. Plant production yields in AP have been reported to be higher than for crops grown in soil [8,9], however data are scarce. In AP, nutrients enter the system in the form of fish feed. The feed is ingested and metabolized by the fish. The remains of the feed and the metabolic products from the fish dissolve in the water creating an aquaculture effluent that provides most of the nutrients required for plant growth in a HP part of the system. Microorganisms in the biofilter, on plant roots, and in the recirculating water release and convert the nutrients (e.g., phosphates from the debris, and ammonium to nitrate) and the plants assimilate them, thus treating the water, which flows back to the aquaculture component of the system [5,8]. In AP, fish, plants, and bacteria coexist in the same water, albeit in different compartments of the system [10]. Different types of HP systems have been used for growing crops in AP: (i) drip irrigation; (ii) floating raft culture; (iii) gravel bed; and (iv) nutrient film technique (NFT) [5,6,7,8,11,12,13,14], however very few studies have compared different HP production systems in an AP context. The only paper we are aware of is by Lennard and Leonard [15] compares floating rafts, gravel beds, and NFT for growing lettuce in AP and found that NFT produced significantly less biomass and removed the nutrients from fish water less efficiently than the other two systems.
Generally, all plant species that can be adapted to growth in HP systems can also be grown in AP [16], meaning there is an extremely wide variety of choices. Savidov [17] reported growing over 60 different types of plant species in AP. Lettuce, specialty greens and herbs (chives, basil, spinach, and watercress) have low to medium nutritional requirements and are well adapted to AP [16]. Fruit yielding plants (tomato, bell pepper, cucumber, and squash) have a higher nutritional demand and perform better in heavily stocked AP systems. In indoor systems, the most commonly used tomatoes are greenhouse varieties which are better adapted than field cultivars to low light and high humidity conditions [16]. According to FAOstat [18], tomatoes are worldwide the second most important vegetable crop after potatoes. Tomatoes are rich in nutrients and vitamins which are associated with healthy food, i.e., carotenoids, flavonoids and lycopene [19,20]. Leaf nutrient concentrations can be used to detect the mineral nutritional status of the plants and thus might help to reveal differences in nutrient availability in different growing systems, whereas fruit nutrient content indicates the nutritional value for human consumption [21]. Graber and Junge [5] compared four varieties of tomatoes (Grapella, Rose of Berne, Frog King Golden Orb, and Sweet from Hungary) in AP, and in commercial HP cultivation with applications of mineral fertilizer according to Resh [22]. They found that all varieties performed better in AP.
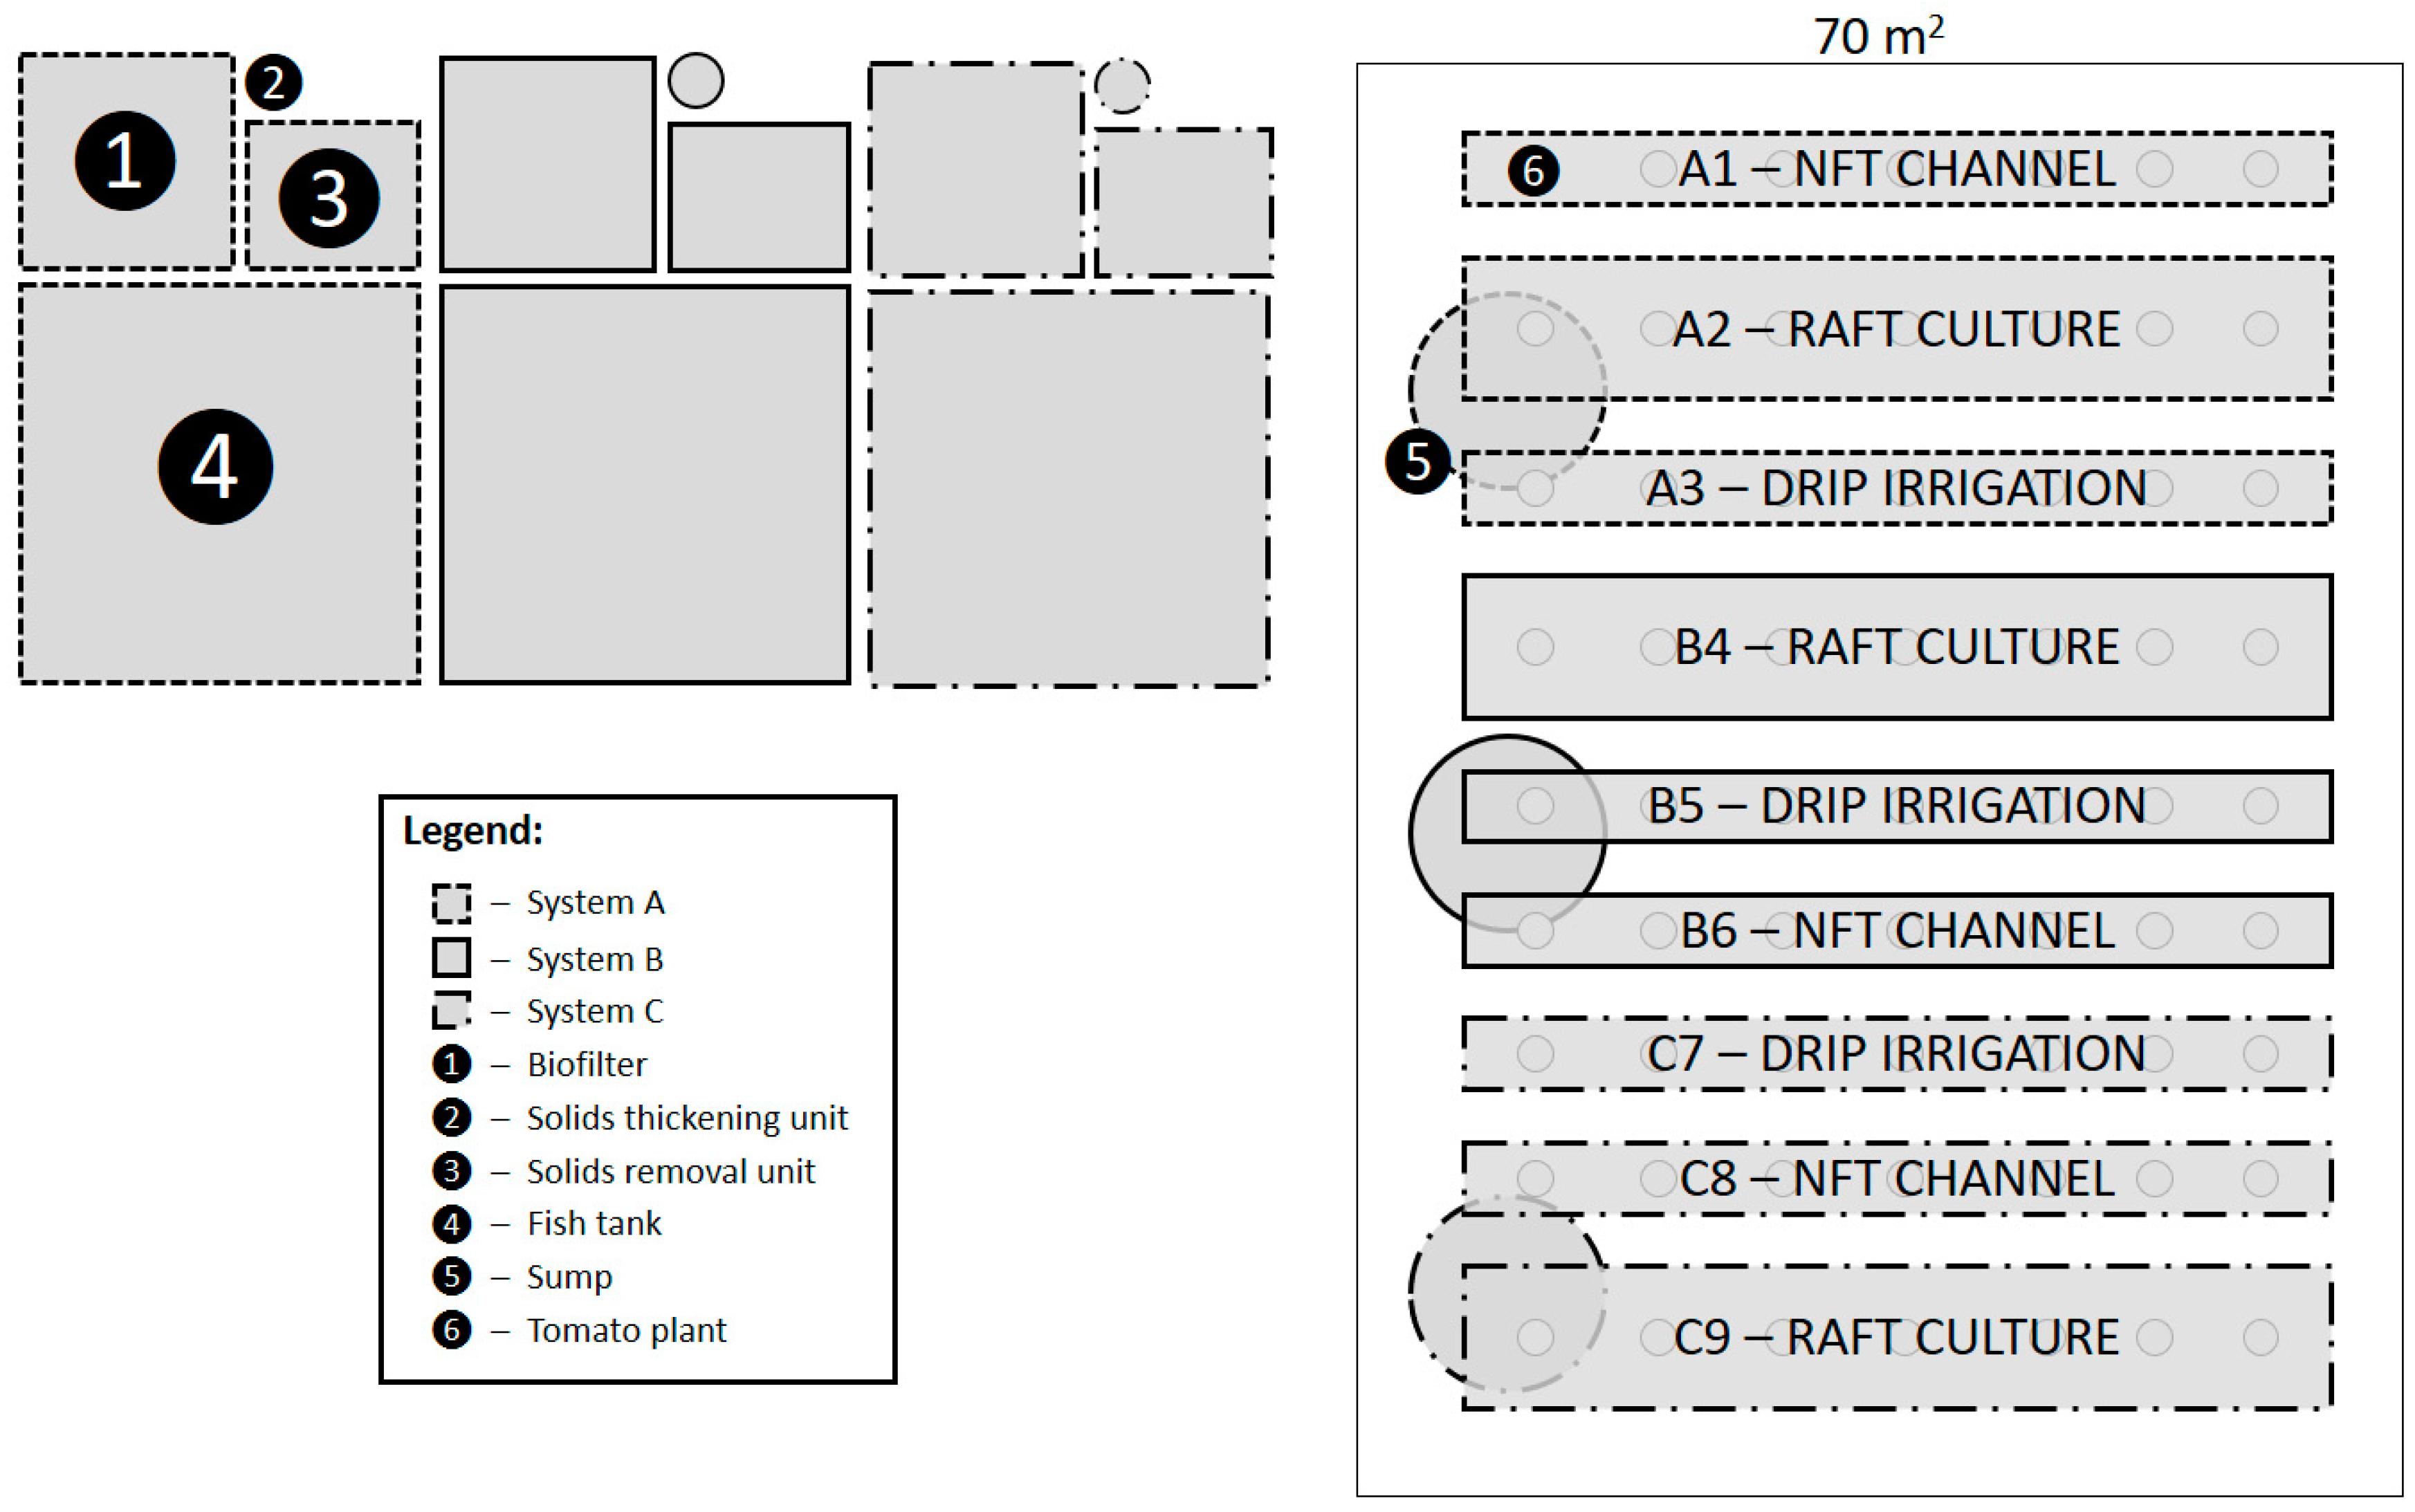
The purpose of this study was to compare tomato yields, morphological (external) and biochemical (internal) quality, and overall plant vitality in three different HP systems (NFT system, drip irrigation system, and floating raft culture). In addition, nutrient uptake and distribution within the tomato plants was also to be determined.

2. Material and Methods

The experiment was conducted from 31 March to 5 November 2014 (220 days) in a double plastic covered greenhouse at the Zurich University of Applied Sciences (ZHAW) in Wädenswil, Switzerland. From 31 March to 11 June, the systems were operated as HP systems, with nutrient supplements added directly to the sump (Figure 1). The required amount of nutrient supplements was calculated based on the water volume in the HP unit. On 12 June, the HP units were connected with the aquaculture unit and the system started to work as a quasi-closed loop AP.

2.1. The Aquaponic System

Three identical experimental recirculating AP systems (A, B, and C) were installed in a greenhouse, covering 270 m2 in total (Figure 1). Each AP system (Figure 2) was composed of a fish holding tank (2700 L), a solids removal unit (drum filter) with water level sensor (230 L), solids thickening unit, i.e., radial flow settler (45 L), a moving bed biofilter (580 L), an oxygenation zone (30 L), a collection sump with water level sensor (470 L), piping (65 L) and a HP unit (730 L). The HP unit in each of three AP replicate systems consisted of three subunits: (i) NFT channel (4 m × 0.2 m) with four coconut fiber slabs for plant support; (ii) floating raft culture basin (650 L; 4 m × 1 m × 0.2 m) with an aeration pipe to provide additional oxygen to the roots (25 L·min−1) and floating rafts (Dryhydroponics, BV’s-Gravenhage, The Netherlands); and (iii) a drip irrigation system (4 m × 2 m) with four coconut fiber slabs for plant support and 20 narrow tubes delivering water directly to the plants. Each replicate AP system had a water volume of 4.85 m3 and a surface of 35 m2.
The climate in the greenhouse was controlled and recorded by a greenhouse climate computer (MasterClim 4 Zones, Anjou Automation, Mortagne-sur-Sèvre, France). During the day (start 1 h after astronomical sunrise), the heating was activated if the inside temperature was below 18 °C and aeration (openings in the greenhouse roof and additional ventilation) started if the temperature was above 20 °C. During the night (start 1 h after astronomical sunset), the heating was activated if the temperature was below 16 °C and aeration started if the temperature was above 20 °C. The sprinkling system (CoolNet, Netafim Ltd., Tel Aviv, Israel) came into operation if the temperature was above 27 °C or the humidity below 40% (Figure 3).
In order to make a comparison to commercial production, four tomato plants of the same cultivar were grown hydroponically on rock wool using drip irrigation in a commercial greenhouse (Meier Gemüse, Paul und Ruedi Meier, Rütihof, Switzerland). For this comparison group, tomato cultivation measures such as pesticide application were performed according to established management practices in Switzerland [24]. In addition, two different cherry tomato cultivars were also bought in a supermarket on 15 October to compare internal fruit quality traits from the experimental system with different cultivars grown in an unknown commercial system.

2.2. Stocking of the System

In spring 2014, the AP system was stocked with tomato plants (Solanum lycopersicum L. cv. “Gardenberry F1” (Hild)) and Nile tilapia (Oreochromis niloticus). Tomato seedlings were obtained on 28 February from Tozer Seeds Ltd. (Pyports, UK) and were supplied by Max Schwarz AG (Villigen, Switzerland) before being cultivated further in the greenhouse. Seedlings were transplanted into the HP units on 31 March. Initially, each HP unit hosted seven tomato plants with 24 shoots (31 March–12 June). On 12 June, one random healthy shoot per HP unit was removed to assess total green biomass in each HP unit, leaving 23 shoots per unit. To ensure equality between HP units, on 25 July, one shoot per channel was removed, leaving 22 healthy shoots, with each tomato plant occupying an average area of 1.1 m2. The tomato plants were cultivated using a high wire system [25], with the supporting wire at a height of 4.20 m. The growth period after transplanting was 31 weeks. The tomato plant tips were cut nine weeks before the end of the experiment to prevent further elongation. Plant protection with beneficial organisms (Encarsia formosa, Ichneumons, and Phytoseiulus persimilis) and pesticides (Natural, Pegasus, and Envidor) was performed dependent on the needs (Table A1) and according to integrated pest management principles using beneficial organisms and products registered for organic production as standard pest control measures. Other chemical pesticides were only applied to control high pest pressure situations. Bumblebees provided by Andermatt Biocontrol AG (Grossdietwil, Switzerland) were used to support pollination. In June, a high occurrence of spider mites was observed in the greenhouse, with one of the raft culture HP subunits (C9) being the most affected channel (Figure 1 and Figure A1). However, a rating of spider mite damage on leaves sampled for nutrient analysis did not show severe damage or significant differences between the treatments. Towards the end of September blossom-end rot was observed on some fruits in all of the HP units (Figure A2). From July onwards regular cutting of the roots in the NFT channels was necessary. Inside the channels, increasing root biomass was blocking the water flow, causing leakages, and clogging the pipes. The roots were cut on both sides of the channel over a period of a few days to cause less stress to the plants, as shown in Figure A3. Rotten roots were observed after removing roots from the raft culture and NFT channels in November. The most damaged roots were found in the corners of the raft culture (Figure A4), probably resulting from insufficient aeration, and in the NFT channels under the coconut fiber slabs (Figure A5).
Nile tilapia larvae were obtained from Til-Aqua International (Velden, The Netherlands). On 12 June, each fish tank was stocked with 300 tilapias (approximate 67.8 g per fish). The fish were fed ad libitum (i.e., to apparent satiation) three times a day (8:00, 13:00, and 17:00) with a swimming pelleted feed (Table A2). While nutrient uptake by the tomato plants remained more or less stable after 12 June, the fish biomass increased. Gained fish biomass over the entire aquaponic experiment was 59.0 ± 5.0 kg.
To balance the feed input demand of the fish with nutrient demand of the plants, fish were harvested three times between 12 June and 5 November, according to the ZHAW internal standard operating procedure.

2.3. System Monitoring and Determination of Nutrient Supplementation for the HP System

Electrical conductivity (EC), pH, dissolved oxygen, and temperature were measured continuously in the fish tank and logged every 15 min with SC1000 sensors from HACH Lange (Loveland, CO, USA). Calcium hydroxide and potassium hydroxide were used to adjust pH during the experiment. Weekly system water analyses of total phosphorus (TP), nitrate-nitrogen (NO3-N), nitrite-nitrogen (NO2-N), ammonium-nitrogen (NH4-N), potassium (K), iron (Fe), calcium (Ca), magnesium (Mg), and boron (B) were performed with a DR 3800 VIS Spectrophotometer and LCK tests (HACH Lange). Each week (1 April–5 November), one sample from each fish tank (A, B, and C) was taken in 500 mL plastic bottles. Nutrient target values for system water (Table 1) were determined according to standard tomato nutrient requirements [26]. In mid-September, the parameters were adjusted to lower target values. HydroBuddy free software [27] was used to calculate the amount of nutrient supplementation needed to reach system water target values using Iron DTPA and Multi Micro Mix (Ökohum GmbH, Herrenhof, Switzerland), Krista SOP, Krista MKP, and YaraLiva® Calcinit (Yara UK Limited, Grimsby, UK), and EPSO TOP® (K + S Kali GmbH, Kassel, Germany). The target values for EC and pH were 2500 μS cm and 6.5, respectively throughout the entire experiment.

2.4. Tomato Harvest and Biomass Sampling

The fresh weight of removed biomass (pruned biomass, unripe tomato fruits, and roots) was recorded from 31 March to 5 November. Ripe (i.e., fully red) tomatoes were harvested twice a week from 15 May till 5 November. Harvested fruits were classified into three categories according to the current market requirements for cherry tomatoes (Table 2) [28], and subsequently counted and weighed for each HP unit separately. Starting from 6 June, the tomato plants were pruned weekly by removing the side branches and old leaves, leaving 12–15 completely developed leaves on the shoots, and shortening the flower clusters to 15 tomatoes per cluster. The pruned biomass dry weight was determined twice, on 12 June and 25 July. After the final harvest on 5 November, the remaining biomass was weighed. To determine the dry weight, one tomato plant from each HP unit was used. Fresh samples were cut into pieces of approximately 2–4 cm with garden scissors, and oven-dried at 105 °C until they reached a constant weight (24–48 h). The dried samples were ground into a powder, which was later used to determine the total biomass nutrient content, as described below. To determine the leaf chlorophyll status (a plant vitality parameter), the leaf and fruit mineral nutrient concentrations, the internal fruit quality, the leaves and the fruits were measured and sampled on three dates (12 June, 7 August, and 16 October), after the respective fruit harvest. To analyze the leaf mineral nutrient content, the leaves located between the two trusses, where actual harvesting took place, were sampled from four plants. The chlorophyll status was estimated using a chlorophyll meter (SPAD-502, Minolta Corporation, Ramsey, NJ, USA) measuring the five leaflets at the tip of each leaf. Subsequently, leaves were cut and stored in a cooling box for later processing on the same day. Leaf stomatal conductance and temperature were measured with a steady state diffusion leaf porometer, SC-1 (Decagon Devices, Pullman, WA, USA) on the tip leaflet. Chlorophyll fluorescence was measured on the same five leaflets where the SPAD measurements were taken using a portable chlorophyll fluorometer (MiniPAM, Waltz GmbH, Effeltrich, Germany). Fluorescence was only measured for the second and third sampling harvest. To analyze the fruit, 16 random first category tomato fruits were selected from each HP unit and were analyzed as described below. To estimate the cumulative tomato fruit nutrient uptake for the tomato fruits harvested from 15 May to 10 July, results from the harvest on 12 June were used. Samples taken on 7 August were used for the period from 11 July to 12 September, and samples taken on 16 October were used for the last harvest period from 13 September to 5 November.

2.5. Leaf and Fruit Analysis

To analyze the leaf mineral nutrients, the four sampled leaves and four fruits from each HP subunit channel were pooled and dried in an oven at 60 °C until a constant weight was reached. Prior to drying the fruits were cut into halves and the dried samples were ground to powder. To determine phosphorus (P), K, Ca, copper (Cu), sulfur (S), Mg, manganese (Mn), zinc (Zn) and Fe, 200 mg of dried powder was weighed into a Teflon tube and dissolved in 15 mL of nitric acid (HNO3, 70%) at 120 °C for 90 min. After cooling down for 30 min, 3 mL of H2O2 was added and the solutions were incubated for another 90 min at 120 °C. After cooling down for a further 30 min, the solutions were transferred into 50 mL tubes and filled up to 50 mL with nanopure water. For measurement purposes, the solutions were diluted tenfold and analyzed with an axial ICP OES (Varian Vista MPX, Waldbronn, Germany). To obtain the carbon (C) and nitrogen (N) concentration, 2.5 mg of dried powder was weighed out into tin capsules and analyzed in a CHNSO analyzer EURO EA (HEKAtech GmbH, Wegberg, Germany). For sugar and acidity measurements, two freshly harvested tomato fruits were squeezed and blended (Moulinex, Glattpark, Switzerland) in four replicates for each HP subunit. The sugar content was then measured by a reflectometer (HR75, Fa. A. Krüss Optronic GmbH, Hamburg, Germany) using nanopure water as a blank. Acidity (fruit pH) was measured with a pH meter (Metrohm 632, Herisau, Switzerland). The remaining four tomato fruits were freeze-dried (Christ Freeze Dryers, Beta 2–8 L Dplus, Osterode am Harz, Germany). Prior to freeze-drying, several tiny holes were pierced into the tomato fruit skin to allow better evaporation. Afterwards, the tomatoes were ground up. The measurement of the fruit lycopene content was adapted from the protocol by Anthon and Garrett [29]. For this purpose, 25 mg of tomato powder was dissolved in 1.5 mL HEA (Hexane:Ethanol:Acetone, 2:1:1) and centrifuged. After centrifugation, the supernatant containing the lycopene was removed. To obtain all of the potential lycopene, this extraction step was repeated. Then, 0.45 mL of H2O was added to the pooled supernatant to reach phase separation. From the upper part, containing hexane with dissolved lycopene, 200 μL was placed in a transparent 96-well plate and measured in the Enspire 2300 multimode plate reader (Perkin-Elmer, Schwerzenbach, Switzerland) at 503 nm. A correction function for the organic solvents used was established using cuvette spectrophotometer (UV-1800, Shimadzu Manufacturing Inc., Canby, OR, USA) and a crystal glass cuvette. The optical absorbance of the lycopene solution is proportional to the lycopene concentration, which was calculated for each sample weight using the Equation (1) established by Anthon and Garrett [29].
L y c o p e n e   ( m g · k g 1 ) =   1.717 × A 503 × V W
where V is a volume of HEA solution (mL) and W is a sample weight (mg).
Oxygen radical absorbance capacity (ORAC) was adapted from the protocol developed by Garrett et al. [30] For this purpose, 25 mg of tomato powder was dissolved in 1.5 mL MetOH (MetOH:H2O, 1:1), mixed and centrifuged. The supernatant that contained the antioxidants was removed. This extraction step was repeated three times. The removed supernatants were pooled into one sample. For measurement purposes, 20 μL of the sample were added to 200 μL of Fluorescein (Fluorescein Sodium Salt) and incubated at 37 °C for 10 min. After the incubation step, 75 μL of 2,2′-azobis(2-amidino-propane) dihydrochloride were added before the absorption was measured in an Enspire 2300 multimode plate at a wavelength of 485 nm using an emission wavelength of 528 nm. A calibration curve was created using Trolox (Trolox (±)-6-Hydroxy-2,5,7,8-tetramethylchromane-2-carboxylic acid, 97%). The ORAC concentration is given as mmol TE L−1 where TE is the Trolox equivalent. The method for determining the total phenolic content (TPC) was adapted from the method developed by Waterhouse [31], using pooled extracts from the ORAC measurement. Thirty microliters of the sample was added to 30 μL H2O and 50 μL of FCR (Folin-Ciocalteau, 10%). After 1 min, 80 μL Na2CO3 were added. The plate was incubated for 2 h at room temperature before measuring at 765 nm in an Enspire 2300 multimode plate reader. A calibration curve was made using Gallic acid and measured together with the samples.

2.6. Statistical Analysis

The data were statistically analyzed in R-project using the R-studio software (R version 3.0.2, 2013) [32]. The total fruit yield and biomass parameters were calculated, using a one-way Analysis of Variance (ANOVA) with the HP system as a factor. For the leaf and fruit analysis and the plant vitality parameters, a two-way ANOVA was performed using HP system and time of harvest as factors. If significant effects were found, a Tukey’s test (HSD test) with a p-value of p < 0.05 was performed.

3. Results

3.1. Tomato Yield and External Fruit Quality

The tomato fruits measured approximately 25 mm in diameter, had a strawberry shape and a deep red color, a sweet flavor and firm consistency (Figure A6). The marketable yield (fruits of the category 1) was significantly highest in the drip irrigation and the non-marketable yield (category 2) was significantly higher in the raft culture system (Table 3). The total cumulative yield per HP unit showed significantly better performance for the drip irrigation system (Figure A7). This was also observed for single harvests where the drip irrigation system often had the highest weekly yields and the raft culture provided the lowest ones (however, not always significantly different). The number of tomato fruits in category 1 was significantly highest in the drip irrigation system and the category 2 yield was significantly higher in the raft culture. Fruit fresh weight decreased significantly during the season but no differences were observed between the HP systems. The negligible difference in dry matter was only detected in category 1 where mean weight was highest in the drip irrigation system (19.4 ± 3.2 g) and lowest in the raft culture (18.8 ± 4.3 g).

3.2. Internal Fruit Quality Parameters

The fruit sugar content was at its lowest in June, and significantly highest in the August harvest (Figure 4A). The significantly highest sugar content was measured in the NFT system, and the lowest in the drip irrigation system (Figure 4A). The sugar content of the fruits from commercial HP control was in the same range as for the drip irrigation. The fruit sugar content of the October harvest was not measured because of low number of fruits and other fruit analyses were prioritized. Fruit pH (acidity) was significantly lowest in the October harvest. Pronounced differences between the HP systems were only observed in the first harvest, when the raft culture showed significantly higher fruit pH values than NFT (Figure 4B).
The fruits from commercial HP control had pH values similar to the aquaponically grown tomatoes. The ratio of the sugar to acidity ratio (Figure 4C) showed similar tendencies, being lowest in June and highest in August; the NFT system delivered higher values and the drip irrigation system significantly lower values. Again, commercially produced tomato had similar values to the drip irrigation system. The fruit lycopene content was observed to be significantly highest in the August harvest (Figure 4D), while only in the June harvest, were pronounced differences between the HP systems observed.
At this time, the NFT system had significantly lower values compared to the raft and drip irrigation systems. The lycopene content measured in the commercially produced tomatoes was higher than in the aquaponically grown tomatoes throughout the entire season. The TPC was significantly higher in the October harvest compared to the June and August harvests. However, only in the August harvest, were significant differences between HP systems observed, when the drip irrigation system had the highest TPC (Figure 4E). The commercially produced tomatoes had a lower TPC in the June and August harvests than in October. The ORAC changed significantly between harvests, with the highest ORAC observed in August and the lowest in October. No significant differences between HP systems were observed (Figure 4F). However, commercially produced tomatoes had lower ORAC values.
The comparison of fruit quality parameters from AP grown tomato (this study) and tomatoes bought in the supermarket with Swiss and Dutch origin revealed similar sugar contents, fruit pH and sugar content to pH ratios (Figure 5). For lycopene and TPC, we observed slightly higher values in the supermarket tomato from the Netherlands, whereas Swiss supermarket and the AP system grown tomatoes had similar values. In terms of ORAC, we observed slightly higher values in the AP system grown tomatoes.
In terms of fruit mineral concentrations, the most variance was found between harvests (Table 4). While C, N, P and S concentrations in fruits decreased over time, the concentrations of K, Mg, Fe, Ca, Cu, Mn, and Zn increased significantly. Significant differences between the HP systems were only found for Mn, where the raft culture exhibited significantly higher concentrations in all three harvests compared to the drip irrigation and the NFT systems (Table 5).

3.3. Plant Productivity and Vitality Parameters

No significant differences were observed in dry matter fraction between the HP systems. Whole green biomass results showed no significant differences in the fresh weight between the HP systems. There was a difference between the fraction of dry matter of the whole tomato plant at the beginning (12 June) and at the end of the experiment (5 November), with dry matter increasing by 40.2%. There were no significant differences in green cut between the HP systems. Plant height constantly increased during the season with no significant differences between the HP subunits at the end of the experiment (data not shown). The average plant length of the aquaponically grown tomatoes was 6.7 m. The weekly growth rate decreased slightly over time and the average growth rate was 22 cm per week.
The fractional distribution of nutrient content (C, N, P, K, Ca, Cu, Mg, Mn, Zn, and Fe) of the tomato fruits and green biomass in the total output of the HP subunits is presented in Figure 6. Statistical analysis only showed significant differences in the amount of Mn between the drip irrigation and the floating raft systems. Overall, there was an obvious difference between the raft culture and the other two HP systems.
The significantly highest leaf chlorophyll contents (SPAD) were observed in August (Figure 7). However, only in June, did measurements show significant differences between the AP systems, when the NFT system had significantly higher values than the raft culture grown tomatoes. The commercially grown tomatoes were similar to the raft culture in June and lower in August. In October, the relevant leaf could not be measured due to a severe fungal infection. For leaf stomatal conductance and leaf temperature (data not shown) significant differences between measurement times were found. However, no differences between the AP systems and the commercially grown tomato were observed. The leaves of the commercially grown tomatoes showed similar results to the AP grown tomatoes except for the 2nd harvest. The electron transport rate of the photo-system II (ETR) was significantly highest in August when the only significant AP system differences were found in the raft culture, which had a lower ETR compared to the NFT system, while the drip irrigation system values were between the other two (data not shown). The ETR of the commercially grown tomatoes tended to be lower than in the AP systems.

3.4. Plant Nutritional Status (Leaf Mineral Analysis)

In terms of leaf mineral concentrations, significant differences were found between the harvests for all nutrients (Table 6). Significant differences between the HP subunits were only observed for C and Mn. The NFT system had significantly higher C concentrations throughout the entire growing period, while the raft culture system had significantly lower C concentrations in the leaves. The drip irrigation system did not differ from the NFT and raft culture systems. Significant differences in Mn concentrations were observed between the HP systems. The raft culture had the highest and the drip irrigation the lowest mineral nutrient concentrations in the leaves. The NFT system values were between the other two (Table 7).

4. Discussion

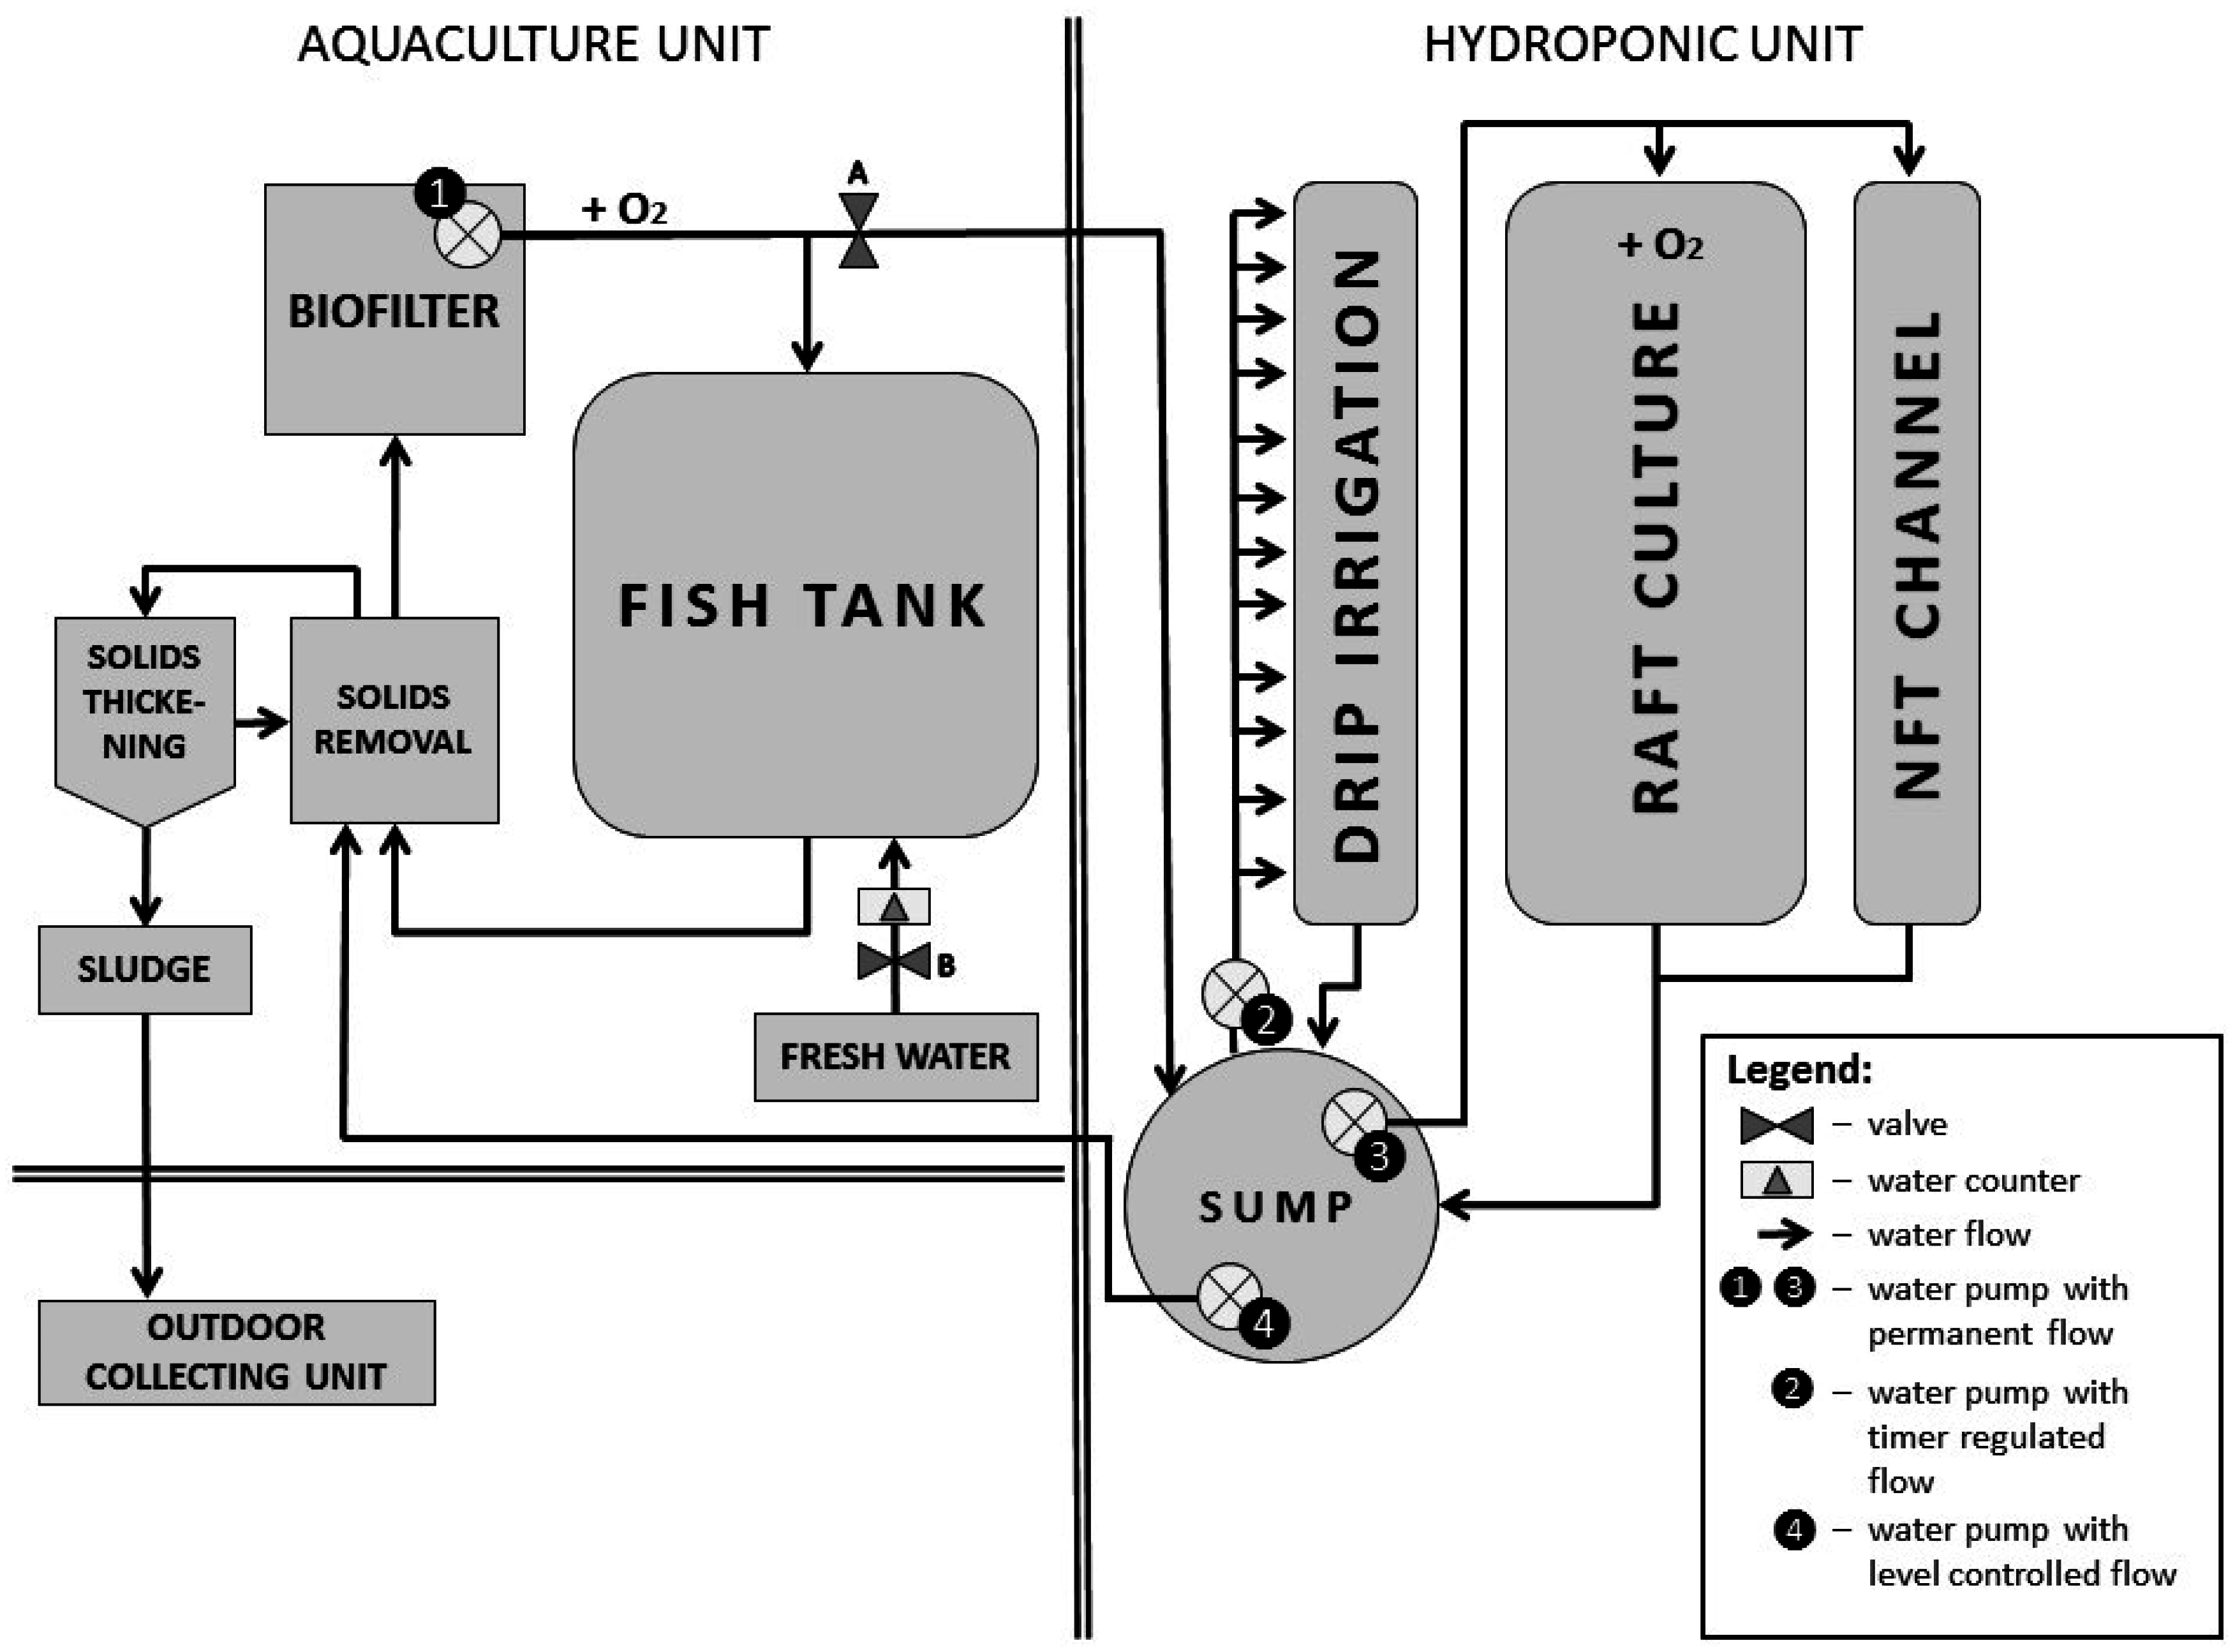
For the first ten weeks (1 April–12 June 2014), the system was operated as a hydroponic system. This phase of the experiment was mainly for system calibration and to assure that all HP subunits had the same quality of plants at the start of the experiment. After connecting the hydroponic systems with the aquaculture nutrient, target values remained the same as before. The resulting difference for the plants after changing from a HP nutrient solution to the AP nutrition was the source of the nutrients (from mineral to mainly organic, provided through fish feed input) and water temperature. The AP plants received heated water (29 °C) due to the fish requirements and the HP water was provided at ambient greenhouse temperatures which were usually lower than those of the aquaculture.
Data of average yields of this particular tomato variety are not available. However, this variety could be compared with other cherry tomato varieties. Lattauschke [33] and Testa et al. [34] reported average yields of 15.0 and 16.6 kg·m
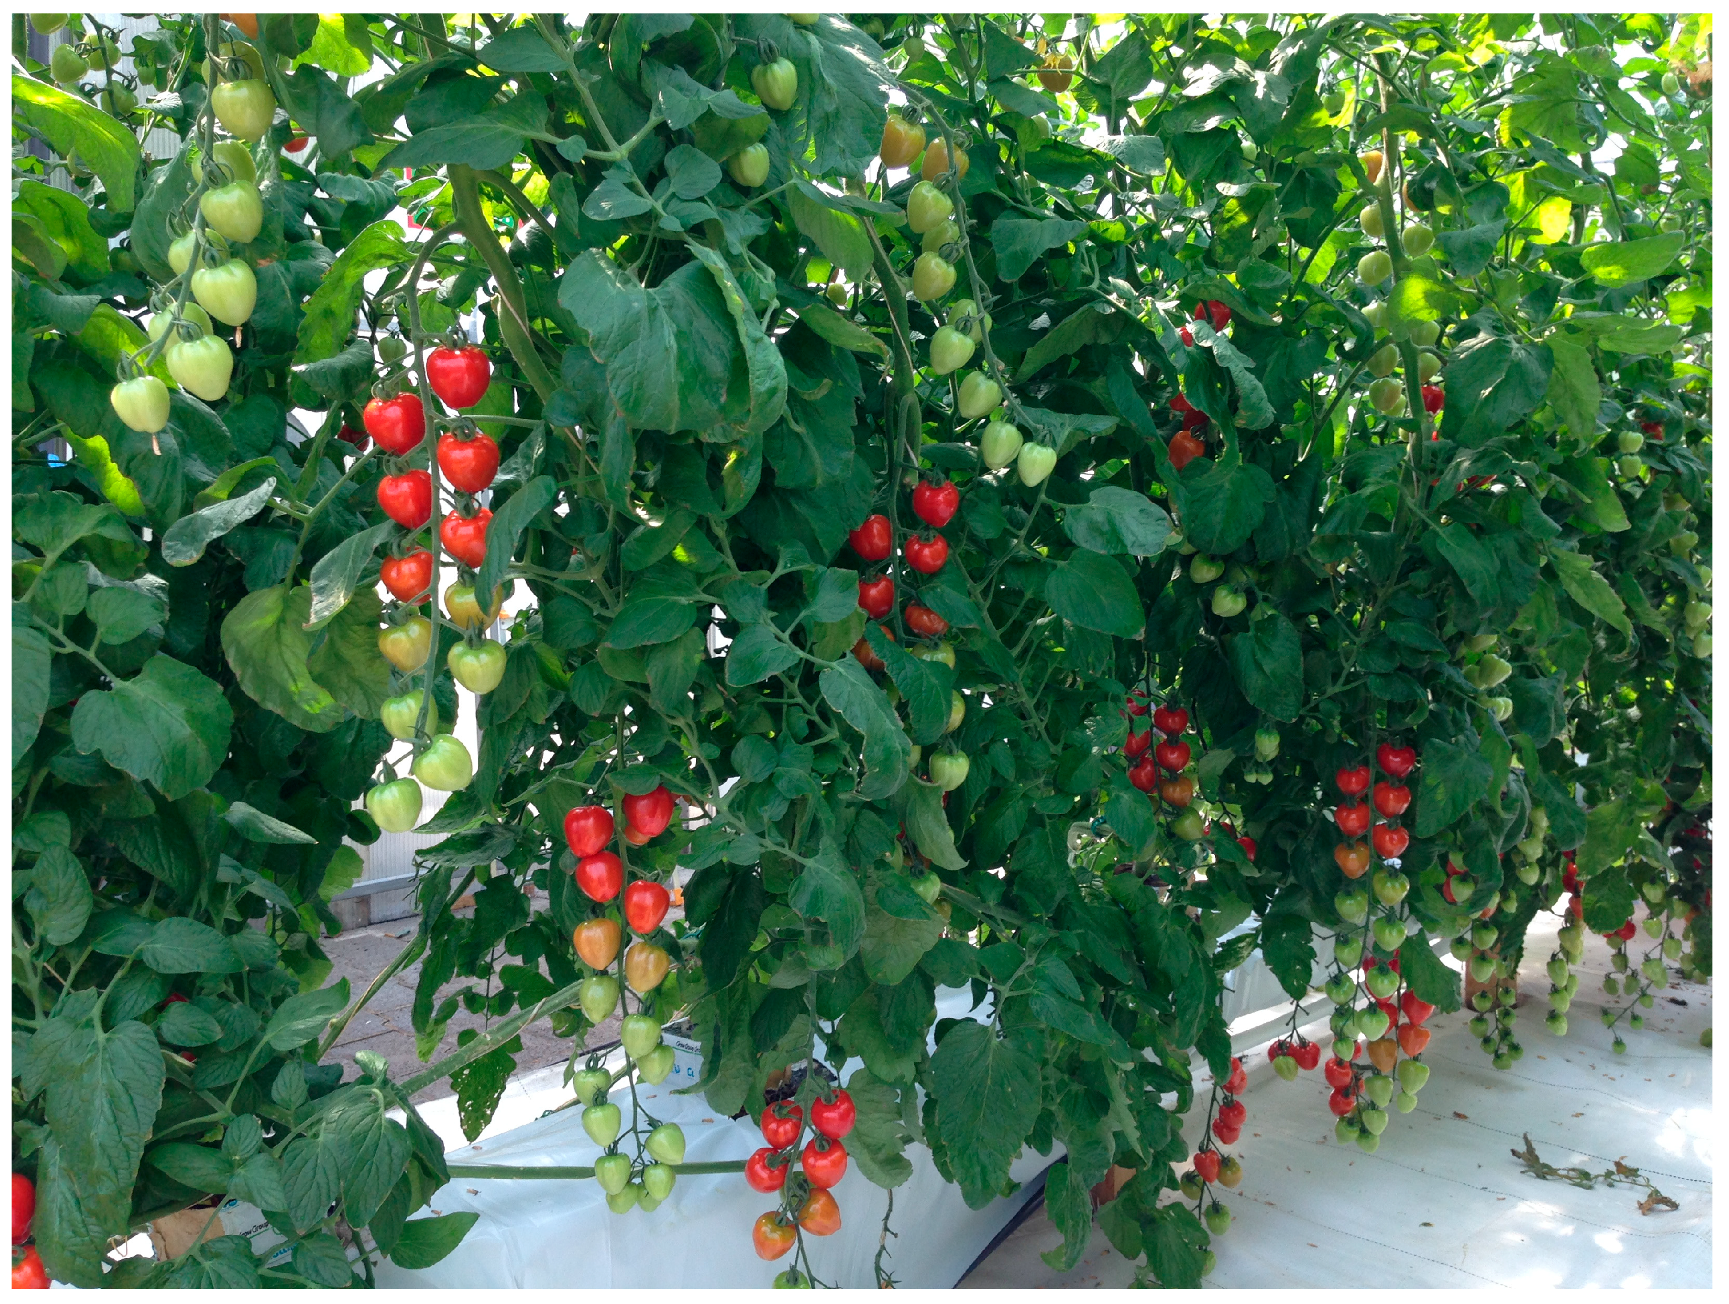
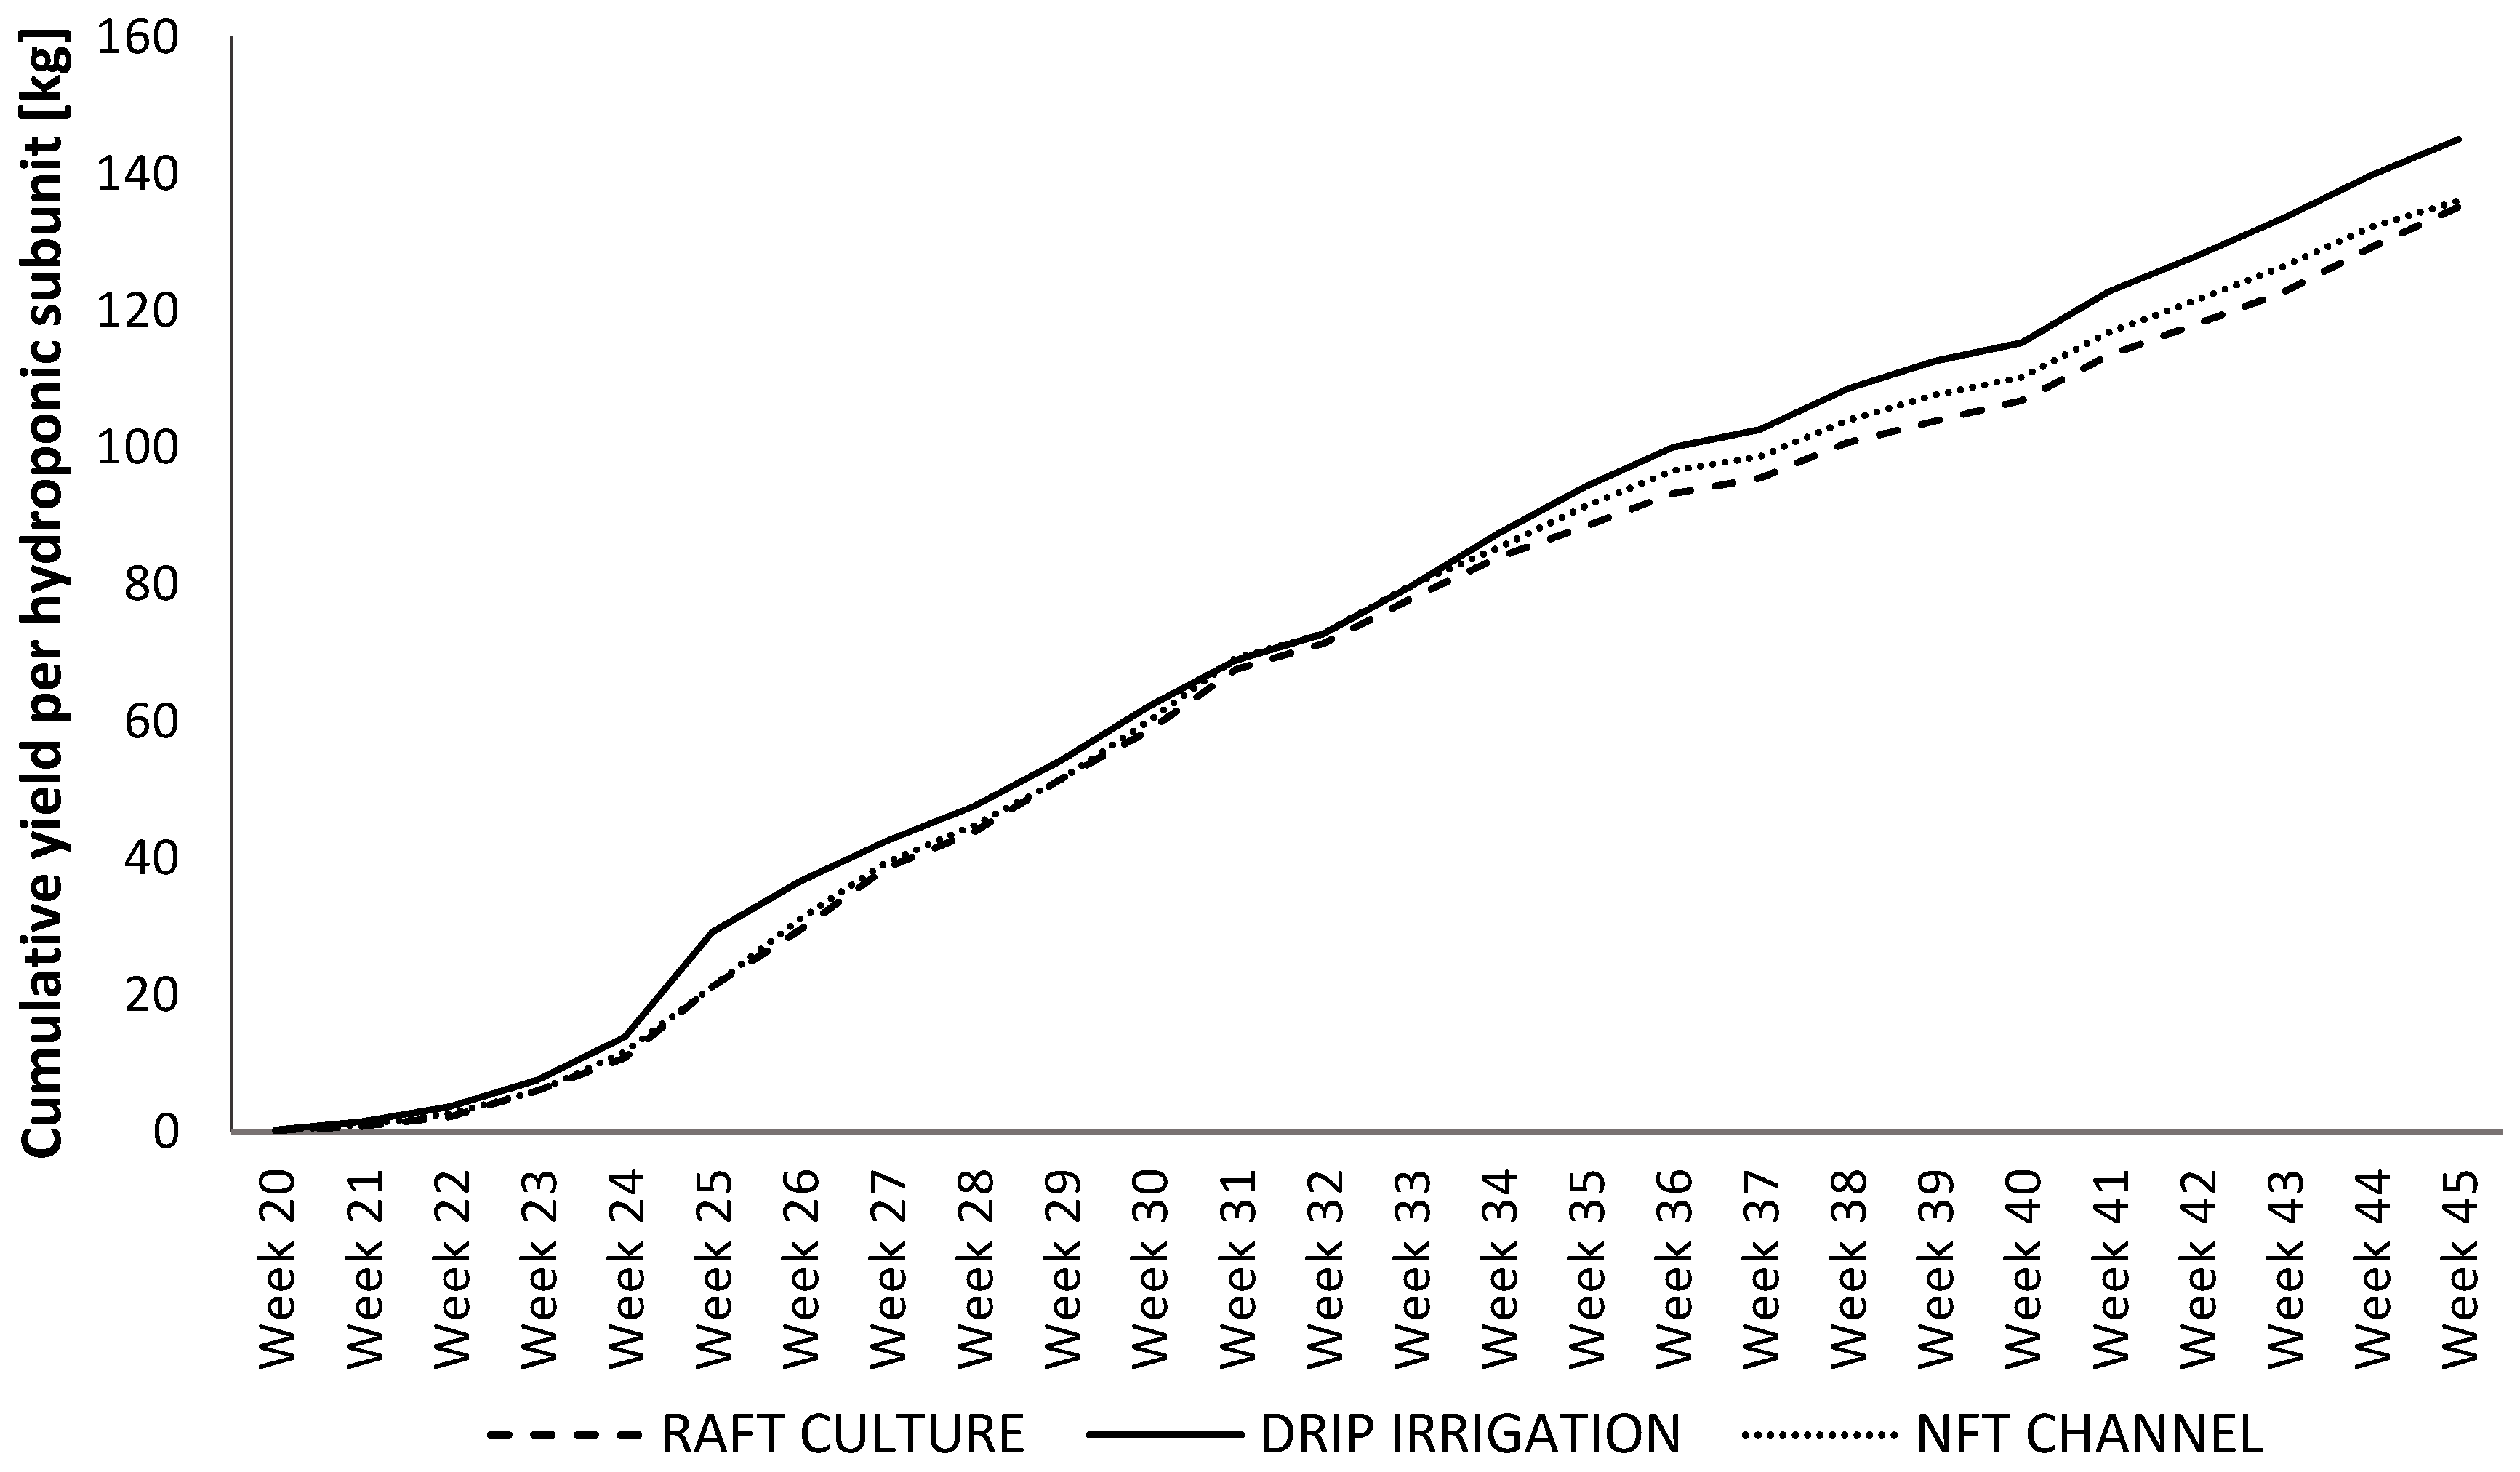
−2, respectively. The exact durations of the seasons were not declared. The cumulative yield in our study was higher, ranging between 16.8 and 18.3 kg·m−2, depending on the HP system. Lennard and Leonard [15] compared lettuce growth in floating rafts, gravel beds, and NFT in AP. They found that NFT produced significantly less biomass and removed the nutrients from fish water less efficiently than the other two. In this study, also both, cumulative yield and cumulative number of fruits were lowest in the NFT system, and highest in the drip irrigation system. This system was the only HP system with a pulsing water flow, which provided more air and thus oxygen to the roots, which is known to positively affect plant growth and yield [
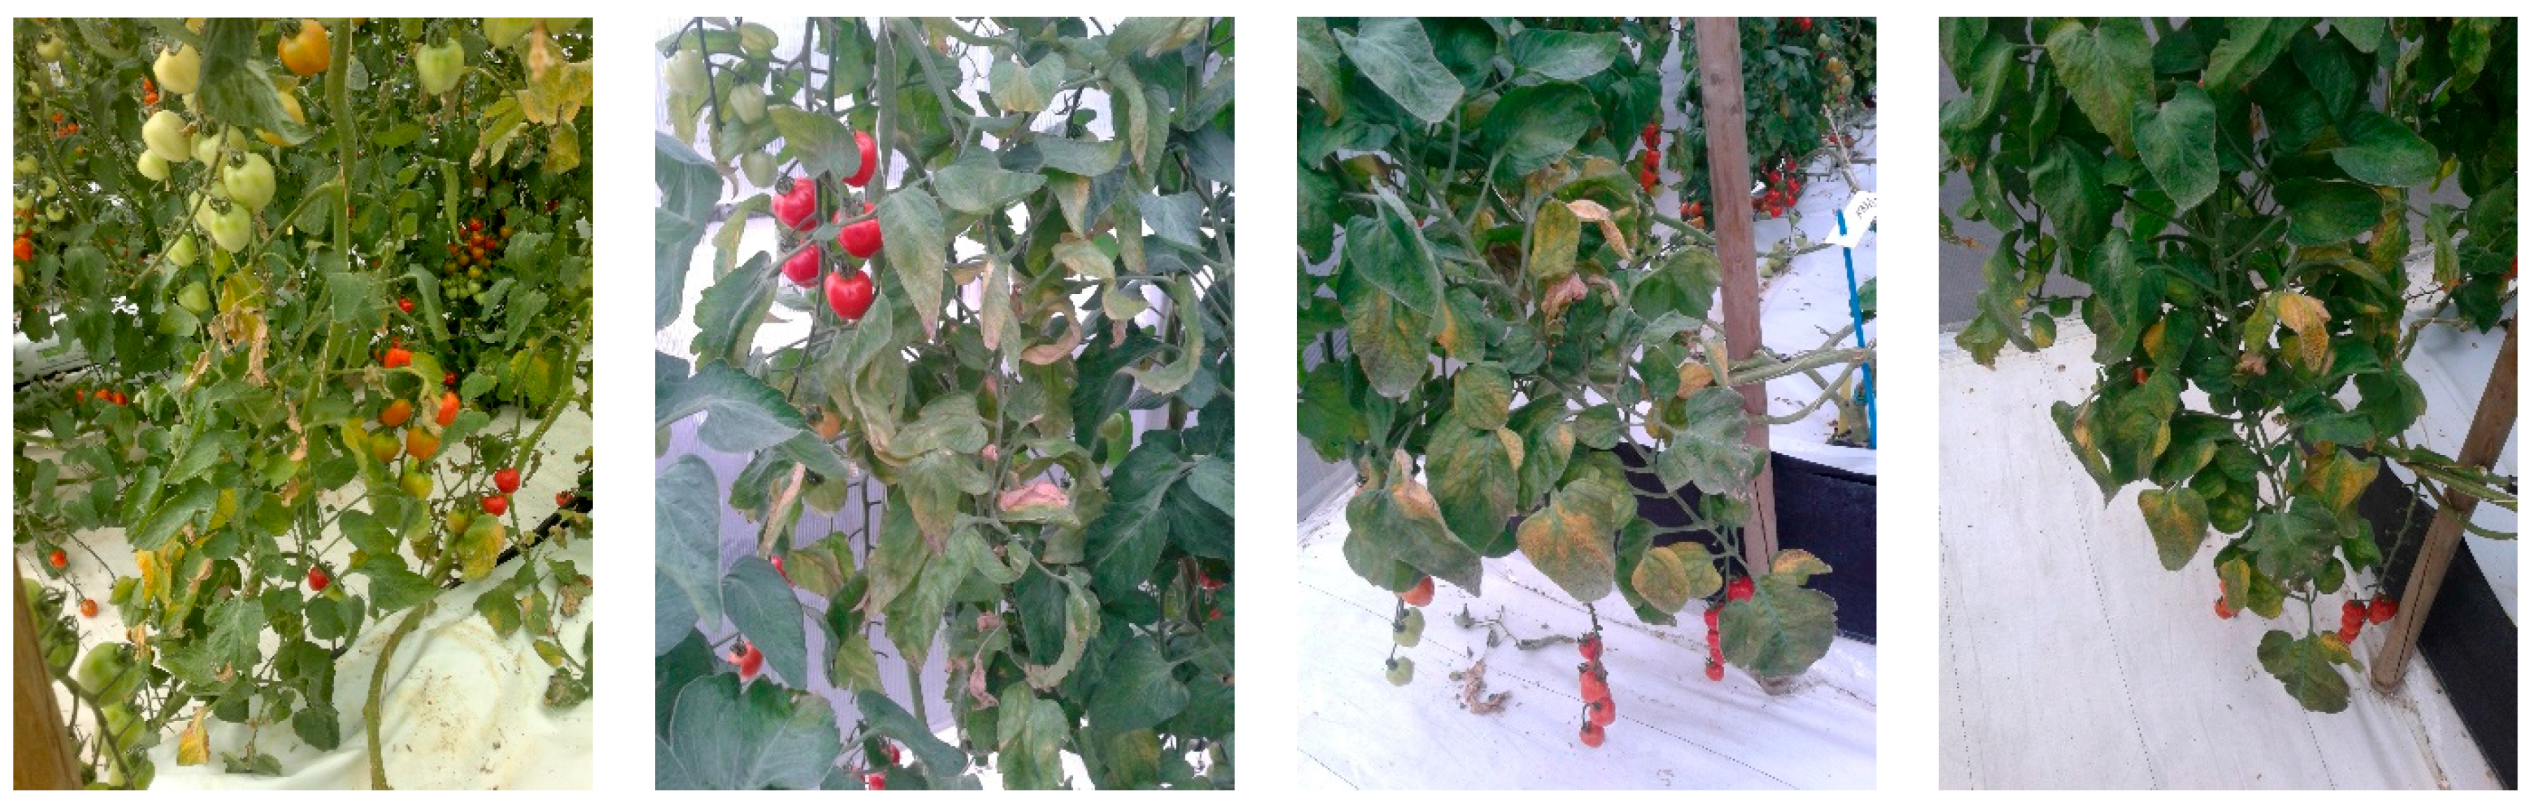
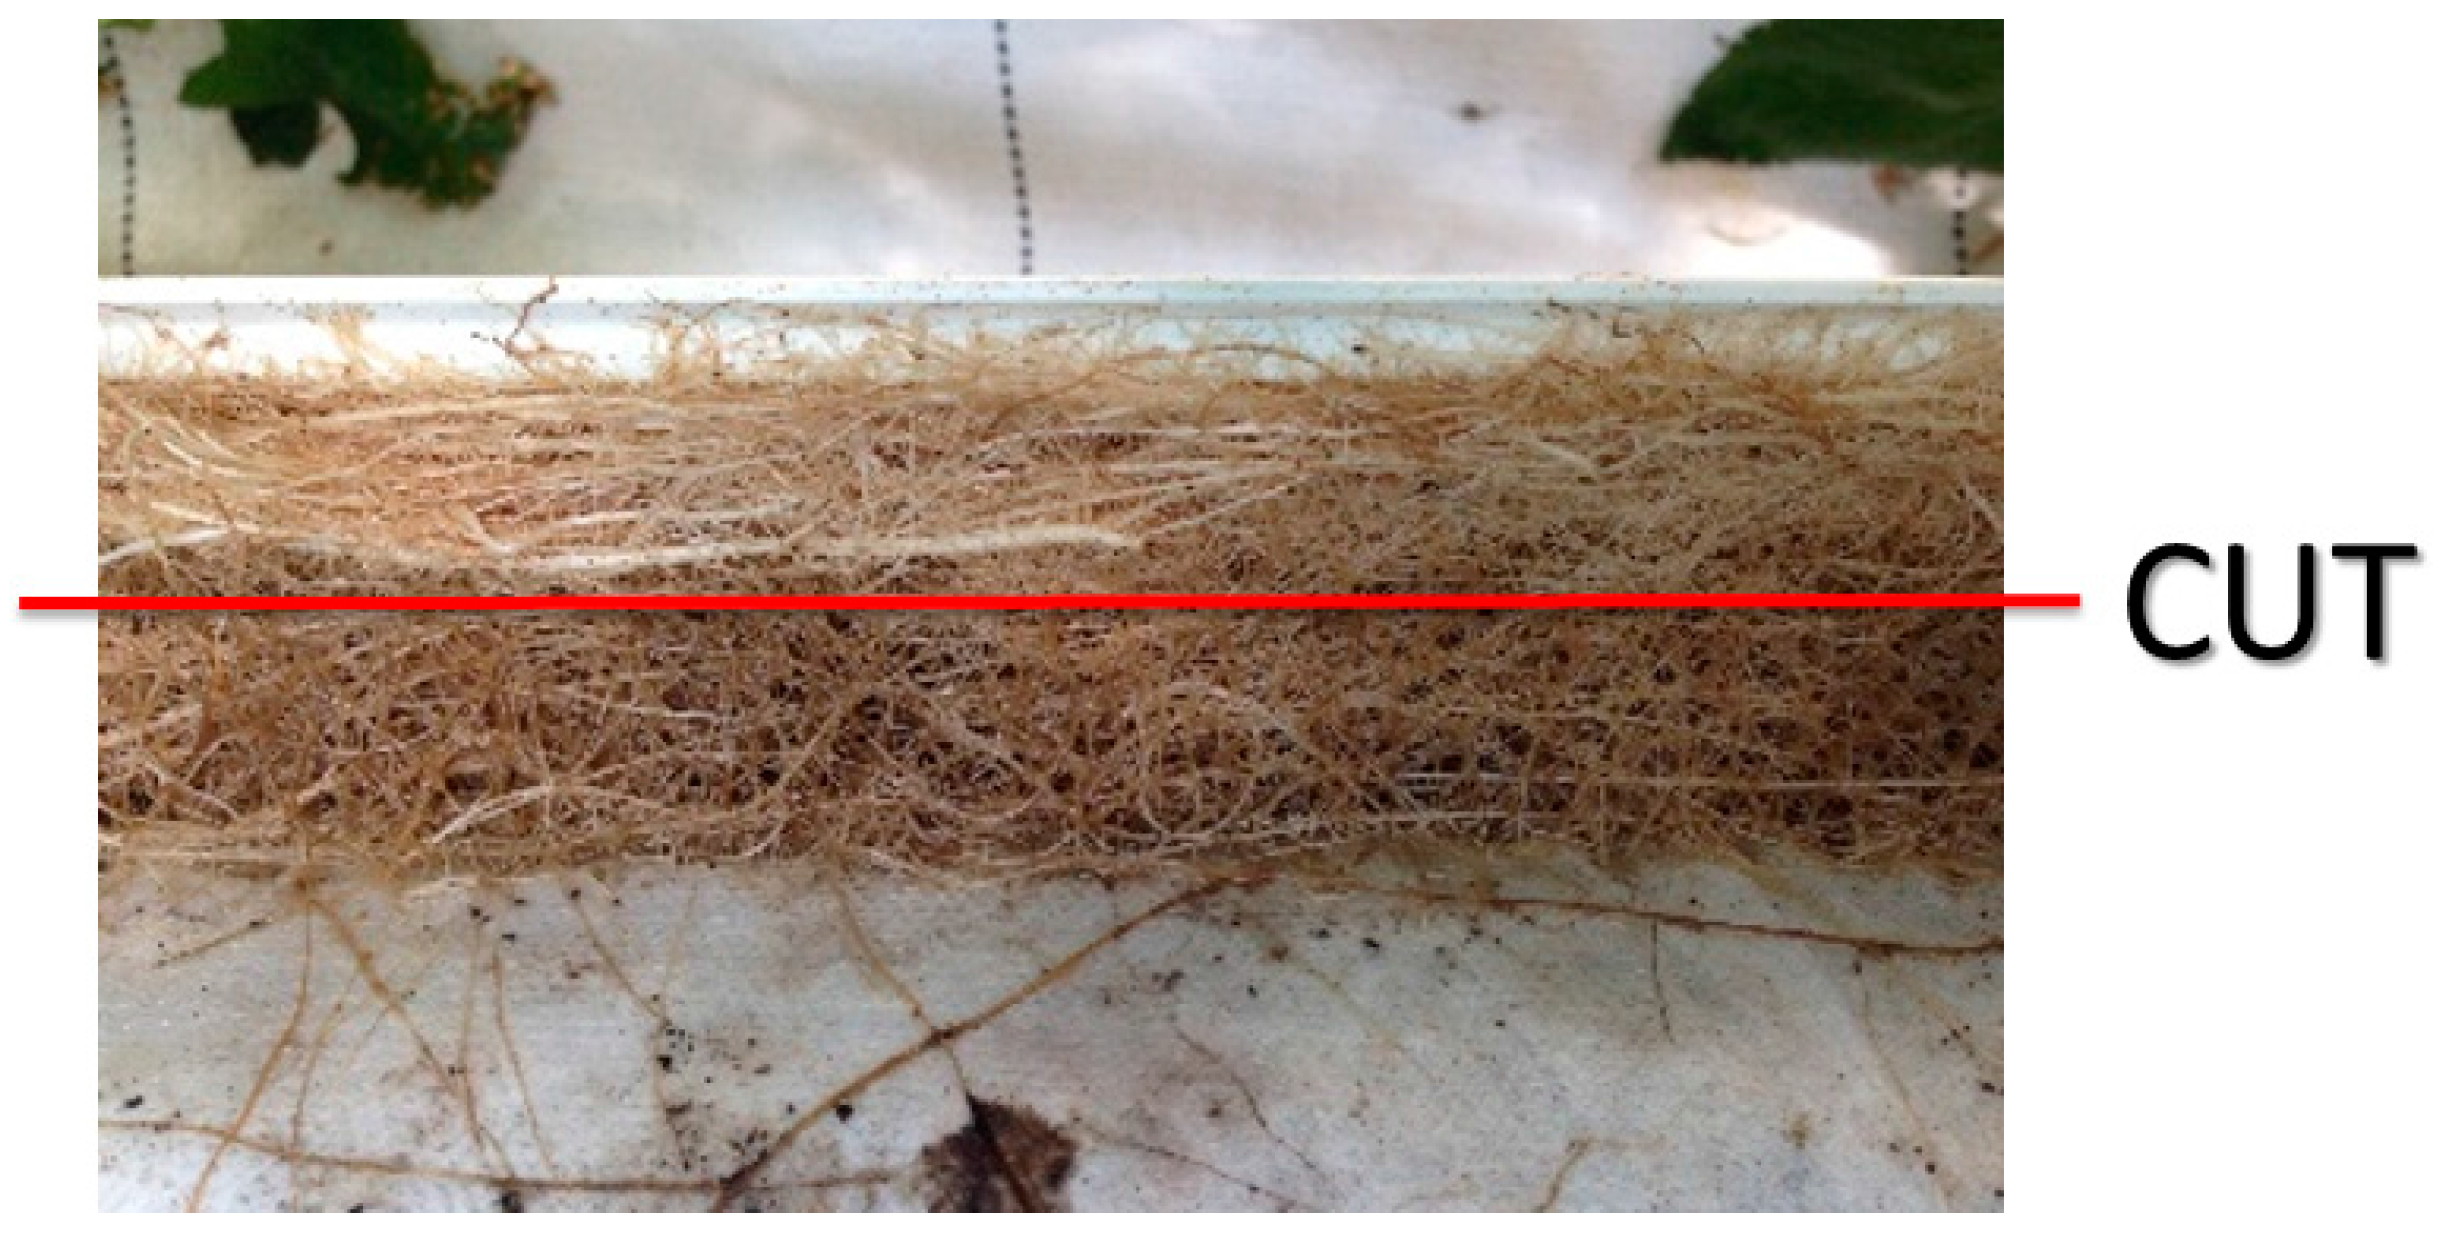
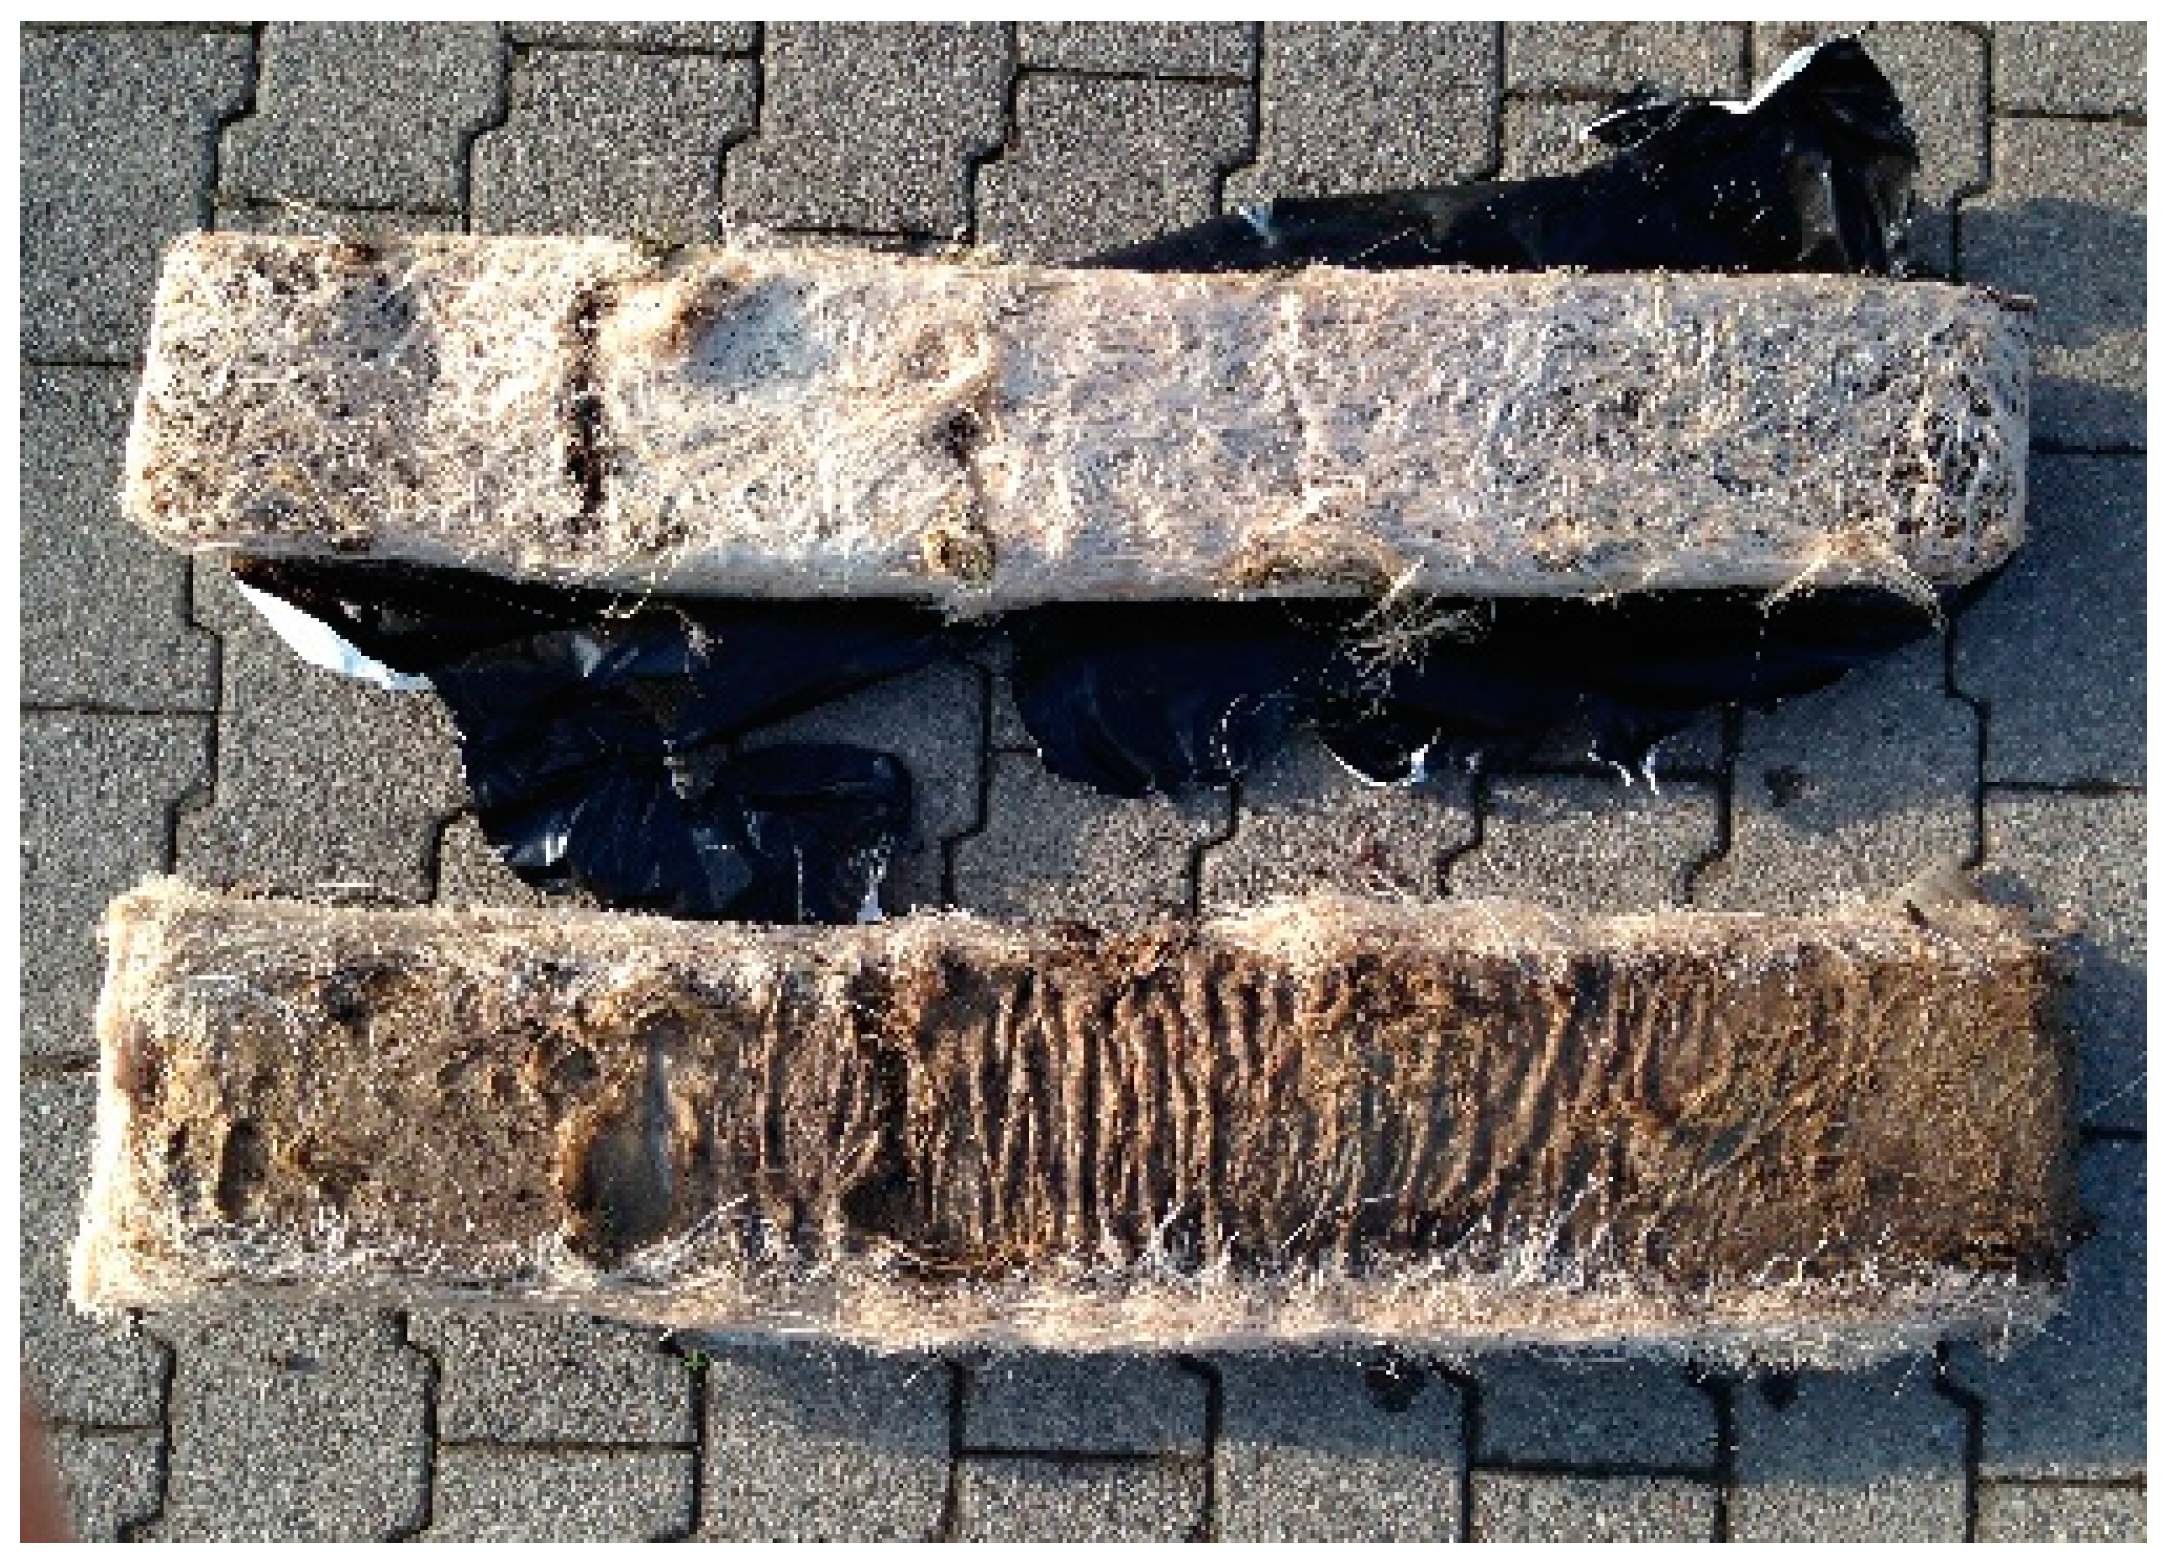
35]. Problems with the floating raft culture (clogging of the aeration pipes) and the NFT system (root biomass blocking the water flow in the channels) during the season must be mentioned. This increased the maintenance work needed to keep the system in optimal condition, but could also have affected the plants. This was most obvious in the raft culture system where the aeration pipes clogged and the water mixing in the basin was hindered, especially in the corners, forcing the plants to continuously develop new roots. The drip irrigation system, which is the most commonly used cultivation method in commercial systems, on the other hand, demands a higher electricity input because of the more powerful pumps required, but nevertheless it was the cultivation system with the lowest maintenance input.
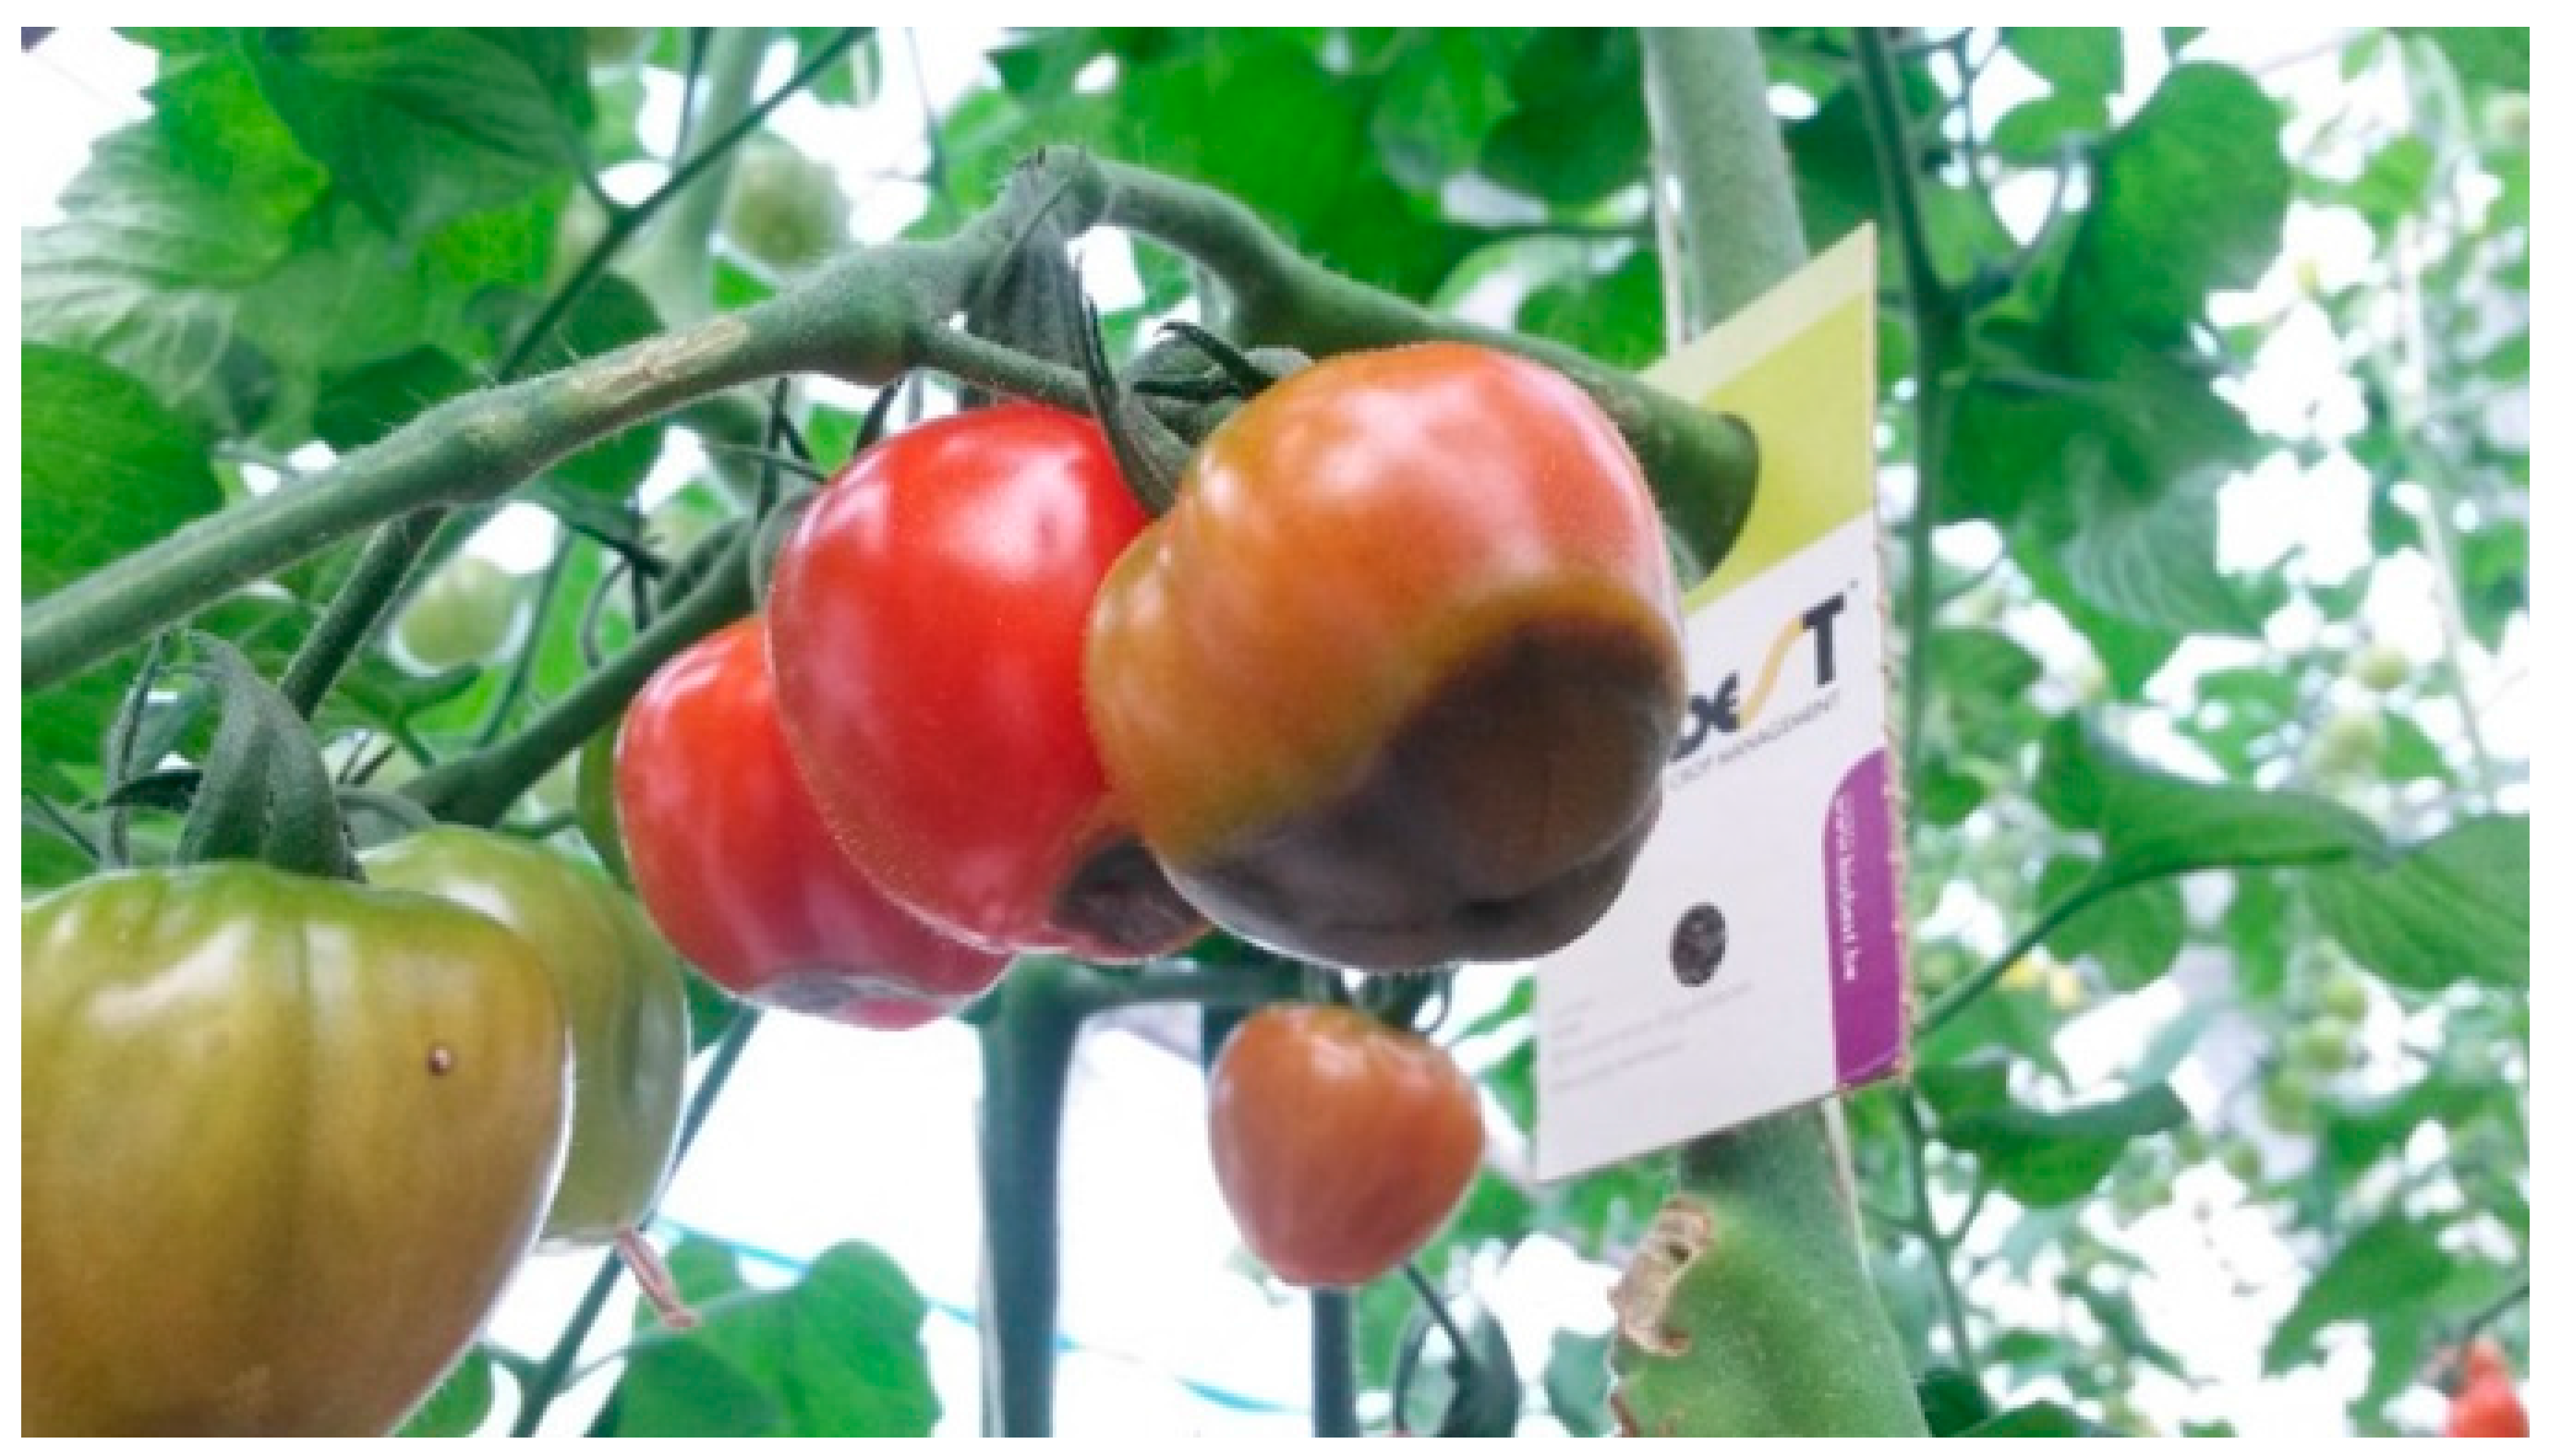
The fruit quality in the investigated systems was generally high, reflected by the low proportion of either wrong sized fruits (category 2) or misshapen or damaged fruits (category 3), which were always below 2.5% and 9%, respectively. A higher fraction of non-marketable fruits (higher weight and number) was observed in the raft culture system. This could be related to more cracked fruits harvested at the ripe stage which may have resulted from the unlimited supply of water which has frequently been reported to promote fruit cracking in tomatoes [21,36].
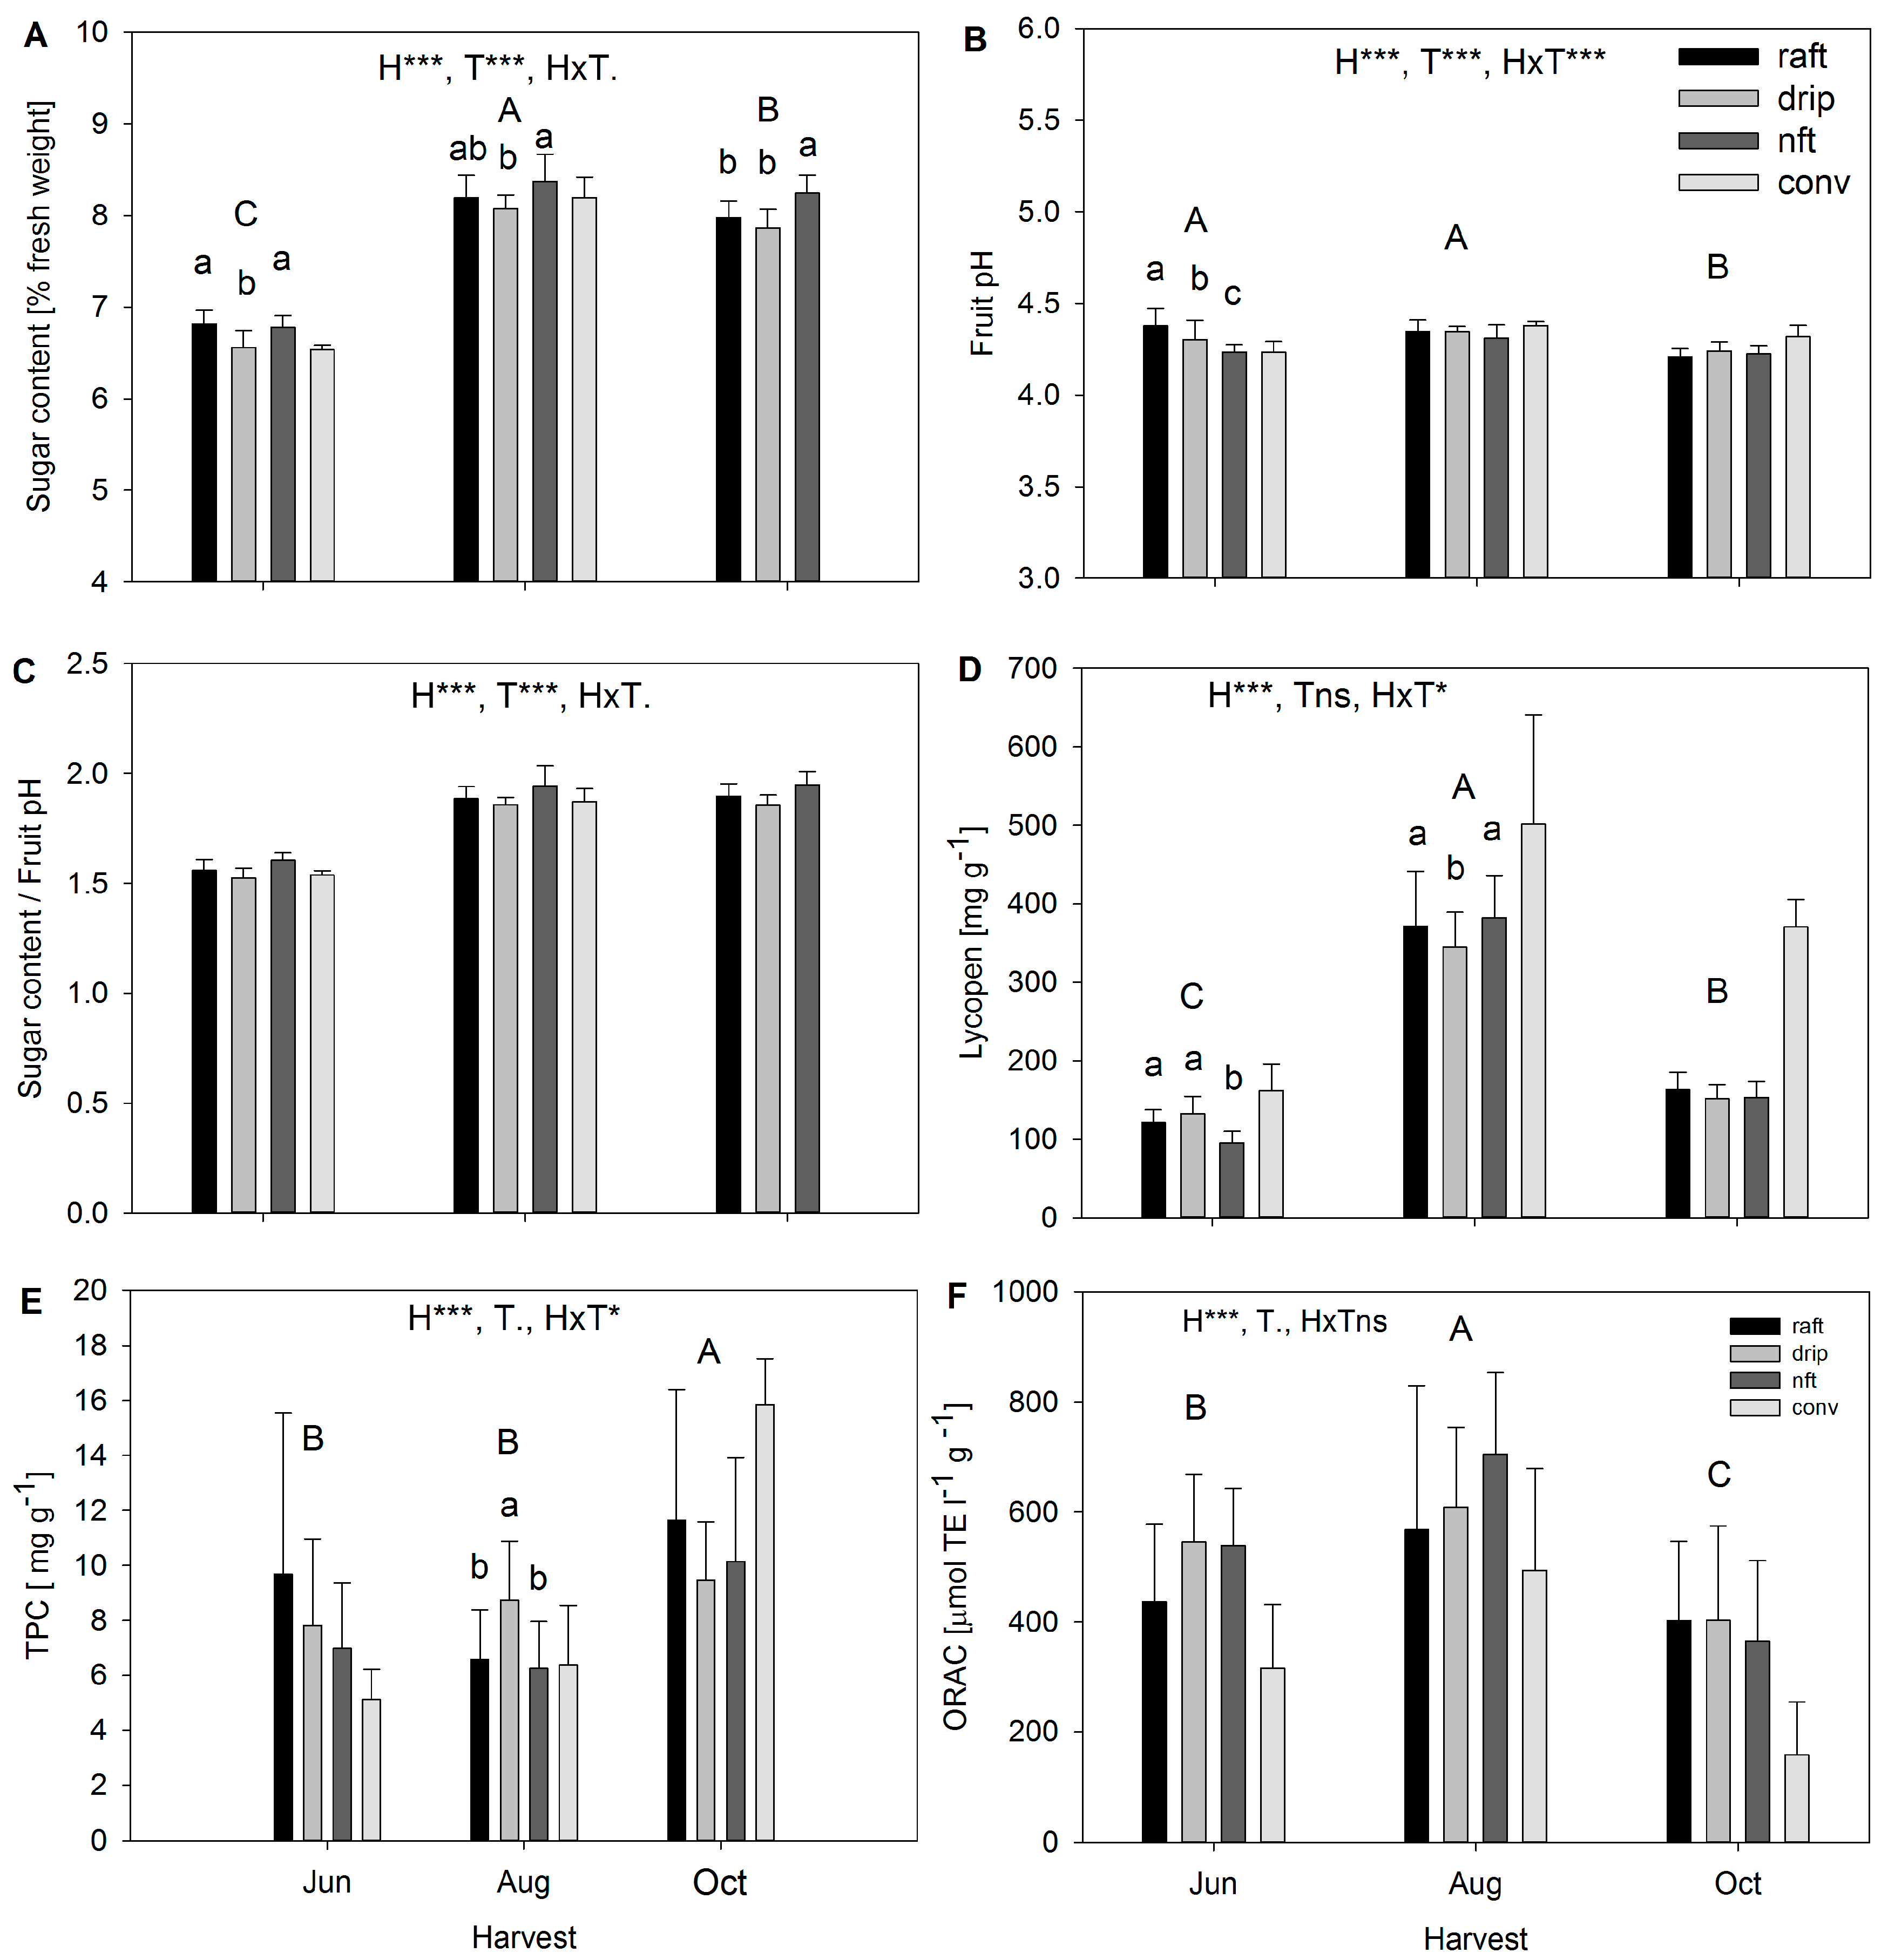
Fruit internal quality is defined by parameters such as the content of fat, lipids, proteins, vitamins, mineral nutrients and pigments [20], as well as health related parameters such as TPC and ORAC [37]. In this study, the sugar content of the investigated fruits was generally high and, as to be expected, the time of harvest had the greatest effect on fruit sugar content. The lowest sugar contents were found when the plants were young, and there was not as much available light (duration and intensity) as in the summer. Although significant, the differences between the HP subunits were small, at less than 0.5%. It is unlikely that this difference can be perceived by consumers, and thus it cannot be truly stated as an advantage or disadvantage for the given HP system. Nevertheless, it seems that the lower fruit sugar content in the drip irrigation system is related to the higher fruit biomass produced (significant only for cumulated yield and fruit number) and thus might be a dilution effect. There were no pronounced differences in fruit pH or sugar-to-fruit pH ratio, indicating that they were very little affected by the HP systems and thus most likely have a negligible effect on internal fruit quality. The observed lycopene concentrations were generally at the upper limit of the reported range of 20 to 400 μg·g−1 [20]. The differences between the HP systems were not consistent in the three harvests, indicating marginal effects of season on the lycopene content of the fruits. The same was true for TPC and ORAC content. The observed TPCs were in the middle of the range of 1.2 to 22 μg·g−1 fresh weight that has been reported for processed tomatoes [38]. The observed ORAC values were in the upper range of 12–323 μmol·TE·g−1 dry weight reported by Li et al. [37] for processed tomatoes and higher than reported in Zhou and Liangli [39].
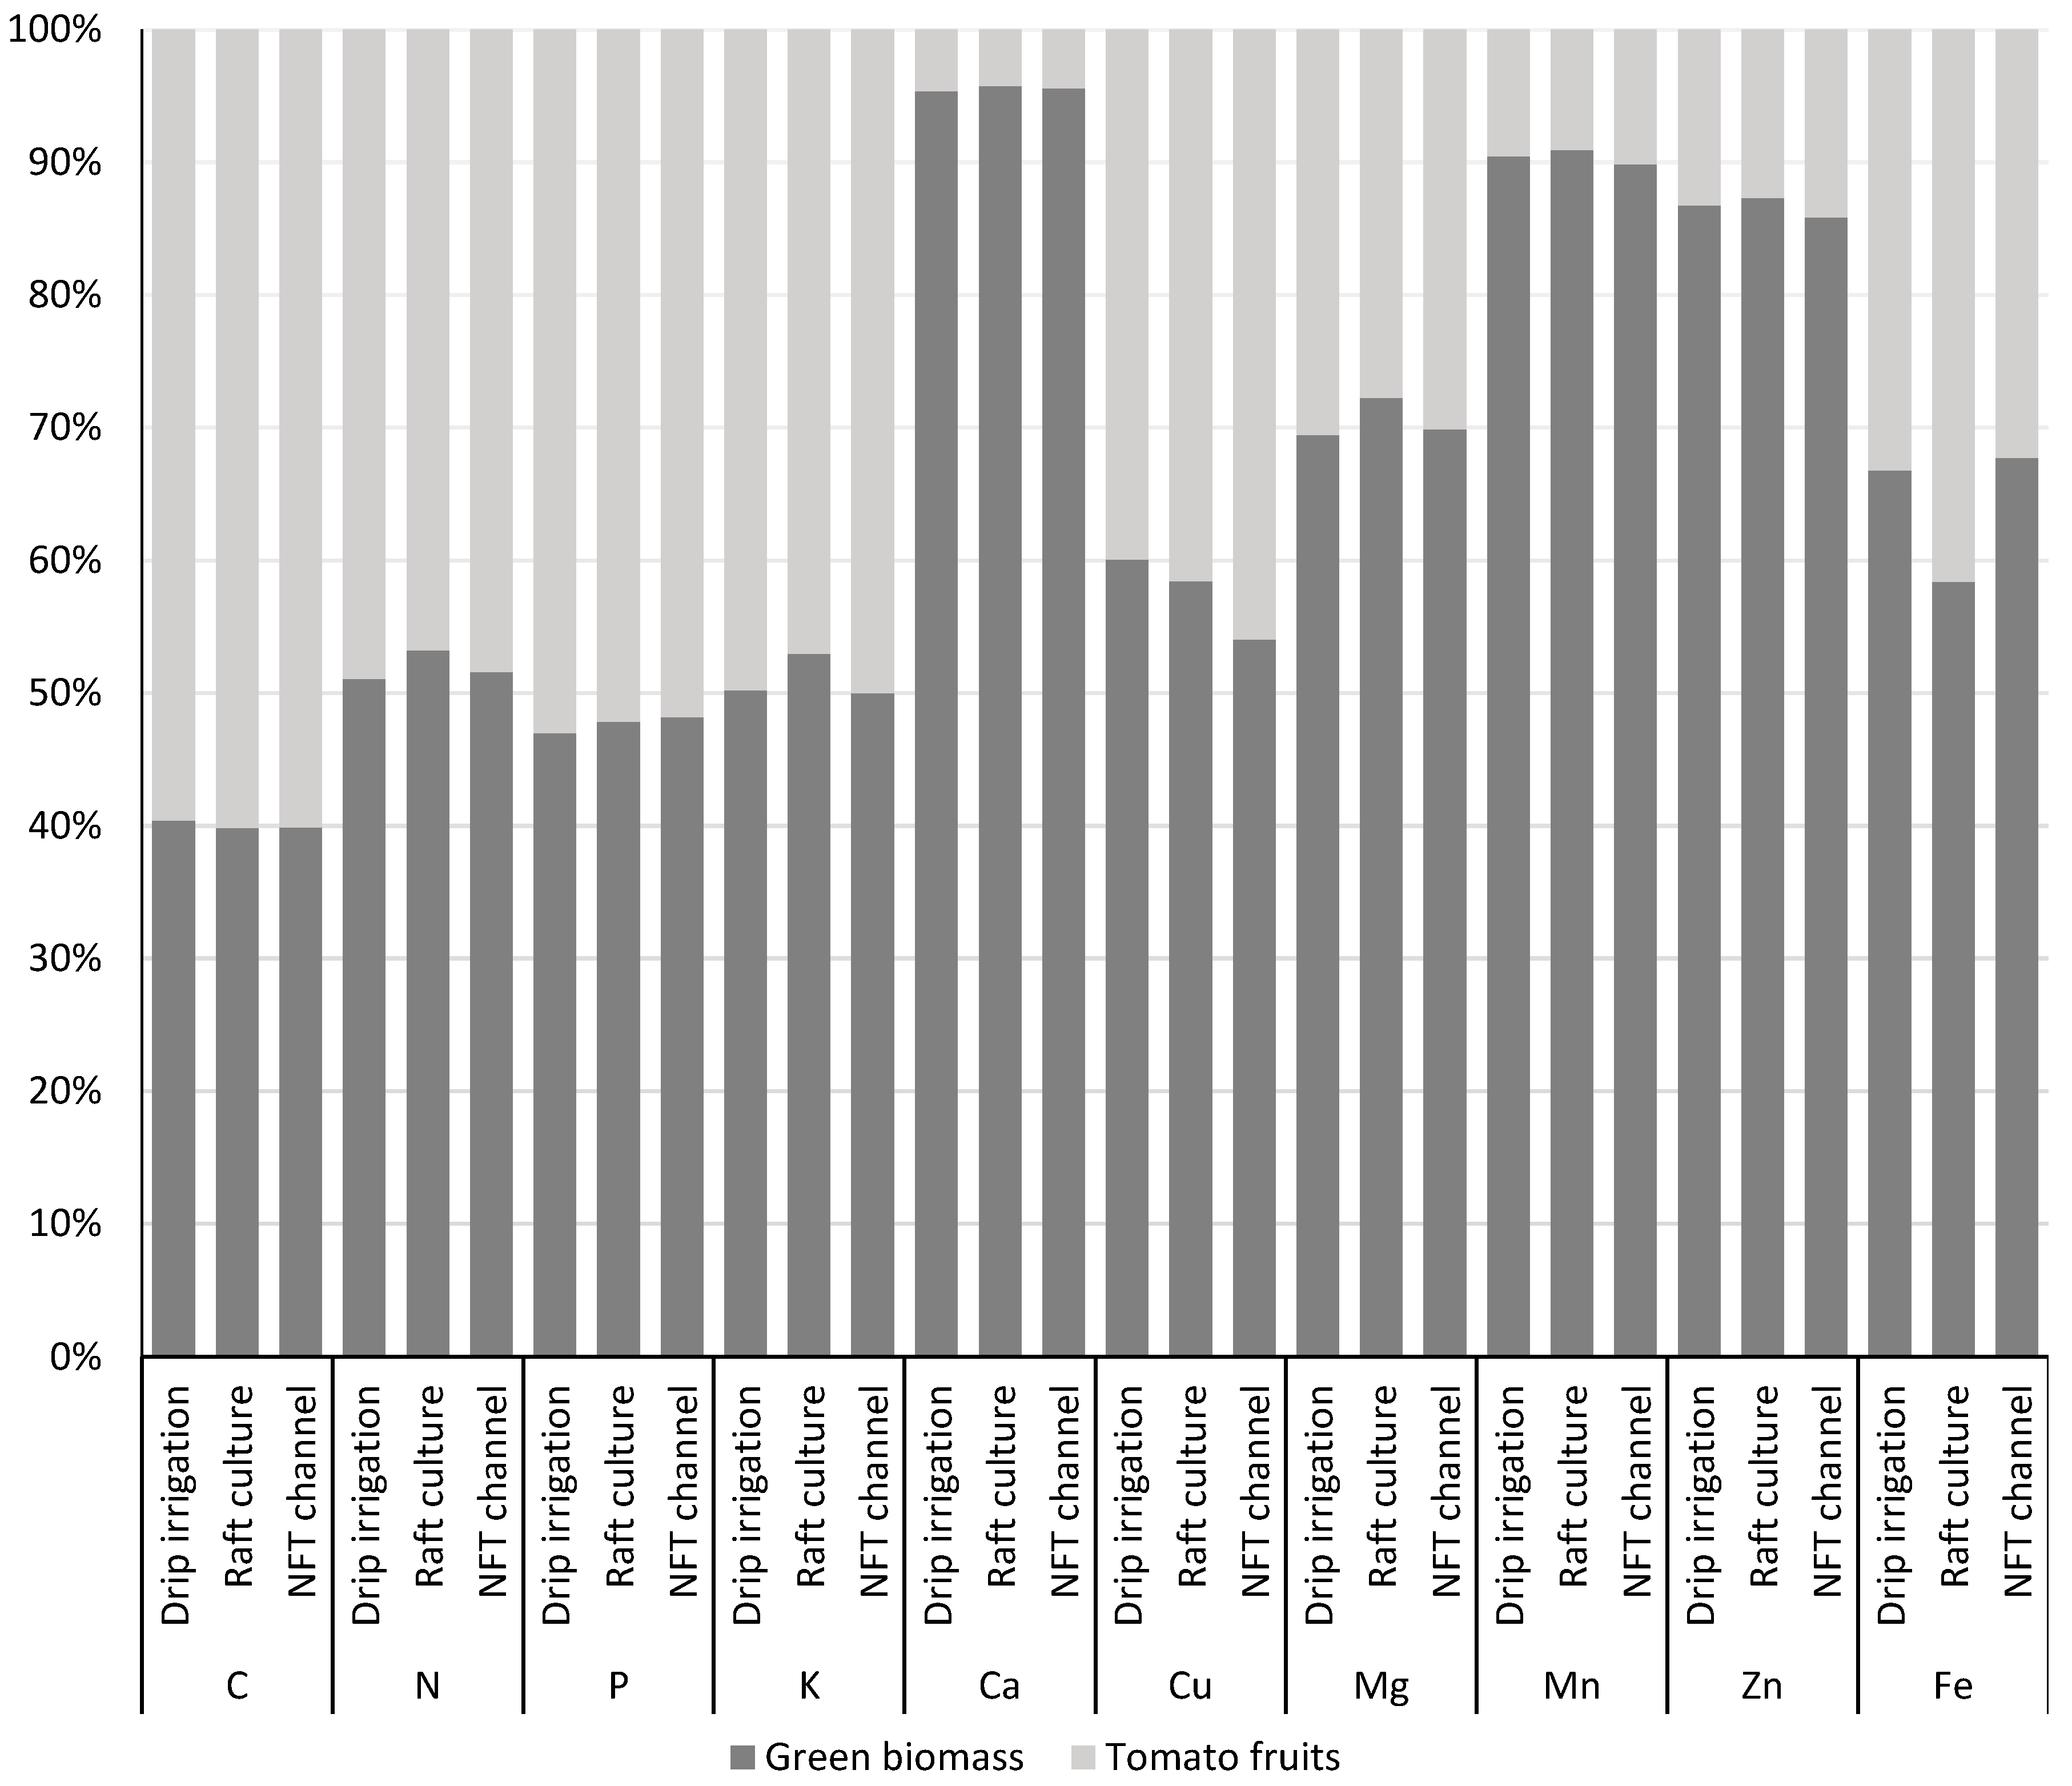
Fruit mineral contents of P, K, Ca, Mg were found to be in similar range to those reported for tomatoes in general, with Fe and Zn values higher in our study [20]. However, Dobromilska et al. [40] reported similar ranges for N, P, K, Ca, Mg, Fe and Zn in cherry tomato as those found in this study. This indicated that the tomatoes produced in our experiment have the expected mineral nutrient content for market cherry tomatoes. When comparing the HP systems, the only noteworthy difference was found for C and Mn. The lower C concentration in the raft culture is likely to be the result of higher water availability. The higher Mn concentrations found in the raft culture can probably be explained by the altered oxidative conditions in the standing water body rendering Mn to better plant available ions.
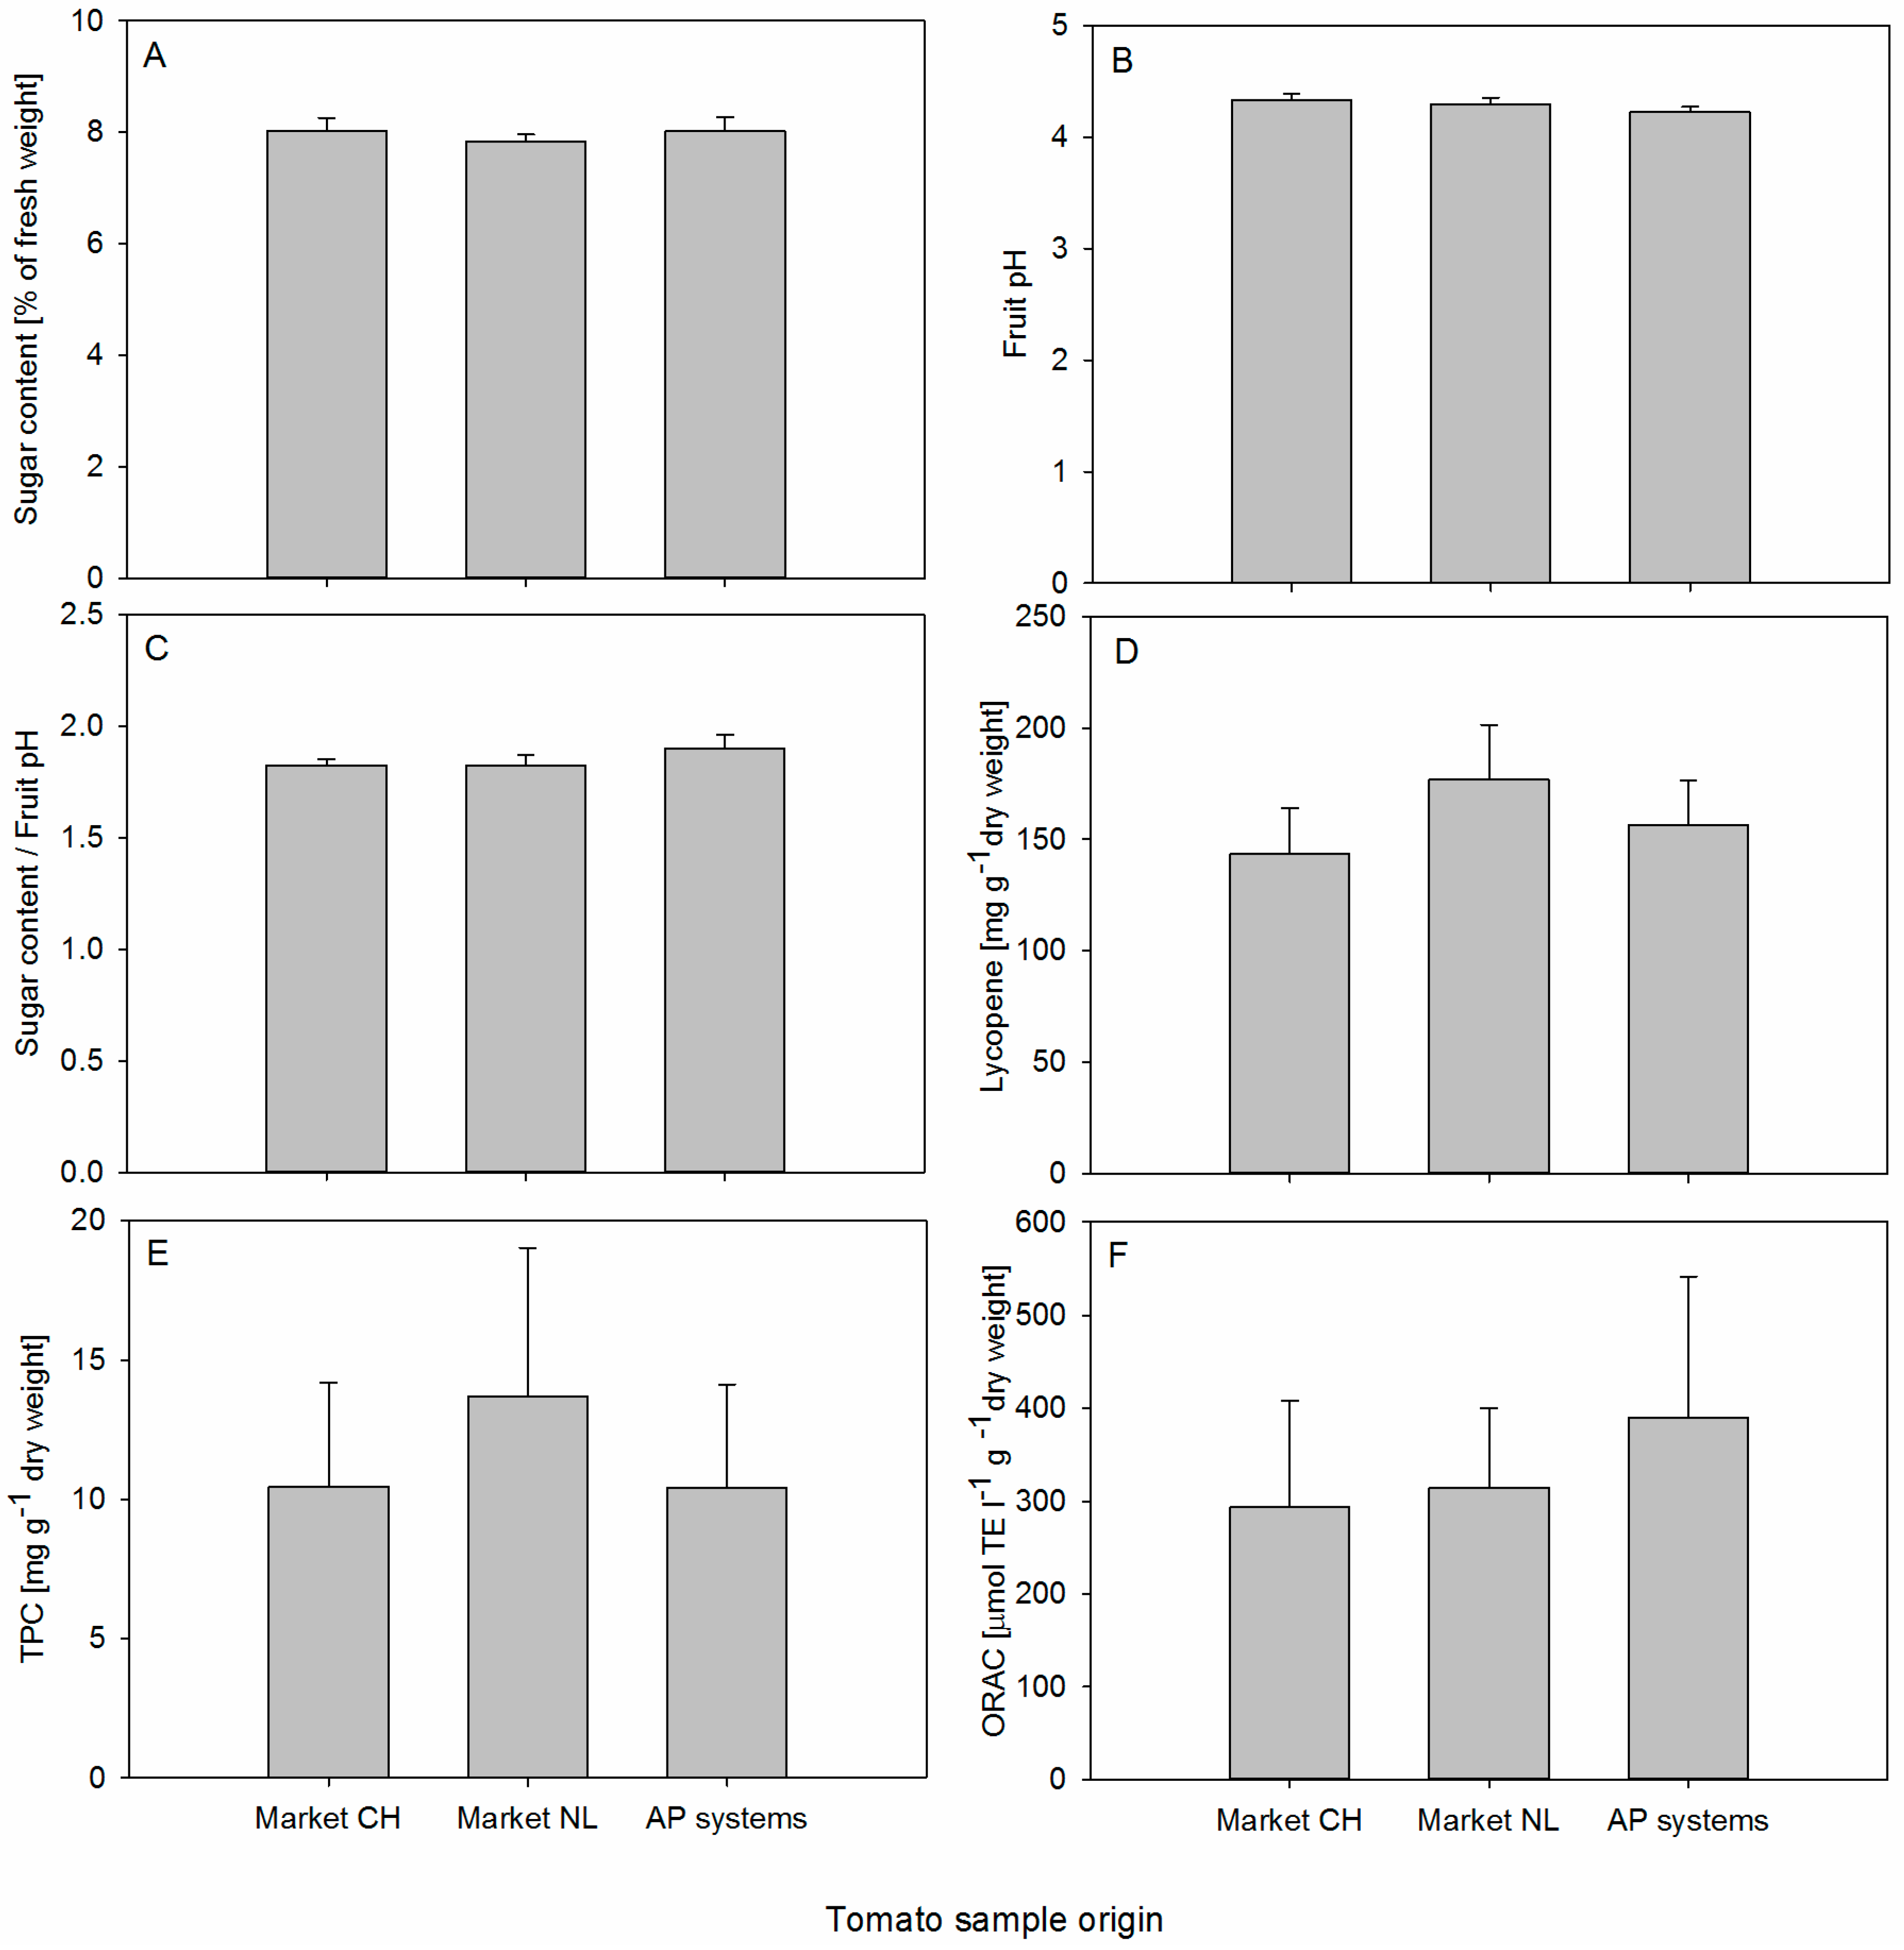
In general, the fruit quality parameters of the AP and commercially produced fruits were in the same range. Only in terms of lycopene did the commercial fruits tend to have higher contents, where lower ORAC contents were also observed. Whether this observation can be attributed to slightly different ripening stages (commercial fruits were harvested slightly later), fungal fruit infection at the third harvest of the commercially produced fruits, or to the slightly different mineral nutrition (discussed below) is not clear. The higher ORAC observed in the HP systems might indicate that AP production seems to be less stressful for the plants and thus seems to favor the production of high-quality tomatoes.
Even though literature [31] indicates that there might be interference between high sugar content and TPC measurements, our extracts were diluted by a high factor so that the sugar showed no effect on the TPC measurement. Therefore, a correction factor was not necessary. The comparison to values obtained from the supermarket tomatoes proved that tomato fruits from the AP systems reach the same or slightly better quality than tomatoes sold in stores.
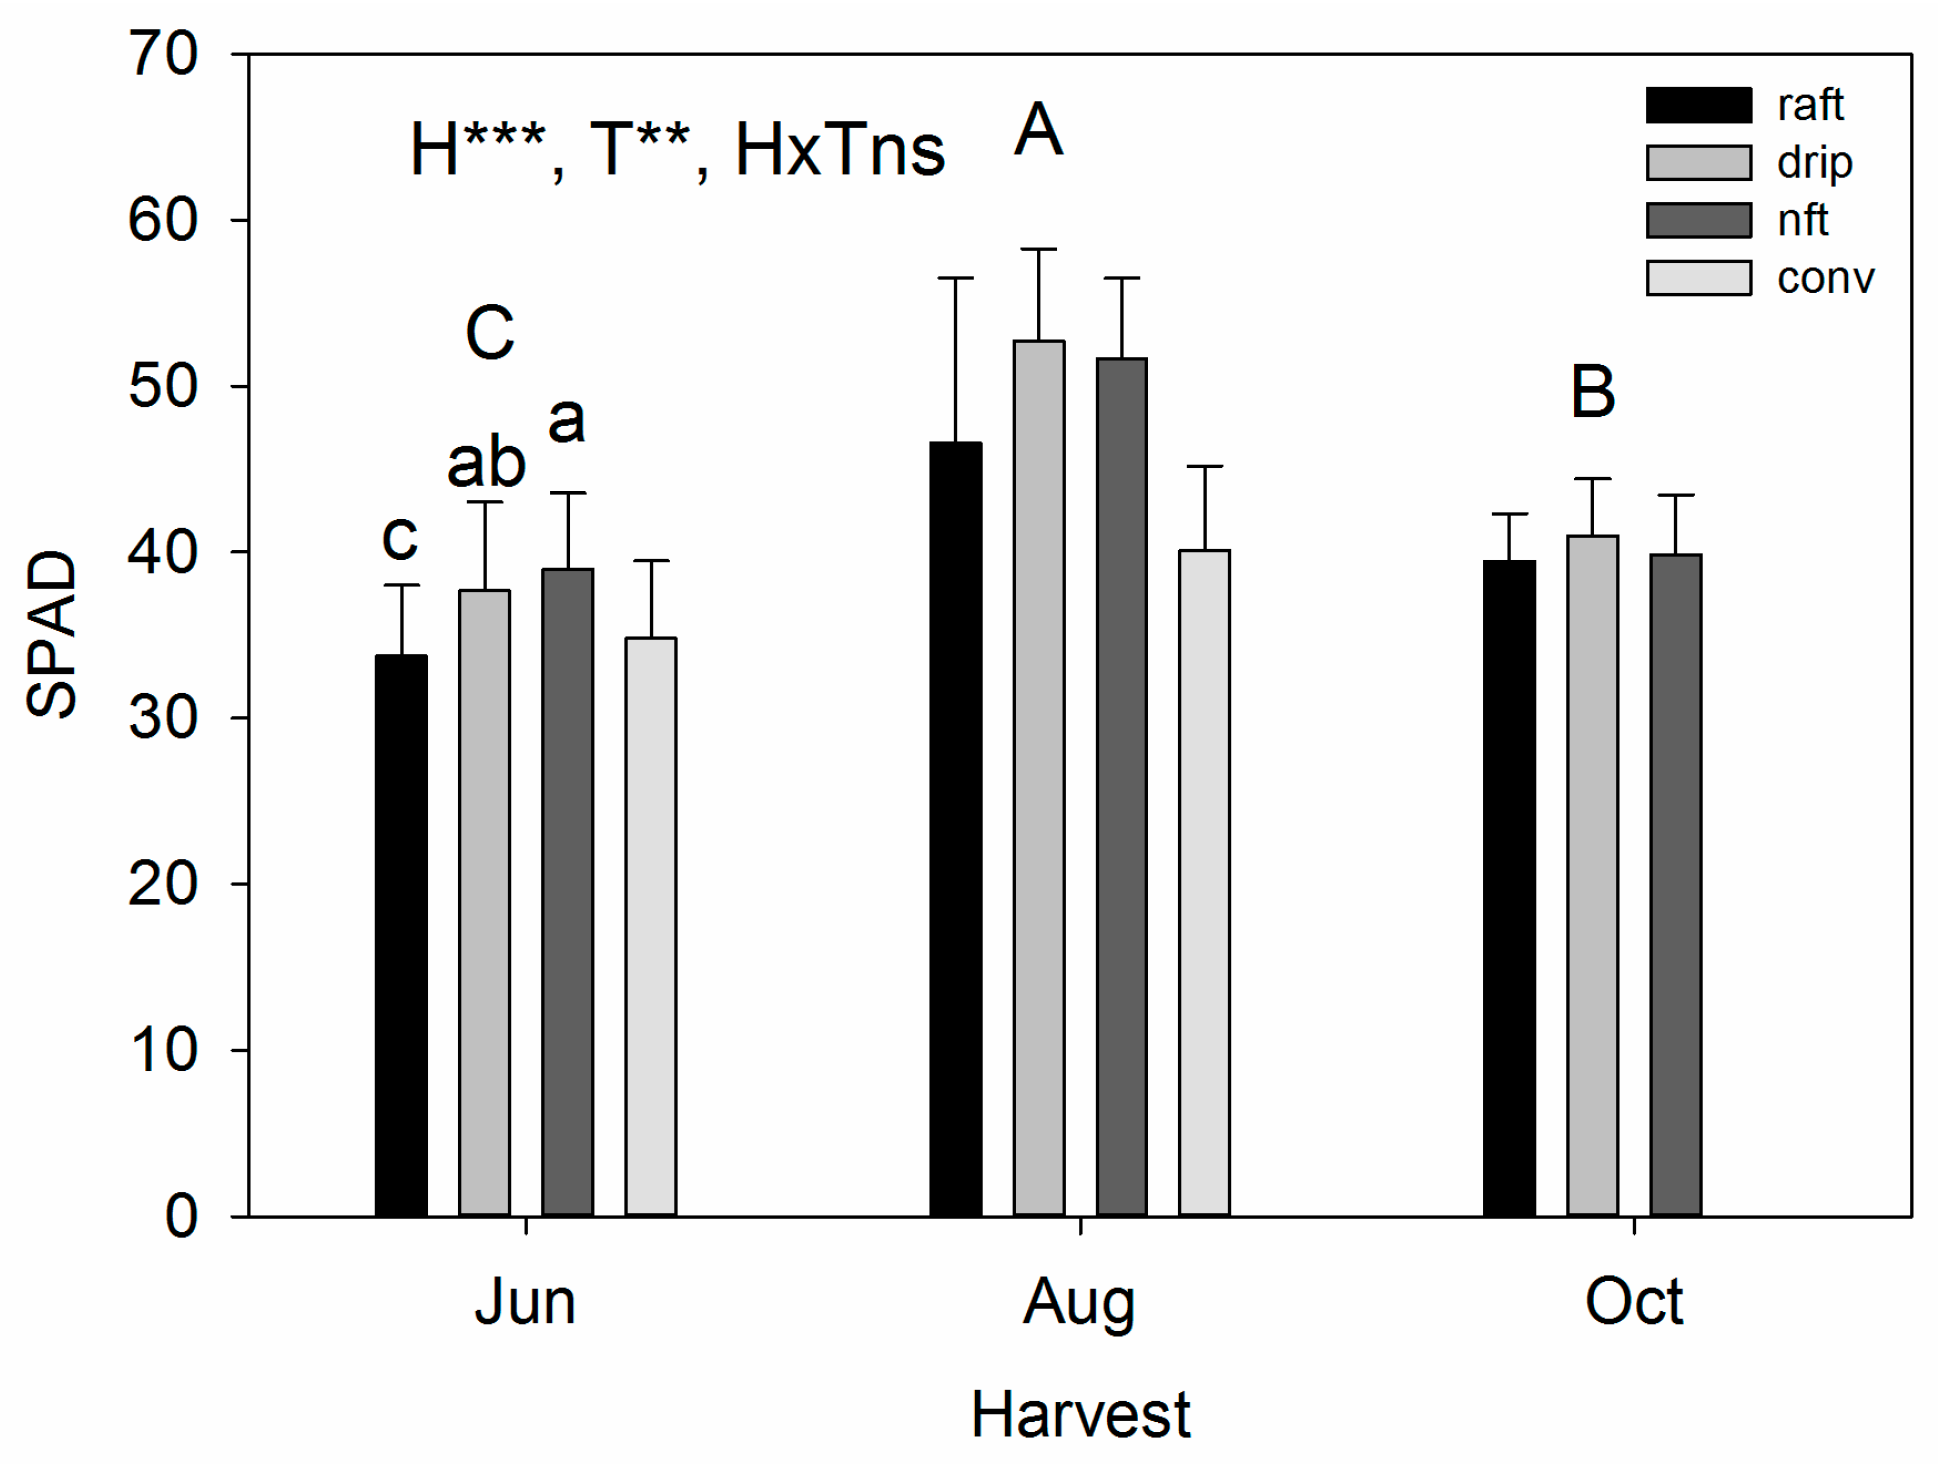
The higher SPAD values that correspond to the higher leaf chlorophyll contents observed in August and partly in October can be related to the N status as reflected by the leaf analysis which showed significantly lower leaf N concentration in June. This conclusion is supported by observations reported from Ulissi et al., and Fontes and de Araujo [41,42]. Fontes and de Araujo [42] reported a critical value of 37 mg·g−1: the values found in the June harvest and the others were close by. However, higher irradiation, as observed in August might also have affected leaf chlorophyll contents [
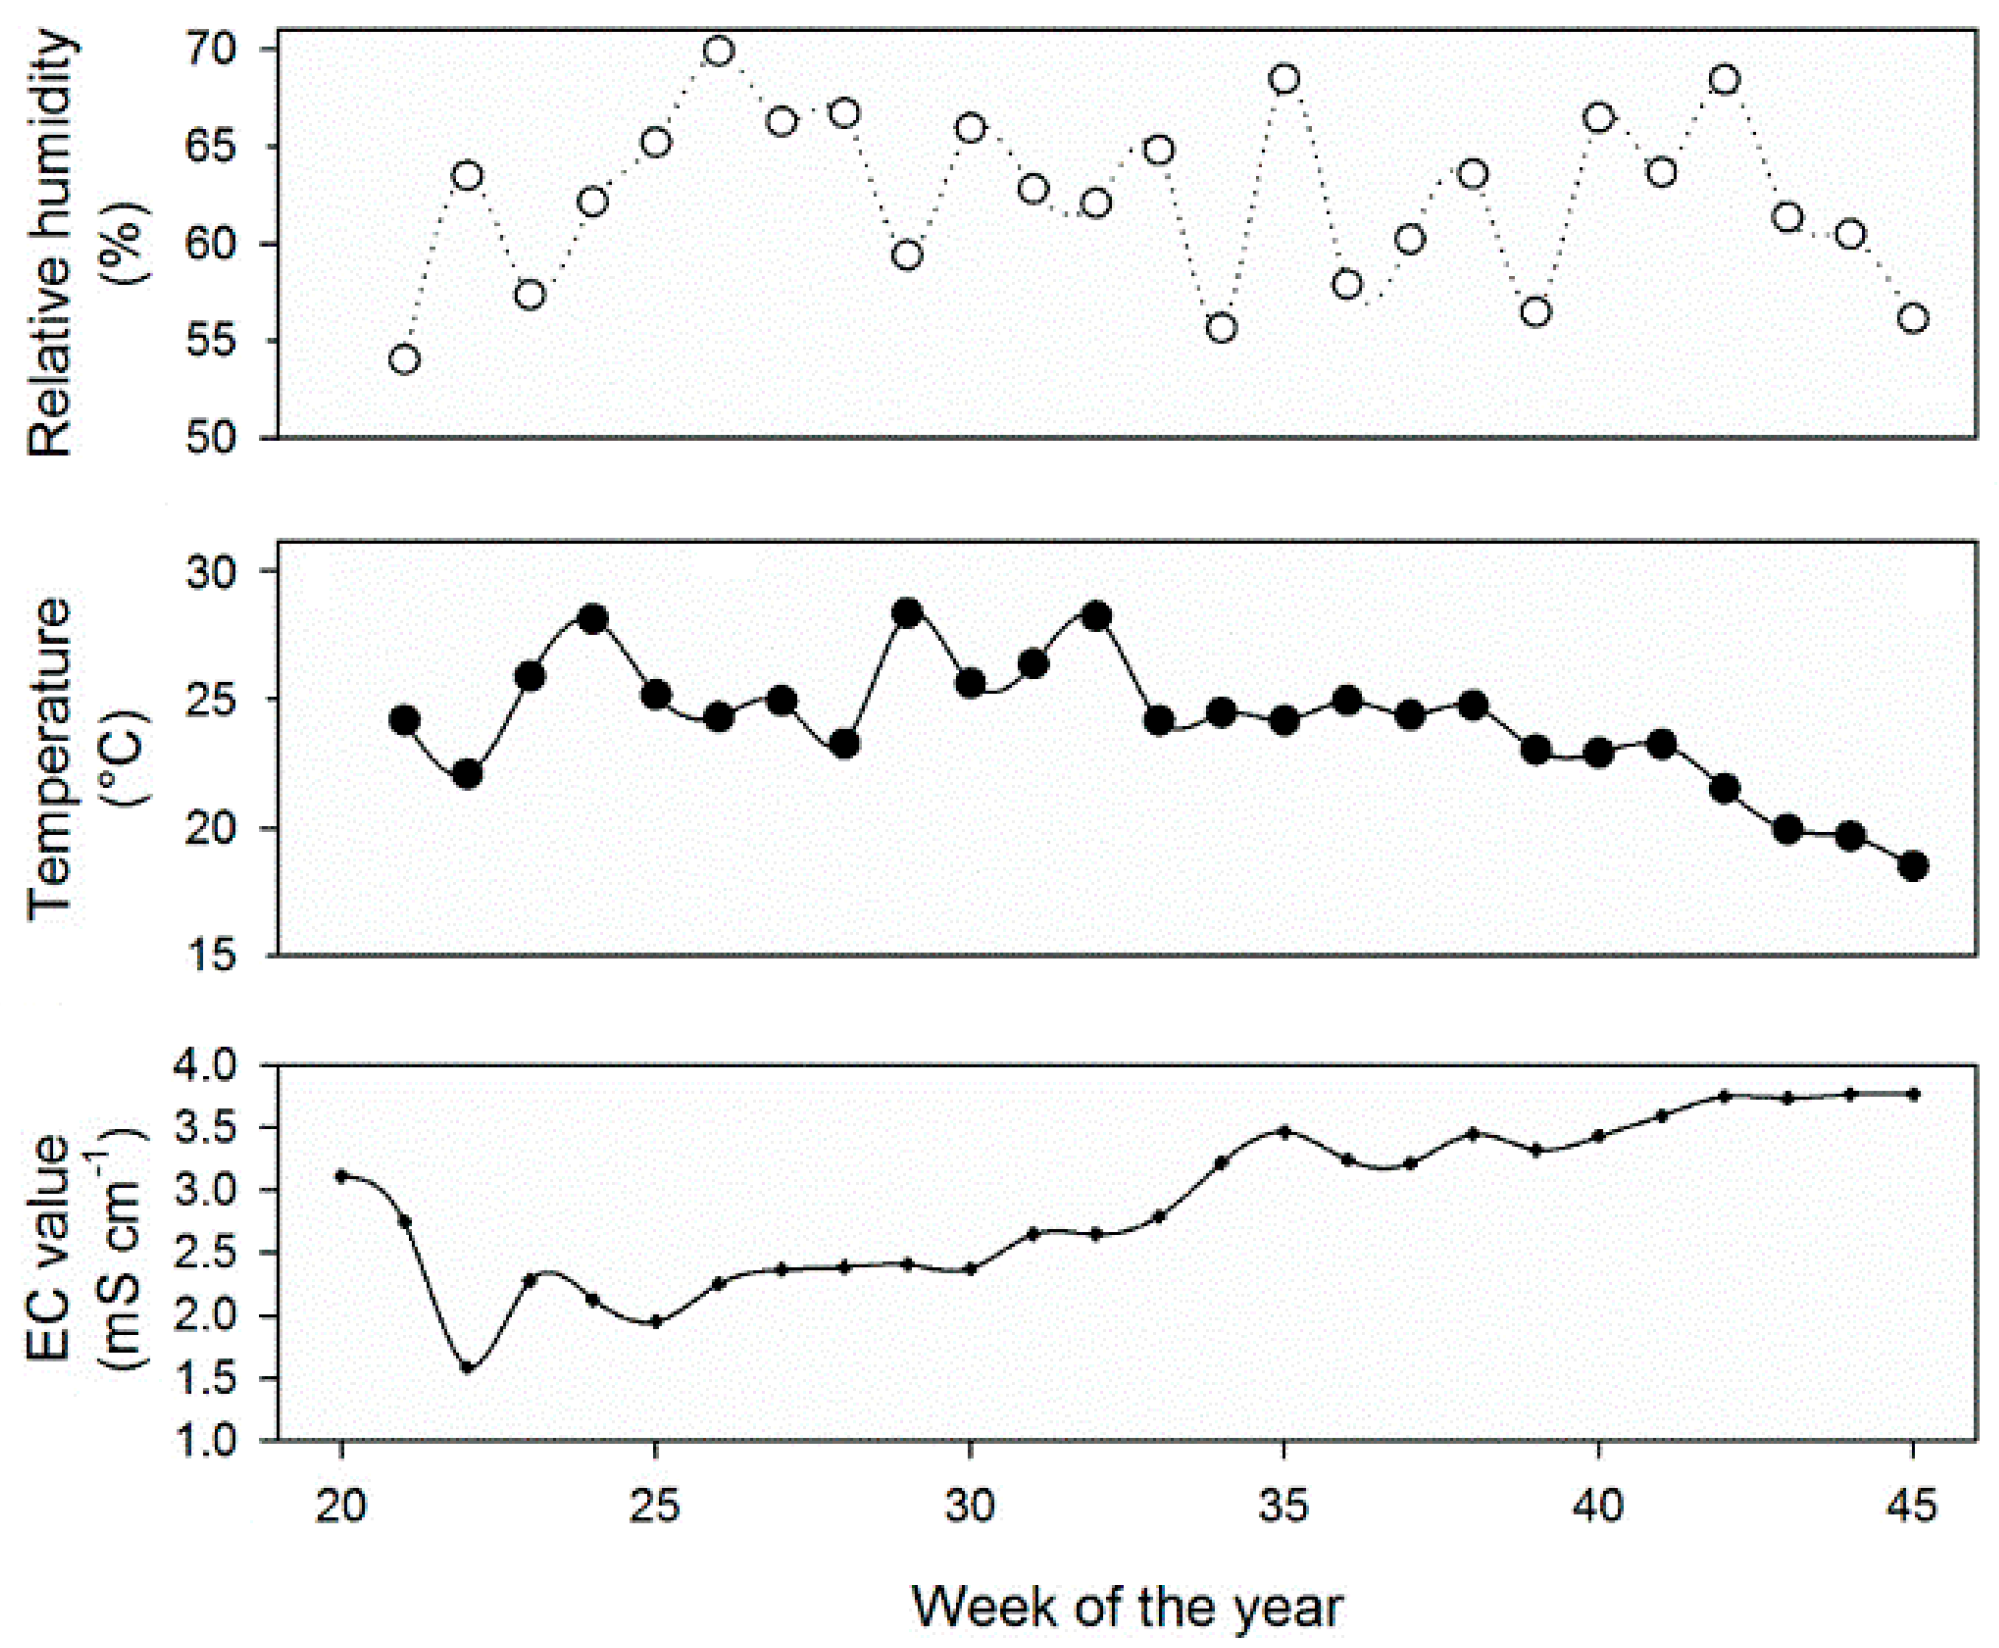
43]. Leaf stomatal conductance and temperature were mostly linked to prevailing environmental conditions reflected by time of harvest in our experiment. The growing systems did not affect either parameter. Despite the fact that commercially grown plants were measured on a different day at similar time, the weather condition values were in the same range.
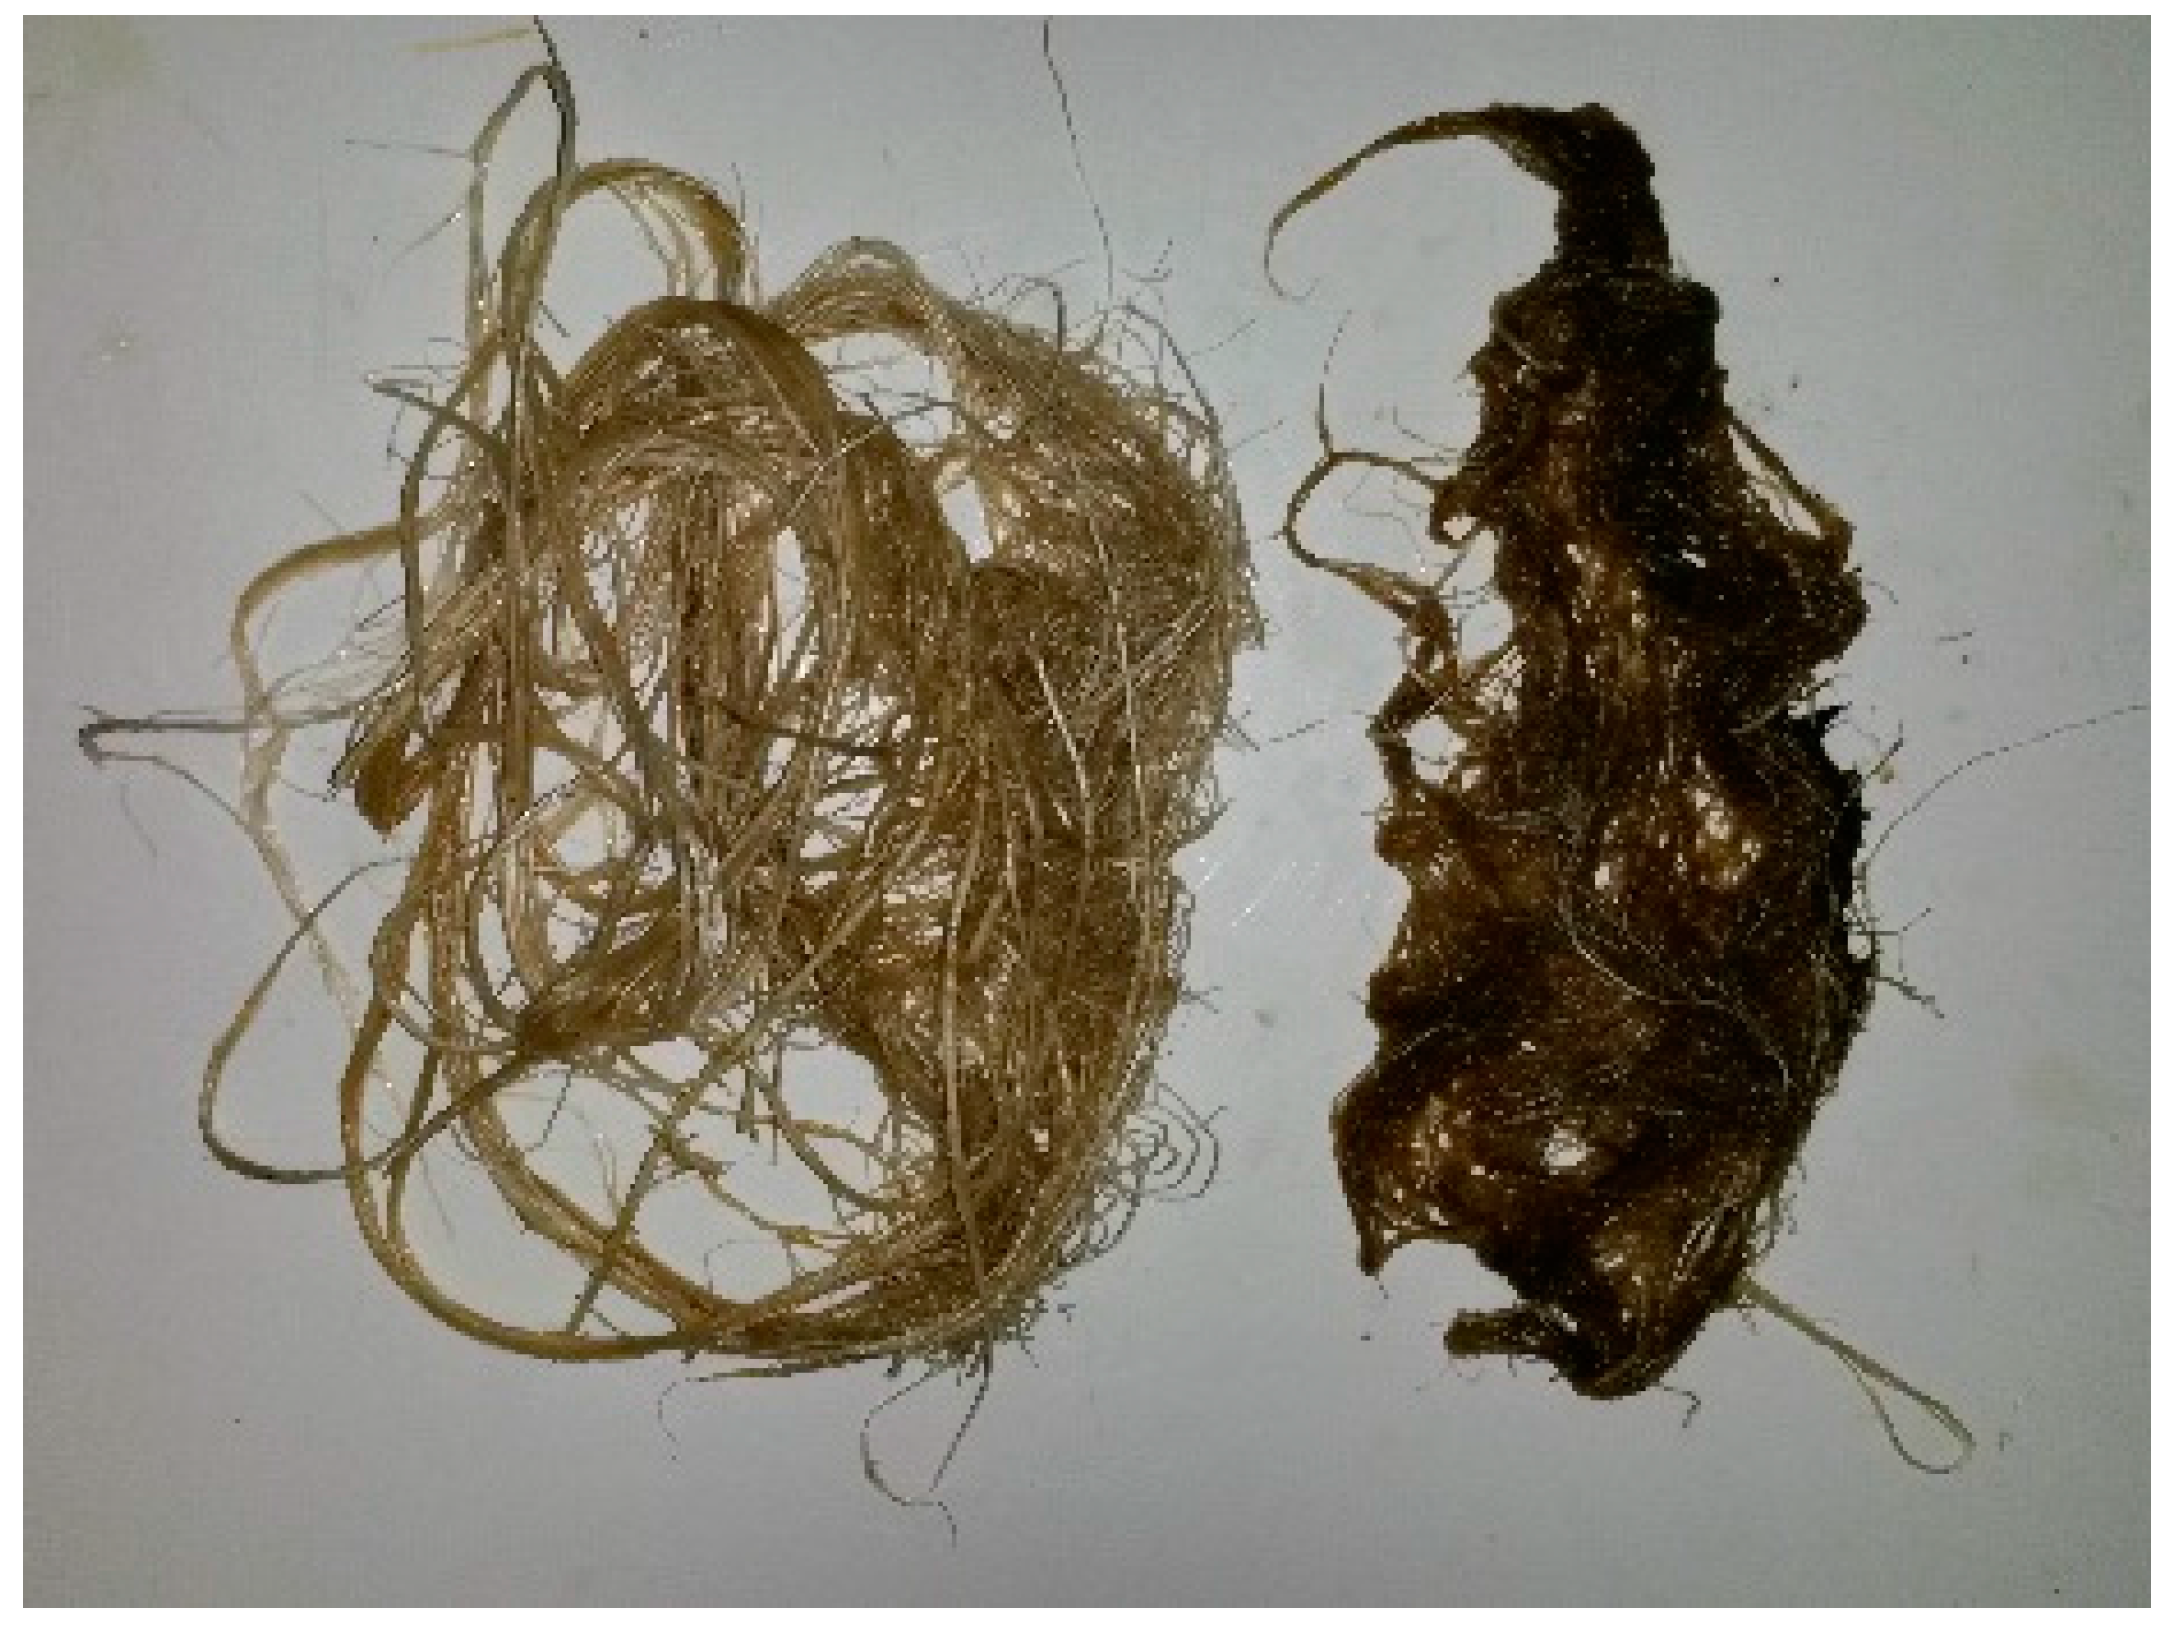
The leaf mineral analysis revealed that mineral nutrition of the AP plants was suboptimal at the beginning of the experiment and the first sampling harvest, when values below the sufficiency range reported by Adams [35] were found for P, K, S, Ca, Mg, Fe, Cu, and Zn. This suboptimal mineral nutrition was very likely caused by the lower productivity (fruit yield), plant vitality (SPAD) and fruit quality (sugar content) observed in the first harvest. Optimizing the nutrient availability during this initial harvesting phase would very likely increase the overall output and quality of tomato fruit from the AP systems. However, providing nutrients in the solution is not enough, it is also important to be aware of the root health status ensuring plants can absorb nutrients efficiently. Deficient leaf mineral concentrations of P were found in the three sampling harvests and were more pronounced in the first harvest. However, in the second and the third sampling harvests, the values of 3.6 and 3.3 mg·g−1, were only slightly below the reported sufficiency range of 4.0 to 6.5 mg·g−1 [35]. The fact that no yield reduction was observed compared to commercial production, where leaf P concentrations of 5.0 mg·g−1 were found (Table A3), indicated that lower leaf P concentrations can be sufficient for high yield cherry tomato production. In contrast, we found very high values for Mn, which even increased to toxic levels above 1000 μg·g−1 [35] during the season. Although, we did not observe negative effects on yield, the higher TPC contents in fruits might be a result of the higher Mn. To avoid negative effects, Mn availability should be better controlled in future studies.

5. Conclusions

This is, to our knowledge, the first comprehensive study of comparison of different hydroponic methods in aquaponic cultivation that combines the assessment of total yield fruit quality with the distribution of nutrients in the plants, and fruit internal quality of the tomato. As tomatoes have a long vegetation cycle (up to eight months), studies on tomato are generally scarce. In comparison to the literature, the study showed that cherry tomatoes grown in aquaponic systems achieved similar yield and fruit quality to their counterparts grown independent of the method of cultivation implemented. The slightly higher ORAC content of fruits compared to the commercially produced HP control or supermarket derived tomatoes might indicate a potential for producing fruits that are also healthier for the consumer. The drip irrigation system performed better than the raft culture and NFT systems. There were only marginal effects on plant mineral status, indicating that all three systems can be applied successfully. However, the lower dry matter content, fruit quality and potentially increased risk of partly anoxic conditions and slightly altered nutrient availability in the root zone might indicate that the raft culture is less appropriate for the AP production of cherry tomatoes. Future studies should focus on comparisons with commercial production and optimizing nutrient availability to ensure good yields and prevent enrichment of nutrient minerals to toxic levels.

Acknowledgments

We thank ERASMUS Student Mobility Grant for partial financing of Zala Schmautz’s exchange semester at the ZHAW and the ZHAW IUNR for supporting the experiment financially. We would also like to thank Fridolin Tschudi and Max Mayer for planning and building the settlers; Theo H. M. Smits for reading and commenting on the manuscript; Darren Mace for language editing; Gabriela Gottschalk and Beat Häcki, interns at ZHAW for their support during the experiment; Bjørn Studer from the soil protection group of the ETH for support in the mineral nutrient analysis; and Annika Ackermann from the ISO Lab of the ETH Zurich for help with the C and N measurements.

Author Contributions

Zala Schmautz, Alex Mathis and Andreas Graber conceived and designed the experiments. Zala Schmautz, Andreas Graber, Alex Mathis, Fionna Loeu and Frank Liebisch performed the experiment. Zala Schmautz, Fionna Loeu and Frank Liebisch performed measurements. Zala Schmautz, Fionna Loeu and Frank Liebisch analyzed the data. Ranka Junge was the main supervisor for the entire project. Tjaša Griessler Bulc supervised the Master’s thesis of Zala Schmautz and Frank Liebisch supervised the Master’s thesis of Fionna Loeu on which this paper is based. All authors contributed to discussions and writing of the paper.

Conflicts of Interest

The authors declare no conflict of interest.

Appendix A

Table A1. Application of beneficial organisms, pesticides and their applied concentrations on tomato plants in “Wädenswil aquaponic system” in 2014.
Plant Protection (Provider)FunctionApplication Dates (Day/Month, Where Applicable) and Concentrations
Encarsia formosa (Andermatt Biocontrol)Combating white fly22/04, 05/05, 03/06, 17/06, 01/07, 08/07, 14/07, 29/7, 11/8, 26/8
Ichneumons (Andermatt Biocontrol)Combating aphids22/04, 05/05, 03/06, 17/06, 01/07, 11/8, 26/8
Phytoseiulus (Andermatt Biocontrol)Combating spider mites01/07, 08/07, 14/07, 29/07
Bumble bees (Andermatt Biocontrol)Pollination25/03, 11/08
Natural (Andermatt Biocontrol)Combating aphids and spider mites24/06 1 (1%), 26/07 1 (1%), 22/07 3 (1%), 29/09 3 (1%), 09/08 1 (1%)
Pegasus (Syngenta)Combating spider mites14/07 3 (0.15%), 15/07 2 (0.15%), 22/07 2 (0.15%), 29/07 2 (0.15%), 09/08 1 (0.075%)
Envidor (Bayer Crop Science)Combating spider mites09/08 1 (0.04%)
Notes: 1 Application on the whole plant; 2 Application on the upper half of the plant; 3 Application on the lower half of the plant.
Table A2. Fish feed (in kilograms) fed to tilapia during the experiment.
Fish FeedProducerSystem ASystem BSystem C
Tilapia Vegi 3.0Hokovit, Hofmann Nutrition AG (Bützberg, CH)3.833.833.83
Tilapia Vegi 4.5Hokovit, Hofmann Nutrition AG (Bützberg, CH)51.1951.9251.96
Tilapico TEMPO 4.5Coppens International B.V. (Helmond, NL)13.4013.4013.40
Primo float 37/12 4.5Aller Aqua A/S (Christiansfeld, DK)20.9520.9320.93
EFICO Alpha 838F Tilapia 3.0BioMar Group (Aarhus C, DK)10.0010.0010.00
Table A3. Leaf and fruit mineral nutrient concentrations of the commercially produced tomato.
Mineral NutrientLeaf AnalysisFruit Analysis
1st Harvest2nd Harvest1st Harvest2nd Harvest3rd Harvest
C (mg·g−1)325.0359.0403.6393.2391.7
N (mg·g−1)40.040.019.814.318.8
P (mg·g−1)2.05.01.64.66.3
K (mg·g−1)24.058.012.938.147.2
S (mg·g−1)8.025.00.51.21.7
Mg (mg·g−1)2.04.00.41.11.2
Fe (μg·g−1)36.0175.020.740.460.4
Ca (mg·g−1)14.041.00.30.81.4
Cu (mg·g−1)2.08.02.04.413.2
Mn (μg·g−1)336.01564.09.039.135.5
Zn (μg·g−1)7.058.05.716.422.4
Figure A1. Tomato plants in raft culture subunit (C9) affected by spider mites at the end of June 2014.
Water 08 00533 g008
Figure A2. Tomatoes in all hydroponic units affected by blossom-end rot disease at the end of September 2014.
Water 08 00533 g009
Figure A3. Cutting of the roots on both sides of the NFT channel over a period of a few days.
Water 08 00533 g010
Figure A4. Difference between healthy roots in the middle and rotten roots in the corners of the raft culture basin.
Water 08 00533 g011
Figure A5. Rotten roots on the bottom of the NFT channels (bottom); and healthy roots in drip irrigation (top).
Water 08 00533 g012
Figure A6. Tomato plants (Solanum lycopersicum L. cv. ‘Gardenberry F1’ (Hild)) in summer 2014 in the Wädenswil aquaponic system.
Water 08 00533 g013
Figure A7. Average cumulative yield (n = 3) per hydroponic subunit of all three quality categories from the “Wädenswil aquaponic system”, 2014.
Water 08 00533 g014

References

  1. Food and Agriculture Organization of the United Nations (FAO). Economic Valuation of Water Resources in Agriculture: From the Sectoral to a Functional Perspective of Natural Resource Management; FAO Water Reports 27; FAO: Rome, Italy, 2004; Available online: ftp://ftp.fao.org/agl/aglw/docs/wr27e.pdf (accessed on 13 June 2016).
  2. European Commission. Environmental Impact of Products (EIPRO). Analysis of the Life Cycle Environmental Impacts Related to the Final Consumption of the EU-25. Technical Report. 2006. Available online: http://ec.europa.eu/environment/ipp/pdf/eipro_report.pdf (accessed on 5 September 2016).
  3. Population Division, Department of Economic and Social Affair, United Nations. World Urbanization Prospects: The 2014 Revision, Highlights (ST/ESA/SER.A/352); United Nations: New York, NY, USA, 2014. [Google Scholar]
  4. De Zeeuw, H.; Drechsel, P. (Eds.) Cities and Agriculture: Developing Resilient Urban Food Systems; Routledge: London, UK, 2015.
  5. Graber, A.; Junge, R. Aquaponic Systems: Nutrient recycling from fish wastewater by vegetable production. Desalination 2009, 246, 147–156. [Google Scholar] [CrossRef]
  6. Licamele, A. Biomass Production and Nutrient Dynamics in an Aquaponics System; The University of Arizona: Tucson, AZ, USA, 2009. [Google Scholar]
  7. Endut, A.; Jusoh, A.; Ali, N.; Wan Nik, W.B. Nutrient removal from aquaculture wastewater by vegetable production in aquaponics recirculation system. Desalination Water Treat. 2011, 32, 422–430. [Google Scholar] [CrossRef]
  8. Rakocy, J.E.; Bailey, D.S.; Shultz, R.C.; Thoman, E.S. Update on tilapia and vegetable production in the UVI aquaponic system). In New Dimensions on Farmed Tilapia, Proceedings of the Sixth International Symposium on Tilapia in Aquaculture, Manila, Philippines, 12–16 September 2004; pp. 12–16.
  9. Resh, H.M. Hydroponic Food Production: A Definitive Guide of Soilless Food-Growing Methods; Woodbridge Press Publisher Company: Beaverton, OR, USA, 2001. [Google Scholar]
  10. Al-Hafedh, Y.S.; Alam, A.; Beltagi, M.S. Food production and water conservation in a recirculating aquaponic system in Saudi Arabia at different ratios of fish feed to plants. J. World Aquac. Soc. 2008, 39, 510–520. [Google Scholar] [CrossRef]
  11. Castellani, D.; Camargo, A.F.M.; Abimorad, E.G. Aquaponics: Use of the effluent from the secondary nursery of Macrobrachium amazonicum for the production of hydroponic lettuce (Lactuca sativa) and watercress (Rorippa nasturtium aquaticum). Bioikos 2009, 23, 67–75. [Google Scholar]
  12. Bulc, T.G.; Slak, A.Š.; Kompare, B.; Jarni, K.; Klemenčič, A.K. Innovative Aquaponic Technologies for Water Reuse in Cyprinid Fish Farms. Balkan Water Observation and Information System for Decision Support—BALWOIS 2012—Ohrid, Republic of Macedonia—28 May, 2 June 2012. Available online: http://www.cgsplus.si/Portals/1/Raziskovalno%20razvojna%20dejavnost/clanki/BALWOIS_EUREKA_OBJAVLJENO.pdf (accessed on 8 April 2015).
  13. Klemenčič, A.K.; Bulc, T.G. The use of vertical constructed wetland and ultrasound in aquaponic systems. Environ. Sci. Pollut. Res. 2015, 22, 1420–1430. [Google Scholar] [CrossRef] [PubMed]
  14. Adler, P.R.; Harper, J.K.; Wade, E.M.; Takeda, F.; Summerfelt, S.T. Economic analysis of an aquaponic system for the integrated production of rainbow trout and plants. Int. J. Recirc. Aquac. 2000. [Google Scholar] [CrossRef]
  15. Lennard, W.A.; Leonard, B.V. A comparison of three different hydroponic sub-systems (gravel bed, floating and nutrient film technique) in an Aquaponic test system. Aquac. Int. 2006, 14, 539–550. [Google Scholar] [CrossRef]
  16. Diver, S. Aquaponics-Integration of Hydroponics with Aquaculture; Agriculture Information Service: Fayetteville, AR, USA, 2000; Available online: http://www.extension.org/mediawiki/files/2/28/Hydroponics_with_Aquaculture.pdf (accessed on 13 April 2015).
  17. Savidov, N. Evaluation and Development or Aquaponics Production and Product Market Capabilities in Alberta. Available online: http://cichlidfish.net/Ebooks/CA-04-01-001.pdf (accessed on 12 September 2014).
  18. FAOstat: Statistical Data. 2012. Available online: http://faostat.fao.org/site/567/DesktopDefault.aspx?PageID=567#ancor (accessed on 1 December 2014).
  19. Aubé, E.D.; Poole, F.H. Tomatoes—Agricultural Procedures, Pathogen Interactions and Health Effects; Nova Science Publishers, Inc.: New York, NY, USA, 2010. [Google Scholar]
  20. Higashide, T. Tomatoes: Cultivation, Varieties and Nutrition; No. 635.6427 T6; Nova Science Publishers, Inc.: New York, NY, USA, 2013. [Google Scholar]
  21. Liebisch, F.; Max, J.F.; Heine, G.; Horst, W.J. Blossom-end rot and fruit cracking of tomato grown in net-covered greenhouses in Central Thailand can partly be corrected by calcium and boron sprays. J. Plant Nutr. Soil Sci. 2009, 172, 140–150. [Google Scholar] [CrossRef]
  22. Resh, H.M. Hydroponics Tomatoes; Woodbridge Press Publishing Co.: Anaheim, CA, USA, 1997. [Google Scholar]
  23. Mayer, M. Verfahren zur Nährstoffrückgewinnung und Feststoffabscheidung aus Trommelfilterspülwasser in Aquaponics-Systemen. Bachelor’s Thesis, Fachhochschule Weihenstephan-Triesdorf, Freising, Germany, 2014. [Google Scholar]
  24. Pflanzenschutzmittelverzeichnis (Continuously Updated, Stand 2014). Available online: http://www.psm.admin.ch/psm/kulturen/index.html?lang=de&item=10027 (accessed on 5 May 2014).
  25. Van de Vooren, J.; Welles, G.W.H.; Hayman, G. Glasshouse crop production. In The Tomato Crop; Atherton, J.G., Rudich, J., Eds.; Chapman & Hall: London, UK, 1986; pp. 281–334. [Google Scholar]
  26. Freund, M. Hauptkultur Gewächshaustomaten und Verwandte Kulturen. Gemüsebau unter Glas; Band III; Inforama Seeland: Ins, Switzerland, 2006. [Google Scholar]
  27. Fernandez, D. HydroBuddy: An Open Source Nutrient Calculator for Hydroponics and General Agriculture, v1.5. 2013. Available online: http://scienceinhydroponics.com (accessed on 5 May 2014).
  28. Swisscofel. Cherrytomate (Lycopersicum lycopersicum var. Cerasiforme); Schweizerische Qualitätsbestimmungen für Gemüse: Berne, Switzerland, 2015. [Google Scholar]
  29. Anthon, G.; Barrett, D.M. Standardization of a rapid spectrophotometric method for lycopene analysis. Acta Hortic. 2007, 758, 111–128. [Google Scholar] [CrossRef]
  30. Garrett, A.R.; Murray, B.K.; Robison, R.A.; O’Neill, K.L. Measuring Antioxidant Capacity Using the ORAC and TOSC Assays. In Advanced Protocols in Oxidative Stress II; Armstrong, D., Ed.; Humana Pres: Totowa, NJ, USA, 2010; pp. 251–262. [Google Scholar]
  31. Waterhouse, A.L. Determination of total phenolics. Curr. Protoc. Food Anal. Chem. 2002. [Google Scholar] [CrossRef]
  32. R-Development-Core-Team. R: A Language and Environment for Statistical Computing; R Foundation for Statistical Computing: Vienna, Austria, 2008; Available online: http://www.R-project.org (accessed on 1 December 2014).
  33. Lattauschke, G. Gewächshaustomaten. Sächsische Landesanstalt für Landwirtschaft; Brochure; Fachbereich Pflanzliche Erzeugung: Leipzig, Germany, 2004. [Google Scholar]
  34. Testa, R.; Trapani, A.M.D.; Sgroi, F.; Tudisca, S. Economic sustainability of Italian greenhouse cherry tomato. Sustainability 2014, 6, 7967–7981. [Google Scholar] [CrossRef]
  35. Adams, P. Mineral nutrition. In The Tomato Crop; Atherton, J.G., Rudich, J., Eds.; Chapman & Hall: London, UK, 1986; pp. 281–334. [Google Scholar]
  36. Dorais, M.; Demers, D.A.; Papadopoulos, A.P.; Van Ieperen, W. Greenhouse tomato fruit cuticle cracking. Hortic. Rev. 2004, 30, 163–184. [Google Scholar]
  37. Li, H.; Deng, Z.; Liu, R.; Young, J.C.; Zhu, H.; Loewen, S.; Tsao, R. Characterization of phytochemicals and antioxidant activities of a purple tomato (Solanum lycopersicum L.). J. Agric. Food Chem. 2011, 59, 11803–11811. [Google Scholar] [CrossRef] [PubMed]
  38. Dumas, Y.; Dadomo, M.; Di Lucca, G.; Grolier, P. Effects of environmental factors and agricultural techniques on antioxidantcontent of tomatoes. J. Sci. Food Agric. 2003, 83, 369–382. [Google Scholar] [CrossRef]
  39. Zhou, K.; Liangli, Y. Total phenolic contents and antioxidant properties of commonly consumed vegetables grown in Colorado. LWT-Food Sci. Technol. 2006, 39, 1155–1162. [Google Scholar] [CrossRef]
  40. Dobromilska, R.; Mikiciuk, M.; Gubarewicz, K. Evaluation of cherry tomato yielding and fruit mineral composition after using of Bio-algeen S-90 preparation. J. Elem. 2008, 13, 491–499. [Google Scholar]
  41. Ulissi, V.; Antonucci, F.; Benincasa, P.; Farneselli, M.; Tosti, G.; Guiducci, M.; Tei, F.; Costa, C.; Pallottino, F.; Pari, L.; et al. Nitrogen Concentration Estimation in Tomato Leaves by VIS-NIR Non-Destructive Spectroscopy. Sensors 2011, 11, 6411–6424. [Google Scholar] [CrossRef] [PubMed]
  42. Fontes, P.C.R.; de Araujo, C. Use of a chlorophyll meter and plant visual aspect for nitrogen management in tomato fertigation. J. Appl. Hortic. 2006, 8, 8–11. [Google Scholar]
  43. Martínez, D.; Juan, G. Distortion of the SPAD 502 chlorophyll meter readings by changes in irradiance and leaf water status. Agronomie 2004, 24, 41–46. [Google Scholar] [CrossRef]
Figure 1. Plan of the experimental subunits in the aquaponic laboratory, from 31 March to 5 November 2014, with three replicates (A, B, and C) at the Zurich University of Applied Sciences in Wädenswil, Switzerland. Framing line style indicates which subunit is connected to which component. While the elements are drawn to scale, the distances between them are not to scale.
Water 08 00533 g001
Figure 2. Water flow in the “Wädenswil aquaponic system” in 2014: Fresh water flowed through valve B, which was controlled by UrbanFarmers controller software (UrbanFarmers, Zurich, Switzerland), and an analogue counter to control the volume of water added to the fish tank. Water from the fish tank flowed continuously into the solids removal unit. From here, solids-free water flowed under gravity into a moving bed biofilter. A circulation pump ❶ pumped water (5 m3·h−1) from a biofilter through an oxygenation cone, and back to the fish tank. The heating element in the biofilter ensured a constant water temperature of 29 °C. Twice an hour computer controlled valve A opened the water flow to the hydroponic unit into the sump for 2 min, providing an exchange of 2448 ± 155 L·day−1. The time regulated pump ❷ pumped water to the drip irrigation hydroponic unit (31 March–1 October, irrigation every 15 min for 2 min, and 1 October–5 November, irrigation every 10 min for 2 min). The pump ❸ constantly pumped water into the floating raft culture, and NFT channel and from there via the drainage point back to the sump. The return pump ❹ pumped water back to the solids removal unit and thus ensured a constant water level in the sump. During automatic drum filter rinsing with cleaned system water, small amounts of water with solids (fish manure and residues of fish feed) were removed into solids thickening unit, as described in Mayer [23]. Thickened floating, and settled sludge was manually removed from the system three times a week and collected in an outdoor unit. Solids-free water was returned to the solids removal unit.
Water 08 00533 g002
Figure 3. Weekly mean values for temperature (T), and relative humidity (RH) in the greenhouse, and electrical conductivity (EC) in the system water; n = 1 for RH and T and n = 3 for EC.
Water 08 00533 g003
Figure 4. Fruit internal quality parameters sugar content (A); fruit pH (B); sugar–acid ratio (C); lycopene content (D); total phenolic compounds (E); and oxygen radical absorbance capacity (F) compared for raft culture, drip irrigation, nutrient film technique (NFT) and a control group cultivated in a commercially operated hydroponic system at three sampling points in summer. Error bars represent standard deviation. Different uppercase and lowercase letters indicate significant differences (Tukey’s HSD, n = 3, p < 0.05) for harvests and hydroponic systems, respectively. The factors, harvest (H) and treatment (T), and their interaction (H*T) were reported by “***” for p < 0.001, “*” for p < 0.05 and “.” for p < 0.1.
Water 08 00533 g004
Figure 5. Fruit internal quality parameters sugar content (A); fruit pH (B); sugar–acid ratio (C); lycopene content (D); total phenolic compounds (E); and oxygen radical absorbance capacity (F) of market tomatoes produced in Switzerland (CH) and in The Netherlands (NL) compared to the average from the October harvest in the aquaponic system. Error bars represent standard deviation; n = 4.
Water 08 00533 g005
Figure 6. Distribution of total nutrient uptake in the plant in terms of tomato fruits and green biomass in the aquaponic system compared between drip irrigation, raft culture, and nutrient film technique (NFT) system; n = 3.
Water 08 00533 g006
Figure 7. Comparison of leaf SPAD values between plants grown in drip irrigation, raft culture, nutrient film technique (NFT) and a commercial system; n = 3. Error bars represent standard deviation. Different uppercase and lowercase letters indicate significant differences (Tukey’s HSD, n = 3, p < 0.05) for harvests and HP systems, respectively. The factors, harvest (H) and treatment (T), and their interaction (H*T) were reported by “***” for p < 0.001 and “**” for p < 0.01.
Water 08 00533 g007
Table 1. Targeted levels (mg·L−1) for each measured parameter in the aquaponic system, and the corresponding HACH Lange LCK test numbers.
ParameterTPNO3-NNO2-NNH4-NKFeCaMgB
HACH Lange test number349339341304328321327326307
31 March 2014 until 14 September 201440160002503200500.2
15 September 2014 until 5 November 201440160002343130240.2
Table 2. Tomato quality classifications according to Swiss market quality norms for cherry tomatoes [28].
CategoryCriteriaFruit Quality
Category 1diameter: 20–35 mmmarketable
Category 2diameter: >35 or <20 mmnon-marketable, edible
Category 3rotten, cracked, damaged, blossom-end rot, green or yellow colored (compost)non-marketable, not edible
Table 3. Average cumulative and total yield (g·m−2) and average number of tomato fruits (±SD) shown for three quality categories (Table 2) in drip irrigation system, raft culture system, and nutrient film technique (NFT) system. Different letters indicate significant differences (Tukey’s HSD, n = 3, p < 0.05).
Fruit Quality ClassDrip Irrigation SystemRaft Culture SystemNFT System
Average cumulative yield (g·m−2)
Category 118,323 ± 667 16,857 ± 341 17,176 ± 364
Category 286 ± 220b156 ± 290a73 ± 110b
Category 3248 ± 108 371 ± 177 255 ± 650
Total18,657 ± 568a17,383 ± 242b17,503 ± 339b
Average cumulative number of fruits
Category 1936 ± 350 877 ± 500 869 ± 350
Category 211 ± 400b20 ± 4.00a10 ± 200b
Category 315 ± 7.00 21 ± 900 16 ± 400
Total963 ± 350 918 ± 580 895 ± 340
Table 4. Average fruit mineral concentrations (±SD) shown for the three harvests and the corresponding ANOVA results. Different letters indicate significant differences (Tukey’s HSD, n = 3, p < 0.05) for harvests. The factors, harvest (H) and treatment (T), and their interaction (H*T) were reported by “***” for p < 0.001, “**” for p < 0.01, “*” for p < 0.05 and “.” for p < 0.1.
Mineral Nutrient1st Harvest2nd Harvest3rd HarvestANOVA Result
C (mg·g−1)397.6 ± 2.20A408.5 ± 2.20B408.3 ± 3.10BH: ***
N (mg·g−1)17.4 ± 0.8A15.4 ± 0.6B14.6 ± 0.5BH: ***
P (mg·g−1)1.6 ± 0.1A3.8 ± 0.1B3.8 ± 0.1BH: ***
K (mg·g−1)10.6 ± 0.3B28.6 ± 0.40B34.9 ± 2.5AH: ***
S (mg·g−1)0.6 ± 0.0A1.5 ± 0.1AB1.4 ± 0.1BH: **, HxT: .
Mg (mg·g−1)0.3 ± 0.0B1.1 ± 0.1A1.1 ± 0.0AH: ***
Fe (μg·g−1)4.0 ± 2.0C24.7 ± 2.80B39.2 ± 15.3AH: ***, T: .
Ca (mg·g−1)0.3 ± 0.1AB1.0 ± 0.3A0.6 ± 0.2BH: ***
Cu (mg·g−1)1.2 ± 0.3B8.5 ± 4.6A8.9 ± 1.4AH: **
Mn (μg·g−1)4.1 ± 0.8B22.6 ± 9.6A27.3 ± 10.3AH: ***, T: ***, HxT: *
Zn (μg·g−1)6.0 ± 0.5B16.2 ± 1.9A18.3 ± 1.60AH: ***
Table 5. Average manganese fruit mineral concentrations (±SD) in μg·g−1 shown for the three harvests from each of the three hydroponic systems. Different letters indicate significant differences (Tukey’s HSD, n = 3, p < 0.05) between HP systems.
HarvestDrip Irrigation SystemRaft Culture SystemNFT System
1st (12 June 2014)2.6 ± 0.1b4.2 ± 0.1a2.6 ± 0.1b
2nd (7August 2014)12.0 ± 5.1b31.4 ± 3.0a24.3 ± 5.8b
3rd (16 October 2014)20.2 ± 2.3b39.6 ± 6.7a22.2 ± 4.4b
Table 6. Average leaf mineral concentrations (±SD) shown for the three harvests and the corresponding ANOVA results. Different letters indicate significant differences (Tukey’s HSD, n = 3, p < 0.05) for harvests. The effect of factors (harvest (H) and treatment (T)) and their interaction (H*T) were reported by “***” for p < 0.001, “**” for p < 0.01, “*” for p < 0.05 and “.” for p < 0.1.
Mineral Nutrient1st Harvest2nd Harvest3rd HarvestANOVA Result
C (mg·g−1)322.3 ± 12.1A368.7 ± 6.7B365.0 ± 8.2BH: ***
N (mg·g−1)30.3 ± 0.6A37.0 ± 1.0B36.0 ± 1.0BH: ***
P (mg·g−1)1.8 ± 0.4A3.7 ± 0.6B3.3 ± 0.6BH: ***
K (mg·g−1)14.7 ± 0.6B39.3 ± 0.6B77.0 ± 10.5AH: ***
S (mg·g−1)8.3 ± 1.2A22.0 ± 1.7AB23.3 ± 5.1BH: **, HxT: .
Mg (mg·g−1)2.7 ± 0.6B5.7 ± 0.6A6.0 ± 1.0AH: ***
Fe (μg·g−1)22.7 ± 5.5C99.3 ± 17.8B191.0 ± 116.5AH: ***, T: .
Ca (mg·g−1)20.7 ± 3.2AB45.0 ± 6.9A58.3 ± 13.3BH: ***
Cu (mg·g−1)2.3 ± 0.6B15.3 ± 1.5A23.3 ± 4.9AH: **
Mn (μg·g−1)107.3 ± 56.2B905.3 ± 402.1A1308 ± 493.2AH: ***, T: ***, HxT: *
Zn (μg·g−1)9.7 ± 1.5B60.7 ± 15.5A156.7 ± 10.3AH: ***
Table 7. Average manganese leaf mineral concentrations (±SD) in μg·g−1 shown for the three harvests comparing all three hydroponic systems. Different letters indicate significant differences (Tukey’s HSD, n = 3, p < 0.05) between HP systems.
HarvestDrip Irrigation SystemRaft Culture SystemNFT System
1st (12 June 2014)59 ± 8.9b169 ± 34a94 ± 10.7ab
2nd (7August 2014)1302 ± 359b498 ± 241a916 ± 404ab
3rd (16 October 2014)1870 ± 679b1107 ± 592a947 ± 533ab

