Article

Domestic Wastewater Depuration Using a Horizontal Subsurface Flow Constructed Wetland and Theoretical Surface Optimization: A Case Study under Dry Mediterranean Climate

by
Pedro Andreo-Martínez
,
Nuria García-Martínez
and
Luis Almela
*
Department of Agricultural Chemistry, University of Murcia, Campus of Espinardo, Murcia 30100, Spain
*
Author to whom correspondence should be addressed.
Water 2016, 8(10), 434; https://doi.org/10.3390/w8100434
Submission received: 28 July 2016 / Accepted: 29 September 2016 / Published: 5 October 2016

Abstract

:
The wastewater generated by isolated houses without access to public sewers can cause environmental problems, like the contamination of aquifers with nitrates and phosphates, as occurs in southeastern Spain. The effectiveness of a previously built horizontal subsurface flow constructed wetland (HF-CW) was studied over two years as a possible solution. This HF-CW measured 27 m2; it was planted with Phragmites australis (Cav.) Trin. ex Steud ssp. altissima and the parameters studied were those required by European Union (EU) legislation and adopted by Spain. Average abatement efficiency rates, for the first and the second year of study, were: biochemical oxygen demand over five days (BOD5) (96.4%, 92.0%), chemical oxygen demand (COD) (84.6%, 77.7%), total suspended solids (TSS) (94.8%, 89.9%), total nitrogen (TN) (79.5%, 66.0%), ammonium nitrogen (NH4+-N) (98.8%, 86.6%) and total phosphorous (TP) (83.7%, 82.8%). Average abatement efficiency for nitrate nitrogen (NO3-N) (−1280.5%, −961.1%) and nitrite nitrogen (NO2-N) (−5.8%, −40.0%) were negative because its content in influent wastewater was very low and they appear mainly from influent NH4+-N, as a result of purification processes carried out in the HF-CW bed. The abatement rates make the system suitable to produce discharges into the environment in accordance with Spanish law. It is noteworthy that the HF-CW patch suffered an episode of bed drying during the summer of 2013, whereby the causes were related to system oversizing and high evapotranspiration in the area. As a consequence, the decrease in the abatement of water pollutants during the second year can be attributed to the creation of preferential water flow paths and short circuits through the constructed wetland (CW) bed. As a result of the oversizing of the CW, a theoretical resizing based on BOD5, TSS, TN or TP is proposed. The calculated values for the redesign were: 5.22 m2 considering DBO5, 0.18 m2 considering TSS, 10.14 m2 considering TN and 23.83 m2 considering TP. Considering the area where the HF-CW was located and in accordance with Spanish law for non-sensitive areas (no TN or TP requirements for wastewater discharge), BOD5 is the most appropriate parameter for design; it is 5.2 times lower than the HF-CW initially built and without risk of bed drying.

1. Introduction

Nowadays, many small communities located in rural or isolated areas of Spain lack adequate domestic wastewater treatment facilities. In these areas, wastewater collection and its treatment via public sewage systems are problematic due to the widely dispersed population. Wastewater treatment by traditional on-site systems, like septic tank/soil absorption design, is common in southeastern Spain because the land in this area is well-suited for percolation. However, these practices pose risks because percolated wastewater can contaminate groundwater with pollutants such as nitrates and phosphates, resulting in serious environmental damage. Consequently, these communities or individual households have to use alternative wastewater treatment technologies. One example of these areas is the countryside of Elche, Alicante (Spain). It is located on the aquifer, “080.190 Bajo Vinolopó,” certified as permeable. The aquifer has average nitrate content of 61.5 mg·L−1 [1] that exceeds the Spanish legal limit by 23% [2]. According to Spanish law [3], it is not a sensitive area, but it is listed as vulnerable to pollution by nitrates from agricultural sources [4].
With respect to proper wastewater treatment, the European Union (EU) Directive [5] and the EU Water Framework Directive [6], establish a series of requirements for effluents of wastewater treatment plants, as well as for the abatement efficiency (Table 1) that must be applied to populations greater than 2000 population equivalent (PE) (“1 PE means the organic biodegradable load has a five-day biochemical oxygen demand (BOD5) of 60 g of oxygen per day”) and an “adequate treatment” requirement for populations lower than 2000 PE. The wastewater can be discharged into sensitive areas (areas that are eutrophic or close to it) or into non-sensitive areas (in no danger of eutrophication). BOD5, chemical oxygen demand (COD), and total suspended solids (TSS) should be monitored in non-sensitive areas, whereas for sensitive areas, in addition to the parameters cited for non-sensitive areas, total nitrogen (TN) and total phosphorous (TP) should also be monitored. Proper treatment for wastewater from populations lower than 2000 PE is unspecified, so contaminants and limits are usually evaluated according to the legislation designed for populations greater than 2000 PE. In addition, the EU Directive [5] established a plan which seeks to boost the incorporation and use of, among other things, low-cost solutions to provide wastewater treatment to small communities, and comparative studies of nutrient abatement for populations with fewer than 2000 PE.
As an alternative to conventional wastewater treatment plants, constructed wetlands (CWs) prove to be much more cost-efficient, especially for low population areas. CWs are relatively simple systems in comparison to conventional wastewater treatments plants, formed by various beds of different particle sizes, such as sand or gravel, planted with macrophites whose roots support the microbial bioburden essential for contaminant abatement in surface water, groundwater or waste streams [7]. They are designed to make use of similar processes that are carried out in natural wetlands, but do so within a closely monitored environment [8,9]. CWs have been used for more than 50 years in various parts of the world, and it is likely that more than 100,000 CWs worldwide currently treat over one billion liters of water a day [10]. The estimated cost for wastewater treatment using CWs ranges between 186 and 357 US$ m−3 compared with conventional treatment processes ranging between 571 and 715 US$ m−3 [11]. Besides the aforementioned cost-efficiency, CWs have many other benefits. They are simple to operate, robust, use natural treatment processes, and provide aesthetic value. They also produce beneficial biomass through the different kinds of plants grown on them in addition to helping support wildlife habitats [11].
As for their efficacy, horizontal subsurface flow constructed wetlands (HF-CWs) have been successfully employed to abate key contaminants from wastewater, such as the organic load, nutrients (mainly N and P), and pathogens [12,13], as well as to restore ecosystems [14]. A large number of physicochemical and biological processes are involved in these systems [15] such as sedimentation, filtration, precipitation, sorption, plant uptake, and microbial decomposition [16]. The rate of these processes may vary according to the geographical area and the season of the year, and they depend on many factors such as the organic loading, the depth of the water and the availability of electron acceptors [17]. In addition, abatement efficiencies can be affected in complex ways by the annual cycles of numerous parameters, such as the quality and quantity of water, soil, air temperature, solar radiation, humidity, precipitation, influent pollutant concentrations, or vegetation. For this reason, it is very important to consider the climate in which the CWs are constructed.
Our research aimed to investigate the efficacy of a HF-CW under the climatic conditions of southeastern Spain. To the best of our knowledge, there are few studies on the performance of CWs in Mediterranean Spain, although HF-CWs are one of the most commonly used types in Europe. HF-CWs are a relatively new technology in Spain and, until recently, only a small number of HF-CWs had been reported, distributed mainly in the Mediterranean area [18,19]. As the CW surface is related to contaminant abatement efficiency, it is necessary to find the optimal design in order to maximize abatement efficiency, while keeping the area to a minimum. In this respect, hydraulic retention time (HRT), reference evapotranspiration (ET0) and temperature (T) are the parameters that most determine the efficiency [11,20].
This paper presents the results obtained during the first two operation years of an HF-CW that had been previously built by a private company according their own design protocol. The main aim was to monitor the efficiency of this HF-CW under the climatic conditions of southeastern Spain, and to service an individual household for the abatement of the key physical and chemical contaminants established by EC [5] and adopted by Spain. As consequence of the results obtained, a theoretical redesign of the HF-CW is proposed in order to achieve the minimum area for optimal contaminant abatement efficiency.

2. Materials and Methods

2.1. Constructed Wetland and Pretreatment Design

The system was located in the southeast of Spain, in Torrellano Bajo/Elche (Alicante) (38°16′42.46″ N; 0°35′58.61″ W), at an altitude of 56 m above sea level. The climate of the area is typical of dry Mediterranean (Bsh and Bsk) [21], with mean annual T, rainfall and ET0 of 17.0 ± 1.4 °C, 272.2 ± 73.2 mm and 1110.7 ± 132.2 mm·m−2, respectively, over the last 10 years [22]. Elche countryside is not a sensitive area according to Spanish law [3].
The CW system was built by a company according their own design protocol. The system had a pretreatment system EP-480 (Riuvert®, Alicante, Spain), made of polyethylene (PET), with activated sludge in suspension, sludge recirculation and clarifier technology. Its total volume was 2300 L. However, during the course of the experiment, this system was offline, acting only as wastewater pretreatment and not as a purification system in the strict sense. Under this configuration, its main function was to abate any material that might cause obstructions in the bed of the HF-CW.
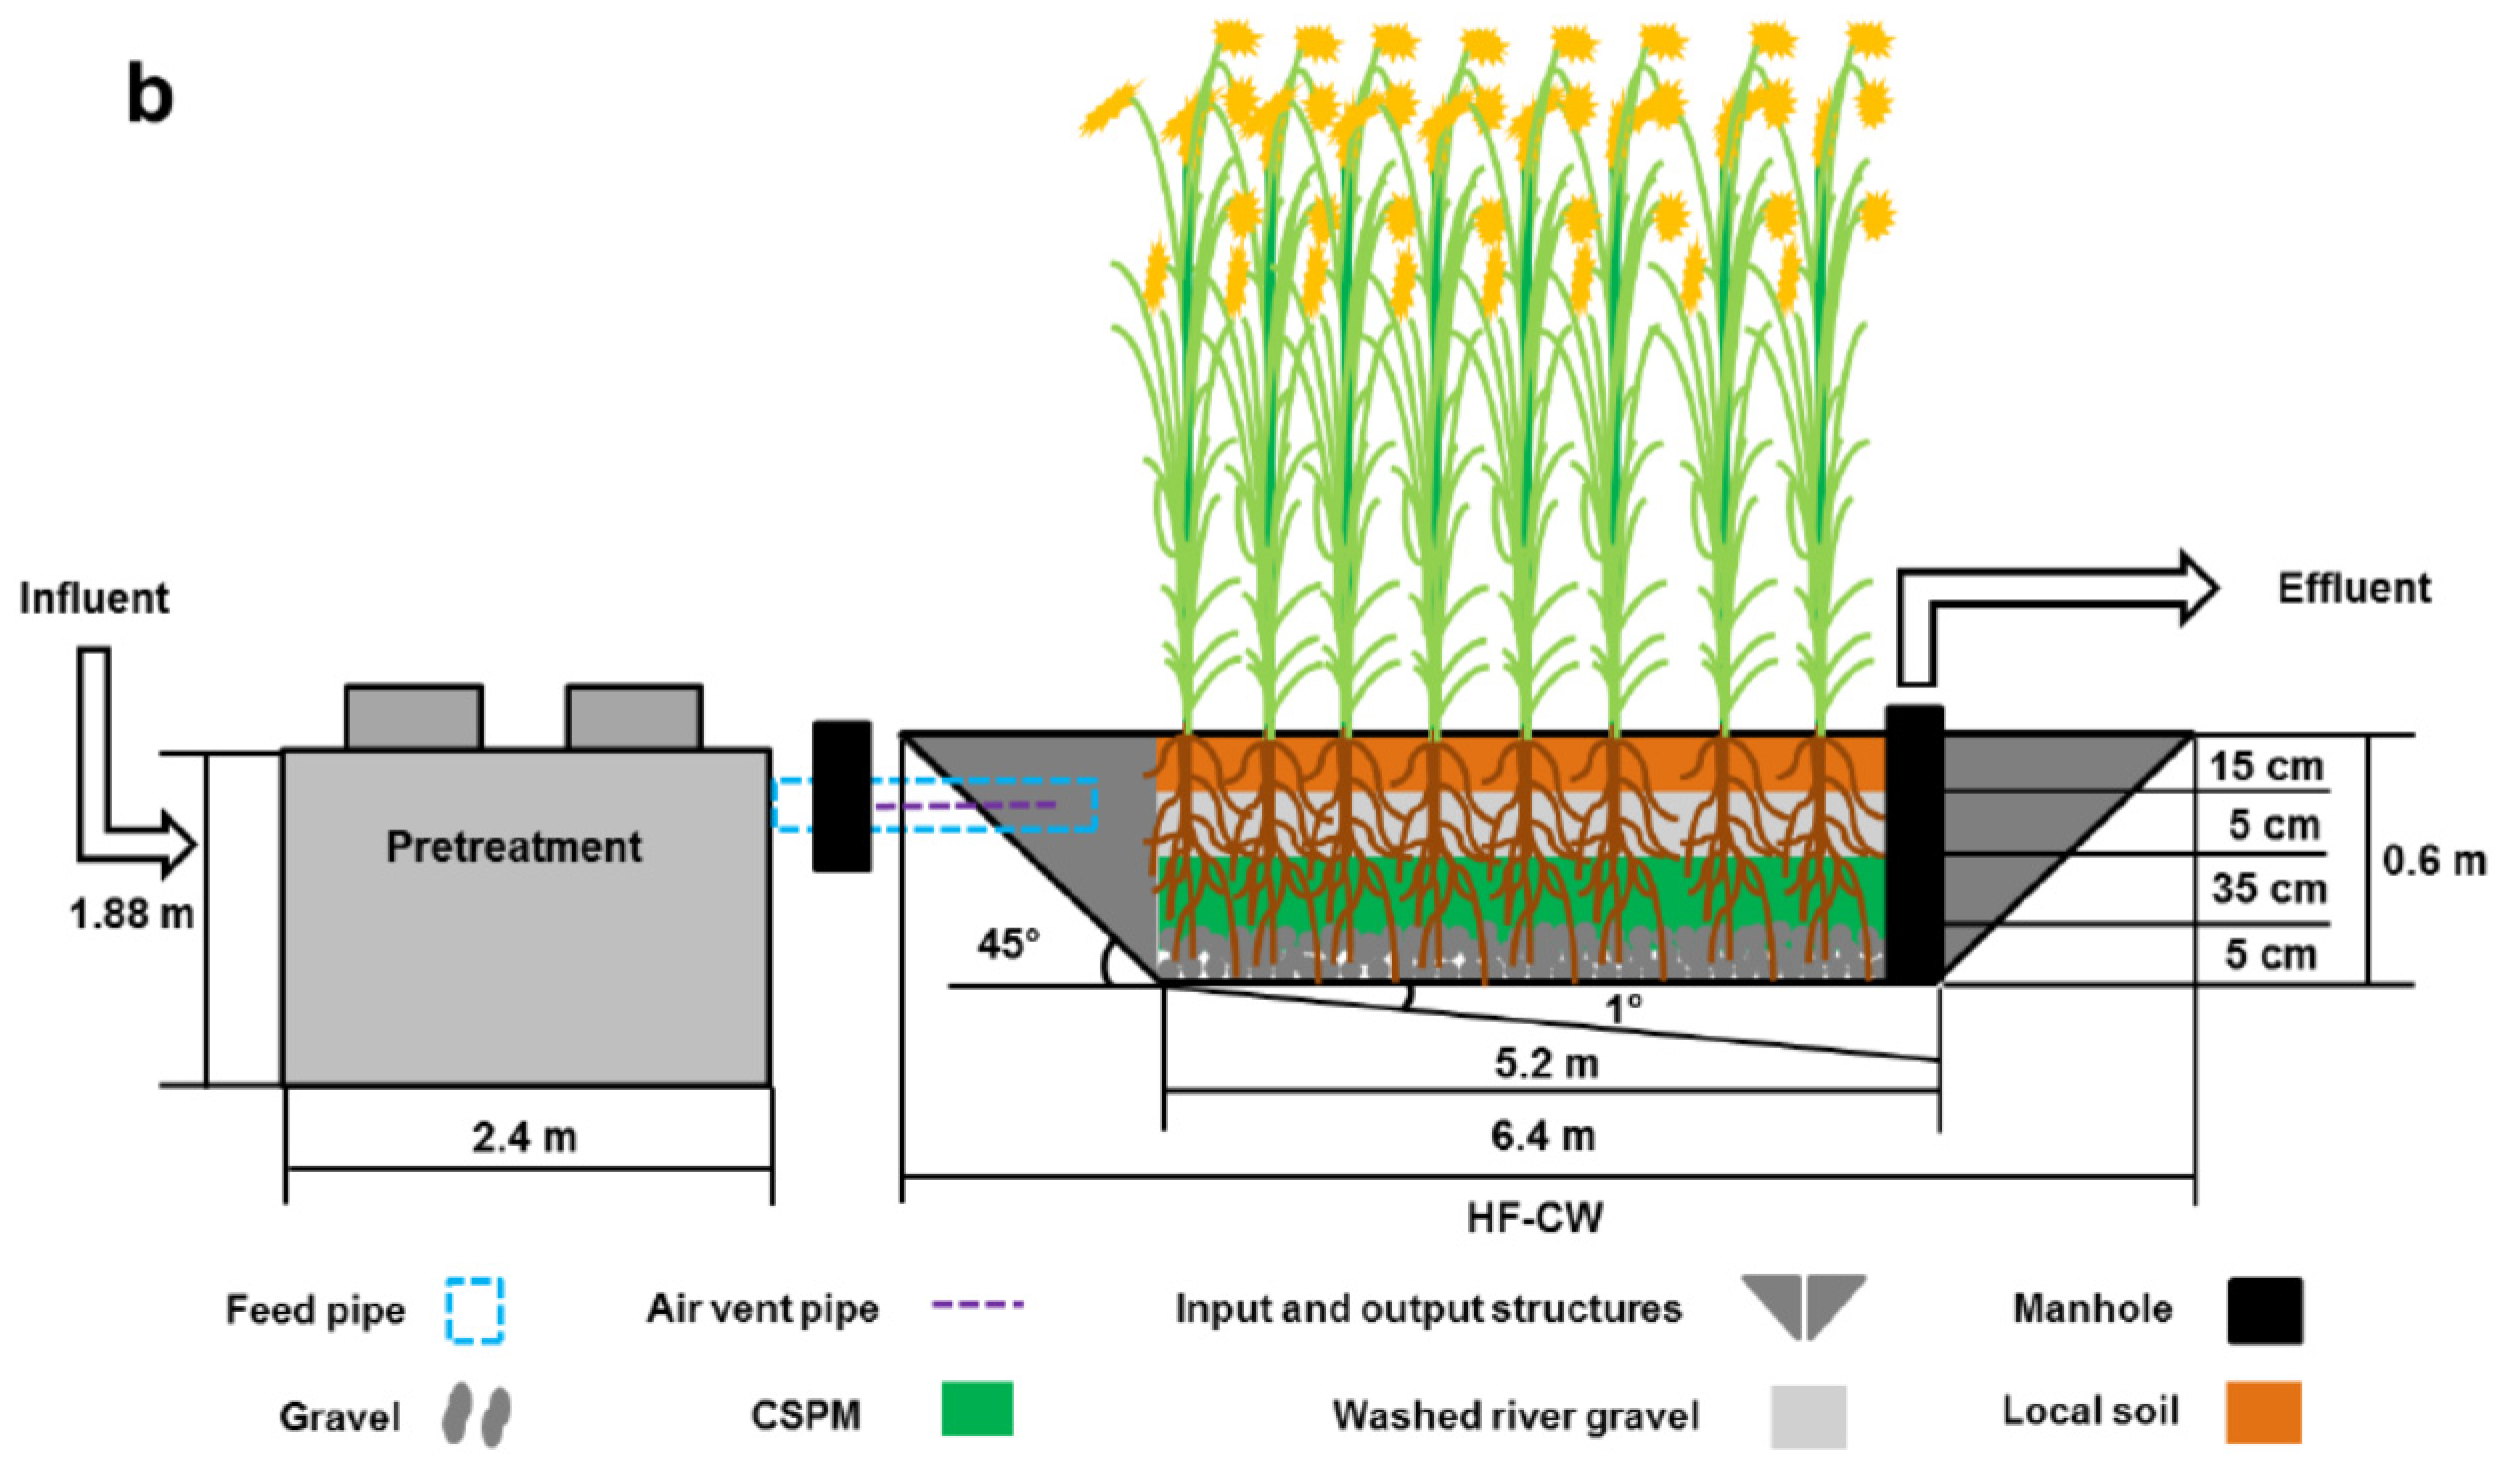
The sizing of the HF-CW was: surface 6.4 m × 6.4 m and 5.2 m × 5.2 m (top and bottom respectively); depth of 0.6 m; bottom slope 1° and sidewalls 45°. The effective area of the HF-CW, excluding the input and output structures, was 27 m2 (15.04 m2·PE−1 according to 60 g BOD5 per inhabitant and day) (Figure 1). The plant species used was Phragmites australis (Cav.) Trin. ex Steud ssp. altissima, introduced by autochthonous rhizomes collected from “El Hondo del Elche”, with a density of 4 plants m−2. The liner consisted of a multilayer of geotextile-PET (200 μm)-polyvinyl chloride (PVC) (1.5 mm)-geotextile.
The HF-CW was fed through a 75 mm diameter PVC pipe placed in the inlet structure. The pipe was perforated with vents of 10 mm each at 10 cm apart. An air vent pipe of 21 mm diameter drilled with holes (2.5 mm) every 5 cm was placed inside the feeding pipe and used to inject an intermittent air flow (for 15 min every hour) of 50 L·min−1, supplied by a SECOH SLL-40 air pump (Bibus Spain, Pontevedra). Aeration was used during the first year of CW working.
The filler material comprised a gravel layer of 5 cm thickness (2 cm particle size) at the bottom of the CW, followed by a 35 cm layer of Canadian sphagnum peat moss, and a new layer of 5 cm made with washed river gravel (4 mm particle size). Finally, an upper layer of 15 cm of local soil (sand 78%, silt 13%, clay 9%, pH 8.15, TN 0.031% and total organic carbon 3.3% analyzed following the method described by Black et al. [23]) was used for the vegetation rooting (Figure 1).

2.2. Water Sampling and Monitoring

Wastewater samples were collected monthly from manholes located at the inlet and outlet of the HF-CW. Sampling was carried out following the rules: ISO-5667-1 [24], ISO-5667-2 [25] and ISO-5667-3 [26]. A cool-box was used for storage and transport of samples to the laboratory, in order to minimize their spoilage. Samples were stored at low temperature (~4 °C) until performance analysis within 24 h.
The parameters analyzed were: T, BOD5, COD, TSS, TN, ammonium nitrogen (NH4+-N), nitrate nitrogen (NO3-N), nitrite nitrogen (NO2-N), TP and pH. Both influent and effluent T were measured in situ. The technique for the determination of TSS follows the recommendations of the American Public Health Association [27]. The pH was measured using a pH meter CRISON-GLP21 (Hach Lange Spain, L’Hospitalet de Llobregat, España). The remaining parameters were determined using the rapid kits NANOCOLOR® and photometer NANOCOLOR® 500D (Macherey-Nagel GmbH, Düren, Germany) with references: 985 822 (BOD5), 985 029 (COD), 985 064 (TN and NO3-N), 985 005 (NH4+-N), 985 069 (NO2-N) and 985 080 (TP). The efficiency in the concentration abatement of a contaminant was evaluated according to the Equation (1):
P e r c e n t a g e   a b a t e m e n t   ( % ) =   C 0   C e C 0
where C0 and Ce are the inlet and outlet concentrations in mg·L−1.
HF-CW water balance was evaluated according to Pedescoll et al. [28] (Equations (2) and (3)) and meteorological data were obtained from an agro-climatic weather station [22] located 5 km from the HF-CW location.
E T cw =   Q in + P   Q out
where ETcw is constructed wetland evapotranspiration (mm·d−1); Qin is the inlet flow rate (mm·d−1); P is precipitation (mm·d−1) and Qout is the outlet flow rate (mm·d−1).
K CW =   E T CW E T 0
where ET0 is reference evapotranspiration in the area and Kcw is constructed wetland plant coefficient (dimensionless).

3. Results and Discussion

3.1. Water Influent and Effluent Characterization

The measured average daily Qin was 0.27 m3. Considering this Qin, the water depth (d) (0.6 m), assuming an average porosity (n) of 0.38, corresponding to the cross section not occupied by vegetation and the wetland area (As) (27 m2), the HRT (HRT = As·d·n/Q) and hydraulic loading rate (HLR = 100·Q/As) values of 22.6 d and 1 cm·d−1, respectively, were calculated.
Average values for the wastewater quality parameters (influent and effluent), the efficiency of treatment for the two years studied and the legal limits for discharge are given in Table 1.
Pollutant values found at the influent wastewaters are higher compared to other geographical zones [29]. These data agree with those reported by Puigagut, Villaseñor, Salas, Bécares and García [18] and may relate to the water-saving practices followed by citizens in southeastern Spain, an area with a dry Mediterranean climate and prolonged droughts; as a result, the concentration of contaminants in domestic wastewaters are higher. An experiment run in a semi-arid zone of Tunisia showed even higher values [30].

3.2. Abatement of Organic Matter

Effluent BOD5 concentration showed small variations through the first year (Figure 2a), with an average value of 13.2 ± 5.3 mg·L−1 and an abatement of 96.4% ± 1.8% (Table 1). The drop observed in June 2013 could be explained by the high vegetative growth of common reed that implies a proper working of the CW, and because T increase favours a lower oxygen demand [31].
In July and August of 2013, BOD5 sampling could not be performed due to the insufficient level of water at the outlet manhole (Qout = 0 m3). Generally, Qout can be deduced from Equations (2) and (3) in function of the HF-CW area. If the Qout obtained is negative, as occurred in the 27 m2 HF-CW of this study (Table 2), a partial drying of the HF-CW bed may occur.
These observations are in accordance with data obtained in zones of similar climatic characteristics in Morocco [32]. As a result of this drying episode, the following months showed an abnormal behavior for the BOD5 value, a circumstance that can be related to the possible formation of preferential flow paths in the HF-CW bed that would have decreased the HRT. Other authors reported that an excessive root growth may cause the unbundling of the bed, encourage the creation of preferred paths and short circuits and open new pore spaces in the substrate [30,33]. From December 2013, a tendency to return to the proper working order of the CW was observed. This nonlinear behavior of BOD5 data may also be related to an oversized HF-CW and, therefore, we consider it necessary to resize the system, as will be discussed in Section 4. Despite the aforementioned, the mean BOD5 value in this period was 25.4 ± 12.4 mg·L−1, slightly higher than the maximum level permitted, but with a reduction (92.0% ± 4.4%) well over the values recommended by EC [5].
Table 3 shows the abatement efficiencies found in experiments run in some Mediterranean countries using HF-CWs systems, compared to the surface PE−1. Although PE definition has been already introduced in Section 1, in this ratio, a consumption of 250 L of water per person per day is assumed to obtain adequate comparison units [34]. Our results agree with those of higher BOD5 abatement; oversizing of the system could explain these values. On the other hand, the climate of the Mediterranean basin, which implies warmer T of the water and, during growing season, the larger and constant growth of the common reed, may justify the high abatement found for this region compared with other European experiences [35].
The abatement process of BOD5 is mainly carried out by bacterial activity (aerobic and anaerobic) with greenhouse gases production and emission to the atmosphere [41,42], and by the sedimentation and filtration of particulate organic matter [43]. In this respect the assisted aeration during the first year of the study combined within common reed activity was effective [44].
Similarly to BOD5, effluent COD concentrations showed a stable value for the first years, with a COD mean value of 102.1 ± 13.5 mg·L−1 and 84.6% ± 4.0% abatement. As result of the partial drying of the HF-CW in July and August 2013, the possible appearance of preferential water paths can be responsible for abnormal and high COD values (Figure 2b). When the water regime returned to normal (final study period), COD tended to recover values of the same order as for the initial period. Although the percentage of abatement in this last period (77.7% ± 9.4%) was slightly higher than the directive’s limit [5], it was similar to those obtained in other experiments in similar Mediterranean climate zones (Table 3).
The abatement mechanisms of COD are similar to those for BOD5 and depend on the combination between physical and microbial mechanisms. The physical filtration mechanism is related to the small pore size of the filler material; so the organic solids could be trapped in the bed of HF-CWs for a long time allowing biodegradation of organic solids [11].
The ratio BOD5/COD is related to the biodegradability of the organic matter present in the water, or the ability of some organic chemicals that can be used as substrates by microorganisms to produce energy (cellular respiration) and create other substances such as amino acids, tissues and organisms [29]. In our experiment, the ratio BOD5/COD for influent wastewaters had an average of 0.53 ± 0.08, a characteristic value for water of high biodegradability; while HF-CW effluents had an average of 0.15 ± 0.06, indicative of low biodegradability.
Taking into account that BOD5/COD in untreated municipal wastewaters is between 0.3 and 0.8, and that this relationship changes to 0.4–0.6 after the primary sedimentation, and decreases to 0.1–0.3 after secondary treatments [45], we could conclude that the HF-CW studied behaves as a secondary water treatment system. This affirmation is consistent with the data from other wastewater treatment experiences [46].

3.3. Abatement of Total Suspended Solids (TSS)

The temporal evolution of TSS in both influent and effluent wastewaters of HF-CW is given in Figure 3. The drying episode mentioned was also reflected in the TSS parameter. Therefore, during the first year, effluent TSS mean value was only 8.8 ± 4.0 mg·L−1 with an abatement of 94.8% ± 2.4%, and a slight increase in June 2013 previous to the drying. The first months of the second year showed anomalous data, followed by a tendency to recover the levels of the first year, including an increase in June 2014, once the CW was recovered to a normal water regime.
TSS abatement mainly occurs through filtration and sedimentation, a process favored by macrophyte roots that reduce the water speed [7]. Water pretreatment is also very important to prevent the rapid clogging of the CW bed. Rousseau et al. [32] reported that clogging is a tangible risk in subsurface flow constructed wetlands and is principally influenced by loading rates of BOD5 and/or TSS, the HLR, the particle size and distribution of the matrix material as well as the wastewater particles. This phenomenon can be counteracted by lowering HLR or by letting the bed rest. During this resting period, organic material that blocks the pores can be composted and the hydraulic conductivity thus restored. In our experience, the HF-CW took a full year to recover operating conditions after the drying episode. Our data are in accordance with the literature and demonstrate the effectiveness of HF-CW in TSS abatement in Mediterranean climate zones (Table 3) and attainment of suitable effluents for discharge according to Spanish law.

3.4. Abatement of Nitrogenous Compounds

The TN content in the wastewater is the sum of the N present in both organic and inorganic forms. Among the first ones are amino acids, urea, uric acids and nitrogenous bases; inorganic forms are NH4+-N, NO2-N, NO3-N and gaseous nitrogen that includes NH3, N2, NO2 and N2O. Therefore the evolution of the TN parameter is linked to the transformation between these different forms, their selective absorption by plants and the volatilization of the gaseous forms [12].
In CWs, organic N undergoes a series of transformations that are related to their mechanisms of abatement. The first stage would be ammonification which transforms organic N into NH4+-N following the pathway: amino acids−imino acids−keto acids−ammonium. In a second stage, NH4+-N is converted by bacteria into NO2-N and NO3-N in the presence of oxygen. The interconversions between different forms of TN are associated with abatement mechanisms such as assimilation by plants, volatilization of gaseous forms and adsorption by cation exchange. A detailed review on the dynamics of N in HF-CWs is given by Saeed and Sun [47].
The average percentage of nitrogen forms in the influent wastewater, with respect to TN, was: organic N (20.8% ± 5.9%), NH4+-N (77.6% ± 5.8%), NO3-N (1.4% ± 0.7%) and NO2-N (0.2% ± 0.0%).

3.4.1. Abatement of Total Nitrogen

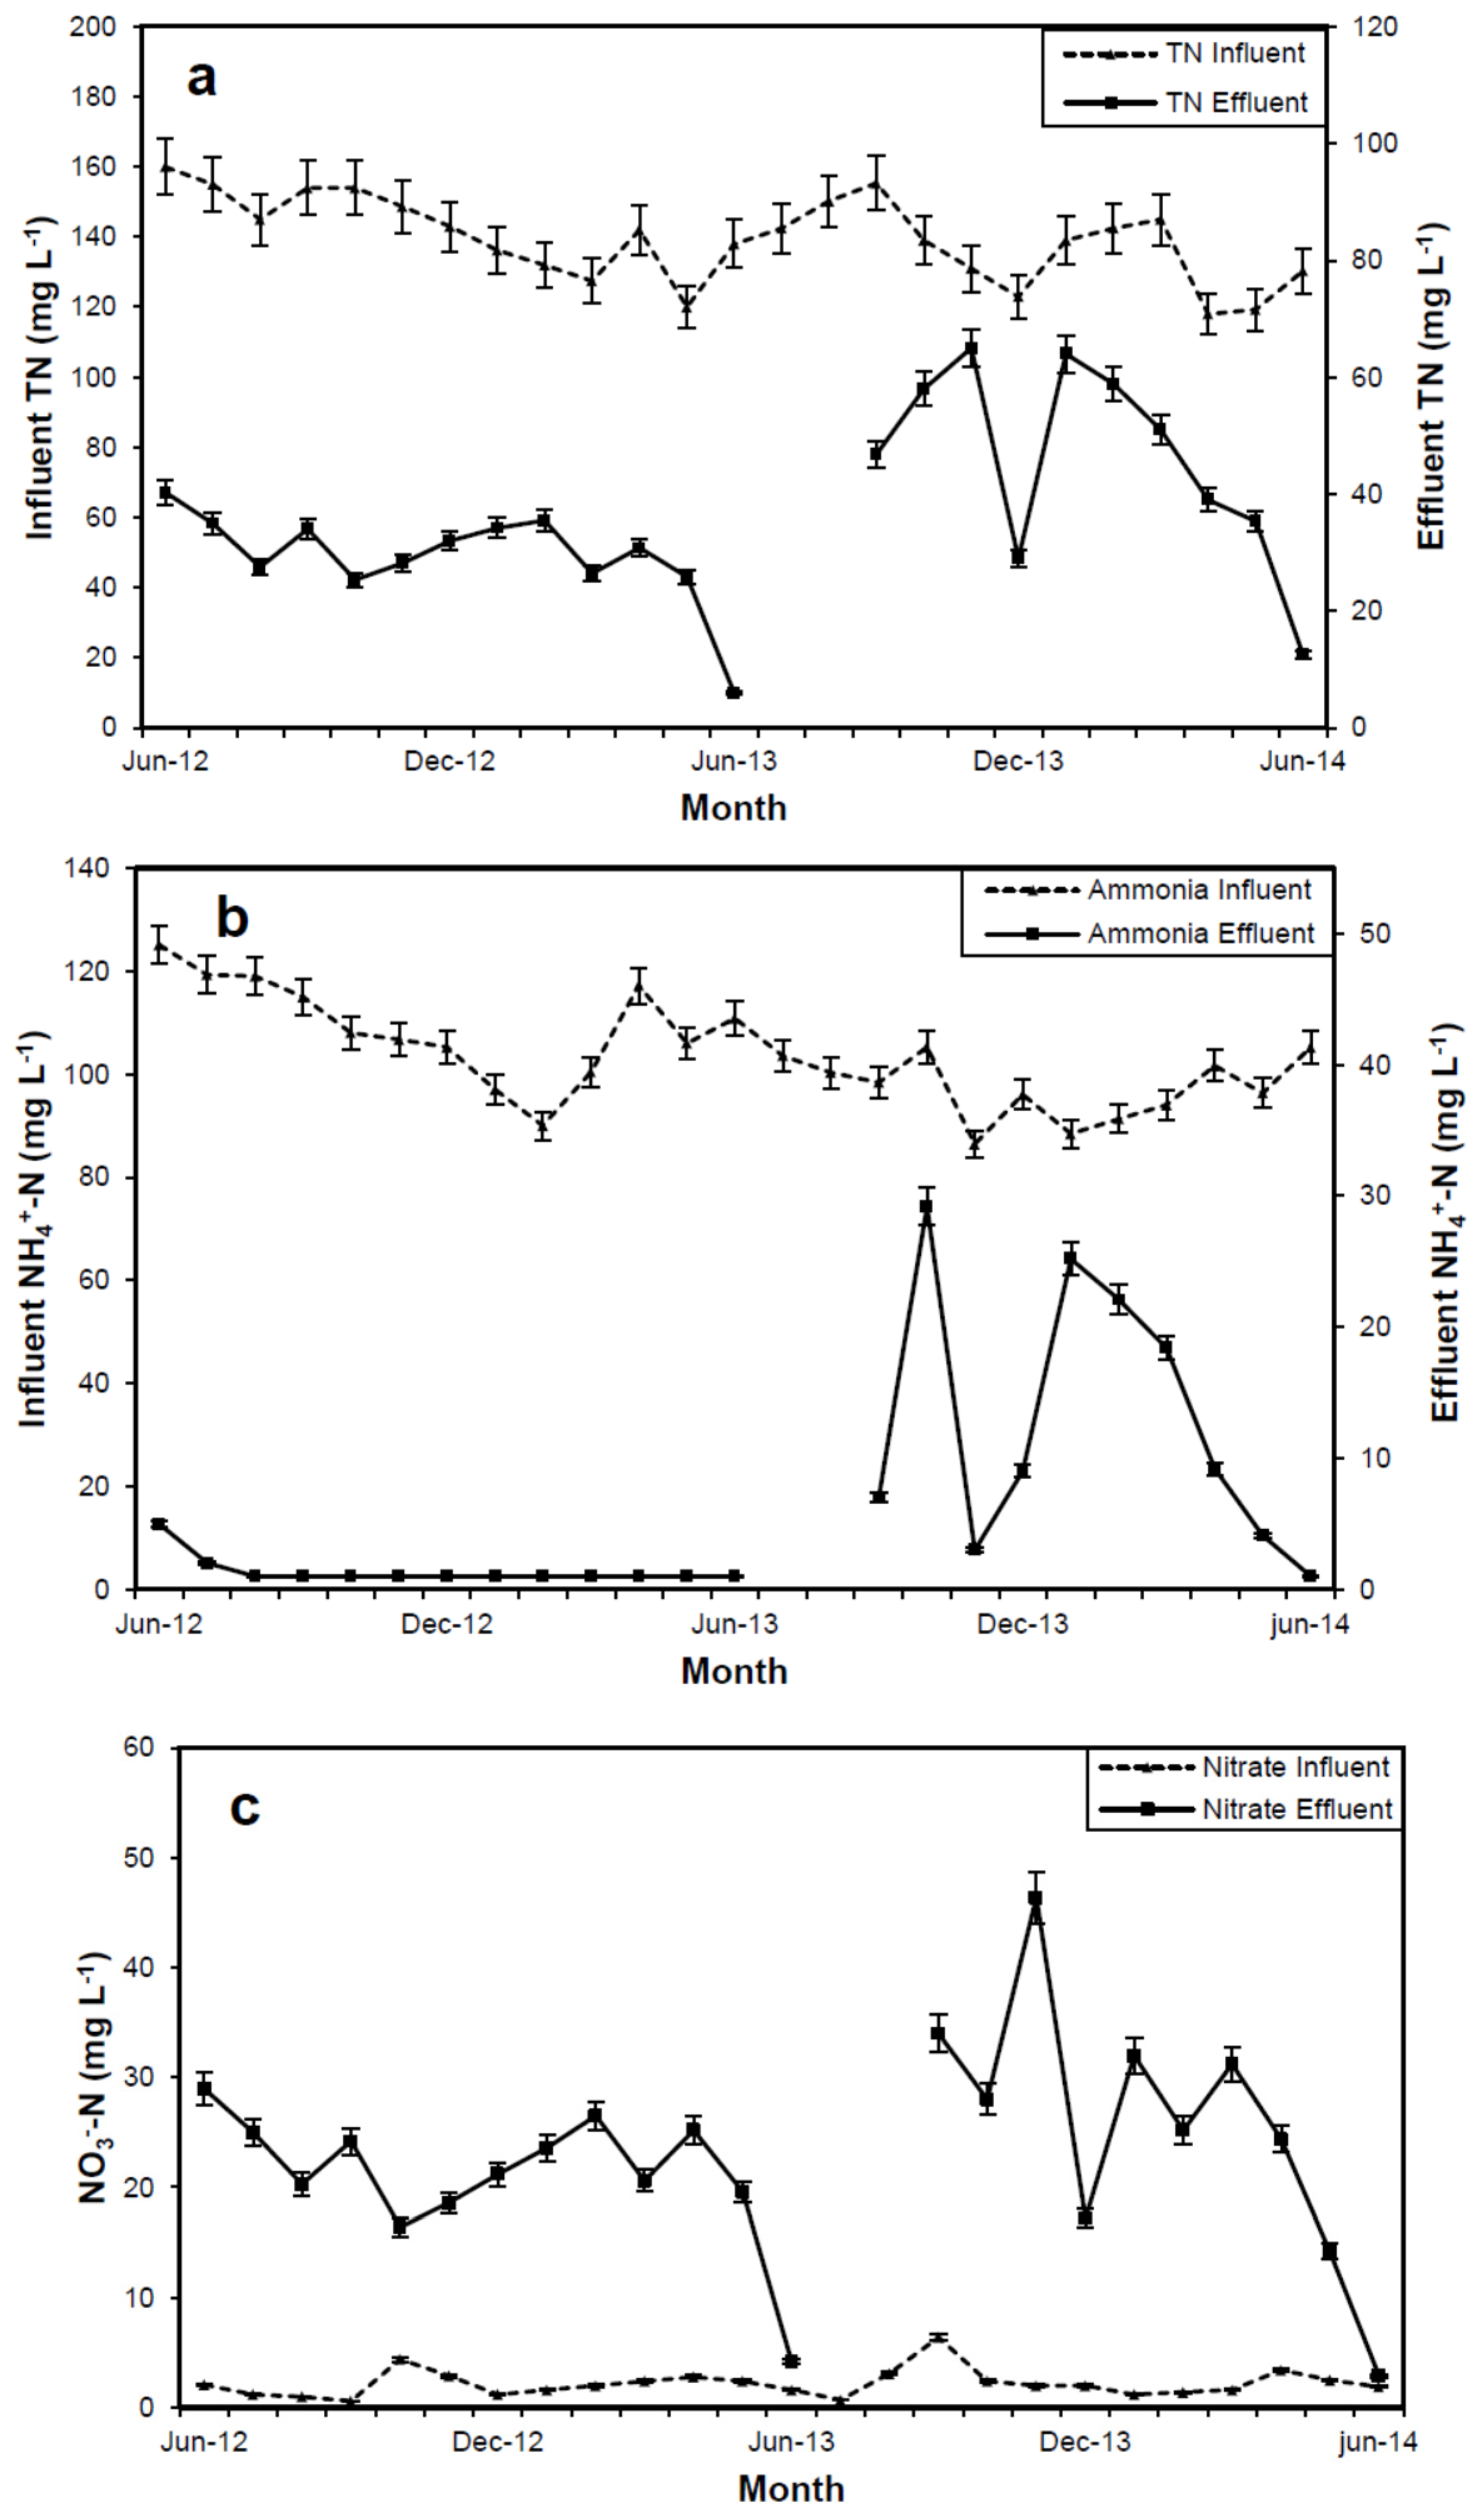
The evolution of the TN content in the influents and effluents of the HF-CW studied is shown in Figure 4a. During the first year, the influent wastewaters showed an average content of 142.7 ± 11.8 mg·L−1, while in the effluents, it was 29.3 ± 8.3 mg·L−1, with a minimum of 6.0 mg·L−1 in June 2013. The time evolution showed a decrease of TN content at the beginning of the experience, coinciding with the start of vegetative growth, followed by stabilization, around 30 mg·L−1, until the CW desiccation occurred.
Once the normal water regime was restored, a non-linear response was observed. This abnormal behavior could be due to different causes. On the one hand, accumulation of TN and a change of microbiological population of the bed may occur. On the other hand, the rainfall effects or the non-homogeneous influent TN concentration may also have an influence. A detailed study would be needed but, in any case, preventing desiccation of the HF-CW bed is convenient as will be discussed in Section 4. This behavior was also observed for NH4+-N and NO3-N (Figure 4b,c). At the end of the experience, TN abatement efficiency returned to the values found during the first year, in which there was a normal water regime. The mean percentage abatement for TN during the first year was 79.5% ± 5.6%, reaching 95.7% (June 2013), meeting the legal limit values for wastewater discharge into sensitive areas [5].
Because the ammonification and nitrification steps involve lower acidity while denitrification increases the pH, the small change detected (Table 1), mainly at the stage of correct system operation, can be interpreted as a balance between these processes in the CW. Moreover, the pH value during all the experiment was not a limiting factor on the proliferation of microbiological population involved in the above processes.
Our data for TN abatement show a higher efficiency than others found in Mediterranean countries (Table 3), probably due to oversizing the system and the application of assisted aeration during the first year. HF-CWs are considered an anoxic system; therefore, the assisted aeration during the first steps of the development of CW bed can play an important role, because the incipient plant growth cannot provide enough oxygen. Once the plants are well developed they are able to mobilize and inject oxygen through the roots, from 0.005 to 12 g·O2·m−2·d−1, depending on the density of planting [47,48]. Thus, Phragmites australis roots provide support and oxygen source for microorganisms involved in nitrification and denitrification processes occurring in the anoxic zones [49]. Taking into account these considerations, the depth of subsurface constructed wetland should be linked to the maximum development of the macrophyte roots, 60 cm in the case of Phragmites australis [50].

3.4.2. Abatement of Ammonium Nitrogen

Figure 4b shows the evolution of NH4+-N throughout the experiment. NH4+-N represents most of the N in domestic wastewater [29], and a similar composition was observed for the influent wastewater (77.6% ± 5.8%). During the first year, mean values for the influents and the effluents were 109.2 ± 9.9 mg·L−1 and 1.4 ± 1.1 mg·L−1, respectively. This represents over 98.8% ± 0.9% abatement, confirming that CWs transforms almost all of the NH4+-N. After drying, erratic data were found with some very high values: 29.2 ± 3.2 mg·L−1 in October 2013 or 25.2 ± 2.9 mg·L−1 in January 2014; however, abatement rates remain high with an average around 86%. At the end of the experience a recovery of the operating conditions of the HF-CW (possible disappearance of preferential pathways) was observed, and the values decreased progressively towards the average value of the first year.
HF-CW experiment run in Mediterranean areas showed an NH4+-N abatement of between 9% and 76% (Table 3). The range is extensive, and can be related to the specific conditions of each CW. In our case, the high values found may be due to the large area of the HF-CW and assisted aeration during the first year.

3.4.3. Abatement of Nitrate Nitrogen

NO3-N evolution in the influents and the effluents of HF-CW is shown in Figure 4c. In the influent wastewaters, NO3-N content was almost constant throughout the experiment, with an average value of 2.2 ± 1.2 mg·L−1. However, data of the effluents revealed the capacity of the HF-CW for transformation between different N forms. Therefore, during the first year, the data showed an intense nitrification process, mainly from NH4+-N (nitrogenous form in greater proportion in the influent wastewater), with an average value of 22.6 ± 10.5 mg·L−1; while the minimum and maximum was 2.9 ± 0.4 mg·L−1 and 46.4 ± 3.1 mg·L−1, respectively. The drop in June for both years can be attributed to a high intake by the reeds, which were well developed at this time. When all the influent water was consumed by Phragmites australis, an erratic behavior for NO3-N content was observed and preferential flow paths for the water may have appeared.
The high level of nitrification in the initial stage of the CW may be related to the artificial aeration of influent wastewater during the first year of operation. The nitrification process continued despite the fact that forced aeration was stopped, a circumstance that can be attributed to the large amounts of oxygen injected by the roots of Phragmites australis into the bed of the CW. However, it should be noted that the oxygenation produced by common reed depends on the depth reached by the roots and the HRT.

3.4.4. Abatement of Nitrite Nitrogen

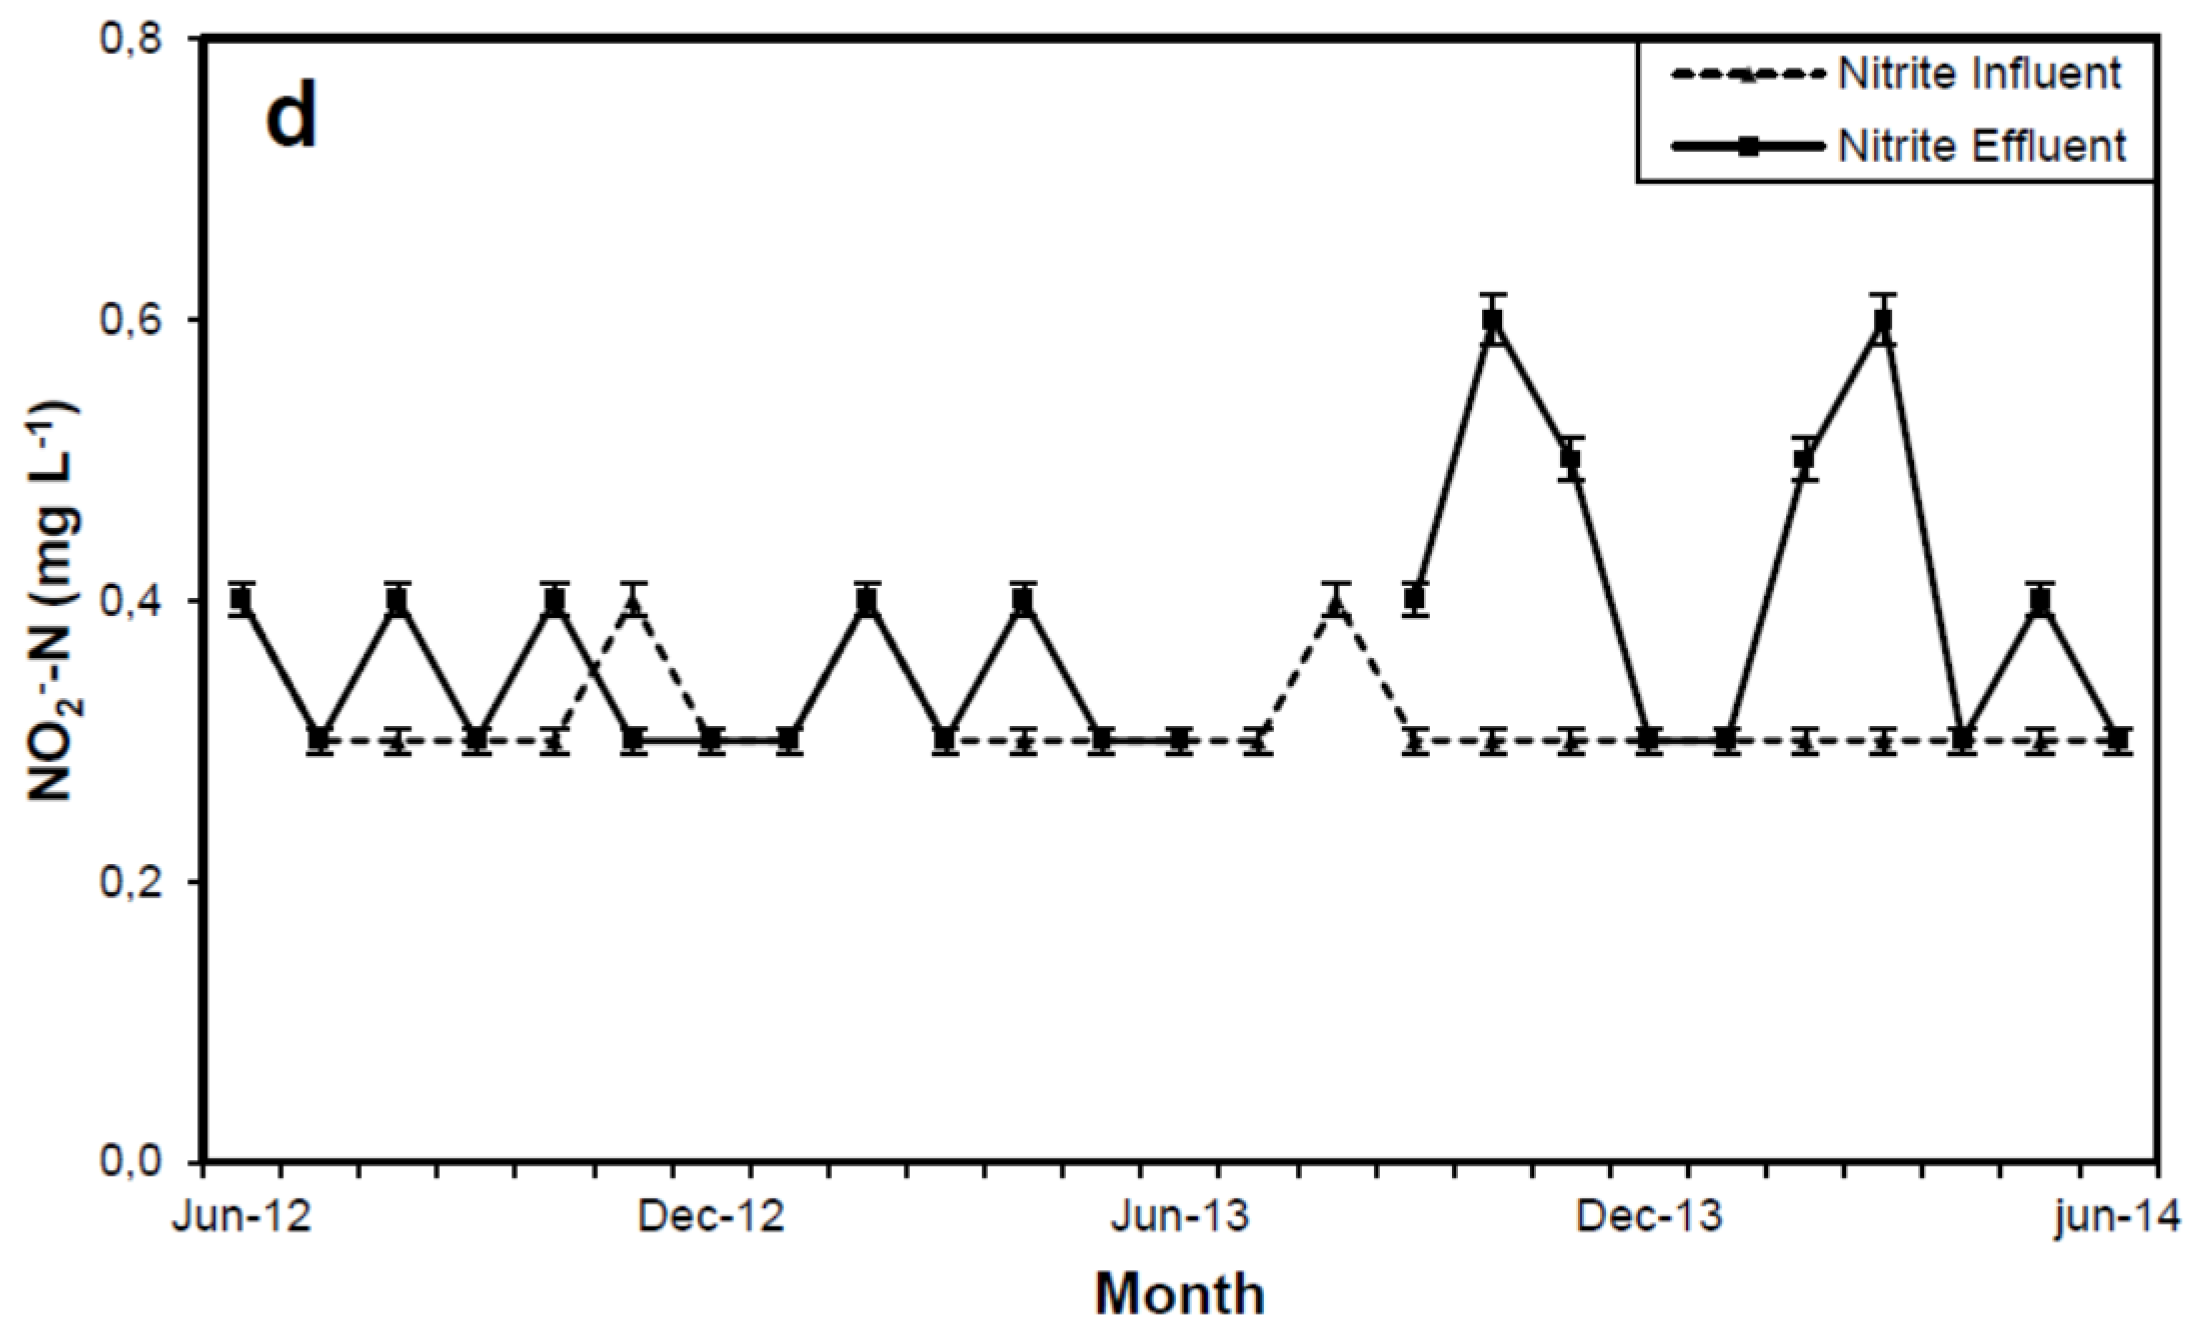
During the first year, NO2-N concentrations in the effluents were very low (Figure 4d), near to the detection limits of the analytical method used (0.3 mg·L−1); small differences were observed between the influent/effluent water. In the CWs, NO2-N may appear as an intermediate in the reactions of nitrification, denitrification, and NO3-N reduction [47]. Thus, the low NO2-N content can be explained by the preferential oxidation process from NO2-N to NO3-N favored by the oxygen supply; in fact, this oxidation is only inhibited when the dissolved oxygen is lower than 2.5 mg·L−1 [51]. Besides, there is an alkalinity requirement for nitrification and, if the HF-CW bed is not alkaline enough, an increase in NO2-N concentration may occur. Below 25 °C, the growth rate of NH4+-N-oxidizing bacteria (NH4+-N to NO2-N conversion) is lower than nitrite-oxidizing bacteria (NO2-N to NO3-N conversion). Throughout the experiment, wastewater T inside the HF-CW was below 25 °C, with the lowest ones between 13.6 and 16.7 °C in winter; this would be in accordance with the small NO2-N concentrations found [52].
After CW drying, an increase of NO2-N in water effluent was observed, which can be interpreted as an increase of NO3-N reduction in the anaerobic bed zones not affected by preferential path flow. Once the water flow was stabilized again, the NO2-N content tended to recover the standard values of the first year.

3.5. Abatement of Total Phosphorus

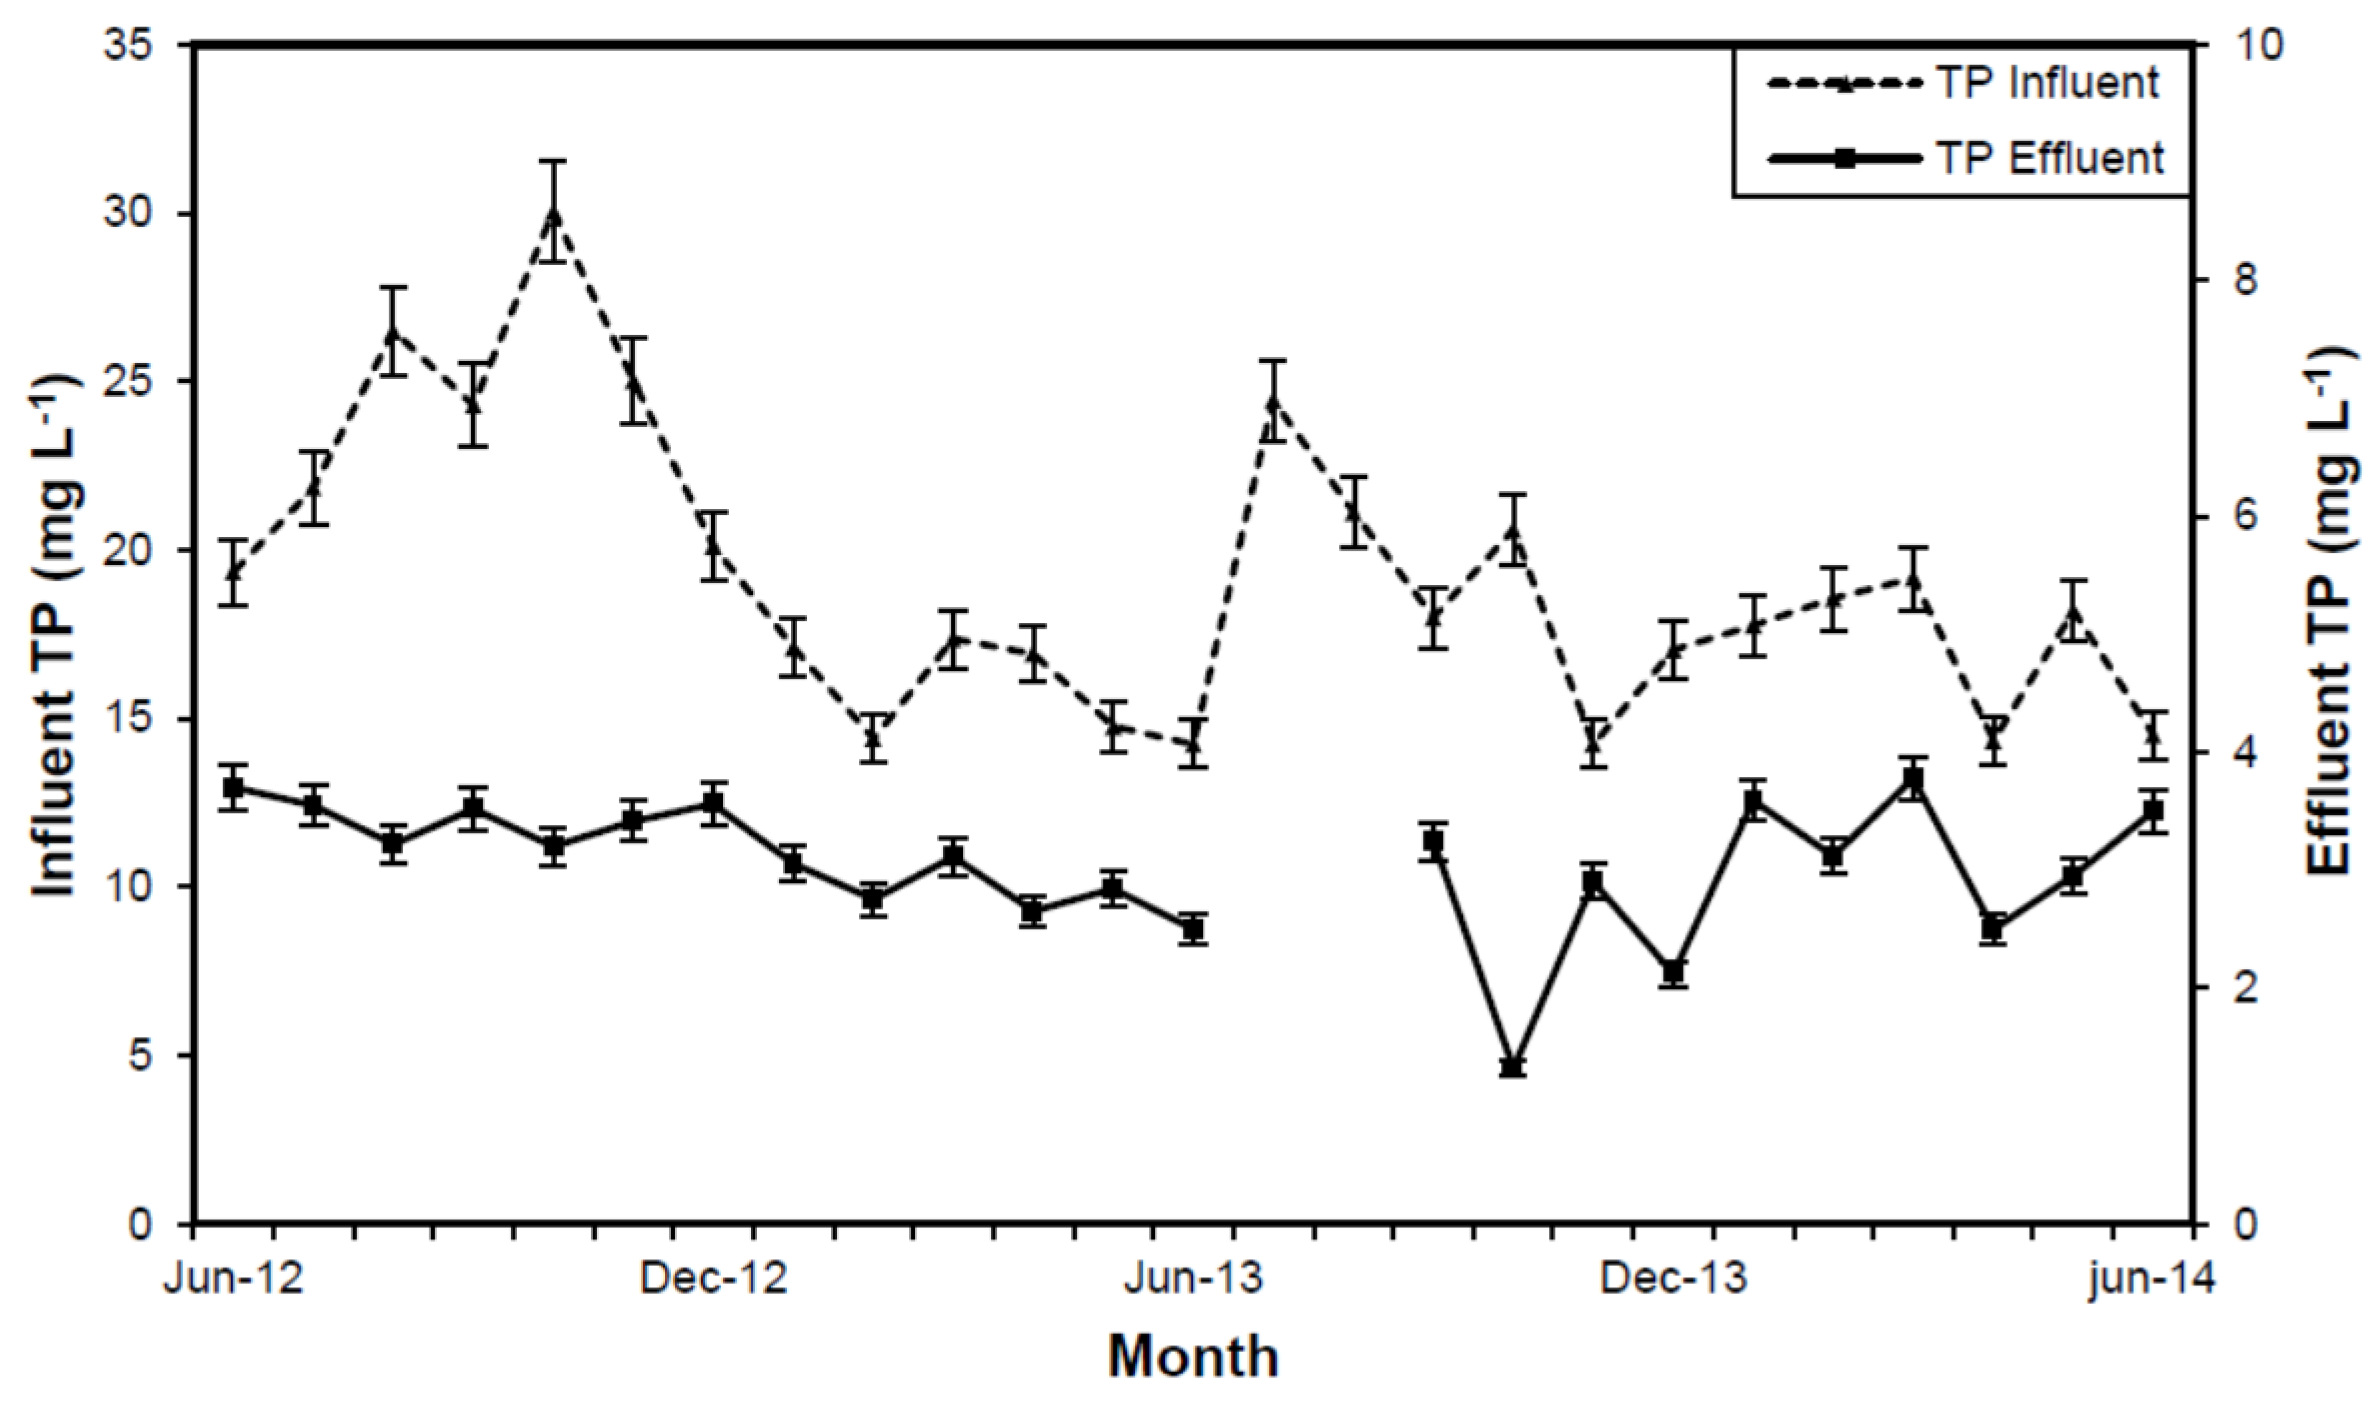
Figure 5 shows the evolution of the TP in the CW. Influent wastewaters had a TP mean value of 19.2 ± 4.2 mg·L−1; maximum value was reached in October 2012 (30.0 ± 1.7 mg·L−1) and minimum in November 2013 (14.2 ± 0.9 mg·L−1). The variability was related to the home consumption of water by a reduced number of residents.
No great differences were found in TP concentration in the wastewater effluents when considering the total sampling period, or the two periods separated by the drying episode. For the whole of the experiment, the mean value was 3.0 ± 0.6 mg·L−1, with maximum and minimum of 3.8 ± 0.2 mg·L−1 and 1.3 ± 0.1 mg·L−1, respectively; whereas the mean values were 3.2 ± 0.4 mg·L−1 and 2.9 ± 0.7 mg·L−1 for the first and second year, respectively, when data are considered separately.
The CW showed a slight increase in disposal capacity of TP from the beginning of its operation until the dryness episode. Nevertheless, the percentage abatement regarding influent wastewaters exceeded 80% in all cases: 83.7% ± 2.8% and 82.8% ± 4.9% (Table 1) for the first and second year, respectively. In investigations run in similar Mediterranean countries, the TP reduction ranged between 15% and 63% (Table 3); higher values found in our experiment may be due to oversizing of the HF-CW, which provokes a larger surface substrate-water contact.
The ability of CWs to retain P depends on the phosphorus HLR, the type of substrate bed, vegetation and the HRT [53]. The abatement of TP is linked to different mechanisms. On the one hand, the mineral components of the bed, sand and gravel lead to adsorption and precipitation reactions of P with Ca, Al and Fe ions [54]. Few investigations have been made regarding the saturation of the mineral filler, but it decreases significantly after a period of 5–6 years [55,56]. Mineralized peat can also adsorb P by means of an unclear process when its concentration is higher than 1.5 mg·L−1 [57]. However, the only sustainable mechanism for TP removal is plant uptake and subsequent harvesting. It has been accepted traditionally that the amount of P that can be abated by harvesting constitutes only an insignificant fraction of the amount of the P load in the system [58], but recently it has been demonstrated that a well-developed Phragmites australis can assimilate up to 75.1% of total dissolved P influent [14].
The regulatory requirements in the area where the HF-CW was located did not include TP as a parameter to be monitored in the water because it is a non-sensitive area; nevertheless, if TP control were required, as occurs in sensitive areas, the effluents also comply with the Spanish law (80% abatement was achieved).

4. Surface System Optimization

Due to the HF-CW drying episode during the summer season, a theoretical redesign is proposed. The authors have used a simulation based on a kinetic model of a previously published first-order piston flow reactor proposed by Reed et al. [59]. The equations of Reed’s model are summarized in Table 4.
CW water temperature (Tw) is also a fundamental parameter because the abatement of BOD5 and various N forms are temperature dependent. Winter average T that imply lower reaction rates should be used in the calculations. Another important parameter in the design of CWs is water depth (d). Water depth in HF-CWs has normally been set at 0.60 m, corresponding to the maximum length of growth for roots and rhizomes of the macrophytes [50,60,61,62]. Finally, the length (L) to width (W) ratio can be between 0.25:1 and 4:1, with the 3:1 being one of the best configurations [63]. The theoretical areas obtained for the different parameters are summarized in Table 5.

4.1. Surface Optimization Considering BOD5

To remodel the HF-CW on the basis of BOD5, the variables Ce, C0, Q, d, n and Kt (Table 6) were inserted into Reed’s equations. The resulting As was 5.22 m2 (2.91 m2·PE−1 according to 60 g of BOD5 per inhabitant per day), HRT = 4.37 d and HLR = 5.21 cm·d−1 (Table 5). If a ratio L/W of 3:1 is assumed, L and W were 3.96 m and 1.32 m, respectively. These data confirm the oversizing of the HF-CW studied (27 m2), 5.2 times higher than necessary when the BOD5 parameter is considered. Moreover, from this data, the water balance (Qout) for July and August of 2013 would have been 4.0 m3 and 4.4 m3 respectively and the system would not suffer drying episode. These data were similar to those reported by Parra and Chiang [64], who proposed an area of 15–20 m2 per 1000 L of influent wastewater.
Reed’s model also enables the verification of the HF-CW size from the energy balance. For this it is necessary to assume a water temperature (T0) and to solve the equations at the bottom of Table 4. The assumed water temperature was calculated according to: T0 = TM − 1. In this equation, −1 °C is a correction related to the possibility that in a certain period the water T may be colder than TM (average T in winter). If the obtained Tw is close to T0, the calculated As is acceptable. In another case, further iterations can be made until both T agree. In our case, the resulting Tw (10.05 °C) is sufficiently close to T0, so the resizing of the HF-CW calculated is valid, if the BOD5 abatement is the criterion used.

4.2. Surface Optimization Considering TSS

For sizing in terms of Reed’s equations according to TSS, HLR calculated from the influent and the effluent pollutant concentrations (C0 and Ce) must be between 0.4 and 75 cm·d−1. In our experiment, the HLR was 150 cm·d−1 (Table 4 TSS section and Table 6), exceeding 75 cm·d−1 proposed by Reed and obtaining a very low As (0.18 m2) (Table 5). This high HLR value confirms that wastewaters of southeastern Spain have more pollutant concentration than those found in the literature from other countries, as already discussed in Section 3.1. However, abatement of TSS in HF-CW systems is not a limiting parameter for design, compared with the need to abate BOD5 or TN.

4.3. Surface Optimization Considering Total Nitrogen (TN)

In order to size the HF-CW with respect to TN, the equation used is similar to that used when BOD5 is considered, only changing the constant Kt. For this reason, the same T0 (10.5 °C) is assumed, and the remaining data are summarized in Table 6. The results were: As = 10.14 m2 (5.65 m2·PE−1 according to 60 g of BOD5 per inhabitant per day); HRT = 8.48 d; HLR = 2.69 cm·d−1; L = 5.52 m; W = 1.84 m (Table 5). This surface is 2.7 times smaller than that of the HF-CW studied (27 m2). As is the case with BOD5, no drying episodes would be produced with this sizing (July Qout = 0.1 m3 and August Qout = 0.9 m3) but it would be very close to the maximum sizing for the area.
Compared with other authors, the calculated surface is higher than that of Parra and Chiang [64], but similar if the “rule of thumb” (5 m2·PE−1) is taken into account [16].
Another way of sizing CW can be to consider the oxygen required to convert the organic and ammoniacal N to NO3-N; the stoichiometry of the process requires 4.3 g O2·g−1·N−1 [7]. Because the amount of N in organic and ammoniacal forms is around 140 mg·L−1·d−1, and influent flow rate was 273 L·d−1, 175.8 g·O2·d−1 would be necessary. As Phragmites australis is able to inject up to 12 g·O2·m−2·d−1 [47,48], the resulting surface is of about 13.7 m2, a figure that is close to that deduced using Reed’s equation.

4.4. Surface Optimization Considering TP

The HF-CW sizing according to the equation in Table 4 for TP provides the following data: As = 23.83 m2 (13.27 m2·PE-1 according to 60 g of BOD5 per inhabitant per day); HRT = 19.95 d; HLR = 1.14 cm·d−1; L = 8.46 m and W = 2.82 m (Table 5). This surface is higher than that found considering BOD5 or TN, and nearer to the actual dimension of the experimental HF-CW, and the recommendations of 6 to 13 m2·PE−1 [29]. On the other hand, if Kp = 3.29 cm·d−1 [53] is taken into account, an area of 19.8 m2 is obtained, which is lower than that obtained following Reed’s method. However, such large areas are not suitable in areas of dry Mediterranean climate due to the risk of drying in the summer season (July Qout = −10.6 m3 and August Qout = −8.7 m3).
The problem of P abatement is related to its low elimination capacity by the HF-CW systems. When P abatement is required, it is necessary to incorporate an alternative treatment. Different alternatives like the use of slags, which have been studied recently, remove P mainly via CaO-slag dissolution followed by Ca2+ phosphate precipitation [14] or the use of an “irregularly shaped” HF-CW as described by Gorra et al. [65].

5. Conclusions

The horizontal subsurface flow constructed wetland (HF-CW) for the treatment of domestic wastewater evaluated under the climatic conditions of southeastern Spain meets the legal requirements for conducting discharges. Nevertheless, and taking into account the influent water volume and the climatic conditions of an area with a high evapotranspiration in the summer season, the surface of the wetland studied was excessive and caused the drying of the bed, which induced an anomalous behavior with the possible apparition of preferential flow paths during the ensuing months.
To redesign the HF-CW surface in order to optimize the abatement performance considering the actual conditions of the area, biochemical oxygen demand over five days (BOD5) is the parameter that must be considered due to its impact and the fact that the Elche countryside is not a sensitive area. Reed’s equations were useful for re-sizing, and the results showed that the studied system was 5.2 times oversized.
If P abatement is required, as in some sensitive areas, the required sizing would lead to an excessive surface that would lead to drying episodes, considering the high evapotranspiration in the area. In these cases, complementary treatments, like the use of slags or “irregularly shaped” HF-CWs, will be required.

Acknowledgments

This research is derived from a contract for technology support on “Water purification by a combined phytodepuration-phytoevapotranspiration system” between the company Biogxido S.L. and the University of Murcia. The authors would like to thank the company for their great support during its realization. The authors would also like to thank Stephen P. Hasler of Cambridge English and Seonaid McNabb for English revision of the manuscript. Finally, the authors would also like to thank the “Beneit-González de la Aleja” family for their friendliness and cooperation during this study.

Author Contributions

Pedro Andreo-Martínez conceived and designed the experiments. Pedro Andreo-Martínez and Nuria Garcia-Martínez performed the experiments and analyzed the data. Petro Andreo-Martínez wrote the paper and Luis Almela edited the paper.

Conflicts of Interest

The authors declare no conflict of interest.

References

  1. Instituto Geológico y Minero de España (IGME). Apoyo a la Caracterización Adicional de las Masas de Agua Subterránea en Riesgo de no Cumplir los Objetivos Medioambientales en 2015. Demarcación Hidrográfica del Júcar. Masa de Agua Subterránea 080.190 Bajo Vinalopó; IGME: Madrid, Spain, 2012; p. 73. (In Spanish) [Google Scholar]
  2. Boletín Oficial del Estado (BOE). Real Decreto 1514/2009, de 2 de Octubre, por el que se Regula la Protección de las Aguas Subterráneas contra la Contaminación y el Deterioro; BOE: Madrid, Spain, 2009; p. 15. (In Spanish) [Google Scholar]
  3. Boletín Oficial del Estado (BOE). Resolución de 30 de Junio de 2011, de la Secretaría de Estado de Medio Rural y Agua, por la que se Declaran las Zonas Sensibles en las Cuencas Intercomunitarias. BOE Número 180 13028; BOE: Madrid, Spain, 2011; p. 17. (In Spanish) [Google Scholar]
  4. Decreto 218/2009, de 4 de diciembre, del Consell, por el que se Designan, en el ámbito de la Comunitat Valenciana, Determinados Municipios como Zonas Vulnerables a la Contaminación de las Aguas por Nitratos Procedentes de Fuentes Agrarias; Decreto: Madrid, Spain, 2009. (In Spanish)
  5. Council Directive of 21 May 1991 Concerning Urban Wastewater Treatment (91/271/EEC); European Commission: Brussels, Belgium, 1991; pp. 40–52.
  6. Directive 2000/60/EC of the European Parliament and of the Council of 23 October 2000 Establishing a Framework for Community Action in the Field of Water Policy; European Commission: Brussels, Belgium, 2000; pp. 1–73.
  7. Environmental Protection Agency (EPA). Constructed Wetlands Treatment of Municipal Wastewaters. EPA/625/r-99/010; Environmental Protection Agency: Cincinnati, OH, USA, 2000; p. 166.
  8. Vymazal, J.; Kröpfelová, L. Wastewater Treatment in Constructed Wetlands with Horizontal Sub-Surface Flow; Springer: Dordrecht, The Netherlands, 2008; p. 566. [Google Scholar]
  9. Vymazal, J. Constructed wetlands for wastewater treatment. Water 2010, 2, 530–549. [Google Scholar] [CrossRef]
  10. Türker, O.C.; Vymazal, J.; Türe, C. Constructed wetlands for boron removal: A review. Ecol. Eng. 2014, 64, 350–359. [Google Scholar] [CrossRef]
  11. Abou-Elela, S.I.; Golinielli, G.; Abou-Taleb, E.M.; Hellal, M.S. Municipal wastewater treatment in horizontal and vertical flows constructed wetlands. Ecol. Eng. 2013, 61, 460–468. [Google Scholar] [CrossRef]
  12. Vymazal, J. Removal of nutrients in various types of constructed wetlands. Sci. Total Environ. 2007, 380, 48–65. [Google Scholar] [CrossRef] [PubMed]
  13. Kadlec, R.H. Comparison of free water and horizontal subsurface treatment wetlands. Ecol. Eng. 2009, 35, 159–174. [Google Scholar] [CrossRef]
  14. Ge, Y.; Wang, X.; Zheng, Y.; Dzakpasu, M.; Zhao, Y.; Xiong, J. Functions of slags and gravels as substrates in large-scale demonstration constructed wetland systems for polluted river water treatment. Environ. Sci. Pollut. Res. 2015, 22, 12982–12991. [Google Scholar] [CrossRef] [PubMed]
  15. Langergraber, G.; Giraldi, D.; Mena, J.; Meyer, D.; Peña, M.; Toscano, A.; Brovelli, A.; Korkusuz, E.A. Recent developments in numerical modelling of subsurface flow constructed wetlands. Sci. Total Environ. 2009, 407, 3931–3943. [Google Scholar] [CrossRef] [PubMed]
  16. Kadlec, R.H.; Wallace, S.D. Treatment Wetlands, 2nd ed.; CRC Press: Boca Raton, FL, USA, 2008; p. 1046. [Google Scholar]
  17. García, J.; Chiva, J.; Aguirre, P.; Álvarez, E.; Sierra, J.P.; Mujeriego, R. Hydraulic behaviour of horizontal subsurface flow constructed wetlands with different aspect ratio and granular medium size. Ecol. Eng. 2004, 23, 177–187. [Google Scholar] [CrossRef]
  18. Puigagut, J.; Villaseñor, J.; Salas, J.J.; Bécares, E.; García, J. Subsurface-flow constructed wetlands in Spain for the sanitation of small communities: A comparative study. Ecol. Eng. 2007, 30, 312–319. [Google Scholar] [CrossRef]
  19. Garfí, M.; Pedescoll, A.; Bécares, E.; Hijosa-Valsero, M.; Sidrach-Cardona, R.; García, J. Effect of climatic conditions, season and wastewater quality on contaminant removal efficiency of two experimental constructed wetlands in different regions of Spain. Sci. Total Environ. 2012, 437, 61–67. [Google Scholar] [CrossRef] [PubMed]
  20. Merino-Solís, M.; Villegas, E.; de Anda, J.; López-López, A. The effect of the hydraulic retention time on the performance of an ecological wastewater treatment system: An anaerobic filter with a constructed wetland. Water 2015, 7, 1149. [Google Scholar] [CrossRef]
  21. Kottek, M.; Grieser, J.; Beck, C.; Rudolf, B.; Rubel, F. World map of the köppen-geiger climate classification updated. Meteorol. Z. 2006, 15, 259–263. [Google Scholar] [CrossRef]
  22. IVIA. Riegos IVIA Datos Metereológicos. Available online: http://riegos.ivia.es/datos-meteorologicos (accessed on 19 September 2014). (In Spanish)
  23. Black, C.A.; Evans, D.; Dinauer, R. Methods of Soil Analysis; American Society of Agronomy: Madison, WI, USA, 1965. [Google Scholar]
  24. Water Quality, Sampling, Part 1: Guidance on the Design of Sampling Programmes and Sampling Techniques; ISO-5667-1; International Organization for Standardization: Geneva, Switzerland, 2006; p. 31.
  25. Water Quality, Sampling, Part 2: Guidance on Sampling Techniques; ISO-5667-2; International Organization for Standardization: Geneva, Switzerland, 1991; p. 24.
  26. Water Quality, Sampling, Part 3: Preservation and Handling of Water Samples; ISO-5667-3; International Organization for Standardization: Geneva, Switzerland, 2012; p. 42.
  27. Rice, E.W.; Bridgewater, L.; American Public Health Association; American Water Works Association. Standard Methods for the Examination of Water and Wastewater, 22nd ed.; American Public Health Association: Washington, DC, USA, 2012; p. 1496. [Google Scholar]
  28. Pedescoll, A.; Sidrach-Cardona, R.; Sánchez, J.C.; Bécares, E. Evapotranspiration affecting redox conditions in horizontal constructed wetlands under Mediterranean climate: Influence of plant species. Ecol. Eng. 2013, 58, 335–343. [Google Scholar] [CrossRef]
  29. Metcalf, L.; Eddy, H.P.; Tchobanoglous, G. Wastewater Engineering: Treatment, Disposal, and Reuse; McGraw-Hill: New York, NY, USA, 1991; p. 1362. [Google Scholar]
  30. Kouki, S.; M’hiri, F.; Saidi, N.; Belaïd, S.; Hassen, A. Performances of a constructed wetland treating domestic wastewaters during a macrophytes life cycle. Desalination 2009, 246, 452–467. [Google Scholar] [CrossRef]
  31. Akratos, C.S.; Tsihrintzis, V.A. Effect of temperature, HRT, vegetation and porous media on removal efficiency of pilot-scale horizontal subsurface flow constructed wetlands. Ecol. Eng. 2007, 29, 173–191. [Google Scholar] [CrossRef]
  32. Rousseau, D.P.L.; Lesage, E.; Story, A.; Vanrolleghem, P.A.; De Pauw, N. Constructed wetlands for water reclamation. Desalination 2008, 218, 181–189. [Google Scholar] [CrossRef]
  33. Hua, G.; Zhao, Z.; Kong, J.; Guo, R.; Zeng, Y.; Zhao, L.; Zhu, Q. Effects of plant roots on the hydraulic performance during the clogging process in mesocosm vertical flow constructed wetlands. Environ. Sci. Pollut. Res. 2014, 21, 13017–13026. [Google Scholar] [CrossRef] [PubMed]
  34. Galletti, A.; Verlicchi, P.; Ranieri, E. Removal and accumulation of Cu, Ni and Zn in horizontal subsurface flow constructed wetlands: Contribution of vegetation and filling medium. Sci. Total Environ. 2010, 408, 5097–5105. [Google Scholar] [CrossRef] [PubMed]
  35. Masi, F.; Martinuzzi, N. Constructed wetlands for the Mediterranean countries: Hybrid systems for water reuse and sustainable sanitation. Desalination 2007, 215, 44–55. [Google Scholar] [CrossRef]
  36. Barbera, A.C.; Cirelli, G.L.; Cavallaro, V.; Di Silvestro, I.; Pacifici, P.; Castiglione, V.; Toscano, A.; Milani, M. Growth and biomass production of different plant species in two different constructed wetland systems in Sicily. Desalination 2009, 246, 129–136. [Google Scholar] [CrossRef]
  37. Fountoulakis, M.S.; Terzakis, S.; Chatzinotas, A.; Brix, H.; Kalogerakis, N.; Manios, T. Pilot-scale comparison of constructed wetlands operated under high hydraulic loading rates and attached biofilm reactors for domestic wastewater treatment. Sci. Total Environ. 2009, 407, 2996–3003. [Google Scholar] [CrossRef] [PubMed]
  38. Bulc, T.; Vrhovsek, D.; Kukanja, V. The use of constructed wetland for landfill leachate treatment. Water Sci. Technol. 1997, 35, 301–306. [Google Scholar] [CrossRef]
  39. Kotti, I.P.; Gikas, G.D.; Tsihrintzis, V.A. Effect of operational and design parameters on removal efficiency of pilot-scale FWS constructed wetlands and comparison with HSF systems. Ecol. Eng. 2010, 36, 862–875. [Google Scholar] [CrossRef]
  40. El Hamouri, B.; Nazih, J.; Lahjouj, J. Subsurface-horizontal flow constructed wetland for sewage treatment under Moroccan climate conditions. Desalination 2007, 215, 153–158. [Google Scholar] [CrossRef]
  41. Mander, Ü.; Dotro, G.; Ebie, Y.; Towprayoon, S.; Chiemchaisri, C.; Nogueira, S.F.; Jamsranjav, B.; Kasak, K.; Truu, J.; Tournebize, J.; et al. Greenhouse gas emission in constructed wetlands for wastewater treatment: A review. Ecol. Eng. 2014, 66, 19–35. [Google Scholar] [CrossRef]
  42. Barbera, A.C.; Borin, M.; Cirelli, G.L.; Toscano, A.; Maucieri, C. Comparison of carbon balance in Mediterranean pilot constructed wetlands vegetated with different C4 plant species. Environ. Sci. Pollut. Res. 2015, 22, 2372–2383. [Google Scholar] [CrossRef] [PubMed]
  43. Vymazal, J.; Kröpfelová, L. Removal of organics in constructed wetlands with horizontal sub-surface flow: A review of the field experience. Sci. Total Environ. 2009, 407, 3911–3922. [Google Scholar] [CrossRef] [PubMed]
  44. Zhang, L.Y.; Zhang, L.; Liu, Y.D.; Shen, Y.W.; Liu, H.; Xiong, Y. Effect of limited artificial aeration on constructed wetland treatment of domestic wastewater. Desalination 2010, 250, 915–920. [Google Scholar] [CrossRef]
  45. Crites, R.W.; Tchobanoglous, G. Small and Decentralized Wastewater Management Systems; McGraw-Hill: New York, NY, USA, 1998; p. 1084. [Google Scholar]
  46. Vymazal, J. The use constructed wetlands with horizontal sub-surface flow for various types of wastewater. Ecol. Eng. 2009, 35, 1–17. [Google Scholar] [CrossRef]
  47. Saeed, T.; Sun, G. A review on nitrogen and organics removal mechanisms in subsurface flow constructed wetlands: Dependency on environmental parameters, operating conditions and supporting media. J. Environ. Manag. 2012, 112, 429–448. [Google Scholar] [CrossRef] [PubMed]
  48. Nivala, J.; Wallace, S.; Headley, T.; Kassa, K.; Brix, H.; van Afferden, M.; Müller, R. Oxygen transfer and consumption in subsurface flow treatment wetlands. Ecol. Eng. 2013, 61, 544–554. [Google Scholar] [CrossRef]
  49. Wang, R.; Baldy, V.; Périssol, C.; Korboulewsky, N. Influence of plants on microbial activity in a vertical-downflow wetland system treating waste activated sludge with high organic matter concentrations. J. Environ. Manag. 2012, 95, 158–164. [Google Scholar] [CrossRef] [PubMed]
  50. Faulwetter, J.L.; Gagnon, V.; Sundberg, C.; Chazarenc, F.; Burr, M.D.; Brisson, J.; Camper, A.K.; Stein, O.R. Microbial processes influencing performance of treatment wetlands: A review. Ecol. Eng. 2009, 35, 987–1004. [Google Scholar] [CrossRef]
  51. Paredes, D.; Kuschk, P.; Köser, H. Influence of plants and organic matter on the nitrogen removal in laboratory-scale model subsurface flow constructed wetlands inoculated with anaerobic ammonium oxidizing bacteria. Eng. Life Sci. 2007, 7, 565–576. [Google Scholar] [CrossRef]
  52. Wu, S.-Q.; Chang, J.-J.; Dai, Y.; Wu, Z.-B.; Liang, W. Treatment performance and microorganism community structure of integrated vertical-flow constructed wetland plots for domestic wastewater. Environ. Sci. Pollut. Res. 2013, 20, 3789–3798. [Google Scholar] [CrossRef] [PubMed]
  53. Kadlec, R. Large constructed wetlands for phosphorus control: A review. Water 2016, 8, 243. [Google Scholar] [CrossRef]
  54. Tanner, C.C.; Clayton, J.S.; Upsdell, M.P. Effect of loading rate and planting on treatment of dairy farm wastewaters in constructed wetlands—I. Removal of oxygen demand, suspended solids and faecal coliforms. Water Res. 1995, 29, 17–26. [Google Scholar] [CrossRef]
  55. Vohla, C.; Kõiv, M.; Bavor, H.J.; Chazarenc, F.; Mander, Ü. Filter materials for phosphorus removal from wastewater in treatment wetlands—A review. Ecol. Eng. 2011, 37, 70–89. [Google Scholar] [CrossRef]
  56. Harada, J.; Inoue, T.; Kato, K.; Uraie, N.; Sakuragi, H. Performance evaluation of hybrid treatment wetland for six years of operation in cold climate. Environ. Sci. Pollut. Res. Int. 2015, 22, 12861–12869. [Google Scholar] [CrossRef] [PubMed]
  57. Kõiv, M.; Vohla, C.; Mõtlep, R.; Liira, M.; Kirsimäe, K.; Mander, Ü. The performance of peat-filled subsurface flow filters treating landfill leachate and municipal wastewater. Ecol. Eng. 2009, 35, 204–212. [Google Scholar] [CrossRef]
  58. Brix, H. Do macrophytes play a role in constructed treatment wetlands? Water Sci. Technol. 1997, 35, 11–17. [Google Scholar] [CrossRef]
  59. Reed, S.C.; Crites, R.W.; Middlebrooks, E.J. Natural Systems for Waste Management and Treatment, 2nd ed.; McGraw-Hill: New York, NY, USA, 1995; p. 433. [Google Scholar]
  60. Vymazal, J.; Krőpfelová, L. Growth of Phragmites australis and Phalaris arundinacea in constructed wetlands for wastewater treatment in the Czech Republic. Ecol. Eng. 2005, 25, 606–621. [Google Scholar] [CrossRef]
  61. Maucieri, C.; Borin, M.; Barbera, A.C. Role of C3 plant species on carbon dioxide and methane emissions in Mediterranean constructed wetland. Ital. J. Agron. 2014, 9, 120–126. [Google Scholar] [CrossRef]
  62. Tao, W.; Bays, J.; Meyer, D.; Smardon, R.; Levy, Z. Constructed wetlands for treatment of combined sewer overflow in the US: A review of design challenges and application status. Water 2014, 6, 3362. [Google Scholar] [CrossRef]
  63. García, J.; Aguirre, P.; Barragán, J.; Mujeriego, R.; Matamoros, V.; Bayona, J.M. Effect of key design parameters on the efficiency of horizontal subsurface flow constructed wetlands. Ecol. Eng. 2005, 25, 405–418. [Google Scholar] [CrossRef]
  64. Parra, I.; Chiang, G. Modelo integrado de un sistema de biodepuración en origen de aguas residuales domiciliarias. Una propuesta para comunidades periurbanas del centro sur de Chile. Rev. Gest. Ambient. 2013, 16, 39–51. (In Spanish) [Google Scholar]
  65. Gorra, R.; Freppaz, M.; Zanini, E.; Scalenghe, R. Mountain dairy wastewater treatment with the use of a ‘irregularly shaped’ constructed wetland (Aosta Valley, Italy). Ecol. Eng. 2014, 73, 176–183. [Google Scholar] [CrossRef]
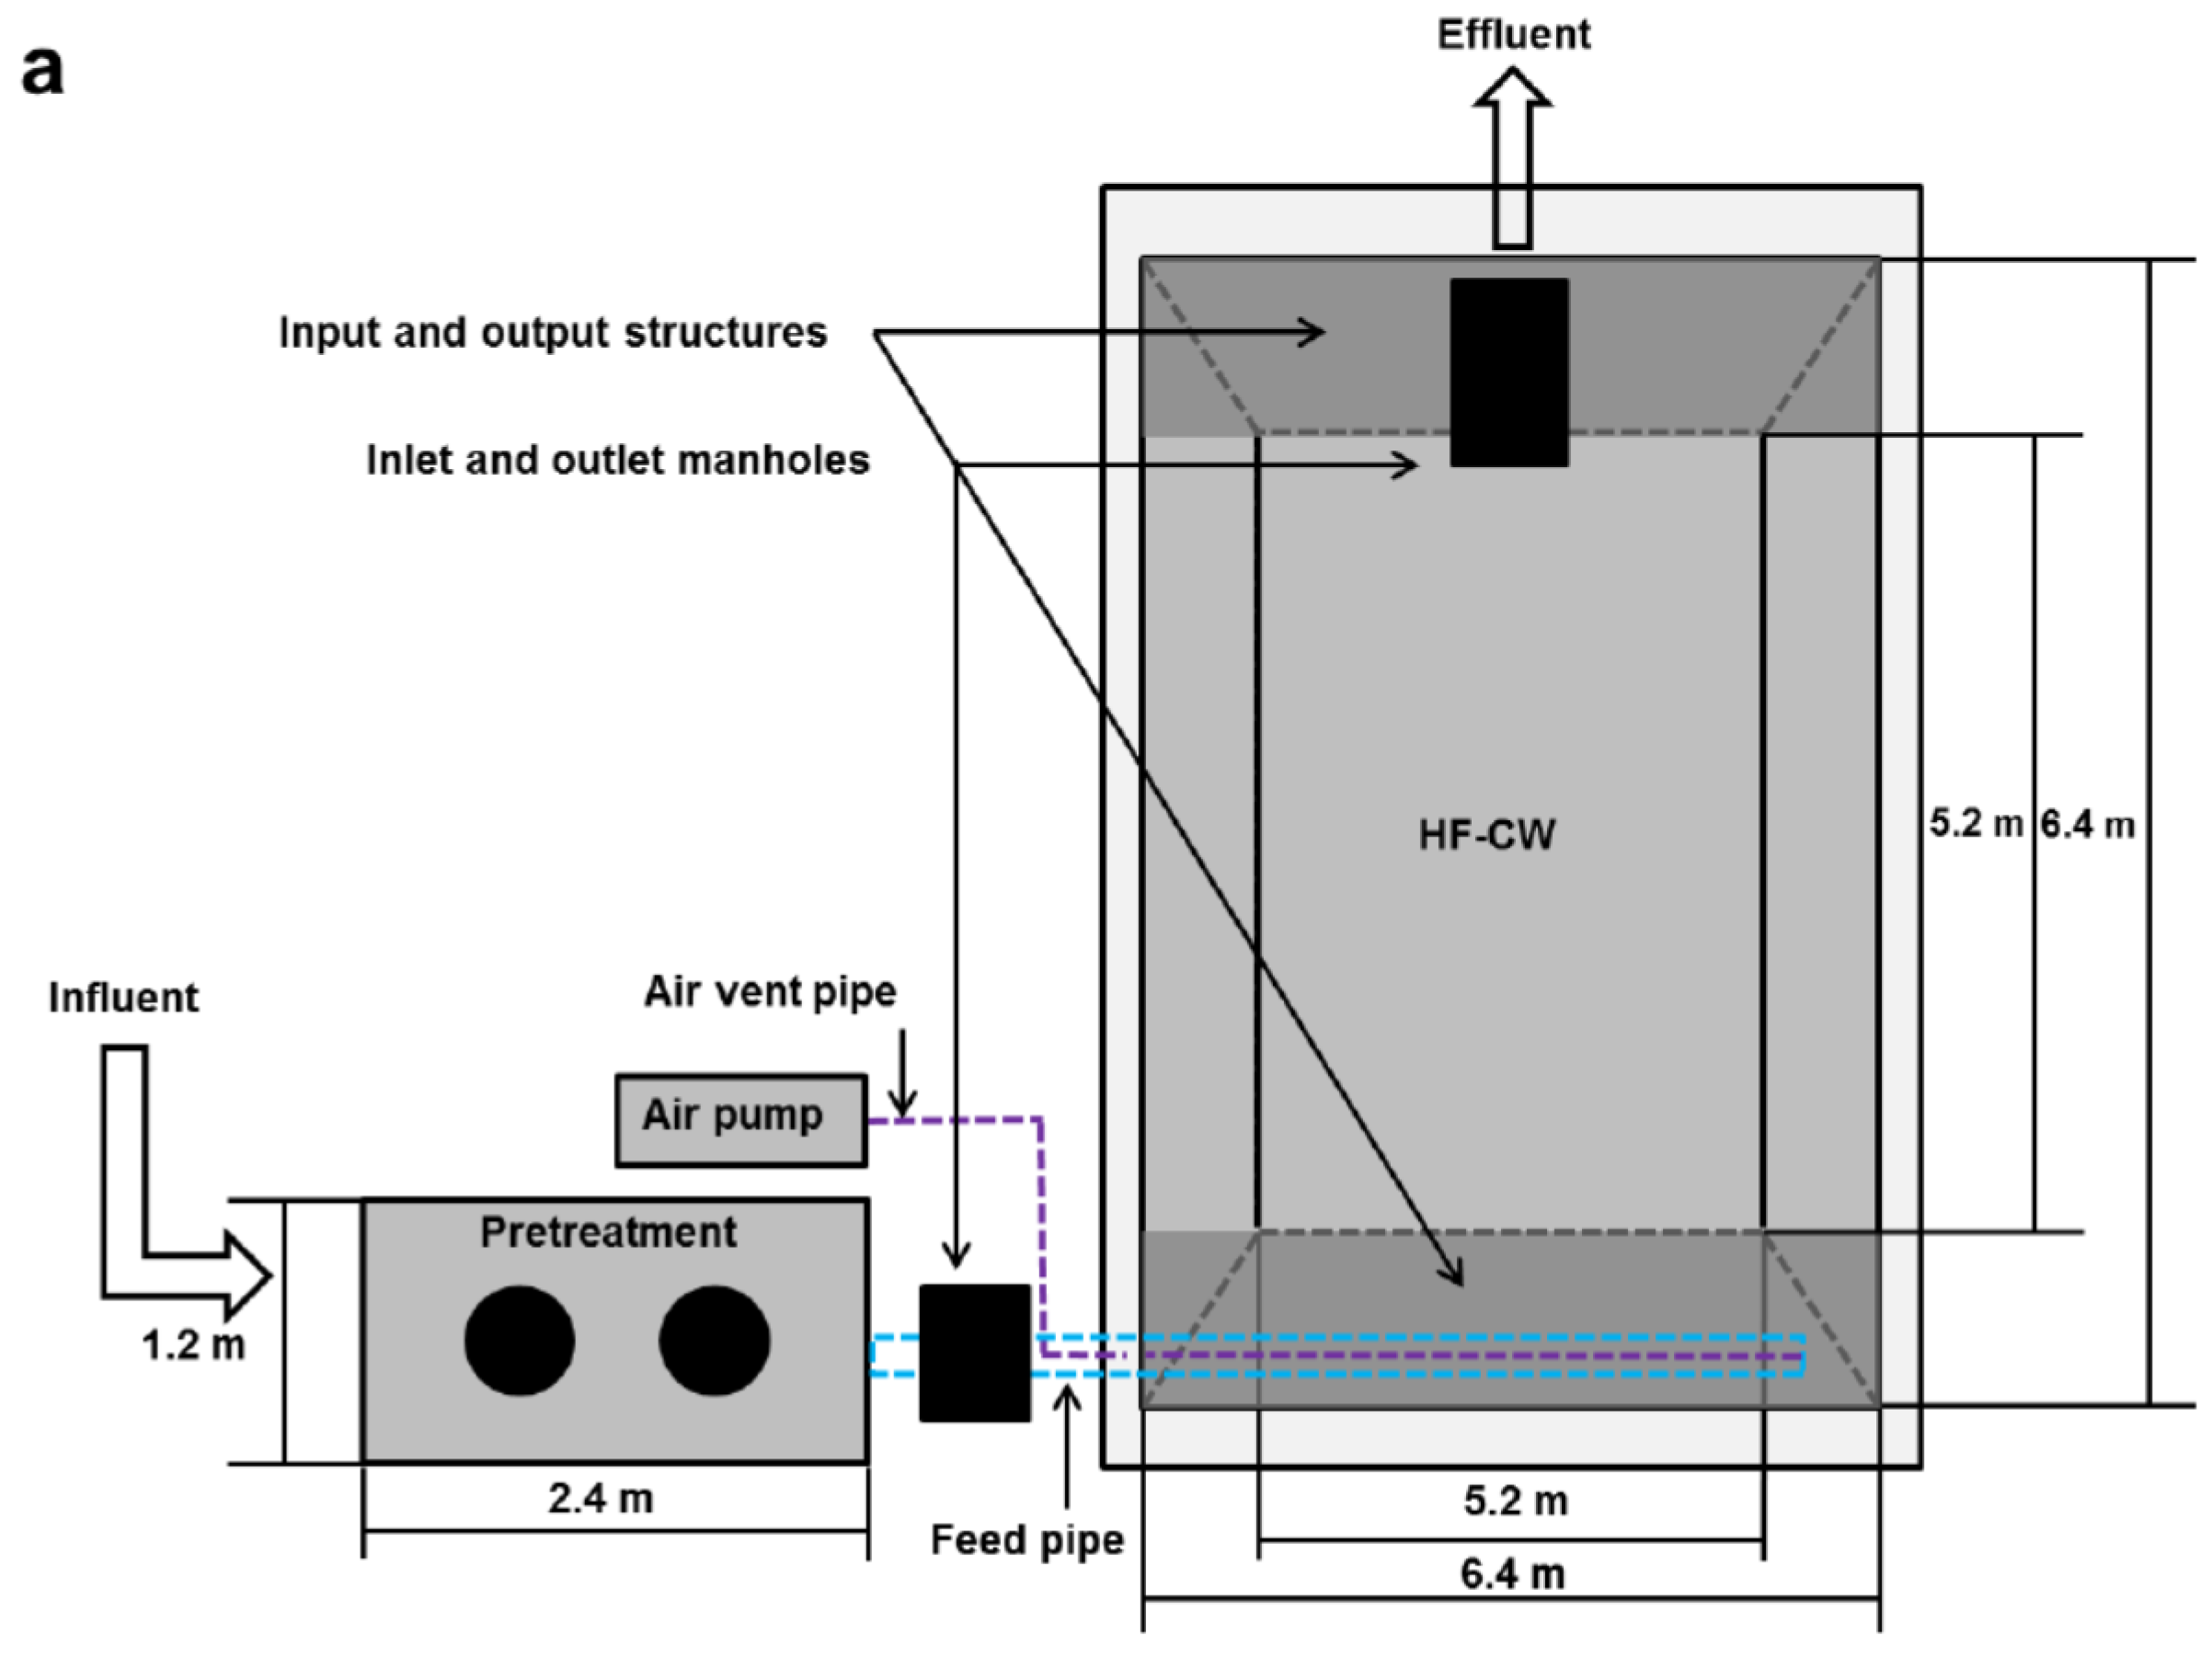
Figure 1. Plant (a) and section (b) of studied horizontal subsurface flow constructed wetland (drawing is not to scale).
Water 08 00434 g001aWater 08 00434 g001b
Figure 2. (a) Biochemical oxygen demand over five days (BOD5) and (b) Chemical oxygen demand (COD) concentrations at the influent and the effluent of the studied horizontal subsurface flow constructed wetland.
Water 08 00434 g002
Figure 3. Total suspended solids (TSS) concentrations at the influent and the effluent of the studied horizontal subsurface flow constructed wetland.
Water 08 00434 g003
Figure 4. (a) Total nitrogen (TN), (b) Ammonium nitrogen (NH4+-N), (c) Nitrate nitrogen (NO3-N) and (d) Nitrite nitrogen (NO2-N) concentrations at the influent and the effluent of studied horizontal subsurface flow constructed wetland.
Water 08 00434 g004aWater 08 00434 g004b
Figure 5. Total phosphorous (TP) concentrations at the influent and the effluent of the studied horizontal subsurface flow constructed wetland.
Water 08 00434 g005
Table 1. Concentration values (mean ± sd in mg·L−1), abatement efficiency (%) and the legal limits for discharge of the monitored parameters in the HF-CW studied.
VariableInfluentEffluentAbatement EfficiencyLimits EC [5]
First YearSecond YearFirst YearSecond YearFirst YearSecond YearValueAbatement
T (°C)23.3 ± 4.722.6 ± 4.821.4 ± 5.119.7 ± 4.8
pH7.4 ± 0.27.6 ± 0.47.7 ± 0.47.3 ± 0.2
BOD5398.9 ± 154.5349.5 ± 75.813.2 ± 5.325.4 ± 12.496.4 ± 1.892.0 ± 4.42570–90
COD710.8 ± 230.5721.1 ± 116.7102.1 ± 13.5156.1 ± 60.984.6 ± 4.077.7 ± 9.412575
TSS173.0 ± 28.2205.3 ± 31.18.8 ± 4.020.3 ± 8.794.8 ± 2.489.9 ± 4.33570–90
TN142.7 ± 11.8136.3 ± 12.029.3 ± 8.346.0 ± 17.079.5 ± 5.666.0 ± 11.71570–80
NH4+-N109.2 ± 9.997.2 ± 6.31.4 ± 1.112.8 ± 10.198.8 ± 0.986.6 ± 10.5
NO2-N0.3 ± 0.00.3 ± 0.00.3 ± 0.10.4 ± 0.1−5.8 ± 17.1−40.0 ± 41.0
NO3-N2.0 ± 1.02.4 ± 1.521.1 ± 6.225.6 ± 12.0−1280.5 ± 989.4−961.1 ± 918.0
TP20.2 ± 5.118.2 ± 3.03.2 ± 0.42.9 ± 0.783.7 ± 2.882.8 ± 4.9280
Table 2. HF-CW water balance (27 m2) in July and August.
MonthQin (m3)Kcw *ETWT (mm·m−2)P (mm·m−2)Qout (m3)
July8.14.2788.51.7−13.1
August8.14.5714.29.2−10.9
Note: * Source: unpublished author’s work.
Table 3. HF-CW performances (percentage abatement %) in the Mediterranean countries planted with Phragmites australis and surface PE−1 (m2·PE−1).
ReferenceLocationBOD5CODTSSTNNH4+-NTPSurface PE−1
[18]Spain *74.266.087.856.545.740.0–50.01.0–7.0
[19]Catalonia (Spain)65.0–97.0 83.0–97.0 55.0 4.7
[34]Ferrara (Italy)61.071.076.0 0.9
[36]Sicily (Italy)74.060.089.035.0 57.07.2
[37]Heraklion (Crete) 77.0–61.083.0–68.010.0–45.0 40.0–50.03.2
[38]Dragonja (Croatia)46.068.0 -8.3
[39]Greece76.064.0 55.043.048.012.5
[40]Marrakech (Morocco)79.078.080.08.09.015.00.7
[40]Egypt93.091.092.060.057.063.08.2
[35]Other Mediterranean countries****59.0–96.023.0–77.018.0–76.0
This study96.4–92.084.6–77.794.8–89.979.5–66.098.8–86.683.7–82.825.0
Notes: * Mean values of different experiences; ** 73.0–99.0 as organic content.
Table 4. HF-CW design models for temperatures greater than 1 °C according to Reed, Crites and Middlebrooks [59].
BOD5TSSTNTP
A s =   Q · ( ln C 0   l n C e ) K t   · d · n A s   =   Q · 100 H L R A s =   Q · ( l n C 0 l n C e ) K t · d · n A s =   100 · Q · ( l n C 0 l n C e ) K t · d · n
K t = ( 1.104 ) · ( 1.06 ) ( T 0 20 ) C e = C 0 · [ 0.1058 + ( 0.0014 · H L R ) ] K t = ( 0.4107 ) · ( 1.048 ) ( T 0 20 ) K p = 2.74
H R T =   A s · d · n Q
H L R =   100 · Q A s
L = 3 · W     A s = L · W     W =   A s 3
As = wetland treatment area (m2), Q = influent wastewater flow (m3·d−1), d = water depth in wetland (m), n = void ratio or porosity corresponding to proportion of typical wetland cross section not occupied by vegetation, Kt = rate constant corresponding to water temperature in wetland (d−1), Kp = constant phosphorous removal (cm·d−1), L = wetland length (m), W = wetland width and T0 = assumed water temperature entering wetland (°C), HLR = hydraulic loading rate (cm·d−1).
Assumed temperature design verification (BOD5 and TN)
T c =   q L q G ;      T e =   T 0   T c ;      T w =   T 0   T e 2
q L =   ( T 0   T a ) · ( U ) · ( σ ) · ( A s ) · ( H R T ) ; q G = ( C p ) · ( δ ) · ( A s ) · ( d ) · ( n )
U =   1 ( y 1 k 1 ) + ( y 2 k 2 ) + ( y 3 k 3 )
Tc = temperature change in the wetland (°C), Te = effluent temperature, T0 = assumed water temperature entering wetland (°C), Ta = average air temperature during period of concern (°C), Tw = average water temperature, qG = energy gain from water (J·°C−1), Cp = specific heat capacity of water (4215 J·kg−1·°C−1), δ = density of water (1000 kg·m−3), d = depth of water in wetland (m), n = porosity of wetland media (%), U = heat-transfer coefficient at the surface of the wetland bed (W·m−2·°C−1), k(1–n) = conductivity of layers 1 to n (W·m−1·°C−1), y(1–n) = thickness of layers 1 to n (m) , qL = energy lost via conduction at the atmosphere (J), σ = time conversion (86,400 s·d−1), HRT = hydraulic residence time in the wetland (d). HF-CW allowed consisting of a layer of 60 cm of gravel saturated (K = 2 W·m−1·°C−1), a layer of 8 cm of dry gravel (K = 1.5 W·m−1·°C−1) and a layer 15 cm with traces of vegetation (K = 0.05 W·m−1·°C−1).
Table 5. HF-CW theoretical areas for BOD5, TSS, TN and TP according to Reed’s method.
Design ParameterAs (m2)L (m)W (m)HRT (d)HLR (cm·d−1)m2·PE−1
BOD55.223.961.324.375.212.91
TSS0.180.740.250.151500.10
TN10.145.521.848.482.695.65
TP23.838.462.8219.951.1413.27
Table 6. Variables considered for redesign the HF-CW studied.
VariablesValues
Inhabitants4
Influent wastewater flow (Q)0.27 m3·d−1
VegetationPhragmites australis
Deep (d)0.60 m
Medium gravel 25 mm (n)0.38
Bed slope1%
BOD5 inlet (C0)400 mg·L−1
BOD5 outlet (Ce)25 mg·L−1
TSS inlet (C0)190 mg·L−1
TSS outlet (Ce)60 mg·L−1
TN inlet (C0)140 mg·L−1
TN outlet (Ce)15 mg·L−1
TP inlet (C0)22 mg·L−1
TP outlet (Ce)2 mg·L−1
Ta lowest temperature in winter (average) 3.00 °C
TM average winter temperature11.50 °C