Article

Combined ICESat and CryoSat-2 Altimetry for Accessing Water Level Dynamics of Tibetan Lakes over 2003–2014

1
Institute of Tibetan Plateau Research (ITP), Chinese Academy of Sciences (CAS), 18 Shuangquing Road, Haidian District, Beijing 100085, China
2
Department of Geography, University of California Los Angeles, 1255 Bunche Hall, Los Angeles, CA 90095, USA
3
Hydrological Bureau in the Tibet Autonomous Region, 78 Sela Road, Lhasa 850000, China
*
Authors to whom correspondence should be addressed.
Water 2015, 7(9), 4685-4700; https://doi.org/10.3390/w7094685
Submission received: 21 May 2015 / Accepted: 17 August 2015 / Published: 27 August 2015

Abstract

:
Long-term observations of lake water level are essential to our understanding of the evolution of Tibetan lake system. CryoSat-2 radar altimetry data over the Tibetan Plateau (2010–2014, P2) is used to extend lake level measurements from ICESat laser altimetry (2003–2009, P1). This study evaluates the performance of CryoSat-2 data by comparing with gauge-based water levels that are calibrated by ICESat-observed water level time series, and quantifies the uncertainty of water-level change rate estimates from satellite altimetry measurements. We completely investigate the 131 lakes that were observed by both ICESat and CryoSat-2. The mean change rate of water level for all of examined lakes in P2 (0.19 ± 0.03 m·year–1) is slightly lower than that (0.21 ± 0.02 m·year–1) observed in P1. The extended lake level time series also indicates that, in the past few years, lakes in the Northern Changtang (especially in Hol Xil) showed accelerated growth; and that the extensive lake level rises north to the Gangdise Mountains, during 2003–2009, were found dampened during the CryoSat-2 observation period. The spatio-temporal heterogeneity of precipitation observed from weather stations can be used to partly explain the observed temporal pattern of lake level changes over different sub-zones of the plateau.

1. Introduction

Recent research reveals dramatic changes in water level and mass budgets of Tibetan lakes in the early twenty-first century [1,2,3,4], indicating a sharp alteration existing in mass balance of Asian “water tower” [2,4,5] and an evident signal of climate dynamics [3,6,7,8,9]. These findings greatly depend on the lake elevation measurements by the Ice, Cloud, and land Elevation satellite (ICESat), as long-term in situ hydrological observations at the plateau scale are unavailable due to the remoteness and broad coverage of the Tibetan Plateau (TP).
One of the advantages of ICESat laser altimetry is the small footprint size with a diameter of ~70 m [10], which makes it an effective alternative to measure elevations of earth surface at a fine scale. However, the short temporal coverage of ICESat data (2003–2009) impedes the investigation of change trends of water level at a long timescale. In contrast, plenty of radar altimetry missions provide practical measurements of continental water surface elevations with a temporal coverage of more than twenty years since the 1990s, such as TOPEX/POSEIDON, ERS-1/2, Envisat, and Jason-1/2, at the accuracy ranging from centimeters to decimeters [11,12]. However, these radar altimeters are only suitable for large water bodies and many lakes are only visited by one or two satellites due to their large-size footprints and along-track/cross-track spacing [13,14]. Thus, it is necessary to seek a solution of synthesizing multiple satellite altimetry datasets for sustainable monitoring on Tibetan lake dynamics.
The ESA satellite CryoSat-2, launched in 2010, carries a radar altimeter named Synthetic aperture Interferometric Radar ALtimeter (SIRAL) [15]. Compared to conventional radar altimetry, the CryoSat-2 SIRAL provides earth surface measurements at a much higher resolution in the along-track direction, about 300 m. This higher spatial resolution opens new possibilities with respect to monitoring small lakes in the Tibetan Plateau. The CryoSat-2 altimetry data is essential to sustain accurate water-level measurements for Tibetan lakes by ICESat. This study targets at examining whether dramatic changes of Tibetan lakes were accelerated or shifted by extending the six-year window of the ICESat-based lake level data. Prior to synthesizing the ICESat and CryoSat-2 altimetry data, we evaluate the accuracy of CryoSat-2 altimetry observations and consistency with ICESat data based on gauge-based lake level data. Additionally, the possible links of different change patterns of lake levels with precipitation variability are discussed.

2. Study Area, Data and Methods
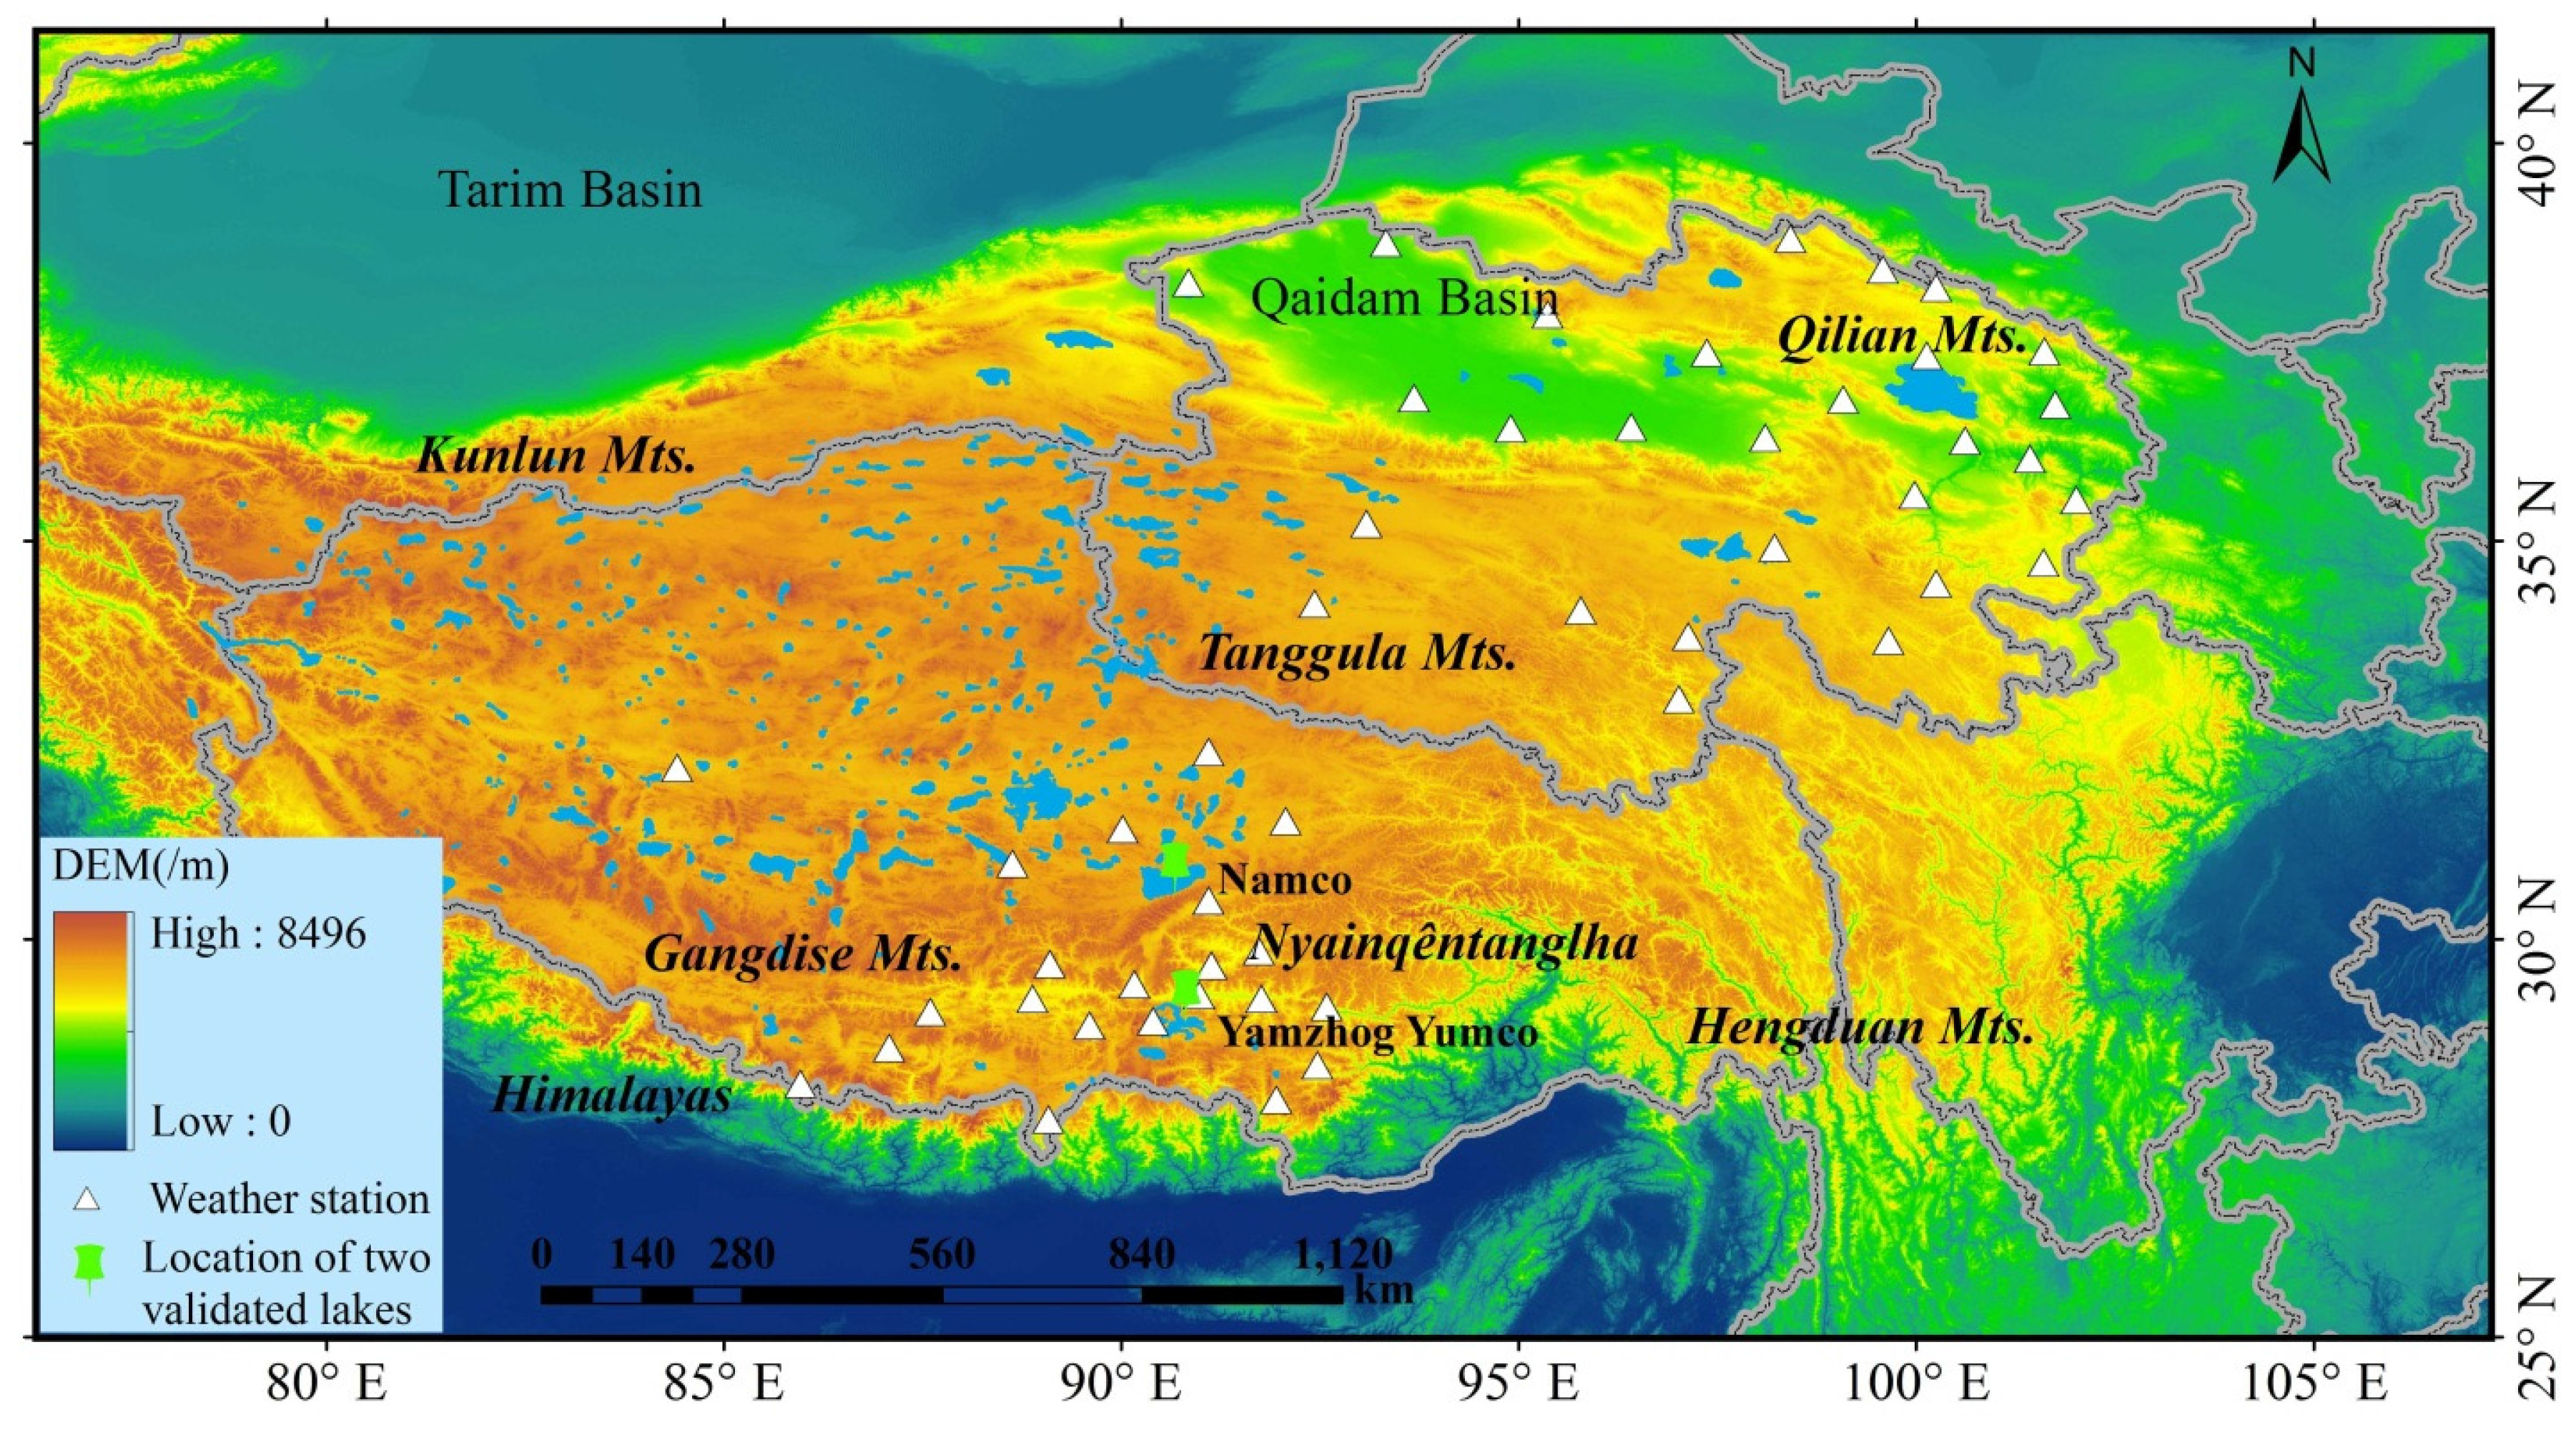
2.1. Tibetan Lakes

The Tibetan Plateau is the highest plateau on Earth, with an average elevation exceeding 4000 m (Figure 1). It is surrounded by many large mountain ranges, such as the Himalayas, Kunlun Mountains, and Qilian Mountains, and is home to the largest group of high-altitude lakes. The climate of the region is characterized by strong seasonality. The majority of precipitation, more than 60%–90% of the annual total, fall between June and September and less than 10% fall between November and February [16,17]. In summer, several regional or large-scale atmospheric circulations, such as the Indian monsoon and the East Asian monsoon, bring most of the TP’s precipitation. In winter, the climate is mainly dominated by cold and dry westerlies [18]. Due to its broad spatial coverage and rapid terrain changes, climate of the TP shows strong spatial and temporal variability.
Figure 1. Map of study area showing the spatial distribution of Tibetan lakes and topographic characteristics. Digital elevation model (DEM) shown in this figure is derived from SRTM DEM dataset. The white triangles and green nail symbols represent, respectively, the locations of weather stations and validated lakes selected for this study.
Water 07 04685 g001

2.2. CryoSat-2 Altimetry Data

The CryoSat-2 satellite was launched on 8 April 2010, carrying a new type of altimeter operating in Ku-band. The SIRAL altimeter is able to operate in three different modes: Low Resolution mode, SAR mode and SAR Interferometic (SARIn) mode [19]. Over rugged terrains (such as high Asia), SIRAL is operating in SARIn mode. Due to the use of a second antenna (interferometry), a correction for the cross-track slope is performed [15]. It is therefore expected that CryoSat-2 is able to find more reliable water level samples for lakes surrounded by rapidly changing topography [15]. Furthermore, CryoSat-2 operates in a 369-day repeat cycle, which is built of shifting subcycles of 30 days [20]. Thus, the density of CryoSat-2 ground tracks is high (7–8 km spacing at the Equator) and many small water bodies are covered. Since the spacing is dense, larger lakes are visited more often. Geophysical and atmospheric corrections are used to correct altimeter measurements from different perturbations due to the environment and ensure the highest precision output data. We used Level-2 SIRAL SARIn mode data over Tibetan lakes [19], which include each month of the period July 2010 to April 2014.

2.3. ICESat Altimetry Data

NASA’s ICESat altimetry measurements were used to examine water level variations of the lakes during 2003–2009. The reliability of ICESat altimetry data used for investigating water level changes of Tibetan lakes has been confirmed by comparing with hydrological station data, radar altimetry, and lake area data derived from optical images [1,2,7,21,22]. We obtained the ICESat Level-2 altimetry data (Release-33) during 2003–2009 from National Snow and Ice Data Center [3,10].

2.4. In Situ Lake Level Observations and Other Materials

Due to the low accessibility of high-altitude lakes, there are only a few Tibetan lakes with multi-year water level observations. In this study, we obtained the gauge-based lake level data of Namco (30.50°–30.90° N, 90.27°–91.05° E) and Yamzhog Yumco (28.73°–29.18° N, 90.30°–91.10° E). It should be noted that the water area of Yamzhog Yumco is featured by a narrow (less than several kilometers in width) and zigzag shape, and thus it may be considered as the representation for evaluating the performance of satellite altimetry on small lakes. For Namco, the field observation station is located close to the southeast shore, and daily water levels have been observed manually at the gauge near the Namco Station (30.7730° N, 90.9620° E) since 2005. For Yamzhog Yumco, daily gauge-based lake level was observed at Baidi Station (29.1278° N, 90.4403° E), covering the period 2003–2013. Some of lake level measurements were missing or excluded possibly due to the influences of strong lake waves or harsh weather conditions.
To further discuss the possible link of Tibetan lake dynamics with precipitation variability, we obtained annual precipitation data of 51 national weather stations near Tibetan lake basins between 1991 and 2013 from the China Meteorological Data Sharing Service System [7]. The geographical locations for selected stations and multi-year averages of climate for each station are shown in Table 1.
Table 1. Description of selected meteorological stations and two climatic variables temperature (T) and precipitation (P) in different sub-zones of the Tibetan Plateau.
Station IDNameElevation (m)Latitude (°)Longitude (°)T (°C)P (mm)
MeanStd.MeanStd.
South Tibet
55773Pali4302.027.733389.08330.50.6448.255.3
55690Cuona4280.327.983391.95000.30.6425.158.7
55655Nielaer3810.028.183385.96674.00.6601.8113.4
55696Longzi3860.028.416792.46675.70.4299.764.0
55664Dingri4300.028.633387.08333.50.5302.977.5
55680Jiangzi4040.028.916789.60005.40.5280.959.9
55681Langkazi4432.428.966790.40003.40.6381.680.9
55569Lazi4000.029.083387.60007.30.5353.793.0
56307Jiacha3260.029.150092.58339.60.5530.1118.8
55578Shigatse3836.029.250088.88337.00.5440.9111.4
55598Zedang3551.729.250091.76679.40.7401.997.9
55589Gongga3555.329.300090.98338.90.5416.5114.9
55585Nimu3809.429.433390.16677.40.5358.082.9
55591Lhasa3648.929.666791.13338.90.7463.390.7
55572Nanmulin4000.029.683389.10006.20.4480.3129.7
55593Mozhugongka3804.329.850091.73336.50.7571.4116.4
55437Pulan3900.030.283381.25003.90.7147.346.5
Southern Changtang
55493Damxung4200.030.483391.10002.30.7489.2105.0
55472Xainza4672.030.950088.63330.50.6346.676.5
55279Bange4700.031.383390.0167−0.10.7340.273.8
55299Nagqu4507.031.483392.0667−0.30.7455.483.1
55248Gaize4414.932.150084.41670.80.8187.741.7
55294Anduo4800.032.350091.1000−2.20.8470.965.4
northeastern TP
56029Yushu3681.233.016797.01673.90.7480.268.4
56046Dari3967.533.750099.6500−0.30.7562.061.2
56034Qingshuihe4415.433.800097.1333−4.00.9518.270.2
56021Qulaima4175.034.133395.7833−1.40.7429.173.2
56043Guoluo3719.034.4667100.25000.10.6515.672.7
56065Henan3500.034.7333101.60000.00.6561.790.7
56033Maduo4272.334.916798.2167−3.00.7342.351.5
52974Tongren2491.435.5167102.01676.50.6402.865.2
52943Xinghai3323.235.583399.98331.90.4374.570.8
52868Guizhou2237.136.0333101.43337.80.5251.150.7
52856Qiaboqia2835.036.2667100.61674.90.6315.640.4
52836Dulan3189.036.300098.10003.70.5222.857.7
52818Golmud2807.636.416794.90006.10.644.616.6
52825Nomhon2790.436.433396.41675.60.551.325.9
52866Xining2295.236.7167101.75006.00.5413.160.3
52754Gangcha3301.537.3333100.13330.30.5383.341.3
52737Delingha2981.537.366797.36674.70.5205.458.9
52765Menyuan2850.037.3833101.61671.50.5511.460.6
52713Da Qaidam3173.237.850095.36672.80.794.035.2
52657Qilian2787.438.1833100.25001.70.5413.762.6
52645Yeniugou3320.038.416799.5833−2.40.6428.181.8
52633Tuole3367.038.800098.4167−1.90.5311.459.6
Northern Changtang (Hol Xil)
56004Tuotuohe4533.134.216792.4333−3.30.8305.774.5
52908Wudaoliang4612.235.216793.0833−4.70.6325.357.9
51886Mangya2944.838.250090.85004.10.548.623.5
52707Xiaozaohuo2767.036.800093.68334.70.631.413.1
52602Lenghu2770.038.750093.33333.30.517.68.8
Notes: The temperature and precipitation of weather stations are referenced to the multi-year averages during 1991 and 2013. The std. means the standard deviations for annual mean T and annual P.

2.5. Height Reference System Conversion of Satellite Altimetry, Data Processing and Estimation of Lake Level Trends

Water level measurements from the two satellite altimetry datasets are referenced to different ellipsoids and height data: the ICESat dataset contains corrected surface ellipsoidal heights referenced to TOPEX/Poseidon ellipsoid and geoid heights referenced to Earth Gravity Model (EGM) 2008; while the CryoSat-2 data are referenced to WGS84 and EGM96. In order to make them comparable, we first converted ICESat height data to the reference system of CryoSat-2 data. Then, on-lake satellite altimetry footprints were selected via the water mask of Tibetan lakes derived from Landsat image classification [2,23]. The binary water mask, at a resolution of 30 m, is sufficient for identifying altimetry footprints in this study. As the satellite altimetry may be influenced by cloud cover, lakeside terrains or signal saturation (such cases given in [1]), elevations for on-lake footprints probably do not represent the actual lake water levels. Therefore, after masking out non-water measurements, the footprints with abnormal water level measurements were further detected by outlier detection based on the box plot method. The general procedures of multi-source lake level data processing and merging are similar to the methods introduced in prior studies [9]. Additionally, visual inspection and interactive editing were also conducted for the processed lake level data by automated procedure. In general, the lower height measurements were used to estimate the mean of each lake entity, as the “contaminated” factors (e.g., cloud, terrains) tend to generate height overestimates.
Temporal trends of lake level were fitted through elevation observations of all on-lake footprints during the examined periods using the robust fitting method. The robust fitting uses an iterative re-weighted least squares approach in which all samples receive an equal weight for the first iteration and subsequently decreasing weights are given to points that deviate further from the regression model iterations until the regression coefficients converge [24]. The trend represents the mean change in lake surface elevation over the satellite acquisition period. In this approach, altimetry periods are implicitly weighted according to the number of on-lake footprints. In addition, we also calculated the trends estimated by linear regression of footprint-averaged elevations on each observation period, which are mostly similar to that by robust fitting and, thus, are not shown. The robust fitting method is less sensitive to random noises especially in case of the small number of footprints. The 95% confidence levels represent the statistical error of the trend fitting.

3. Results and Analysis

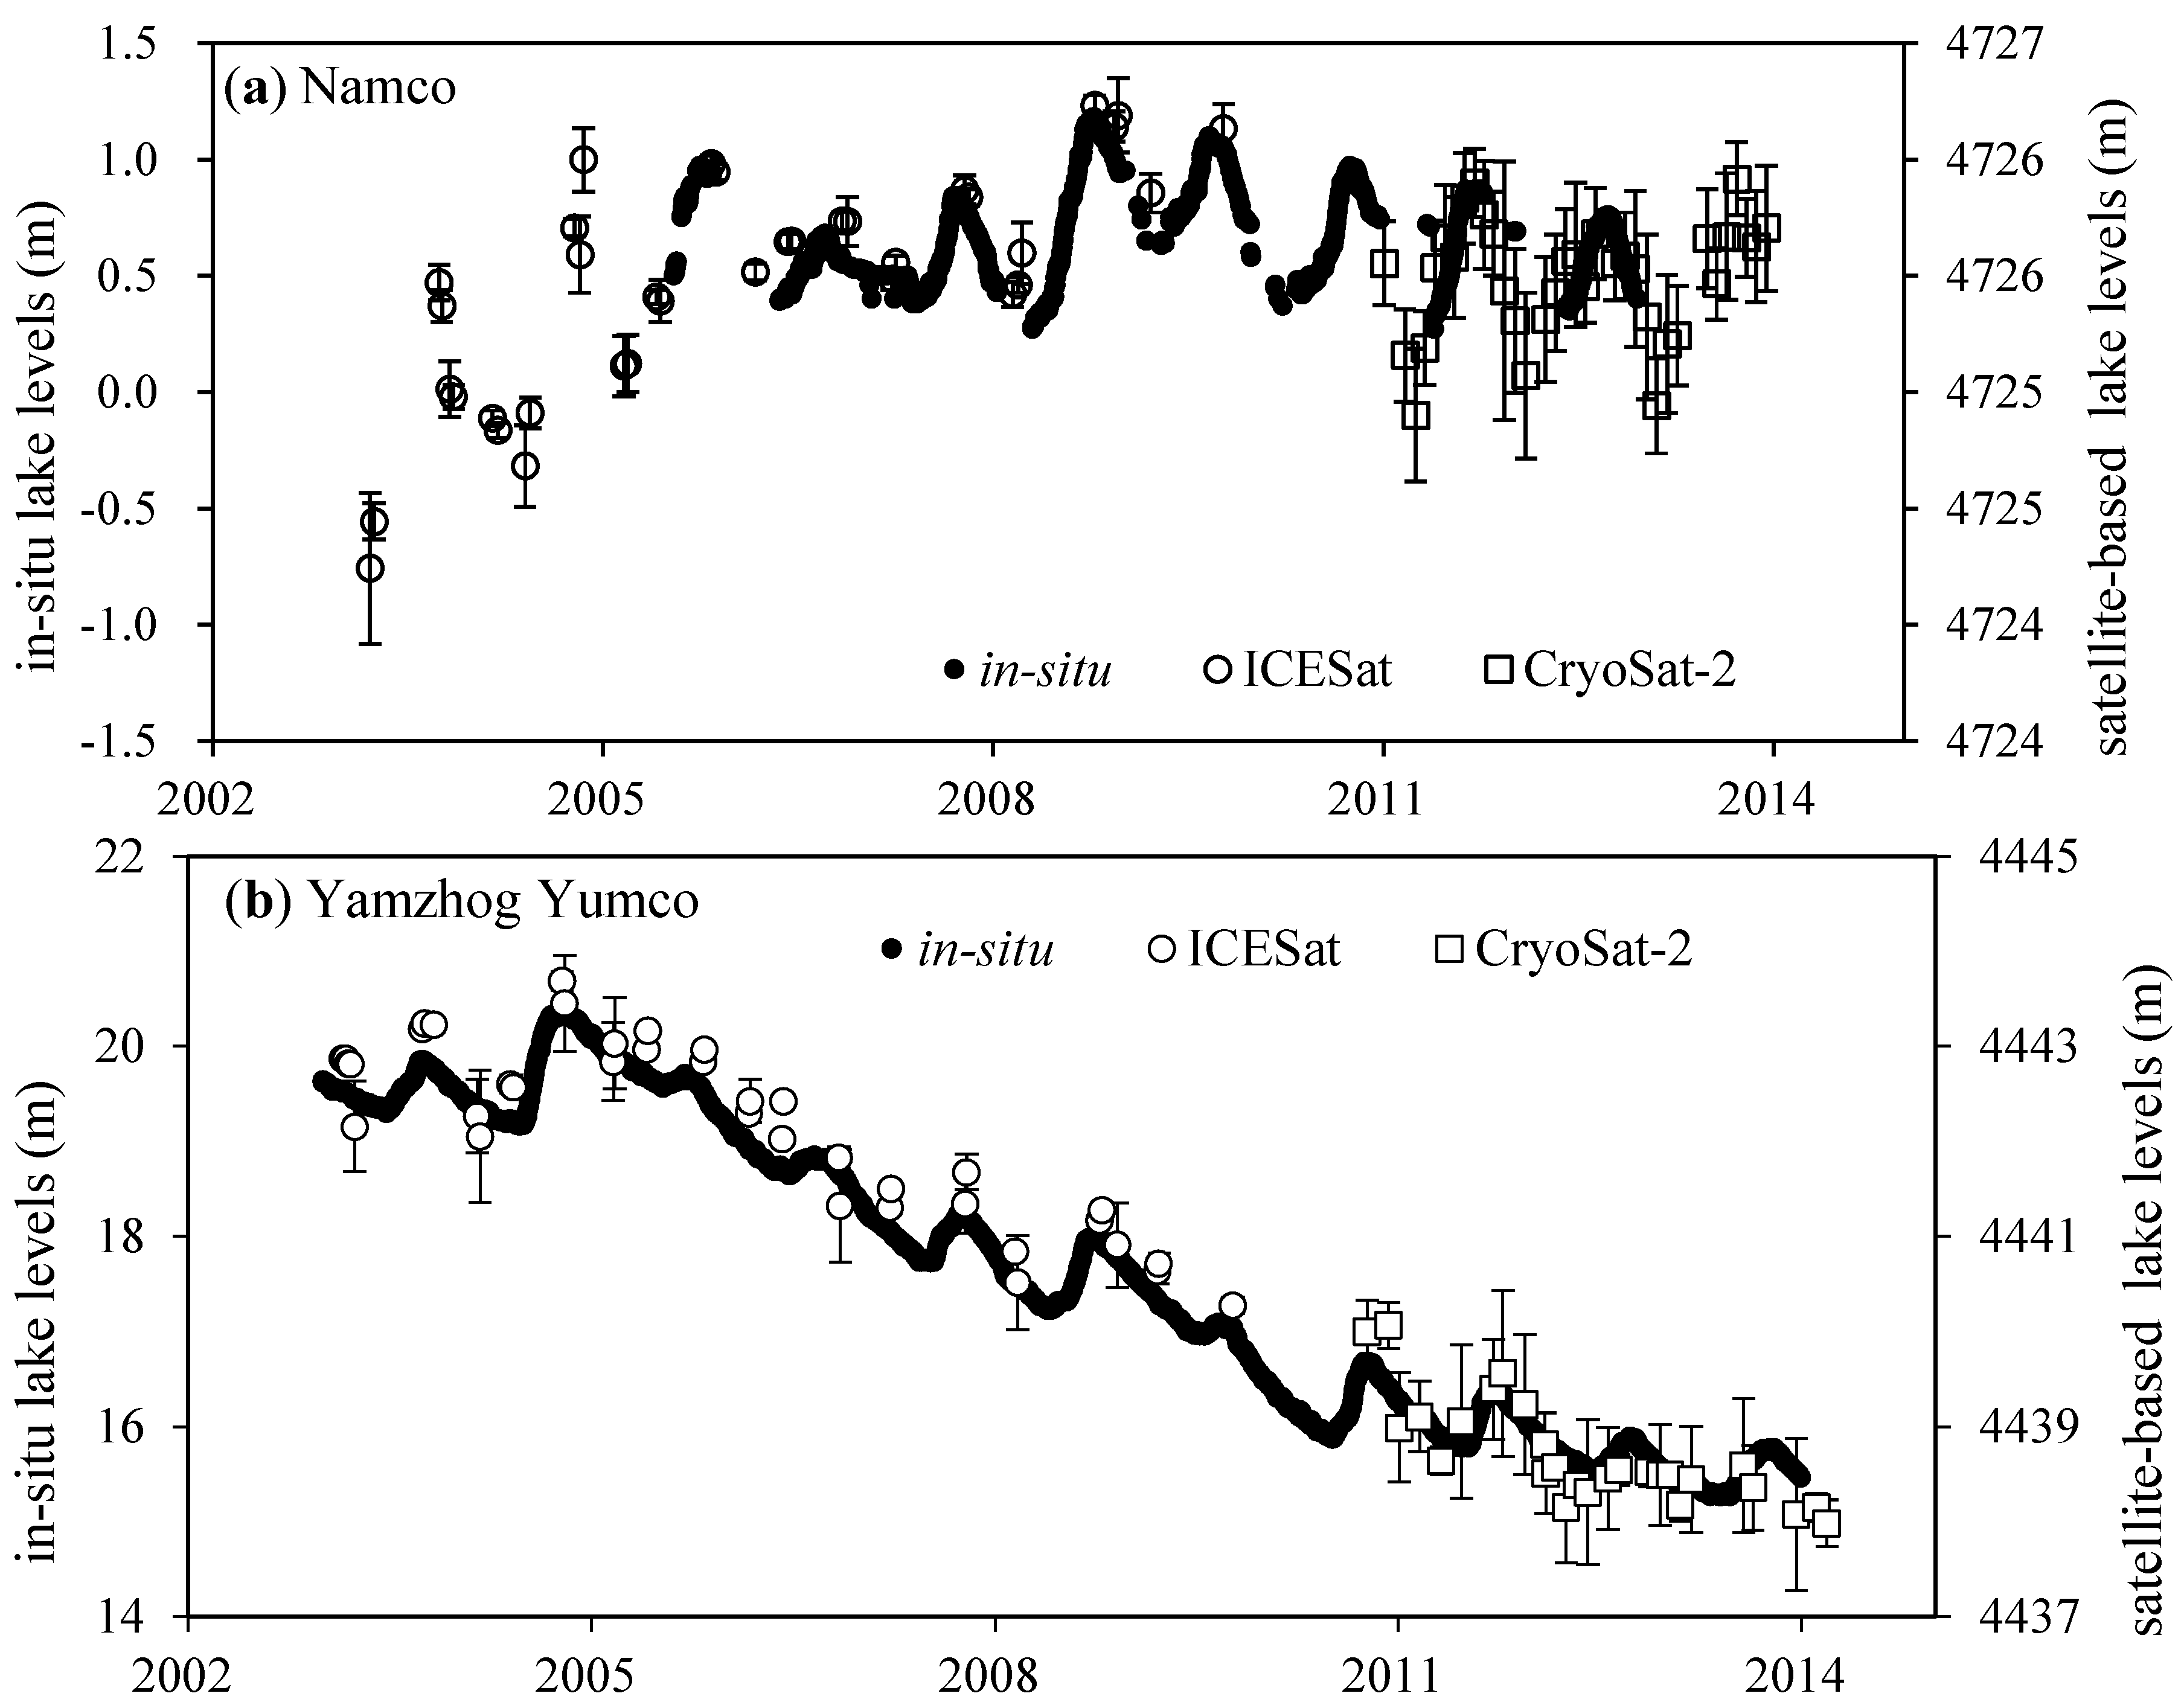
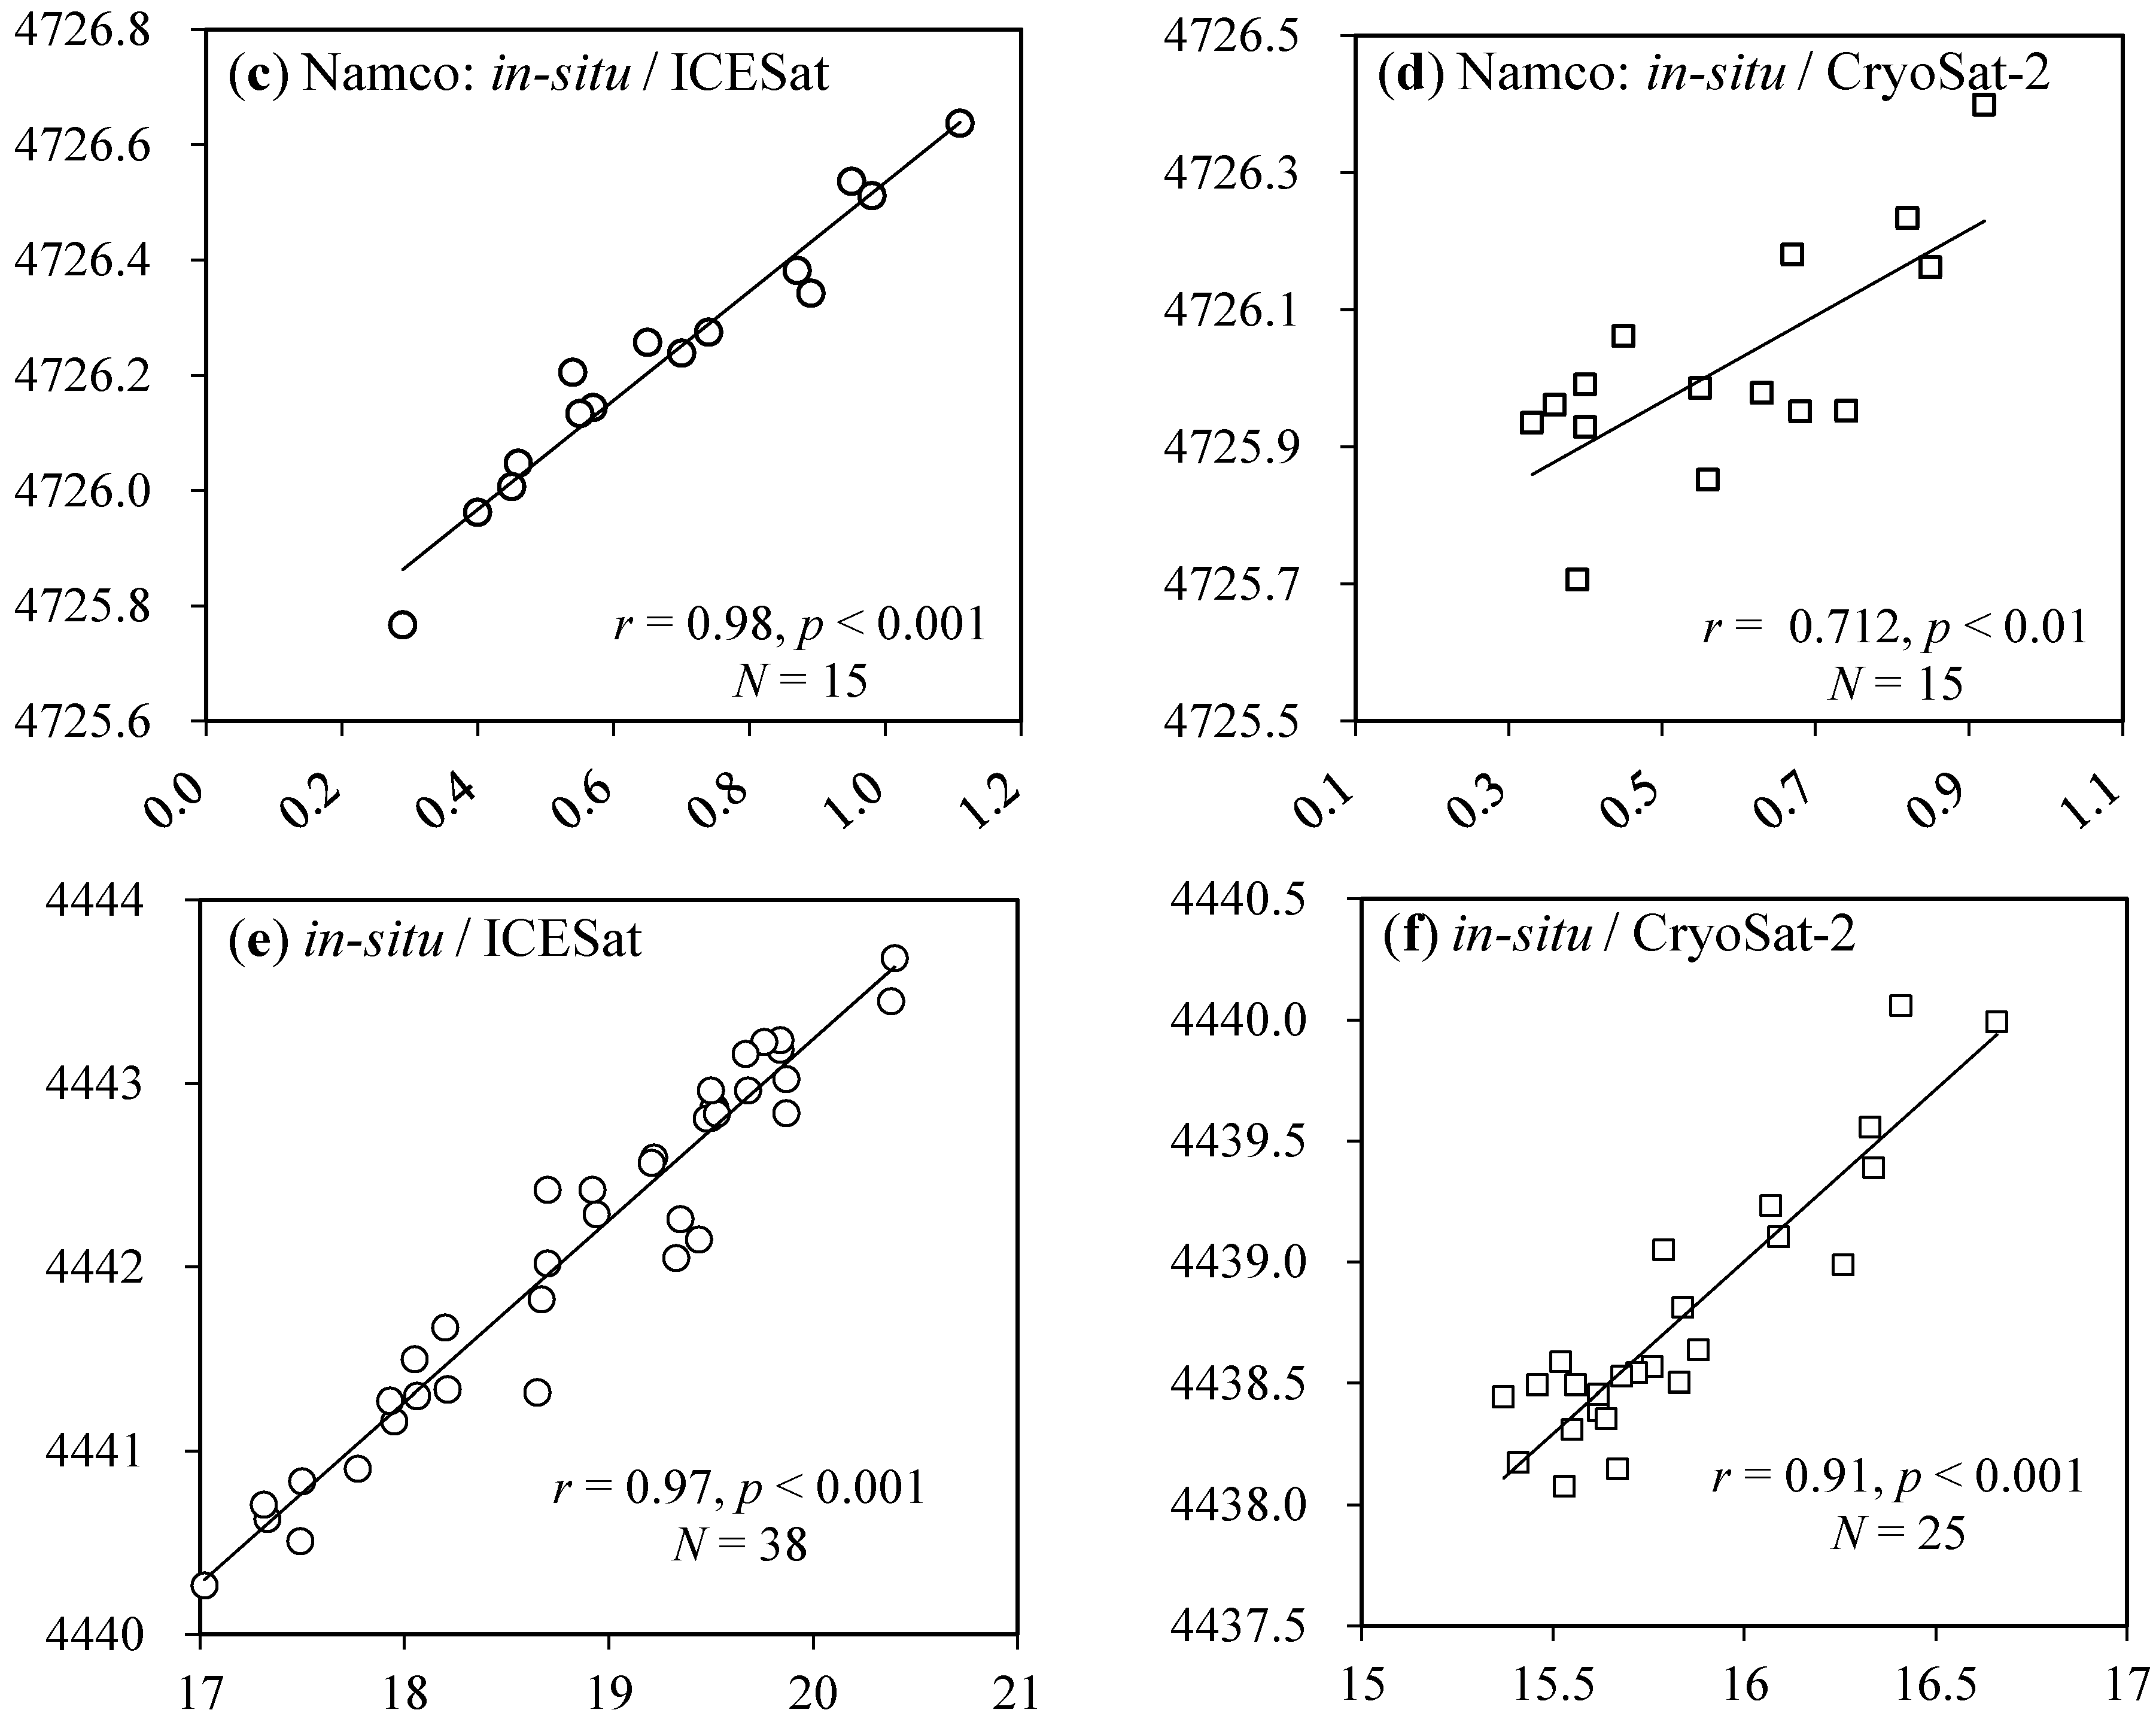
3.1. Evaluation of Cryosat-2 Altimetry Data on the Two Typical Lakes

Gauge-based water level data (in situ data) for Namco and Yamzhog Yumco, in form of relative lake surface heights, were used to compare with lake levels from CryoSat-2 altimetry. As shown in Figure 2, the ICESat altimetry measurements are significantly correlated with gauge-based data, with the correlation coefficients (r) of 0.98 and 0.99 for Namco and Yamzhog Yumco. Given high consistency between the two datasets, it is safe to adjust the relative gauge water-level data to orthometric heights by adding an offset of mean differences between ICESat and in situ data (4725.55 m and 4423.11 m for Namco and Yamzhog Yumco, respectively). Then the adjusted gauge data can be directly compared with the water level data from CryoSat-2. For Namco the absolute mean error (AME) and relative mean square error (RMSE) are −0.12 m and 0.18 m, respectively; for Yamzhog Yumco, the AME and RMSE are −0.17 m and 0.28 m, respectively. The results indicate good agreement between CryoSat-2 altimetry measurements and gauge data and high consistency with ICESat altimetry data. The relatively larger bias of CrySat-2 altimetry on Yamzhog Yumco could be partly attributed to the more narrow lake water extent comparing with Namco.
It is worth noting that CyroSat-2 altimetry measurements for both lakes show negative biases, which are probably attributed to the combined effects originated from multiple factors including the underestimation caused by water surface penetration of the CryoSat-2 altimetry in SARIn mode [25], data processing [26], or instrumental bias between both altimeters of ICESat and CryoSat-2 [27]. We corrected the CyroSat-2 altimetry data by adding the underestimation biases (Namco: −0.12 m, Yamzhog Yumco: −0.17 m) and calculated regression slopes of adjusted lake level time series. The results show a bias of less than 0.03 m·year−1 (Figure not shown). This bias is relatively marginal compared with the change rates of water level for most of examined lakes. Additionally, as the accuracy validation was conducted only for two lakes, it is difficult to conclude that the bias is from systematic deviations of the CryoSat-2 altimetry; thus, we do not apply extra correction on the combined ICESat/CryoSat-2 altimetry datasets for other lakes in the following analysis. The change rate of 0.03 m·year−1 is determined as the threshold of identifying whether lakes may be in normal fluctuation.
The combined ICESat/CryoSat-2 water-level time series provide more than one-decade record of lake dynamics, revealing different evolution characteristics which are not indicated over the ICESat mission (Figure 2). For example, the extension of CyroSat-2 altimetry data shows the stagnation of rising trend or even slightly decreases in Namco lake level after 2009. In contrast, combined lake level time series of Yamzhog Yumco suggests a sharp decrease at the rate of −0.52 m·year−1 (p < 0.001), which is more rapid than that (−0.41 m·year−1) during 2003–2009. These characteristics can be well depicted by both gauge and satellite-based lake levels.
Figure 2. Evaluation of satellite altimetry measurements with in situ lake level data for Namco, and Yamzhog Yumco. Plots (a,b) Comparison of time series of combined ICESat/CryoSat-2/in situ lake levels; scatter plots (cf) comparisons of paired (sampled in the same date) in situ water level (x-axis: m) and ICESat/ CryoSat-2 altimetry measurements (y-axis: m).
Water 07 04685 g002aWater 07 04685 g002b

3.2. Water Level Changes of Tibetan Lakes Based on Combined Satellite Altimetry Measurements

Tibetan lake level changes during 2003–2009 have been investigated in some earlier studies based on ICESat data [1,3,21]. In this study we focus on examining and comparing the lake level changes during the two observation periods 2003–2009 (P1) and 2010–2014 (P2). We completely investigate 131 lakes larger than 1 km2 and with both ICESat and CryoSat-2 measurements for more than three years. By utilizing the robust linear regression method, we respectively obtained change rates of water level during the two periods P1 and P2. During the P2 period, the mean rising rate for all of examined lakes is 0.19 ± 0.03 m·year–1, in comparison with the mean rising rate of 0.21 ± 0.02 m·year–1 observed in P1. More specifically, 22.9% lakes are found with obvious water level declines (less than –0.03 m·year–1) during P2, higher than that of P1 (12.2%), which indicates a downward trend of water level change for the examined lakes in the P2 period.
The spatial pattern of lake level changes between P1 and P2 is characterized by strong heterogeneity in different climatic and geographic sub-zones (Table 2 and Figure 3). The spatial division of different climate sub-zones is referenced to the climate regionalization of China [28] with minor adjustments on the boundaries by referring to the division of lake watersheds. The most obvious discrepancies of water-level changes during the two sub-periods are observed in the Southern Changtang (north of the Gangdise Mountains) where the mean change rate decreased in P2, and the Northern Changtang and Kunlun, where rising rates of water level increased obviously. Lakes in the western TP and Central Qinghai showed no obvious differences in change rate estimates between the two sub-periods. In contrast, lakes in South Tibet showed obvious declining trends in water level during both P1 and P2, with the mean change rates of −0.19 ± 0.01 m·year–1 and −0.18 ± 0.03 m·year–1, respectively. It is worth mentioning that the change rate of lake level during 2003–2014 is not between that during P1 and P2 for sub-zone R1 and R6. That may be because the lake level variations in 2009/2010 (the gap between ICESat/CryoSat-2 altimetry missions) are not considered. For example, large water level declines for Yamzhog Yumco (Figure 2) in 2009 lead to larger decreasing rate of −0.52 m·year–1 during 2003–2014 than that estimated for 2003–2009 (−0.41 m·year–1) and 2010–2014 (−0.45 m·year–1). Another reason is larger uncertainties for the change rate estimates in the sub-period P2 due to the shorter lake level time series.
Table 2. Comparison on change rates of lake level in different climate sub-zones observed during three periods 2003–2009, 2010–2014 and 2003–2014.
Sub-ZonesClimate TypeArea (km2)Area-Averaged Lake Level Change Rates (m·year−1)
2003–20092010–20142003–2014
R1-South Tibettemperate and semi-arid1775.16−0.19 ± 0.01−0.18 ± 0.03−0.25 ± 0.01
R2-Southern Changtangsubarctic and semi-arid11812.170.28 ± 0.030.18 ± 0.020.19 ± 0.01
R3-Northern Changtangsubarctic and arid2368.560.32 ± 0.010.48 ± 0.080.34 ± 0.01
R4-western TPtemperate and arid586.760.13 ± 0.010.02 ± 0.020.02 ± 0.02
R5-Northern Kunluntemperate and arid1028.860.23 ± 0.010.56 ± 0.020.33 ± 0.01
R6-Central Qinghaisubarctic and semi-humid830.810.19 ± 0.010.08 ± 0.040.05 ± 0.01
R7-Qaidam Basintemperate and arid312.810.03 ± 0.030.04 ± 0.150.03 ± 0.02
R8-northeastern TPtemperate and semi-arid5247.790.13 ± 0.000.19 ± 0.020.14 ± 0.00
Total area (TP lakes)23962.910.21 ± 0.020.19 ± 0.030.16 ± 0.01
The extension of elevation measurements with CryoSat-2 altimetry data favors the examination of change trends of lake water level at a longer timescale. Figure 3a presents change rates of water level for the 131 lakes from 2003 to 2014. There are 80 (61.1%) lakes that show increasing water level (≥0.03 m·year−1), 33 (25.2%) lakes with declined water levels (≤−0.03 m·year−1), and 18 lakes (13.7%) at relatively stable stages (−0.03–0.03 m·year−1). The most significant growth is observed in lakes in the central Changtang Plateau and Hol Xil, with slighter increasing or even decreasing water level for lakes in the peripheral areas. Further, we calculated the difference between change rates of lake levels observed during P1 and P2 (shown in Figure 3b). Most lakes in the Southern Changtang showed decelerated water level rises or even shrinking trends. For example, the largest lake in Tibet, Silingco, showed a slowing water-level rising rate of 0.45 m·year−1 during 2010–2014, compared to the change rate of 0.69 m·year−1 during 2003–2009. The water level time series of Namco (as seen in Figure 2a) is another good example [29]. In contrast, lakes in the northern plateau (around the Hol Xil and Tanggula Mountains) were experiencing accelerated increases in water level.
Figure 3. Water-level change of Tibetan lakes derived from combined ICESat and CryoSat-2 measurements. (a) Change rates of lake level during 2003–2014; (b) difference of change rates of lake level between the two periods 2003–2009 and 2010–2014. R1-8 show eight sub-zones with different geographic and climatic features: R1, South Tibet temperate and semi-arid; R2, southern Changtang subarctic and semi-arid; R3, northern Changtang subarctic and arid; R4, western TP temperate and arid; R5, northern Kunlun temperate and arid; R6, Central Qinghai subarctic and semi-humid; R7, Qaidam Basin temperate and arid; R8, northeastern Tibetan Plateau temperate and semi-arid.
Water 07 04685 g003

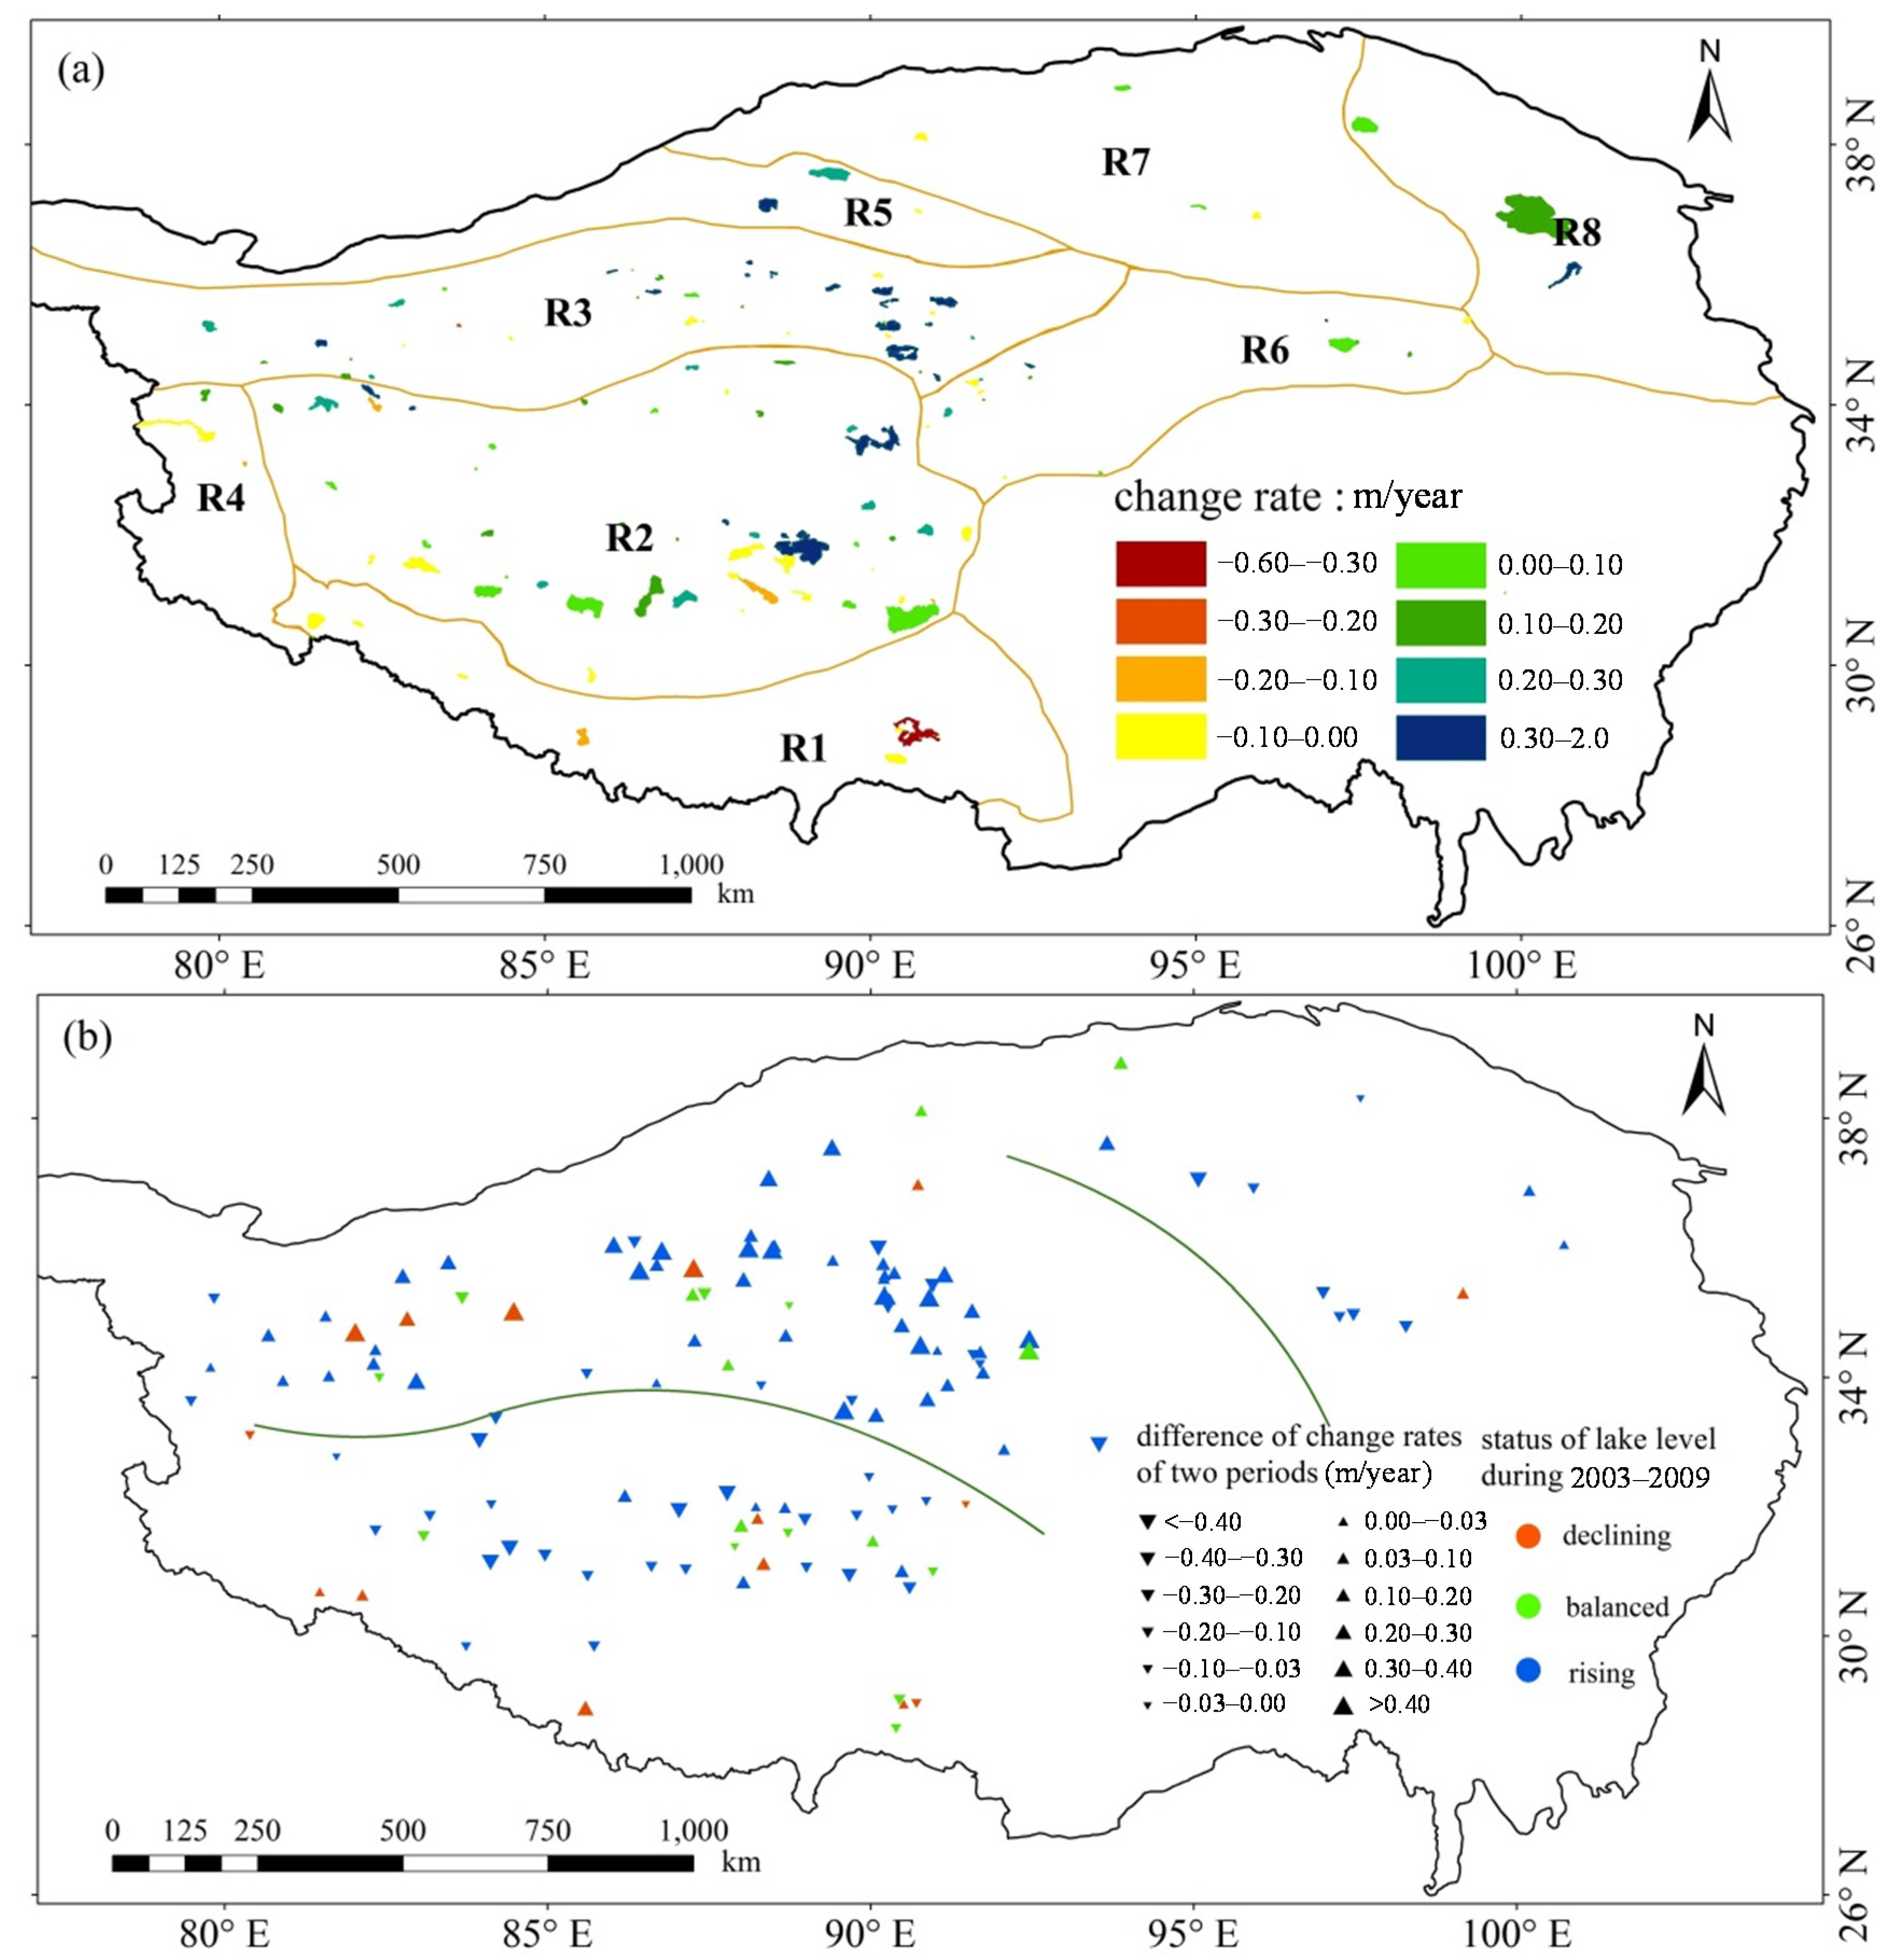
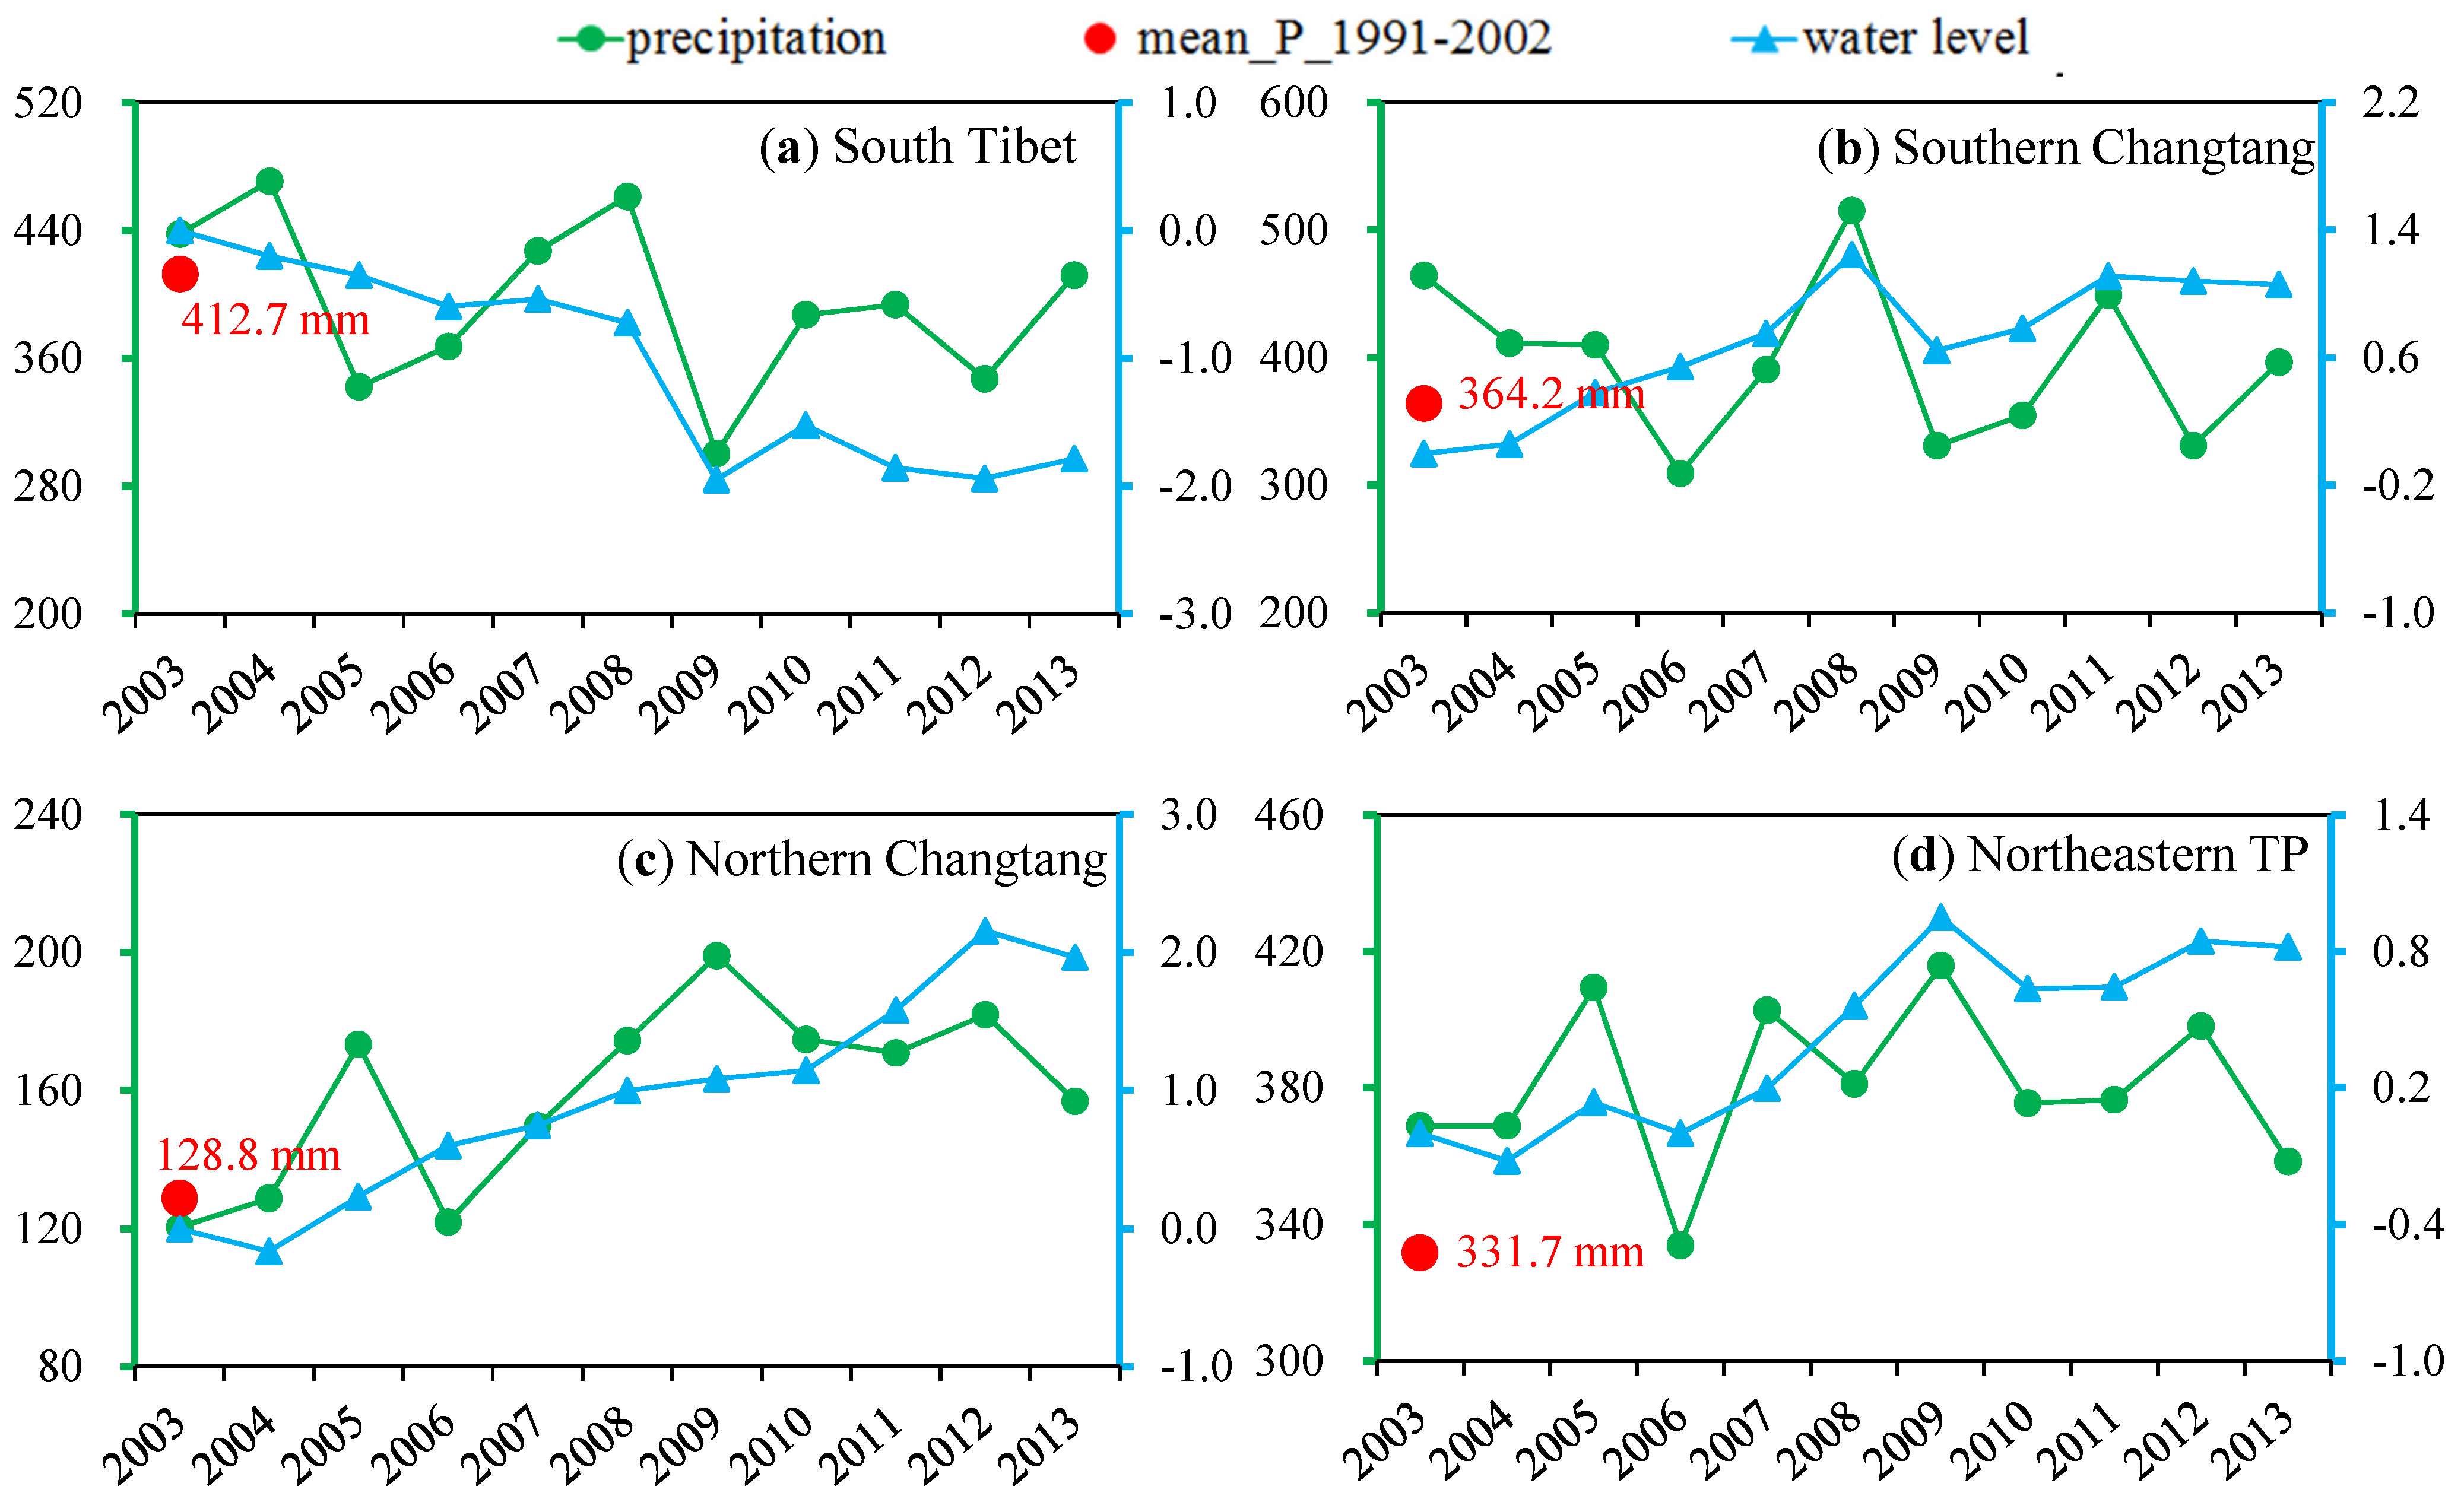
4. Discussion on the Potential Cause of Regional Lake Change Patterns

The main driving force behind dramatic lake dynamics over the TP has been under debate recently [3,6,7,30,31,32,33,34]. One viewpoint supports that increasing glacial meltwater is the primary factor of rapid lake expansions in the Tibetan Plateau as most mountain glaciers showed obvious retreats during the past decades. It can hold water only for a few lakes that are supplied with sufficient meltwater runoff by a large number of mountain glaciers within the catchments, such as in the Tanggula Mountains [35]. According to results in Phan et al. [36], over half of Tibetan lakes are almost not supplied by glacial meltwater. Some recent research indicate that increasing precipitation may be the main driving mechanism of lake growths at the plateau scale [3,6]. As analyzed in Section 3.2, most of examined lakes over Hol Xil showed accelerated growths while rising rates of lake levels along the Gangdise Mountains decreased. Thus, whether the lasting water-level rises or dampened trends for different lakes were associated with change patterns of precipitation in different sub-areas is further examined below.
Figure 4 illustrates time series of annual precipitation and lake level anomaly (water level variations relative to the initial lake stage during the studied period) between 2003 and 2013 over four sub-areas including South Tibet, Southern Changtang, Northern Changtang and the northeastern TP. Other sub-areas are not examined here due to the lack of weather stations and sparse lake distribution. The selected weather stations in each sub-area are presented in Table 1 and Figure 1. It can be found that lake level dynamics agree with annual precipitation variability in general, particularly for specific years with obviously high or low precipitation. The correlation coefficients (rH_P) between annual lake level variations and precipitation are higher than 0.5 for the four sub-areas. In South Tibet, annual precipitation showed significant decreasing trends (−7.4 mm·year−1, p < 0.01) since the late-1990s. The annual precipitation averages in the periods 2003–2009 (401.0 mm) and 2010–2014 (384.9 mm) were evidently lower than precipitation average during 1991–2002 (412.7 mm). The lasting precipitation decreases could be a major factor resulting in continued shrinkage for lakes in South Tibet (rH_P = 0.54, p < 0.1). In contrast, annual precipitation during 2003–2013 for other three sub-areas was mostly higher than multi-year averaged precipitation during 1991–2002. It largely accounts for the situation that most lakes in the inner and northeastern TP exhibited large rises in water level in the 2000s. However, contrasting different phases during 2003–2014 (i.e., P1 and P2), the temporal patterns of lake water level vary with different sub-areas.
Along the Gangdise Mountains, there are at least ten lakes larger than 100 km2. From historical Landsat images and ICESat measurements, these lakes showed extent expansion and water-level rises in the 1990s and early 2000s [1,2,6,21,37,38]. However, the trends began to slow down or even reverse in the past few years. This shift matches the temporal pattern of annual precipitation, which showed significant increase (~12 mm·year−1, p < 0.01) from 1994 to 2005 and then followed by strong inter-annual variability. The precipitation average during the phase P2 was ~20 mm less than that in P1. In comparison, precipitation in the northern Changtang showed strong inter-annual variability during 2003–2009 and then became obviously higher after 2009. It is inferred to be largely associated with accelerated water-level rises for most lakes in this sub-area (rH_P = 0.59, p < 0.05). The above analysis confirms the associations of lake level change patterns and precipitation variability in different sub-areas. However, the contribution to lake water balances from other factors cannot be ignored, including glacial meltwater replenishment, groundwater discharge, and permafrost degradation, particularly for some lakes located in the Kunlun Mountains and Tanggula Mountains which are supplied by abundant glacial meltwater [39]. Thus, the next work will be to distinguish lakes with various dominated water supply ways and quantitatively estimate the role of different hydrological components on water budgets at basin scale.
Figure 4. Comparison of time series of annual precipitation (P, left axis: mm) and lake level anomaly (water level variations relative to the initial water stage in the studied period) (right axis: m) between 2003 and 2013 for four different sub-zones: (a) South Tibet; (b) Southern Changtang; (c) Northern Changtang; and (d) the northeastern Tibetan Plateau. The precipitation time series are obtained by averaging multi-station data in each sub-zone, and the red symbol indicates the multi-year averaged annual precipitation during 1991–2002, as a reference baseline; lake level anomaly are obtained by averaging water level anomalies observed in September–November (at stable stage) for all lakes in each sub-area.
Water 07 04685 g004

5. Conclusions

The integration of ICESat and CryoSat-2 altimetry measurements allows for better understanding Tibetan lake dynamics at a longer timescale. In this study, both fine-scale satellite altimetry datasets are used for the investigation of lake level evolutions after the ICESat mission. By comparing with corrected gauge-based water levels of Namco and Yamzhog Yumco, CryoSat-2 altimetry data shows strong correlations with gauge-based data (r: 0.71 and 0.91, respectively), with negative bias of order 0.1 m. The error may cause a small biased estimate of change rate of lake levels but less than 0.03 m·year–1. The CryoSat-2 altimetry can be considered as a reliable extension of ICESat altimetry mission for monitoring Tibetan lake changes. The over-one-decade (2003–2014) elevation records reveal a generally similar spatial pattern of water-level change rate with that observed during 2003–2009 as reported in prior work. To compare lake level changes during the two phases of 2003–2009 and 2010–2014, the mean change rate of all of examined lakes in P2 (0.19 ± 0.03 m·year–1) is slightly lower than that (0.21 ± 0.02 m·year–1) observed in P1. Moreover, most lakes in Northern Changtang (especially for the Hol Xil Region) showed accelerated growth tendency; while lakes north to the Gangdise Mountains showed slowing water-level rises or even stagnations.
The combined longer time series of water level data is essential to our understanding of driving forces of Tibetan lake dynamics. The different change patterns of lake level are closely linked to the spatial heterogeneity of precipitation change observed from weather stations. However, a clear knowledge of the driving mechanism of Tibetan lake dynamics still requires longer and more extensive observations of Tibetan lakes, climate, glaciers, and permafrost. This research work reported herein is an important step towards integrating the wealth of high spatial-resolution altimetry data available from ICESat-1, Operation CryoSat-2, together with other satellite altimetry data that will be available in the near future, such as ICESat-2 mission, to provide sustainable observations on lake hydrologic system of the third pole.

Acknowledgments

This work was supported by National Natural Science Foundation of China (41120114001, 41125003, 41071254, 40971048), by the National Special Basic Research Project of the Ministry of Science and Technology (Grant No. 2013FY111400-2, 2009CB723901), by program from the European Space Agency (ESA AO 2605), by the Knowledge Innovation Foundation Program for outstanding Young Scholar of CAS (Grant No. KZCX2-EW-QN104). The project was also supported by Open Research Fund of Key Laboratory of Tibetan Environmental Changes and Land Surface Processes in CAS, and by Open Fund of State Key Laboratory of Remote Sensing Science. We thank the National Snow and Ice Data Center for the ICESat altimetry data, the European Space Agency for the CryoSat-2 data, and the China Meteorological Data Sharing Service System for meteorological data in this study. We also acknowledge Xiao Cheng of Beijing Normal University, College Global Change and Earth System Science and Jibiao Zong of Institute of Tibetan Plateau Research (ITP), Chinese Academy of Sciences (CAS) for their assistance in pre-processing the CryoSat-2 altimetry data.

Author Contributions

Chunqiao Song performed the satellite data processing, results analysis and manuscript preparation; Qinghua Ye contributed to plan, data and result analysis; Yongwei Sheng contributed to the result analysis and manuscript editing; Tongliang Gong performed in-situ data analysis of Yamzhog Yumco.

Conflicts of Interest

The authors declare no conflict of interest.

References

  1. Phan, V.H.; Lindenbergh, R.; Menenti, M. Icesat derived elevation changes of tibetan lakes between 2003 and 2009. Int. J. Appl. Earth Obs. 2012, 17, 12–22. [Google Scholar] [CrossRef]
  2. Song, C.; Huang, B.; Ke, L. Modeling and analysis of lake water storage changes on the tibetan plateau using multi-mission satellite data. Remote Sens. Environ. 2013, 135, 25–35. [Google Scholar] [CrossRef]
  3. Song, C.; Huang, B.; Richards, K.; Ke, L.; Hien Phan, V. Accelerated lake expansion on the tibetan plateau in the 2000s: Induced by glacial melting or other processes? Water Resour. Res. 2014, 50, 3170–3186. [Google Scholar] [CrossRef]
  4. Zhang, G.; Yao, T.; Xie, H.; Kang, S.; Lei, Y. Increased mass over the tibetan plateau: From lakes or glaciers? Geophys. Res. Lett. 2013, 40, 2025–2130. [Google Scholar] [CrossRef]
  5. Jacob, T.; Wahr, J.; Pfeffer, W.T.; Swenson, S. Recent contributions of glaciers and ice caps to sea level rise. Nature 2012, 482, 514–518. [Google Scholar] [CrossRef] [PubMed]
  6. Lei, Y.; Yang, K.; Wang, B.; Sheng, Y.; Bird, B.W.; Zhang, G.; Tian, L. Response of inland lake dynamics over the tibetan plateau to climate change. Clim. Chang. 2014, 125, 281–290. [Google Scholar] [CrossRef]
  7. Song, C.; Huang, B.; Ke, L.; Richards, K.S. Seasonal and abrupt changes in the water level of closed lakes on the tibetan plateau and implications for climate impacts. J. Hydrol. 2014, 514, 131–144. [Google Scholar] [CrossRef]
  8. Yang, K.; Wu, H.; Qin, J.; Lin, C.; Tang, W.; Chen, Y. Recent climate changes over the tibetan plateau and their impacts on energy and water cycle: A review. Glob. Planet Chang. 2014, 112, 79–91. [Google Scholar] [CrossRef]
  9. Wang, X.; Gong, P.; Zhao, Y.; Xu, Y.; Cheng, X.; Niu, Z.; Luo, Z.; Huang, H.; Sun, F.; Li, X. Water-level changes in China’s large lakes determined from icesat/glas data. Remote Sens. Environ. 2013, 132, 131–144. [Google Scholar] [CrossRef]
  10. Schutz, B.; Zwally, H.; Shuman, C.; Hancock, D.; di Marzio, J. Overview of the icesat mission. Geophys. Res. Lett. 2005, 32. [Google Scholar] [CrossRef]
  11. Calmant, S.; Seyler, F.; Cretaux, J.F. Monitoring continental surface waters by satellite altimetry. Surv. Geophys. 2008, 29, 247–269. [Google Scholar] [CrossRef]
  12. Crétaux, J.F.; Birkett, C. Lake studies from satellite radar altimetry. C. R. Geosci. 2006, 338, 1098–1112. [Google Scholar] [CrossRef]
  13. Kropáček, J.; Braun, A.; Kang, S.; Feng, C.; Ye, Q.; Hochschild, V. Analysis of lake level changes in nam co in central tibet utilizing synergistic satellite altimetry and optical imagery. Int. J. Appl. Earth Obs. 2012, 17, 3–11. [Google Scholar] [CrossRef]
  14. Hwang, C.; Peng, M.F.; Ning, J.; Luo, J.; Sui, C.H. Lake level variations in china from topex/poseidon altimetry: Data quality assessment and links to precipitation and enso. Geophys. J. Int. 2005, 161, 1–11. [Google Scholar] [CrossRef]
  15. Kleinherenbrink, M.; Ditmar, P.; Lindenbergh, R. Retracking cryosat data in the sarin mode and robust lake level extraction. Remote Sens. Environ. 2014, 152, 38–50. [Google Scholar] [CrossRef]
  16. Xu, Z.; Gong, T.; Li, J. Decadal trend of climate in the tibetan plateau—Regional temperature and precipitation. Hydrol. Process. 2008, 22, 3056–3065. [Google Scholar] [CrossRef]
  17. Meng, Y.; Liu, G.; Li, M. Tracing the sources and processes of groundwater in an alpine glacierized region in southwest china: Evidence from environmental isotopes. Water 2015, 7, 2673–2690. [Google Scholar] [CrossRef]
  18. Yao, T.; Thompson, L.; Yang, W.; Yu, W.; Gao, Y.; Guo, X.; Yang, X.; Duan, K.; Zhao, H.; Xu, B. Different glacier status with atmospheric circulations in tibetan plateau and surroundings. Nat. Clim. Chang. 2012, 2, 663–667. [Google Scholar] [CrossRef]
  19. Wingham, D.; Francis, C.; Baker, S.; Bouzinac, C.; Brockley, D.; Cullen, R.; de Chateau-Thierry, P.; Laxon, S.; Mallow, U.; Mavrocordatos, C. Cryosat: A mission to determine the fluctuations in earth’s land and marine ice fields. Adv. Space Res. 2006, 37, 841–871. [Google Scholar] [CrossRef]
  20. Labroue, S.; Boy, F.; Picot, N.; Urvoy, M.; Ablain, M. First quality assessment of the cryosat-2 altimetric system over ocean. Adv. Space Res. 2012, 50, 1030–1045. [Google Scholar] [CrossRef]
  21. Zhang, G.; Xie, H.; Kang, S.; Yi, D.; Ackley, S.F. Monitoring lake level changes on the tibetan plateau using icesat altimetry data (2003–2009). Remote Sens. Environ. 2011, 115, 1733–1742. [Google Scholar] [CrossRef]
  22. Wang, X.; Cheng, X.; Gong, P.; Huang, H.; Li, Z.; Li, X. Earth science applications of icesat/glas: A review. Int. J. Remote Sens. 2011, 32, 8837–8864. [Google Scholar] [CrossRef]
  23. Ji, L.; Geng, X.; Sun, K.; Zhao, Y.; Gong, P. Target detection method for water mapping using landsat 8 oli/tirs imagery. Water 2015, 7, 794–817. [Google Scholar] [CrossRef]
  24. Kääb, A.; Berthier, E.; Nuth, C.; Gardelle, J.; Arnaud, Y. Contrasting patterns of early twenty-first-century glacier mass change in the himalayas. Nature 2012, 488, 495–498. [Google Scholar] [CrossRef]
  25. Siegfried, M.R.; Fricker, H.A.; Roberts, M.; Scambos, T.A.; Tulaczyk, S. A decade of west antarctic subglacial lake interactions from combined icesat and cryosat-2 altimetry. Geophys. Res. Lett. 2014, 41, 891–898. [Google Scholar] [CrossRef]
  26. McMillan, M.; Corr, H.; Shepherd, A.; Ridout, A.; Laxon, S.; Cullen, R. Three-dimensional mapping by cryosat-2 of subglacial lake volume changes. Geophys. Res. Lett. 2013, 40, 4321–4327. [Google Scholar] [CrossRef]
  27. Absolute Calibration of Radar Altimeter over Lakes. Available online: http://meetings.copernicus.org/www.cosis.net/abstracts/EGU2007/07620/EGU2007-J-07620.pdf (accessed on 24 August 2015).
  28. Zheng, J.; Yin, Y.; Li, B. A new scheme for climate regionalization in china. Acta Geogr. Sin. 2010, 65, 3–12. (In Chinese) [Google Scholar]
  29. Ye, Q.; Zhu, L.; Zheng, H.; Naruse, R.; Zhang, X.; Kang, S. Glacier and lake variations in the yamzhog yumco basin, southern tibetan plateau, from 1980 to 2000 using remote-sensing and gis technologies. J. Glaciol. 2007, 53, 673–676. [Google Scholar] [CrossRef]
  30. Huang, L.; Liu, J.; Shao, Q.; Liu, R. Changing inland lakes responding to climate warming in northeastern tibetan plateau. Clim. Chang. 2011, 109, 479–502. [Google Scholar] [CrossRef]
  31. Lei, Y.; Yao, T.; Bird, B.W.; Yang, K.; Zhai, J.; Sheng, Y. Coherent lake growth on the central tibetan plateau since the 1970s: Characterization and attribution. J. Hydrol. 2013, 483, 61–67. [Google Scholar] [CrossRef]
  32. Liao, J.; Shen, G.; Li, Y. Lake variations in response to climate change in the tibetan plateau in the past 40 years. Int. J. Digit. Earth 2013, 6, 534–549. [Google Scholar] [CrossRef]
  33. Wu, Y.; Zheng, H.; Zhang, B.; Lei, L. Long-term changes of lake level and water budget in the nam co lake basin, central tibetan plateau. J. Hydrometeorol. 2014, 15, 1312–1322. [Google Scholar] [CrossRef]
  34. Ke, L.; Ding, X.; Song, C. Estimation of mass balance of dongkemadi glaciers with multiple methods based on multi-mission satellite data. Quat. Int. 2015, 371, 58–66. [Google Scholar] [CrossRef]
  35. Phan, V.H.; Lindenbergh, R.; Menenti, M. Geometric dependency of tibetan lakes on glacial runoff. HESSD 2013, 10, 729–768. [Google Scholar]
  36. Wan, W.; Xiao, P.; Feng, X.; Li, H.; Ma, R.; Duan, H.; Zhao, L. Monitoring lake changes of qinghai-tibetan plateau over the past 30 years using satellite remote sensing data. Chin. Sci. Bull. 2014, 59, 1021–1035. [Google Scholar] [CrossRef]
  37. Li, J.; Sheng, Y.; Luo, J.; Shen, Z. Remotely sensed mapping of inland lake area changes in the tibetan plateau. J. Lake Sci. 2011, 23, 311–320. [Google Scholar]
  38. Song, C.; Ye, Q.; Cheng, X. Shifts in water-level variation of Namco in the central Tibetan Plateau from ICESat and CryoSat-2 altimetry and station observations. Sci. Bull. 2015, 60, 1287–1297. [Google Scholar] [CrossRef]
  39. Ke, L.; Ding, X.; Song, C. Heterogeneous changes of glaciers over the western Kunlun Mountains based on ICESat and Landsat-8 derived glacier inventory. Remote Sens Environ. 2015, 168, 13–23. [Google Scholar] [CrossRef]

