Article

Impacts of Land Use on Surface Water Quality in a Subtropical River Basin: A Case Study of the Dongjiang River Basin, Southeastern China

1
State Key Laboratory of Earth Surface Processes and Resource Ecology, Beijing Normal University, No.19 Xinjiekouwai Street, Haidian District, Beijing 100875, China
2
College of Resources Science and Technology, Beijing Normal University, No.19 Xinjiekouwai Street, Haidian District, Beijing 100875, China
3
Shenzhen Academy of Environmental Sciences, No.50, 1st Honggui Street, Honggui Road, Shenzhen 518001, China
4
Faculty of Land Resource Engineering, Kunming University of Science and Technology, No. 68 Wenchang Road, Kunming 650093, China
*
Author to whom correspondence should be addressed.
Water 2015, 7(8), 4427-4445; https://doi.org/10.3390/w7084427
Submission received: 10 June 2015 / Revised: 1 August 2015 / Accepted: 4 August 2015 / Published: 12 August 2015

Abstract

:
Understanding the relationship between land use and surface water quality is necessary for effective water management. We estimated the impacts of catchment-wide land use on water quality during the dry and rainy seasons in the Dongjiang River basin, using remote sensing, geographic information systems and multivariate statistical techniques. The results showed that the 83 sites can be divided into three groups representing different land use types: forest, agriculture and urban. Water quality parameters exhibited significant variations between the urban-dominated and forest-dominated sites. The proportion of forested land was positively associated with dissolved oxygen concentration but negatively associated with water temperature, electrical conductivity, permanganate index, total phosphorus, total nitrogen, ammonia nitrogen, nitrate nitrogen and chlorophyll-a. The proportion of urban land was strongly positively associated with total nitrogen and ammonia nitrogen concentrations. Forested and urban land use had stronger impacts on water quality in the dry season than in the rainy season. However, agricultural land use did not have a significant impact on water quality. Our study indicates that urban land use was the key factor affecting water quality change, and limiting point-source waste discharge in urban areas during the dry season would be critical for improving water quality in the study area.

1. Introduction

Rivers are particularly vulnerable to land use change and ubiquitous exploitation [1,2]. The deterioration of river water quality due to unsustainable human activities has become a key environmental concern [3]. Anthropogenic activities are directly reflected in land use characteristics [4]. Understanding the relationship between land use and water quality is helpful for identifying primary threats to water quality, and the relationships are meaningful for effective water quality management because they can be used to target critical land use areas and to institute relevant measures to minimize pollutant loadings [5].
Comparative studies have found that land use has significant impacts on river water quality and that the mechanisms are complex [6,7]. Deforestation, agricultural activities and urbanization generally modify land surface characteristics [8], alter runoff volume [9], change water temperature [10], generate pollution [11], increase algal production [12] and decrease concentrations of dissolved oxygen in water bodies [13]. Despite the many studies that have described the general relationships between land use and water quality, those relationships are not fully understood [14]. For example, there are still uncertainties regarding whether urban or agricultural land use is more important in influencing water quality on the scale of catchments. Donohue et al. [15] identified that urban, arable and pasture lands were the principal factors affecting water quality in Irish rivers. Lee et al. [11] found urbanization, rather than agricultural land use, was a major factor in water quality degradation in South Korea. Fisher et al. [16] found agricultural impacts should be given priorities in natural resource management to reduce agricultural non-point source pollution in the Upper Oconee watershed of Georgia, USA. Sliva and Williams [17] found that the influence of agriculture was variable, and agriculture was negatively associated with nutrients in spring and fall in Ontario watersheds, Canada. These mixed results are partly due to the distinctive characteristics of each watershed. The highly dynamic aquatic ecosystems also result in greater complexity in research and management.
Meanwhile, tropical and subtropical Asian watersheds have been less well documented than other regions of the world, such as North American and Europe (e.g., [8,10,18,19]). Baker [20] observed that rapidly changing land use that occurs in tropical and subtropical watersheds creates greater uncertainties. Dudgeon [21] mentioned that further complexity is introduced by seasonal flows, which alter the magnitude of land-water interactions in tropical and subtropical Asian watersheds. Previous studies have suggested that alterations in water quality by land use would have greater impacts on tropical and subtropical Asian watersheds than those already observed in North American and Europe watersheds [22,23,24]. Thus, there is an urgent need to conduct more case studies on estimating the relationship between land use and water quality in tropical and subtropical Asian systems.
The Dongjiang River basin, which is a subtropical river basin in a rapidly growing region of China, has been experiencing rapid urbanization for the past 20 years [25]. Over 28 million people lived in the basin in 2010 [26]. Meanwhile, the Dongjiang River basin plays a key role in supplying drinking water that sustains the rapid socio-economic development of the Pearl River Delta region and Hong Kong. In recent years, concerns have grown regarding the deterioration in water quality in the basin [27]. Several studies have explored the relationship between land use and water quality in a few streams or in single season in Dongjiang River [28,29]. However, knowledge in such relationships at a basin-wide scale across seasons is still lacking due to the large area and monitoring difficulties. Identifying the spatial and seasonal variability of land use impacts on water quality represents a significant challenge for understanding the land use impacts on water quality. Addressing this issue is critical for assessing the potential risks of development and the cost-effectiveness of water management at the watershed scale.
In this study, we investigated the spatial and seasonal variability of land use impacts on water quality to address the following questions: (1) What are the impacts of land use on water quality in the Dongjiang River basin? What is the key land use that impacts water quality? (2) Are there seasonal differences in the impacts of land use on water quality? (3) What are the implications of our findings for managing and mitigating pollutant loadings?

2. Materials and Methods
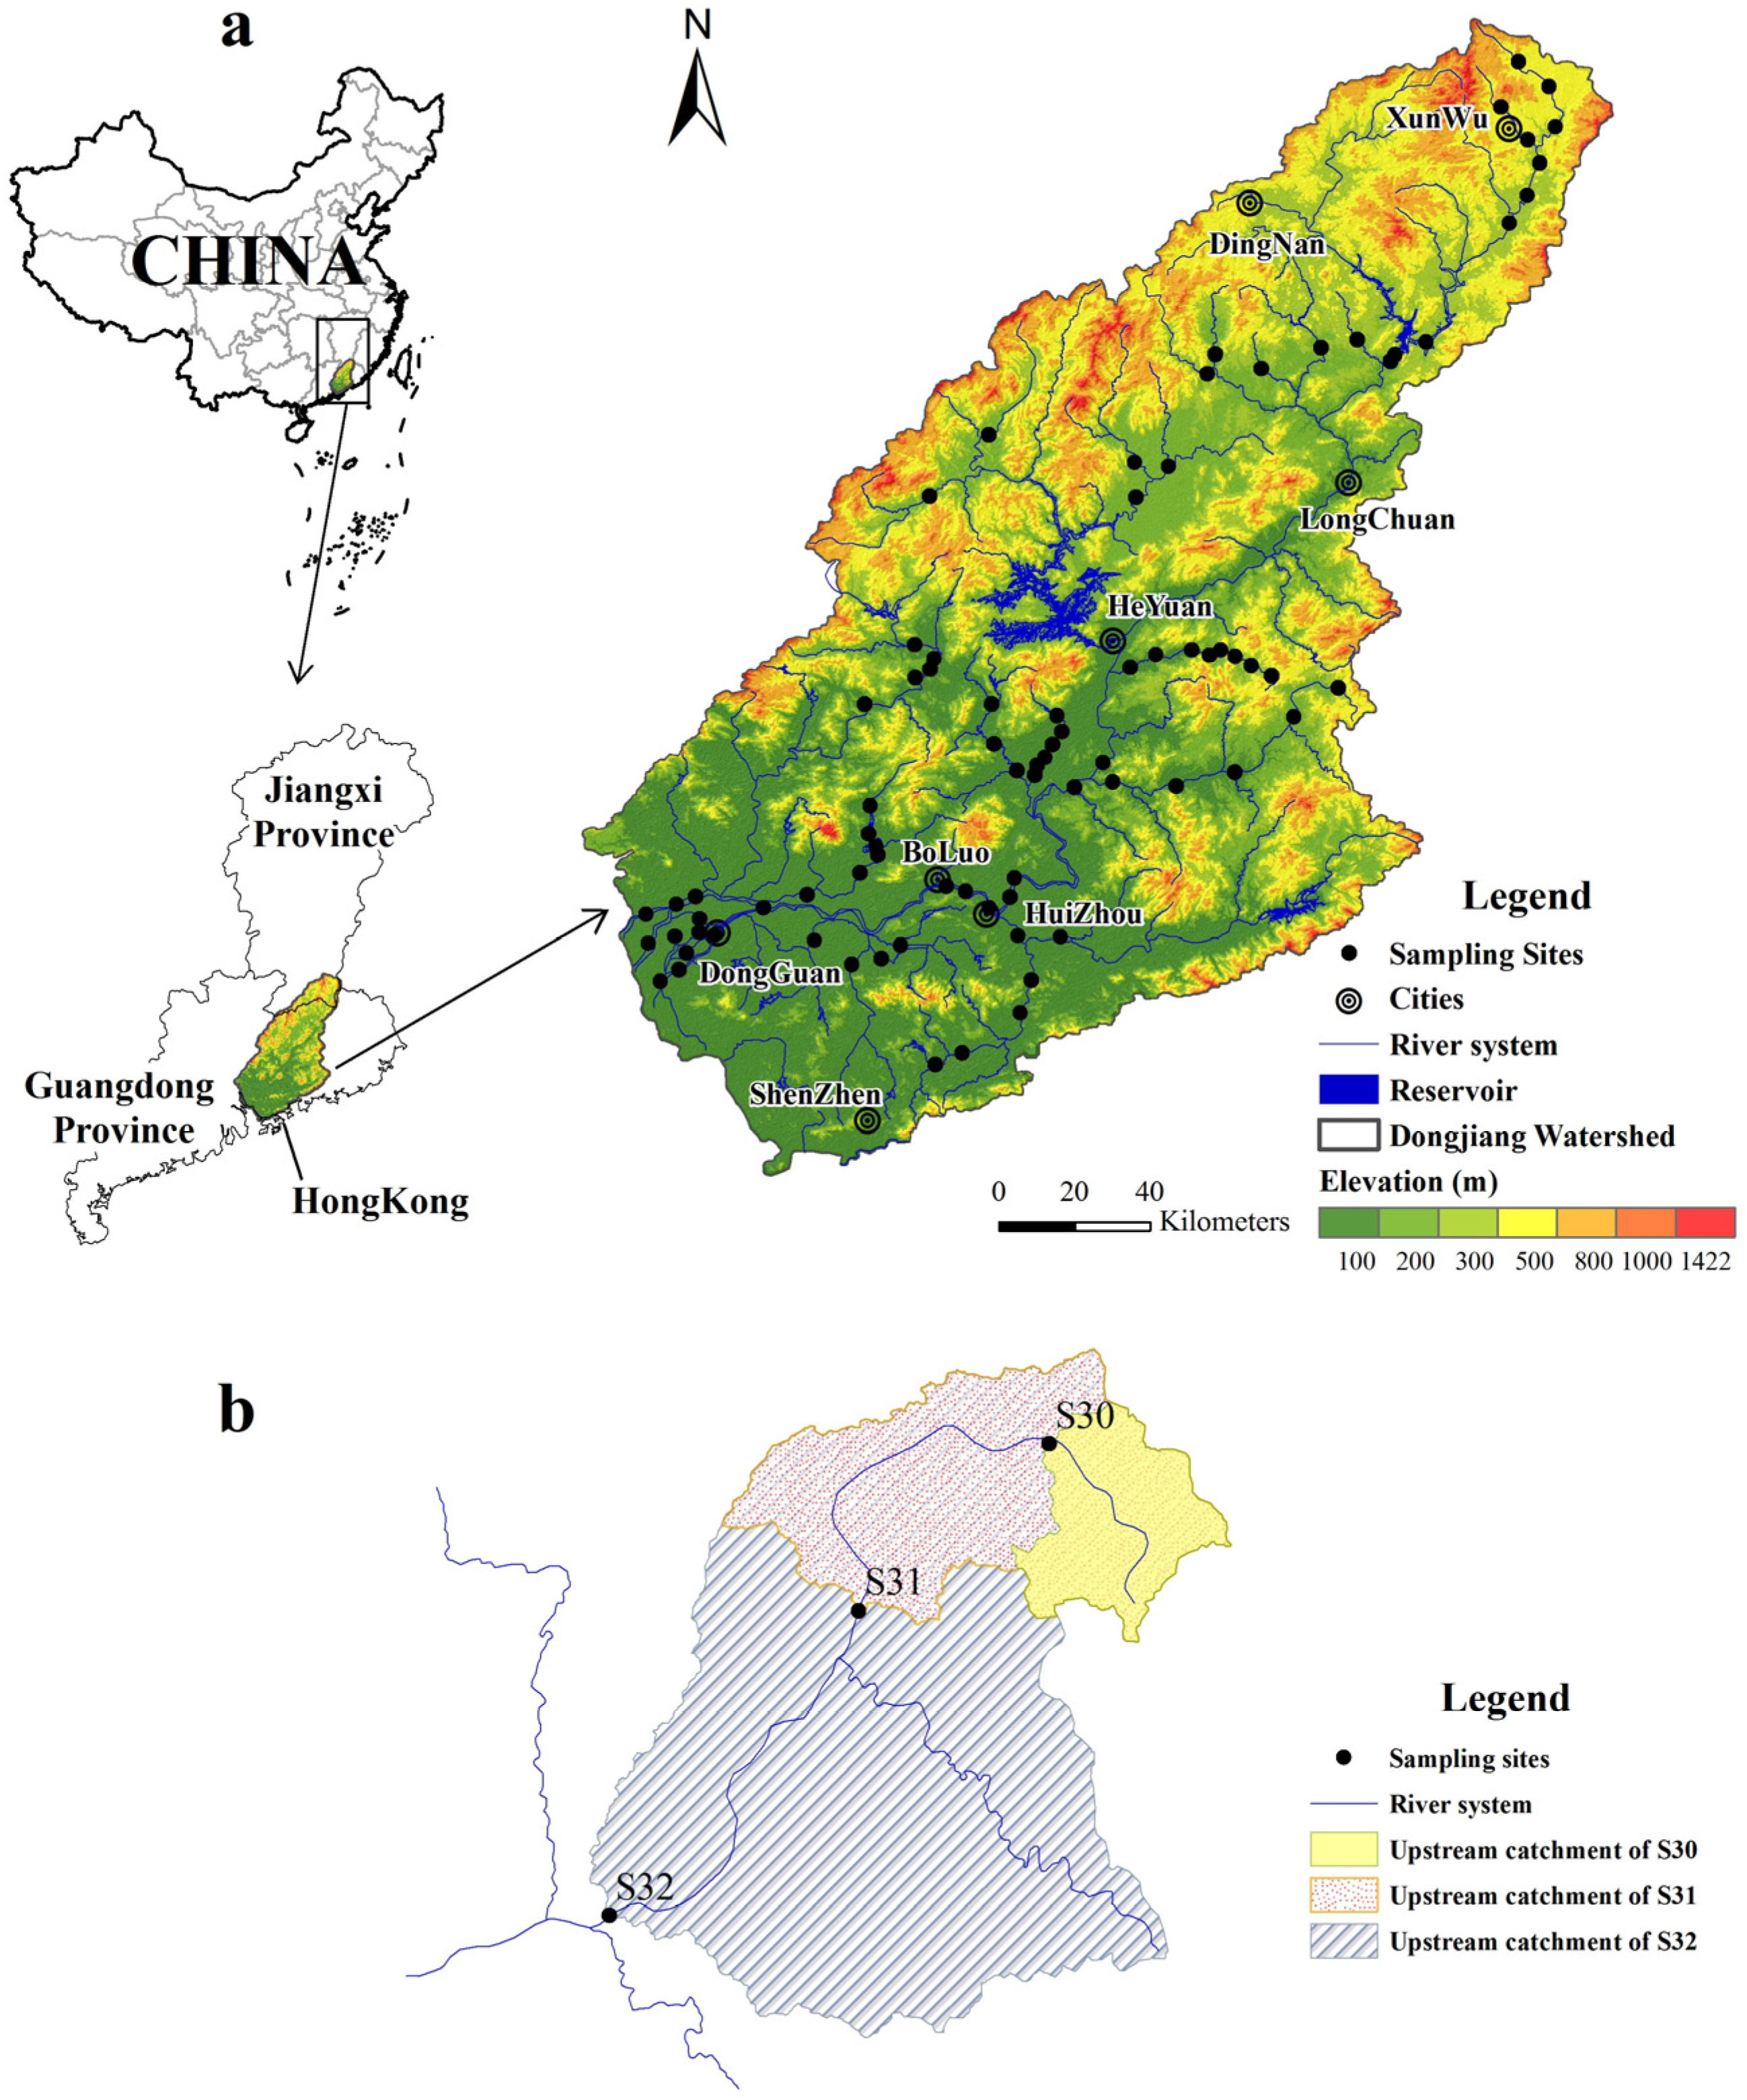
2.1. Study Area

The Dongjiang River (22°21′–25°12′ N, 113°04′–115°50′ E) is one of the three main tributaries of the Pearl River in southern China. It originates from the Xunwu country in Jiangxi province and flows into the Pearl River estuary from northeast to southwest (Figure 1a). The drainage area of the Dongjiang River is approximately 35,340 km2, and the main river channel is 562 km long with an average gradient of about 0.039% [30,31]. The Dongjiang River basin has a subtropical monsoon climate, with an annual average temperature of 21 °C and mean annual precipitation of approximately 1800 mm. The mean annual runoff of the basin is approximately 296 × 108 m3 [32]. Under the influence of monsoon climate, each year 70%–80% of the annual precipitation and runoff occur during the rainy season from April to September [33,34]. Although water resources in the basin are harnessed by reservoirs, the hydrology and water availability of the basin still demonstrate strong seasonal variations [34]. The major land use types of this area are forested (262.17 × 10⁴ ha), agricultural (55.16 × 10⁴ ha) and urban lands (33.47 × 10⁴ ha). The landscape is characterized by plains and hills, accounting for 87.27% of the river basin. The mountains with an elevation of >500 m account for about 12.73% of the river basin. Urban and agricultural land uses dominate plains and low hills, and forest land use covers upper elevations. The humid climate favors intensive agriculture, especially the production of rice grains, fruits and vegetables. The N budget for the basin indicates that municipal input contributes 68% to the total N input, while the contribution from fertilizer and animal feedstuff is 17% [35]. Total sewage discharge in the Dongjiang River basin increased from 8.7 × 10⁸ t in 2003 to 17.9 × 10⁸ t in 2012 [36].
Figure 1. (a) The topography and the locations of the Dongjiang River basin and sampling sites; (b) Schematic of upstream catchment delineation on the basis of the positions of the sampling sites.
Water 07 04427 g001

2.2. Sample Collection and Parameter Measurement

A total of 83 sites were sampled along the main stem and major tributaries of the Dongjiang River (Figure 1a). Sites were selected to encompass a variety of land uses based on near-stream land use activities. These sites were chosen across the entire basin, so that results would not be as tied to local characteristics. Fieldwork was carried out once during the middle of dry season (January) and once during the middle of rainy season (July) in 2012 under stable flow conditions. Climatic conditions for the sampling year (1750 mm in annual precipitation and 270.5 × 10⁸ m3 in annual runoff) were generally consistent with long-term averages for the region. Precipitation during the study period was typical for the dry season (54 mm in January) and rainy season (200 mm in July). Stable flow conditions were assumed if there had been at least five days of no significant rain (<10 mm over 48 h), which was recorded at nearby rainfall stations (see also [37]). A combination of spatial and temporal analyses was applied to provide more robust results for the relationship between land use and water quality.
Water samples were collected 0.5 m below the water surface and at least 5 m from the riverbank using a 1000 mL organic glass hydrophore. Duplicate samples were taken out at each sampling site. The first duplicate was filtered immediately through Whatman GF/C glass fibre filters (Whatman Ltd., Kent, UK). The second duplicate was kept unfiltered. The samples were acidified with sulfuric acid to adjust their pH < 2 to preserve them in pre-cleaned bottles. The bottles were stored in iceboxes until the analyses were conducted. During and after sampling, nine water parameters were chosen to be measured, which are important indicators of water pollution influenced by anthropogenic activities. Water temperature (TEM, °C) and electrical conductivity (EC, μs·cm−1) were measured in situ using portable conductivity meter (METTLER-SG3, Mettler Toledo, Columbus, OH, USA). Dissolved oxygen (DO, mg·L−1) was measured in situ using a portable oxygen meter (YSI DO200, YSI Incorporated Company, Yellow Springs, OH, USA). Other water quality parameters were analyzed in the laboratory. Permanganate index (CODMn, mg·L−1) was determined by the potassium permanganate method. Total phosphorus (TP, mg·L−1), ammonia nitrogen (NH3-N, mg·L−1) and chlorophyll-a (Chl-a, μg·L−1) were measured using a spectrophotometer (UNICO2100, UNICO Company, South Brunswick, NJ, USA). Total nitrogen (TN, mg·L−1) and nitrate nitrogen (NO3-N, mg·L−1) were detected using the digestion-UV spectrophotometric method (UV2800, UNICO Company, South Brunswick, NJ, USA). CODMn, TP and TN were measured by unfiltered samples, while NH3-N and NO3-N were measured by the filtered samples. The values of the nine parameters that are presented in this paper are the means of triplicate analyses. The pretreatment and the determination of the parameters in the laboratory followed national standard methods of examining water and wastewater, which were provided by the Ministry of Environment Protection, China [38].

2.3. Spatial Analyses

Landsat Thematic Mapper (TM) satellite imagery with 30 m resolution for 2009 was obtained from The Institute of Remote Sensing and Digital Earth (RADI), Chinese Academy of Sciences (CAS). The annual change rates in land use for the entire watershed were small from 2009 to 2012 [25]. Moreover, there may be time lags in the impacts of land use on stream water quality [12,39]. Thus, the data of land use and water quality used in our analyses were not collected contemporaneously (see also [40,41]). The land use classes were generated using a supervised classification technique with a maximum likelihood algorithm in the Erdas Imagine 9.2 (ERDAS Corporation, Norcross, GA, USA). The Landsat images were also rectified using aerial photographs and field survey data. A confusion matrix was generated for accuracy assessment by the use of a reference data set. The overall accuracy for the classification was 88% and the kappa coefficient was 0.85 (i.e., 85% more accurate than a random classification) [42]. Upon considering the possible influences of land use on water quality [14,17,40], the land use classes were categorized into five groups: (1) forested land use, including wooded areas and mixed vegetated areas; (2) agricultural land use, including row and non-row crop agriculture; (3) urban land use, including residential, commercial and industrial lands; (4) other land use, including barren land and other unused lands; and (5) water bodies, including rivers and reservoirs.
A 30 m Digital Elevation Model (DEM) was taken to determine flow-path directions using the hydrology tool in ArcGIS version 9.3 (ESRI Company, Redlands, CA, USA). Using the sampling site as the outlet point, the flow-path-direction grid cells were used to produce upstream catchment for each site. It should be noted that a catchment delineated for a lower stream site encompasses the catchment corresponding to any upper stream site (as shown in Figure 1b). As such, the impacts of catchment characteristics (e.g., land use composition) on water quality at the outlet point of the catchment can be evaluated independently of the observations of adjacent sampling sites [4]. The catchment area of each site was calculated as the sum of the areas of the land use groups except water bodies [43]. The area proportions of forested (Pforest, %), agricultural (Pagriculture, %), urban (Purban, %) and other (Pother, %) land uses within each catchment area were then calculated in the analysis.

2.4. Statistical Analysis

To identify the spatial similarity of the sampling sites, hierarchical cluster analysis was performed on catchment-wide land use data by means of Ward’s method, using Euclidean distances as a measure of similarity [44,45,46]. This method uses an analysis of the variance to evaluate the distances between clusters in an attempt to minimize the sum of squares of any two possible clusters that can be formed at each step. The resulting dendrogram provided a visual summary of the clustering processes and was calculated using PC-ORD 5.0 (MjM Software Design Company, Gleneden Beach, OR, USA). We evaluated the data normality by means of the Kolmogorov-Smirnov test and the homogeneity of variance by means of Levene’s test [47]. Because not all of the water quality parameter data met the parametric assumptions, the Kruskal-Wallis test (a nonparametric analysis of variance by rank that does not assume a Gaussian distribution) was used to determine whether the values of the water quality parameters differed significantly between the dry and the rainy seasons [41,48]. In order to determine if significant variations in water quality existed among site groups, multiple comparisons were performed using the Kruskal-Wallis test followed by Dunn’s post hoc test at a significance level of p < 0.05.
The relationships between the land use variables and water quality parameters were examined using both redundancy analysis (RDA) and nonparametric Spearman rank correlation. RDA allowed us to simultaneously examine the influences of multiple land use variables on all water quality parameters. Two important outputs obtained with RDA were: (1) the correlations of land use variables with canonical axes, which indicate what land use variables have the largest influence on the ordination; (2) the variance proportions (%) of the water quality parameters that are explained by canonical axes and individual land use variables [17]. A Monte Carlo permutation test (499 permutations) was used to determine the statistical validity of the RDA, and, for more details for the test, see Braak and Smilauer [49]. The Spearman correlation test was used to determine if any of the water quality parameters were correlated with land use variables [50]. The multivariate statistical techniques were run on SPSS 21.0 (IBM Company, Armonk, NY, USA). The RDAs were performed using the CANOCO 5.0 program (Microcomputer Power Company, Ithaca, NY, USA).

3. Results

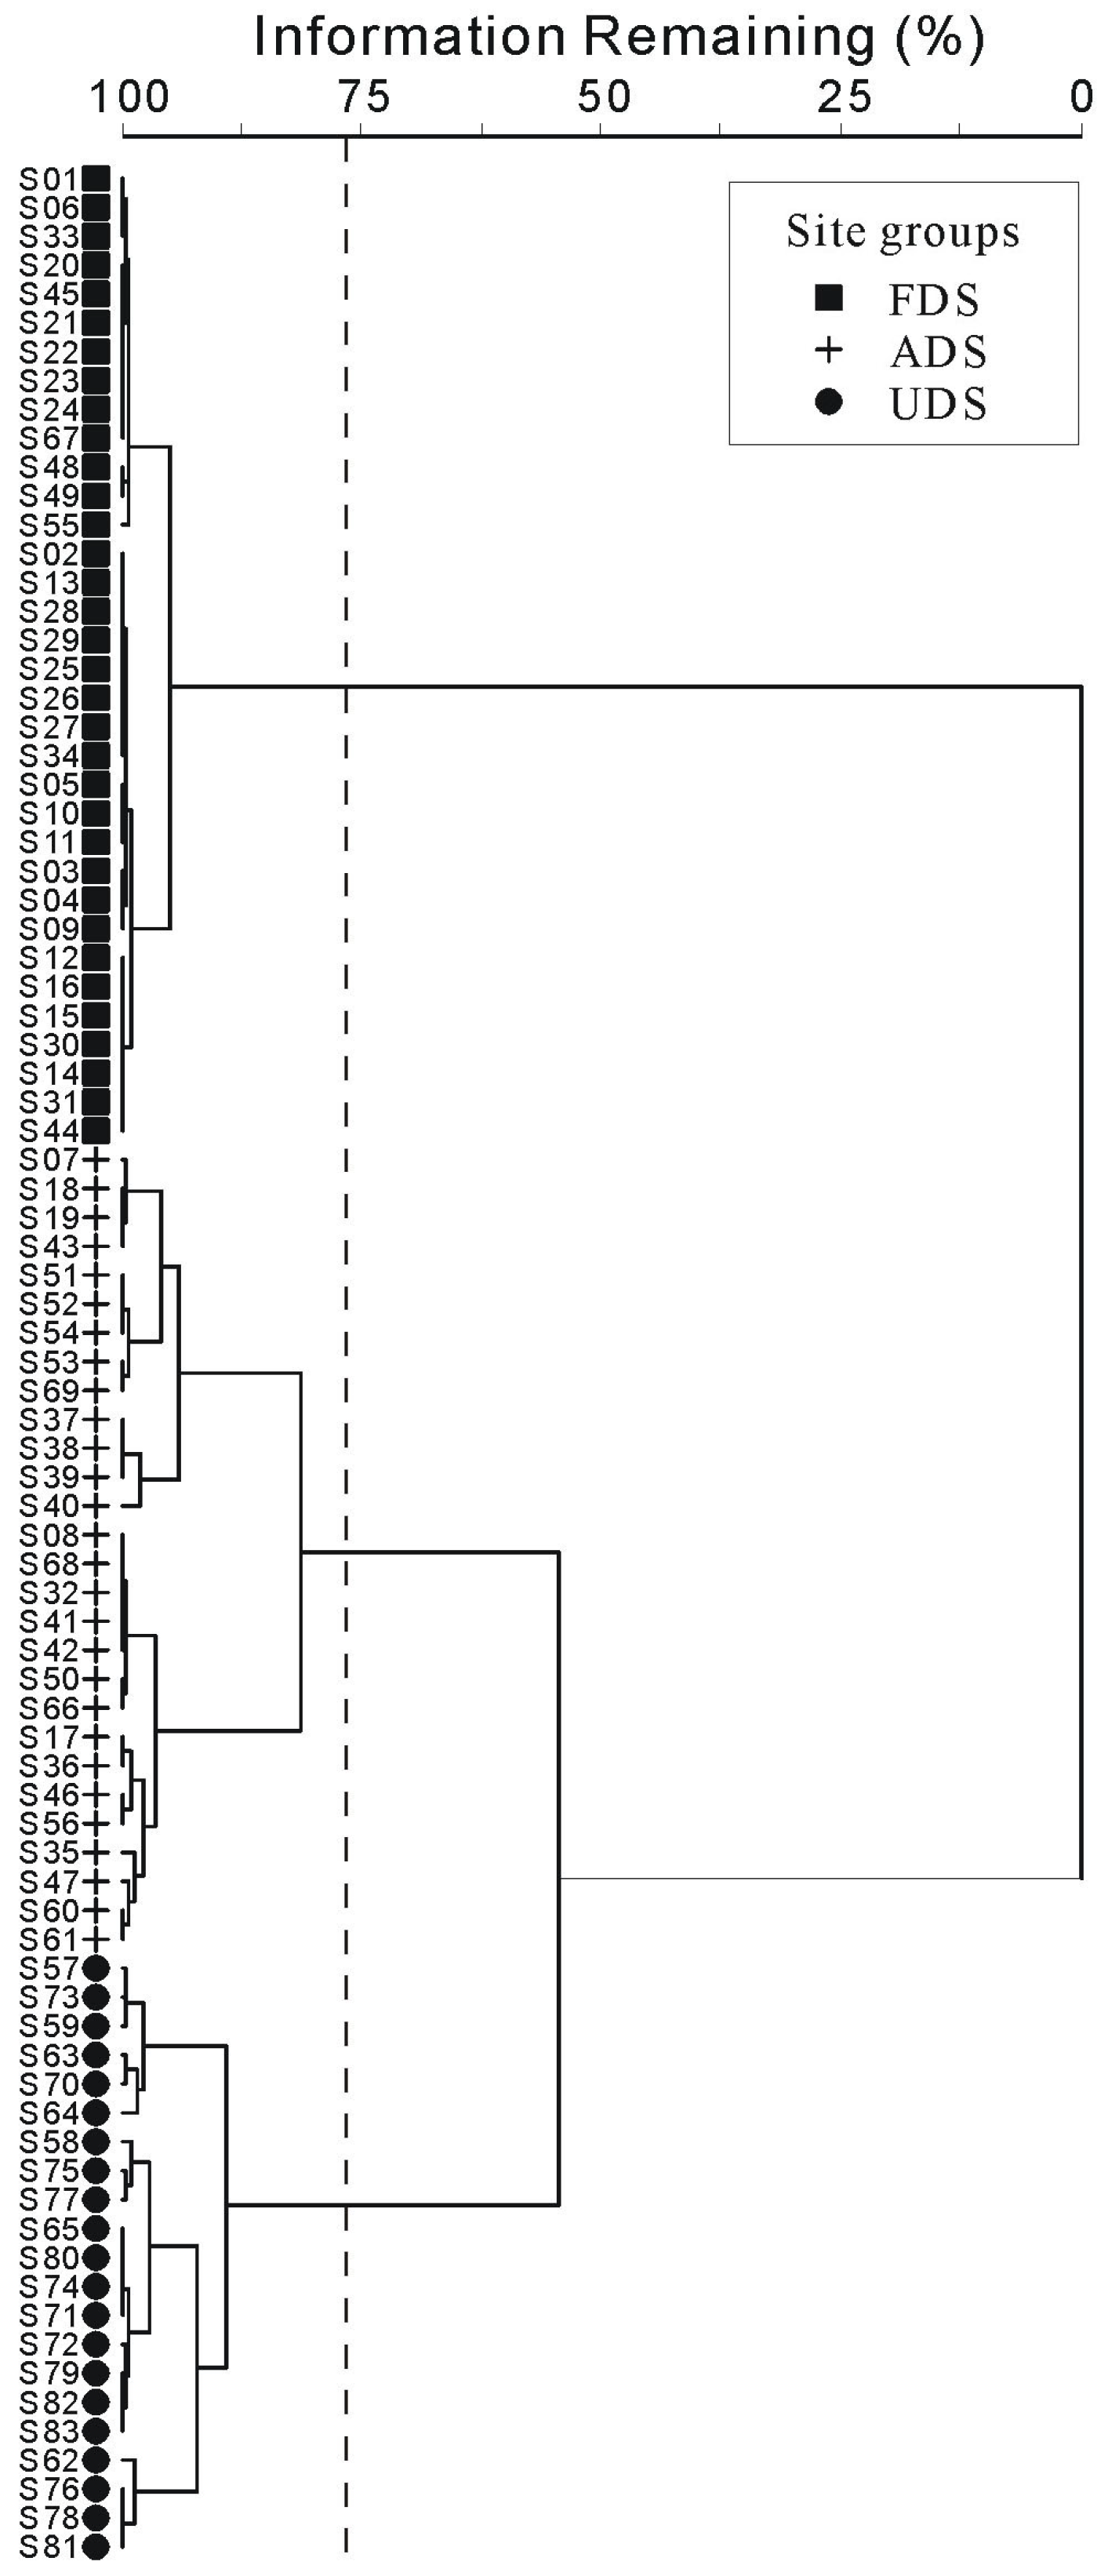
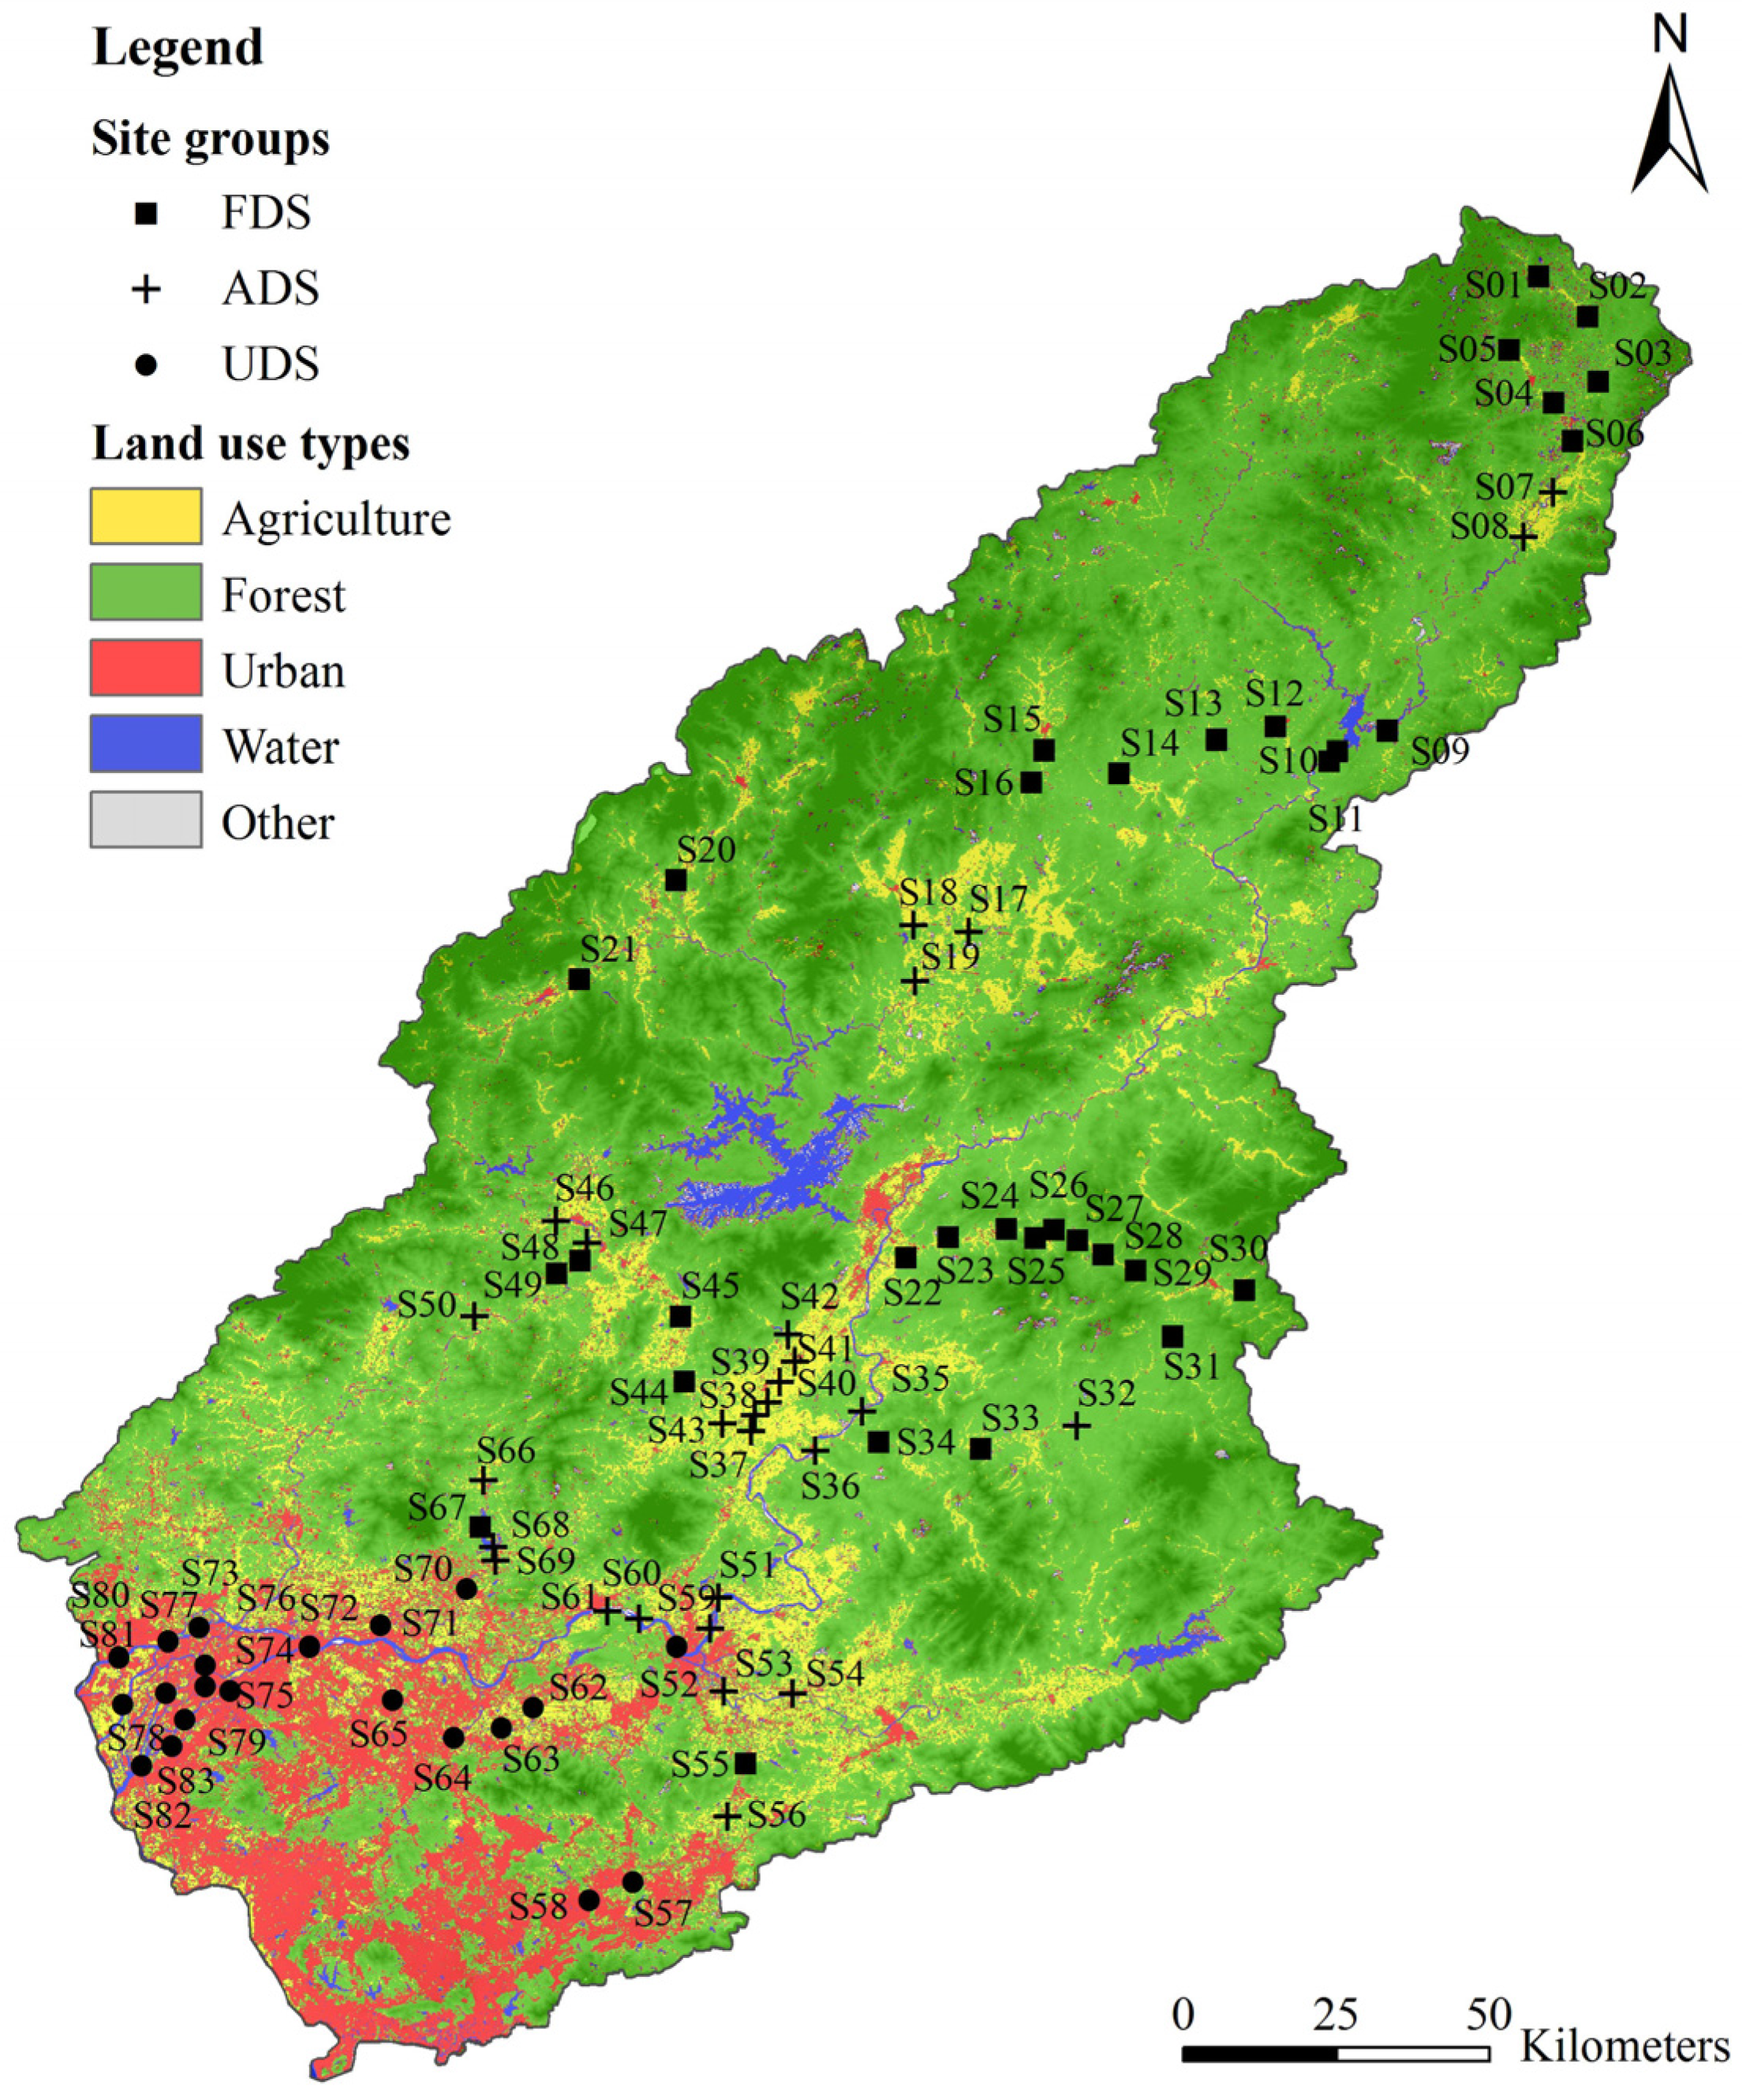
3.1. Land Use Site Grouping and Their Distribution

In the whole watershed, forested (74.19% of the total area), agricultural (15.61%) and urban (9.47%) land made up the vast majority of the total area (Table 1). Among the upstream catchments of the 83 sampling sites, the percentage of forested (ranging from 1.62% to 94.93%), agricultural (3.40% to 79.49%) and urban (0.00% to 86.62%) land use varied greatly.
Table 1. Descriptive statistics for the land use characteristics in the Dongjiang River basin.
Spatial scaleForest (%)Agriculture (%)Urban (%)Other (%)
Total watershed74.1915.619.470.74
Catchments of 83 sites
Min1.623.400.000.00
Max94.9379.4986.6216.25
Mean52.5927.4818.921.01
Median56.1524.523.210.14
S.D.33.2819.7426.462.16
Note: S.D. represents Standard deviation.
The cluster analysis showed that the 83 sampling sites can be divided into three groups of relatively similar sites at the level that involves more than 75% of the information (Figure 2). Considering their dominant land use types, the three site groups were designated as forest-dominated sites (FDS), agriculture-dominated sites (ADS) and urban-dominated sites (UDS), which were characterized by predominately forested land (with an average percentage of 86.34%), agricultural land (average of 47.76%) and urban land (average of 61.01%), respectively (Table 2). The FDS group included 34 sample sites, which were mainly located in the northern and eastern parts of the study area and were characterized by hilly mountain topography with an average elevation of 362 m (Figure 3). The ADS group included 28 sample sites, which were located in the central river basin and were characterized by a low hill topography with an average elevation of 266 m. The UDS group included 21 sample sites, which were located in the southern part of the study area and were characterized by an alluvial plain topography with an average elevation of 108 m.

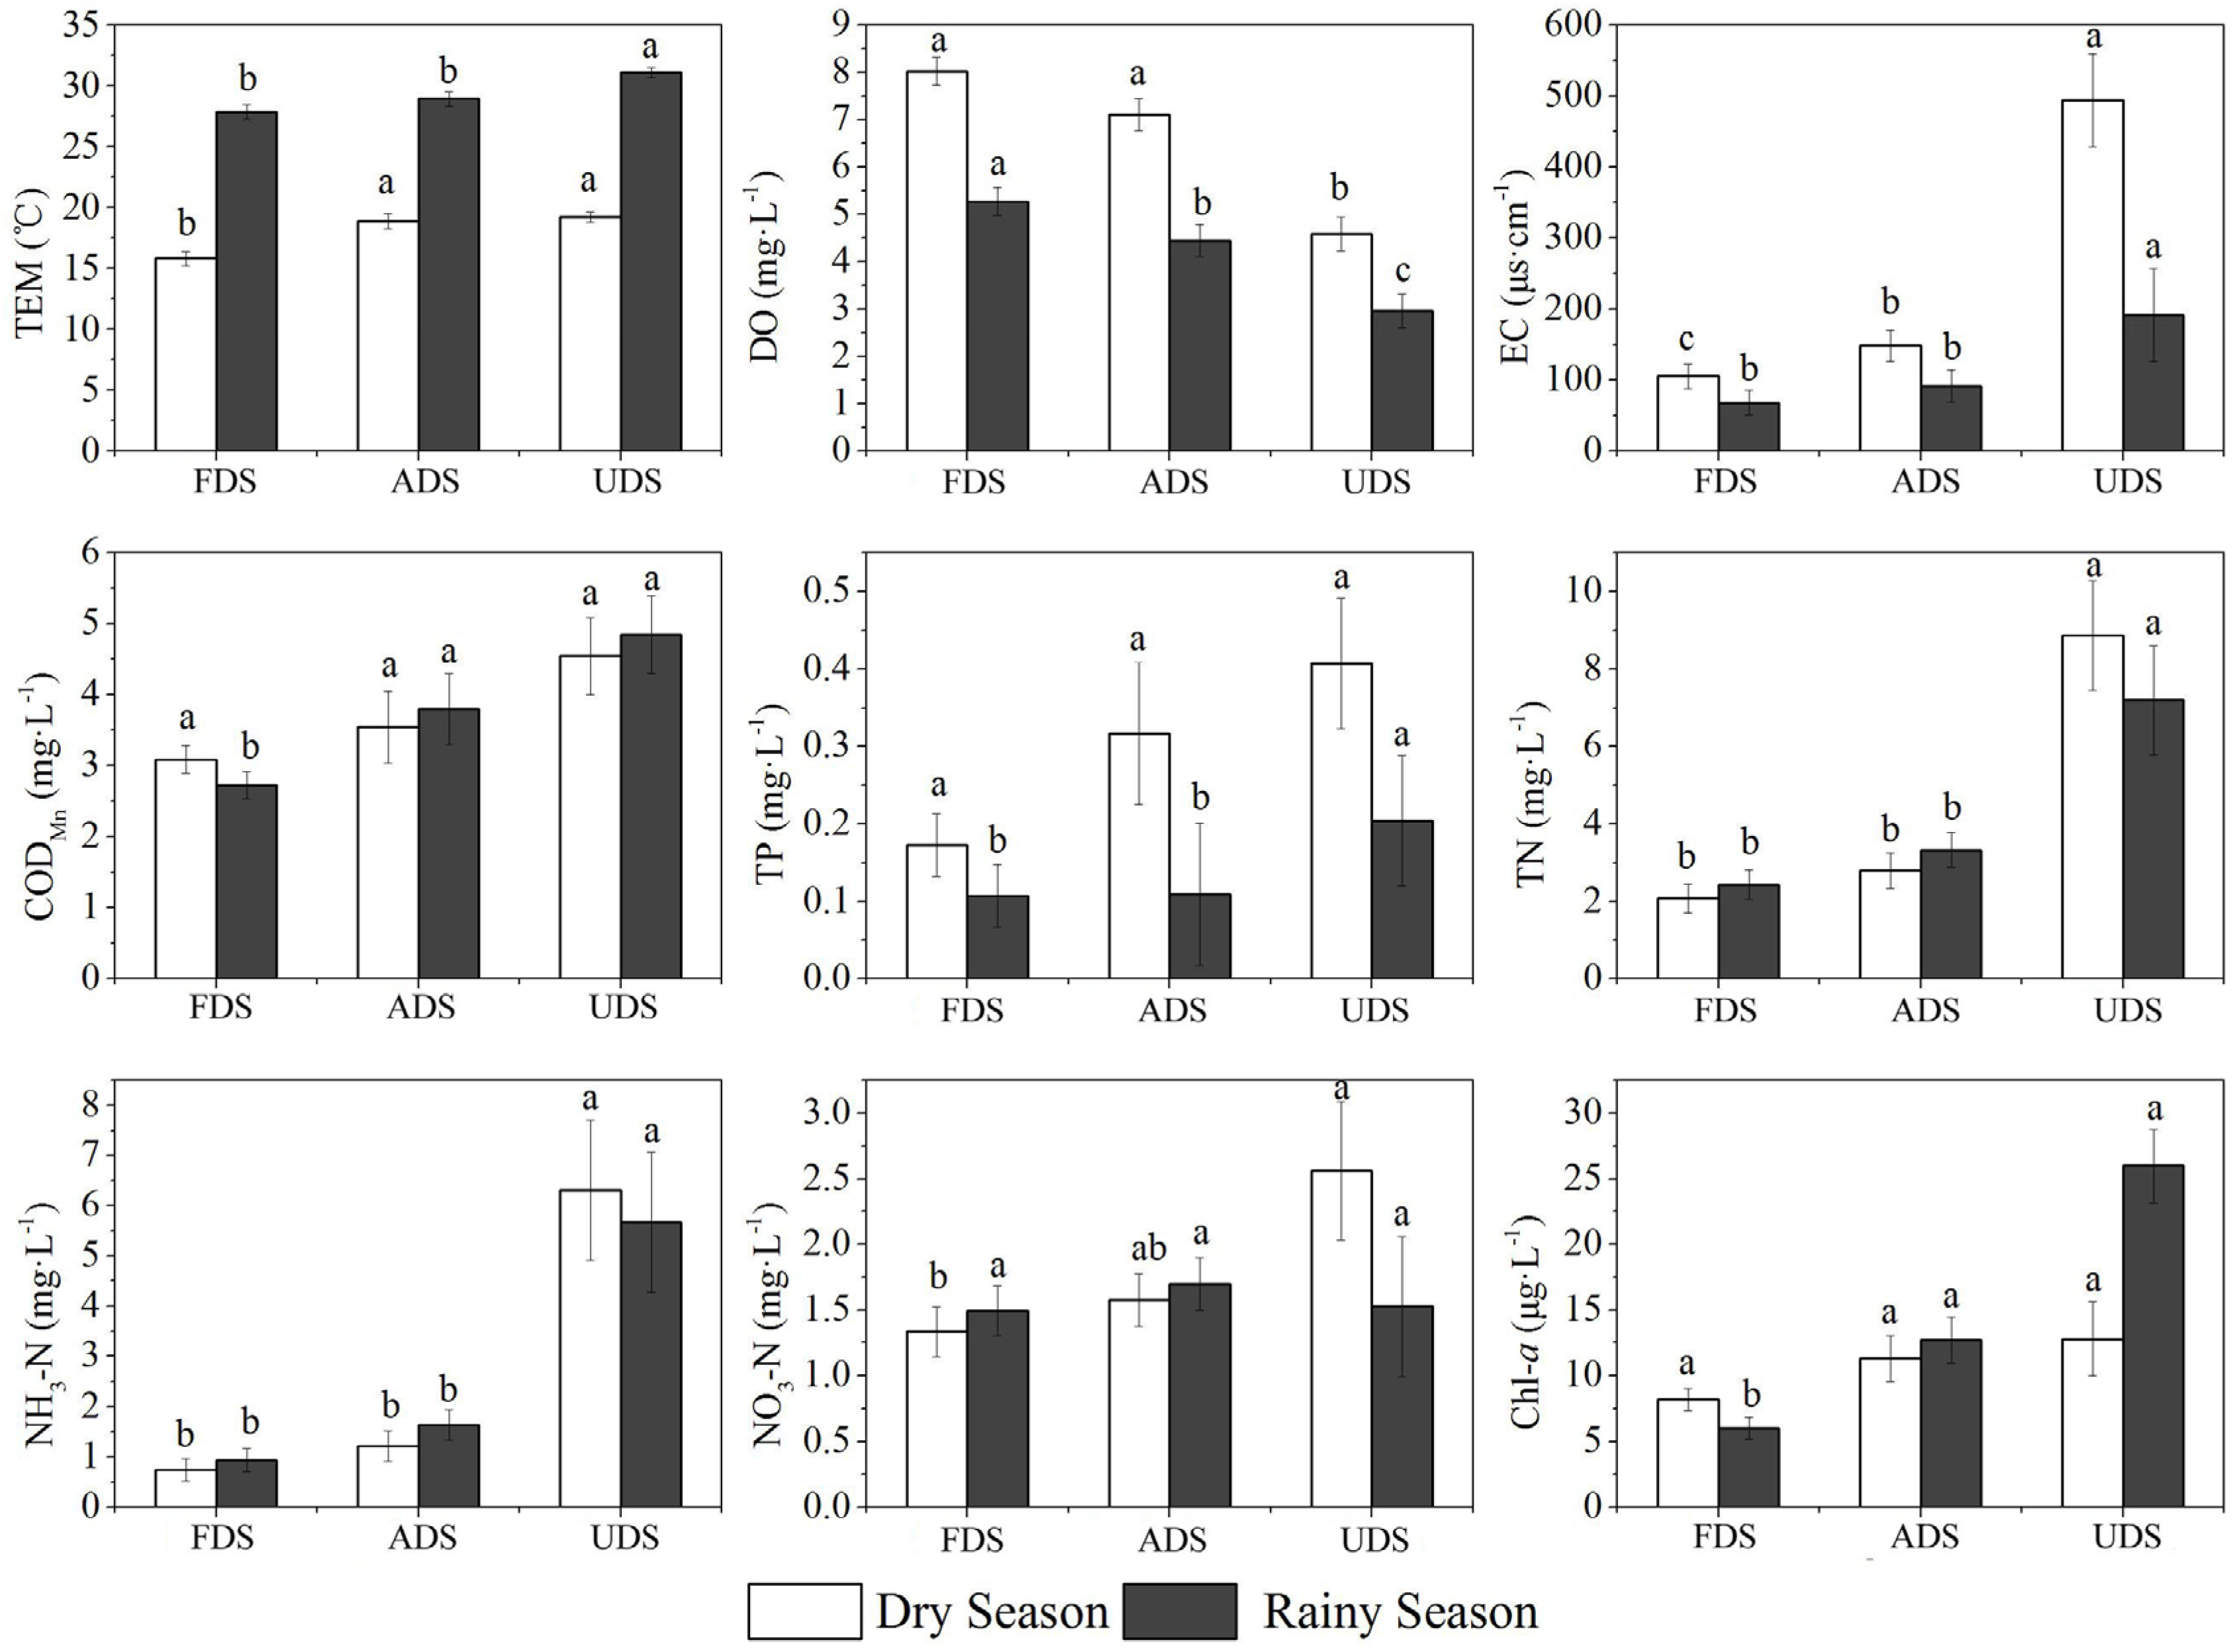
3.2. Temporal and Spatial Variations of Water Quality among the Site Groups

The concentrations of water quality parameters during dry and rainy seasons in sampling sites were shown in Figure S1. The Kruskal-Wallis test showed that the values of the parameters, including DO (H = 50.07, p < 0.01), EC (H = 16.51, p < 0.01) and TP (H = 6.54, p < 0.05), were significantly higher in the dry season than in the rainy season (Table 3). TEM (H = 123.77, p < 0.01) was significantly lower in the dry season than in the rainy season. The concentrations of organic and nutrient parameters (including CODMn, TN, NH3-N, NO3-N and Chl-a) showed no significant seasonal differences. To help interpret the data, the drinking water quality standards (surface water quality standard of Grade III) were presented in Table 3. The analysis results showed that the water quality in study area generally met the requirements set by Grade III. However, there were wide concentration variations in most of parameters. The mean concentration of CODMn was far below the value of Grade III, the percent of samples exceeding standard value of which was 14.46%–16.87%. The mean concentrations of DO and TP were close to the standard values, the exceeding rate of which was 20.48%–55.42% and 21.69%–36.14% respectively, while the mean concentration of NH3-N was far above the standard value, the exceeding rate of which was more than 40%. This indicated that there was potential risk of nitrogen pollutions in the study area.
Figure 2. Dendrogram based on the hierarchical clustering analysis according to the Ward linkage method using Euclidean distance, showing the different clusters from the 83 sampling sites (S01–S83).
Water 07 04427 g002
Table 2. General characteristics for the site groups (mean value ± standard deviation).
Landscape FactorsFDS (n = 34)ADS (n = 28)UDS (n = 21)
Percentage of Land Use (%)--
Pforest86.34 ± 5.8641.87 ± 19.1312.25 ± 13.62
Pagriculture11.37 ± 5.1047.76 ± 17.3626.51 ± 11.37
Purban1.42 ± 2.158.60 ± 7.9061.01 ± 15.79
Pother0.88 ± 1.441.77 ± 3.210.22 ± 0.64
Mainly Land useforested landagricultural landurban land
Catchment Elevation (m)362 ± 125266 ± 104108 ± 108
Main Topographyhilly mountainslow hillsalluvial plains
Notes: FDS, ADS and UDS represent forest-dominated sites, agriculture-dominated sites and urban-dominated sites, respectively; n represents the number of sampling sites per group; Catchment elevations were derived from the mean elevations of upstream catchments of sites.
Figure 3. Spatial distribution of sampling site groups and land use types in the Dongjiang River basin. The sites were divided into three groups corresponding to forest-dominated sites (FDS), agriculture-dominated sites (ADS) and urban-dominated sites (UDS).
Water 07 04427 g003
Table 3. Summary of surface water quality between the dry and the rainy seasons in the Dongjiang River basin.
Water Quality Parameters (Units)NDry SeasonRainy SeasonKruskal-WallisStandard for Grade III aExceeding Rate (%) b
Mean ± S.D.Mean ± S.D.Hp-valueDryRainy
TEM (°C)8317.73 ± 3.4129.07 ± 2.11123.770.000 **---
DO (mg·L−1)836.85 ± 2.194.41 ± 1.4750.070.000 **≥5.020.4855.42
EC (μs·cm−1)83218.47 ± 239.04107.59 ± 76.3216.510.000 **---
CODMn (mg·L−1)833.61 ± 2.173.63 ± 1.700.380.538≤6.016.8714.46
TP (mg·L−1)830.28 ± 0.380.13 ± 0.136.540.011 *≤0.236.1421.69
TN (mg·L−1)834.07 ± 4.703.95 ± 4.400.050.83
NH3-N (mg·L−1)832.31 ± 4.132.37 ± 4.130.030.868≤1.043.3743.37
NO3-N (mg·L−1)831.73 ± 1.601.57 ± 1.310.290.593---
Chl-a (μg·L−1)8310.42 ± 9.0113.31 ± 15.590.90.343---
Notes: water temperature (TEM), dissolved oxygen (DO), electrical conductivity (EC), permanganate index (CODMn), total phosphorus (TP), total nitrogen (TN), ammonia nitrogen (NH3-N), nitrate nitrogen (NO3-N) and chlorophyll-a (Chl-a); N represents the number of sampling sites; S.D. represents Standard deviation; * p < 0.05, ** p < 0.01; a: the environmental quality standards for surface water of China (GB3838-2002) [51]. Detailed information was provided in the supplementary material (Table S1); b: the exceeding rate is the ratio of the number of sites which overweighs the III standard value and the total number of sites [52].
The results of multiple comparisons indicated that there were variations in all of the water quality parameters between the UDS and FDS groups (Figure 4). The average concentration of DO in the UDS was significantly lower than that in the FDS in the dry and rainy seasons (p < 0.05). In contrast, the average values of TEM, EC, TN and NH3-N in the UDS were significantly higher than in the FDS (p < 0.05). The average concentrations of CODMn, TP and Chl-a in the UDS were significantly higher than in the FDS only in the rainy season (p < 0.05), as was the case with NO3-N, but only in the dry season (p < 0.05). Although most of the water quality parameters that were collected in the ADS had higher concentrations than those in the FDS, no significant variations were detected. The mean concentration of NH3-N in the UDS reached 6.31 mg·L−1 in the dry season and 5.67 mg·L−1 in the rainy season, which signaled a serious pollution level as compared with values of Grade III.
Figure 4. Mean ± standard error values for the water quality parameters among forest-dominated sites (FDS), agriculture-dominated sites (ADS) and urban-dominated sites (UDS) in the dry and rainy seasons. The variance results of the post hoc tests among the three groups are indicated by the letters, and significant differences (p < 0.05) are indicated by different letters (a–c).
Water 07 04427 g004

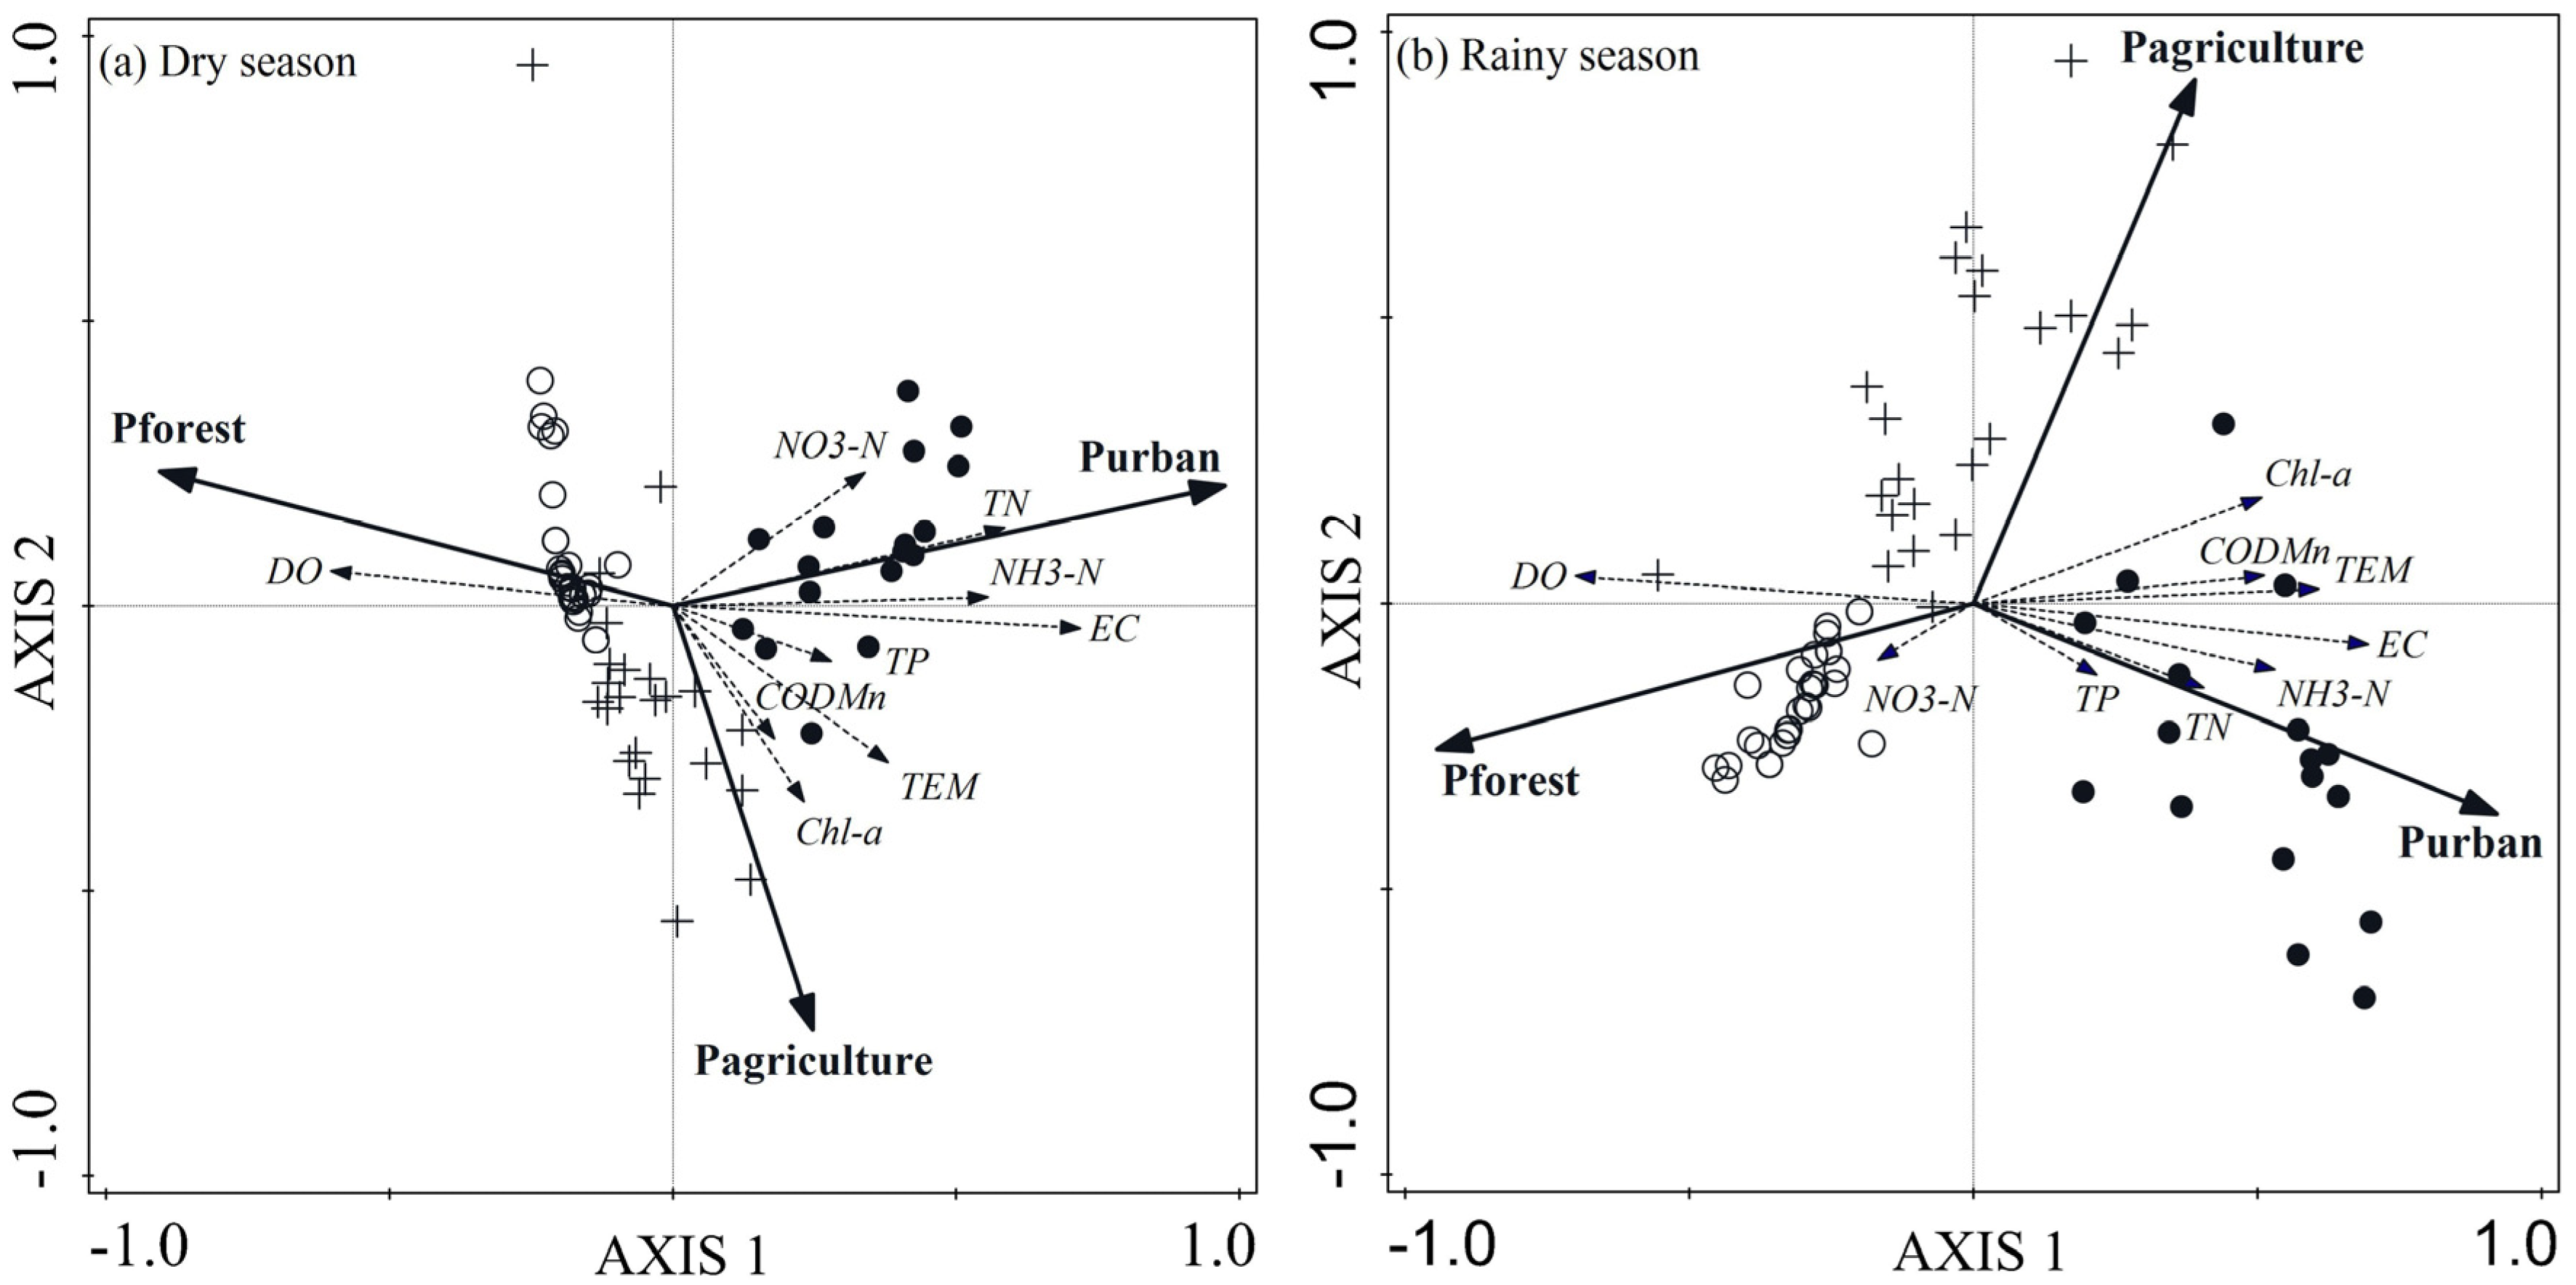
3.3. The Relationship between Land Use and Water Quality

The RDA results showed that all of the canonical axes significantly accounted for 33.2% (pseudo-F = 13.1, p < 0.01) of the water quality variations in the dry season and 29.5% (pseudo-F = 11.0, p < 0.01) in the rainy season (Table 4). The first axis significantly explained 30.3% (pseudo-F = 34.4, p < 0.01) of the variations in the dry season and 27.5% in the rainy season (pseudo-F = 29.9, p < 0.01), which was negatively correlated with the proportion of forested land use (Pforest) and positively correlated with the proportion of urban land use (Purban). The forest-dominated sites, agriculture-dominated sites and urban-dominated sites could be clearly distinguished from each other along the first axis in the RDA tri-plot, which indicated that the first axis consistently displayed a gradient of pollution (Figure 5). The second axis accounted for less than 3% of the variations (non-significant) and was mainly determined by agricultural land use (Pagriculture).
Table 4. Redundancy analysis (RDA) results showing the variance (%) of the water quality parameters explained by canonical axes and explanatory variables.
Axes and VariablesDry SeasonRainy Season
Explained Variation (%)pseudo-Fp valueExplained Variation (%)pseudo-Fp value
Canonical axes
First axis30.334.40.002 **27.529.90.002**
Second axis2.52.90.1261.92.10.29
all axes33.213.10.002 **29.511.00.002**
Explanatory variables
Pforest25.027.00.002 **24.626.40.002**
Purban28.932.90.002 **23.524.90.002**
Pagriculture3.42.80.0785.85.00.01*
Notes: The pseudo-F and p values were derived from Monte Carlo permutation tests. Pforest, Pagriculture and Purban indicate the percentage of forest, agriculture and urban land, respectively. * p < 0.05; ** p < 0.01.
Figure 5. Tri-plot results of redundancy analysis: water quality parameters and land use variables in the dry season (a) and in the rainy season (b). Different symbol represent different site groups (forest-dominated sites: ○; agriculture-dominated sites: +; urban-dominated sites: ●).
Water 07 04427 g005
Purban (28.9%, pseudo-F = 32.9, p < 0.01) and Pforest (25.0%, pseudo-F = 27.0, p < 0.01) had greater explanatory ability for the overall water quality variations in the dry season than in the rainy season (Table 4). The correlation analysis showed that EC, TN, NH3-N, NO3-N and TP were more negatively correlated with Pforest (r < −0.3, p < 0.01; r refers to the correlation coefficient) and positively correlated with Purban (r > 0.3, p < 0.01) in the dry season than in the rainy season (Table 5). However, TEM, CODMn and Chl-a were more negatively correlated with Pforest (r < −0.3, p < 0.01) and positively correlated with Purban (r > 0.3, p < 0.01) in the rainy season than in the dry season. The DO showed a positive correlation with Pforest (r > 0.57, p < 0.01) and a negative correlation with Purban (r < −0.61, p < 0.01) in both seasons. In contrast, Pagriculture (5.8%, p < 0.05) had a slightly better explanatory ability for the overall water quality variations in the rainy season than in the dry season, which was positively correlated with TEM, EC and Chl-a (r < 0.37, p < 0.05) and negatively correlated with DO (r = −0.28, p < 0.01) in the rainy season.
Table 5. Spearman correlation coefficients between water quality parameters and land use variables in the dry and rainy seasons.
Water QualityPforestPagriculturePurban
Dry SeasonRainy SeasonDry SeasonRainy SeasonDry SeasonRainy Season
DO0.57 **0.62 **−0.26 *−0.28 **−0.65 **−0.61 **
TEM−0.40 **−0.54 **0.42 **0.25 *0.43 **0.59 **
EC−0.71 **−0.65 **0.36 **0.28 *0.77 **0.66 **
CODMn−0.16−0.48 **0.060.220.110.53 **
TP−0.32 **−0.200.180.000.33 **0.27 *
TN−0.53 **−0.35 **0.170.120.58 **0.40 **
NH3-N−0.56 **−0.48 **0.26 *0.160.56 **0.53 **
NO3-N−0.30 **0.23 *0.06−0.100.37 **−0.17
Chl- a−0.29 **−0.50 **0.25 *0.37 **0.31 **0.46 **
Note: Bold numbers indicate correlation coefficient |r| > 0.3; * p < 0.05; ** p < 0.01.

4. Discussion

4.1. Impacts of Different Land Uses on Water Quality

Our results suggested that forested and urban land use had significant impacts on water quality in the study area. The variance analysis showed that catchments with more forests and less urbanization have better water quality. RDA and Spearman analyses corroborated that nutrient parameters (e.g., TP, TN, NH3-N) were strongly negatively correlated with the Pforest and positively correlated with Purban in both seasons. The opposite effects might be the result of low anthropogenic inputs and a high retention of nutrients in forest, which is in contrast to the high loadings and low retention of nutrients in urban lands [41,53,54]. Forested land use generally acts as a nutrient detention zone as nutrients move down stream, which suggests strong biological nutrient retention (e.g., microbial and plant assimilation and microbial denitrification) [23].
In contrast, urban land use was identified as the strongest contributor of nitrogen and phosphorus in the Dongjiang River basin. This may have been highly influenced by point source as well as non-point source pollution. This is further supported by high concentrations of NH3-N (6.31 mg·L−1) during the dry season in urban-dominated rivers, which suggests chronic sewer leakage or illicit discharges [55]. The large amounts of sewage (e.g., municipal wastewater and industrial effluent) are discharged into rivers with incomplete treatment, which is a particular problem in tropical Asian watersheds with dense populations and industries [56]. This also accords with the findings from previous study in the region that changes in water quality have been influenced mainly by untreated sewage of major cities (e.g., Dongguan and Huizhou) [27,31]. In addition, urbanization has expanded impervious areas, which has led to faster storm flows and greater runoff volumes [57]. Impervious storm runoff washes all types of pollutants (e.g., non-point source and point source pollutants) into rivers, which increases concentrations of nutrients and other pollutants in surface waters [8]. Besides, a shortage of wastewater treatment infrastructure in suburban areas also contributes to increased nitrogen levels [58].
However, our results showed agricultural land use only explained 3.4%–5.8% of the spatial variations in water quality in the Dongjiang River basin. Additionally, there was a weak relationship between Pagriculture and water quality parameters, particularly for nutrients such as TN and TP. The results were contrary to general observations in many parts of the world [8,10,19]. Our hypothesis is that the impact of agriculture on water quality was masked by the impact of urban land use due to rapid urbanization and serious point-source pollution in the study area. Moreover, the influence of agricultural land use on water quality depends on farming management practices. Paddy field is the primary agricultural land use in the study area. In agreement with Lee et al. [11], farmers keep paddies flooded after applying fertilizers to allow nutrient uptake by the rice plants. Thus the negative impact of fertilization on water quality in adjacent streams is modest under normal conditions. Nevertheless, most of the water quality parameters in agriculture-dominated sites had higher concentrations than those in forest-dominated sites, despite the fact that no significant difference was obtained. The impacts of agricultural chemicals and agricultural runoffs should not be overlooked.

4.2. Seasonal Differences in Impacts of Land Use on Water Quality

Several studies have reported that the relationship between land use and water quality can vary seasonally [17,43,59,60]. In our study, seasonal changes of river flow caused by the subtropical monsoon climate might explain seasonal differences in the strength of impacts of land use on water quality. Spearman analyses showed that forested land use has stronger negative impacts on most of water parameters (e.g., EC, TP, TN, NH3-N, NO3-N; see Table 5) during the dry season than in the rainy season. This effect may be driven by high water discharge and low water retention time in the rainy season, which influences the retention capacity of vegetation [1,61]. At the same time, urban land use is more strongly related to these parameters in the dry season because rivers in low flow are more affected by point-source loads from urban land [62]. The discharges from point sources in urban land can be considered to be a constant source of pollution. The pollutants become diluted with the increased water discharge and high flow velocities during the rainy season [13,56]. Unlike nutrients, concentrations of CODMn are more related to urban land use during the rainy season, which suggests that runoff from urban land surfaces may be enriched with all types of organic contaminants [10]. Meanwhile, agricultural land use is more stronger positively correlated with Chl-a and negatively with DO in the rainy season than in the dry season, perhaps as a result of agricultural runoff from soil erosion which leads to slightly elevated nutrients and organic matter.
Although the relationships between land use and specific water quality parameters changed seasonally, a significant seasonality across the basin was not observed for the concentrations of most of the nutrient and organic parameters. This may have been caused by the combined effects of different land use types. The temporal variability of these parameters may have been masked by distinct spatial variability among sites. There is also inherent seasonal variability in water quality, which was not directly accounted for in our analyses. Sources of this variability include hydrochemistry characteristics of runoff components, time lags of runoff and the interactions between land use and morphological characteristics (e.g., slope or soil type). Despite this, our work has demonstrated that the multivariate statistical technique based on large-scale field data can be used to distinguish the seasonal variation in spatial relationships between land use and water quality to a reasonable degree of accuracy. Results from this study indicated the importance of investigating across seasons to elucidate the seasonal impacts of land use on water quality. Knowledge of a slightly amplified influence of urban land use on nutrients in dry season, would inform watershed managers of the critical period of nutrients enrichment and the future potential of water quality degradation with continued nutrient loadings. Meanwhile, the results corroborated that, despite the influence of seasonality on the magnitude of land use impacts, urban and forested land use still had greater impacts on water quality compared with the impacts from agricultural land use in the study area.

4.3. Management Implication for the Dongjiang River Basin

Although the level of water pollution is still acceptable to the drinking water quality standard of China, water in Dongjiang River shows signs of nitrogen contamination due to rapid development and dense population. Focusing only on specific-sites and lacking a regional watershed perspective may be the causes of invalid river management practices in the study area during the past several decades [29]. Our findings indicate that urban rather than agricultural land use primarily affects water quality in the Dongjiang River basin. Therefore, urban areas should be critical areas of river restoration or management. Several management techniques should be employed to improve water quality. Firstly, forested land areas in catchments should be preserved and the expansion of urban areas, especially impervious areas, should be restricted. Moreover, the importance of riparian vegetation in urban areas should be noted, which may have profound effects on water quality by filtering sediment and sediment-borne pollutants carried in surface runoff [63,64]. In addition, our results indicate that urban reaches of the Dongjiang River are heavily polluted by nutrients. The pollutants may derive primarily from domestic and industrial wastes [65]. Illicit discharge connections, leaking sewer systems and failing septic systems are large and persistent contributors of such pollutants to urban rivers [55]. Therefore, it is critical and effective to develop efficient water treatment plants and sewage conveyance systems in urban areas. It is also important to improve solid-waste treatment technologies and purifying water infrastructures in suburban areas. Of greater importance, it is essential to limit the discharge of nutrients downstream in the Dongjiang River through the removal and reduction of point-source waste discharges, especially during low flows in the dry season.

5. Conclusions for the Restoration of the Dongjiang River

In this study, we used the Dongjiang River basin as a subtropical case study to investigate the relationships between land use and water quality in the dry and rainy seasons based on data from 83 sites. The results show that forested land use was negatively associated with nutrients and organic parameters, especially for TN and NH3-N. The proportion of urban land use was positively linked to increasing TN and NH3-N concentrations in the receiving rivers. Moreover, forested and urban land uses had stronger impacts on water quality during the dry season than in the rainy season. Agricultural land use produced weak impacts on water quality in comparison with urban land use. Therefore, future river restoration or management should limit the discharge of nutrients through the removal of point-source waste discharges in urban areas, especially during the dry season.
Our results have demonstrated that a combination of large-scale investigations and multivariate statistical techniques could provide an overview of the relationship between land use and water quality. Although we did not reach a conclusion on a cause-effect relationship, there is sufficient evidence for effectively explaining variations in stream chemistry in relation to land use. Further research with an improved design of spatial and temporal sampling regime may better clarify the complex nature of the relationship between land use and water quality. Future work in linking the understanding of hydrological processes with various pollutant transfer processes is needed.

Supplementary Files

Supplementary File 1

Acknowledgments

This work was supported by the National Science and Technology Major Project: Water Pollution Control and Management Technology of China (No. 2012ZX07501002-04) and the National Natural Science Foundation of China (No. 41271104). We would like to thank the anonymous reviewers for their excellent suggestions.

Author Contributions

Yuan Jiang had the original idea for the study. Jiao Ding and Yuan Jiang contributed to the experiment design, manuscript preparation and editing. Lan Fu contributed to the discussion of the results; Qi Liu contributed to measurement of water quality parameters; Qiuzhi Peng supervised the interpretation of land use data; Muyi Kang contributed to manuscript review. All authors read and approved the final manuscript.

Conflicts of Interest

The authors declare no conflict of interest.

References

  1. Withers, P.J.; Jarvie, H.P. Delivery and cycling of phosphorus in rivers: A review. Sci. Total Environ. 2008, 400, 379–395. [Google Scholar] [CrossRef] [PubMed]
  2. Vörösmarty, C.J.; McIntyre, P.B.; Gessner, M.O.; Dudgeon, D.; Prusevich, A.; Green, P.; Glidden, S.; Bunn, S.E.; Sullivan, C.A.; Liermann, C.R.; et al. Global threats to human water security and river biodiversity. Nature 2010, 467, 555–561. [Google Scholar] [CrossRef] [PubMed]
  3. Chen, J.; Lu, J. Effects of Land Use, Topography and socio-economic factors on river water quality in a mountainous watershed with intensive agricultural production in east China. PLoS ONE 2014, 9. [Google Scholar] [CrossRef] [PubMed]
  4. Kang, J.; Lee, S.W.; Cho, K.H.; Ki, S.J.; Cha, S.M.; Kim, J.H. Linking land-use type and stream water quality using spatial data of fecal indicator bacteria and heavy metals in the Yeongsan river basin. Water Res. 2010, 44, 4143–4157. [Google Scholar] [CrossRef] [PubMed]
  5. Abler, D.; Shortle, J.; Carmichael, J.; Horan, R. Climate change, agriculture, and water quality in the chesapeake bay region. Clim. Chang. 2002, 55, 339–359. [Google Scholar] [CrossRef]
  6. Wear, D.N.; Turner, M.G.; Naiman, R.J. Land Cover Along an urban-rural gradient: Implications for water quality. Ecol. Appl. 1998, 8, 619–630. [Google Scholar]
  7. Amiri, B.J.; Nakane, K. Modeling the linkage between river water quality and landscape metrics in the chugoku district of Japan. Water Resour. Manag. 2009, 23, 931–956. [Google Scholar] [CrossRef]
  8. White, M.D.; Greer, K.A. The effects of watershed urbanization on the stream hydrology and riparian vegetation of Los Peñasquitos Creek, California. Landsc. Urb. Plan. 2006, 74, 125–138. [Google Scholar] [CrossRef]
  9. Strayer, D.L.; Beighley, R.E.; Thompson, L.C.; Brooks, S.; Nilsson, C.; Pinay, G.; Naiman, R.J. Effects of land cover on stream ecosystems: Roles of empirical models and scaling issues. Ecosystems 2003, 6, 407–423. [Google Scholar] [CrossRef]
  10. Tong, S.T.Y.; Chen, W. Modeling the relationship between land use and surface water quality. J. Environ. Manag. 2002, 66, 377–393. [Google Scholar] [CrossRef]
  11. Lee, S.; Hwang, S.; Lee, S.; Hwang, H.; Sung, H. Landscape ecological approach to the relationships of land use patterns in watersheds to water quality characteristics. Landsc. Urb. Plan. 2009, 92, 80–89. [Google Scholar] [CrossRef]
  12. Allan, J.D. Landscapes and riverscapes: The influence of land use on stream ecosystems. Ann. Rev. Ecol. Syst. 2004, 35, 257–284. [Google Scholar] [CrossRef]
  13. Vega, M.; Pardo, R.; Barrado, E.; Debán, L. Assessment of seasonal and polluting effects on the quality of river water by exploratory data analysis. Water Res. 1998, 32, 3581–3592. [Google Scholar] [CrossRef]
  14. Huang, J.; Li, Q.; Pontius, R.G.; Klemas, V.; Hong, H. Detecting the dynamic linkage between landscape characteristics and water quality in a subtropical coastal watershed, southeast China. Environ. Manag. 2013, 51, 32–44. [Google Scholar] [CrossRef] [PubMed]
  15. Donohue, I.; McGarrigle, M.L.; Mills, P. Linking catchment characteristics and water chemistry with the ecological status of Irish rivers. Water Res. 2006, 40, 91–98. [Google Scholar] [CrossRef] [PubMed]
  16. Fisher, D.S.; Steiner, J.L.; Endale, D.M.; Stuedemann, J.A.; Schomberg, H.H.; Franzluebbers, A.J.; Wilkinson, S.R. The relationship of land use practices to surface water quality in the Upper Oconee Watershed of Georgia. For. Ecol. Manag. 2000, 128, 39–48. [Google Scholar] [CrossRef]
  17. Sliva, L.; Williams, D.D. Buffer zone versus whole catchment approaches to studying land use impact on river water quality. Water Res. 2001, 35, 3462–3472. [Google Scholar] [CrossRef]
  18. Benes, V.; Pekny, V.; Skorepa, J.; Vrba, J. Impact of diffuse nitrate pollution sources on groundwater quality—Some examples from Czechoslovakia. Environ. Health Perspect. 1989, 83, 5–24. [Google Scholar] [PubMed]
  19. Lenat, D.R.; Crawford, J.K. Effects of land use on water quality and aquatic biota of three North Carolina Piedmont streams. Hydrobiologia 1994, 294, 185–199. [Google Scholar] [CrossRef]
  20. Baker, A. Land use and water quality. Hydrol. Process. 2003, 17, 2499–2501. [Google Scholar] [CrossRef]
  21. Dudgeon, D. Going with the flow: Global warming and the challenge of sustaining river ecosystems in monsoonal Asia. Water Sci. Technol. Water Supply 2007, 7. [Google Scholar] [CrossRef]
  22. Downing, J.A.; Mcclain, M.; Twilley, R.; Melack, J.M.; Elser, J.; Rabalais, N.N.; Lewis, W.M.; Turner, R.E.; Corredor, J.; Soto, D.; et al. The impact of accelerating land-use change on the N-Cycle of tropical aquatic ecosystems: Current conditions and projected changes. Biogeochemistry 1999, 46, 109–148. [Google Scholar] [CrossRef]
  23. Gardner, K.K.; McGlynn, B.L. Seasonality in spatial variability and influence of land use/land cover and watershed characteristics on stream water nitrate concentrations in a developing watershed in the Rocky Mountain West. Water Resour. Res. 2009, 45, 1–14. [Google Scholar] [CrossRef]
  24. Kao, S.; Shiah, F.; Owen, J.S. Export of dissolved inorganic nitrogen in a partially cultivated subtropical mountainous watershed in Taiwan. Water Air Soil Poll. 2004, 156, 211–228. [Google Scholar] [CrossRef]
  25. Ren, F.; Jiang, Y.; Xiong, X.; Dong, M.; Wang, B. Characteristics of the spatial-temporal differences of land use changes in the dongjiang river basin from 1990 to 2009. Res. Sci. 2011, 33, 143–152. [Google Scholar]
  26. He, Y.; Lin, K.; Chen, X. Effect of land use and climate change on runoff in the dongjiang basin of south China. Math. Probl. Eng. 2013, 2013, 1–14. [Google Scholar] [CrossRef]
  27. Ho, K.C.; Hui, K.C. Chemical contamination of the East River (Dongjiang) and its implication on sustainable development in the Pearl River Delta. Environ. Int. 2001, 26, 303–308. [Google Scholar] [CrossRef]
  28. Zhang, Y.; Dudgeon, D.; Cheng, D.; Thoe, W.; Fok, L.; Wang, Z.; Lee, J.H.W. Impacts of land use and water quality on macroinvertebrate communities in the Pearl River drainage basin, China. Hydrobiologia 2010, 652, 71–88. [Google Scholar] [CrossRef]
  29. Zhou, T.; Wu, J.; Peng, S. Assessing the effects of landscape pattern on river water quality at multiple scales: A case study of the Dongjiang River watershed, China. Ecol. Indic. 2012, 23, 166–175. [Google Scholar] [CrossRef]
  30. Liu, D.; Chen, X.; Lian, Y.; Lou, Z. Impacts of climate change and human activities on surface runoff in the Dongjiang River basin of China. Hydrol. Process. 2010, 24, 1487–1495. [Google Scholar] [CrossRef]
  31. Jiang, Y.; Ding, Z.; Peng, Q.; Liao, J.; Lv, L. Spatial Distribution and Corresponding Factors of Heavy Metals Concentrations in the Dongjiang River Basin, Southeast China. Res. J. Env. Earth Sci. 2012, 4, 448–459. [Google Scholar]
  32. Wang, M.; Xia, J. Influences of land use changes and climatic vibration on water circulation in the east river valley. Pearl River 2004, 25, 4–6. [Google Scholar]
  33. Lee, J.H.W.; Wang, Z.Y.; Thoe, W.; Cheng, D.S. Integrated physical and ecological management of the east river. Water Sci. Technol. Water Supply 2007, 7, 81–92. [Google Scholar] [CrossRef]
  34. Lv, L.; Peng, Q.; Liao, J.; Jiang, Y.; Kang, M. Fluctuation and trends in precipitation and runoff in the Dongjiang river basin over 50 years. Res. Sci. 2013, 35, 514–520. [Google Scholar]
  35. Fok, L.; Thoe, W.; Koenig, A.; Peart, M.R.; Lee, J.H.W. Nitrogen source apportionment of the east river (Dongjiang), China. Asian Geogr. 2009, 26, 95–110. [Google Scholar] [CrossRef]
  36. Pearl river water resources commission pearl river bulletins. Available online: http://www.pearlwater.gov.cn/ (accessed on 10 July 2015).
  37. Grayson, R.B.; Gippel, C.J.; Finlayson, B.L.; Hart, B.T. Catchment-wide impacts on water quality: The use of “snapshot” sampling during stable flow. J. Hydrol. 1997, 199, 121–134. [Google Scholar] [CrossRef]
  38. National Environmental Protection Bureau. Standard Methods for the Examination of Water and Wastewater (Version 4); China Environmental ScienceChina Environmental Science Publish Press: Beijing, China, 2002.
  39. Harding, J.S.; Benfield, E.F.; Bolstad, P.V.; Helfman, G.S.; Jones, E.R. Stream biodiversity: The ghost of land use past. Proc. Natl. Acad. Sci. USA 1998, 95, 14843–14847. [Google Scholar] [CrossRef] [PubMed]
  40. Dodds, W.K.; Oakes, R.M. Headwater Influences on Downstream Water Quality. Environ. Manag. 2008, 41, 367–377. [Google Scholar] [CrossRef] [PubMed]
  41. Bu, H.; Meng, W.; Zhang, Y.; Wan, J. Relationships between land use patterns and water quality in the Taizi River basin, China. Ecol. Indic. 2014, 41, 187–197. [Google Scholar] [CrossRef]
  42. Congalton, R.G. A review of assessing the accuracy of classifications of remotely sensed data. Remote Sens. Environ. 1991, 37, 35–46. [Google Scholar] [CrossRef]
  43. Johnson, L.; Richards, C.; Host, G.; Arthur, J. landscape influences on water chemistry in midwestern stream ecosystems. Freshwater Biol. 1997, 37, 193–208. [Google Scholar] [CrossRef]
  44. McKenna, J.E. An enhanced cluster analysis program with bootstrap significance testing for ecological community analysis. Environ. Modell. Softw. 2003, 18, 205–220. [Google Scholar] [CrossRef]
  45. Lu, P.; Mei, K.; Zhang, Y.; Liao, L.; Long, B.; Dahlgren, R.A.; Zhang, M. Spatial and temporal variations of nitrogen pollution in Wen-Rui Tang River watershed, Zhejiang, China. Environ. Monit. Assess. 2011, 180, 501–520. [Google Scholar] [CrossRef] [PubMed]
  46. Sun, R.; Wang, Z.Z.; Chen, L.; Wang, W. Assessment of surface water quality at large watershed scale: Land-use, anthropogenic, and administrative impacts. J. Am. Water Res. Assoc. 2013, 49, 741–752. [Google Scholar] [CrossRef]
  47. Pratt, B.; Chang, H. Effects of land cover, topography, and built structure on seasonal water quality at multiple spatial scales. J. Hazard. Mater. 2012, 209, 48–58. [Google Scholar] [CrossRef] [PubMed]
  48. Hively, W.D.; Hapeman, C.J.; McConnell, L.L.; Fisher, T.R.; Rice, C.P.; McCarty, G.W.; Sadeghi, A.M.; Whitall, D.R.; Downey, P.M.; Nino, D.G.G.; et al. Relating nutrient and herbicide fate with landscape features and characteristics of 15 subwatersheds in the Choptank River watershed. Sci. Total Environ. 2011, 409, 3866–3878. [Google Scholar] [CrossRef] [PubMed]
  49. Braak, T.C.J.F.; Smilauer, P. Canoco Reference Manual and User’s Guide: Software for Ordination, Version 5.0; Microcomputer Power: Ithaca, NY, USA, 2012. [Google Scholar]
  50. Shrestha, S.; Kazama, F. Assessment of surface water quality using multivariate statistical techniques: A case study of the Fuji river basin, Japan. Environ. Model. Softw. 2007, 22, 464–475. [Google Scholar] [CrossRef]
  51. State Environmental Protection Administration. The National Standards of the People’s Republic of China: Environmental Quality Standards for Surface Water (GB 3838–2002); Chinese Environmental Sciences Press: Beijing, China, 2002.
  52. Liu, Y.; Zheng, B.H.; Fu, Q.; Wang, L.J.; Wang, M. The Selection of Monitoring Indicators for River Water Quality Assessment. Proc. Environ. Sci. 2012, 13, 129–139. [Google Scholar] [CrossRef]
  53. Nakagawa, Y.; Iwatsubo, G. Water chemistry in a number of mountainous streams of East Asia. J. Hydrol. 2000, 240, 118–130. [Google Scholar] [CrossRef]
  54. Piatek, K.B.; Christopher, S.F.; Mitchell, M.J. Spatial and temporal dynamics of stream chemistry in a forested watershed. Hydrol. Earth Syst. Sci. 2009, 13, 423–439. [Google Scholar] [CrossRef]
  55. Paul, M.J.; Meyer, J.L. Streams in the urban landscape. Annu. Rev. Ecol. Syst. 2001, 32, 333–365. [Google Scholar] [CrossRef]
  56. Dudgeon, D. Endangered ecosystems: A review of the conservation status of tropical Asian rivers. Hydrobiologia 1992, 248, 167–191. [Google Scholar] [CrossRef]
  57. Waters, E.R.; Morse, J.L.; Bettez, N.D.; Groffman, P.M. Differential carbon and nitrogen controls of denitrification in riparian zones and streams along an urban to exurban gradient. J. Environ. Qual. 2014, 43, 955–963. [Google Scholar] [CrossRef] [PubMed]
  58. Sun, R.; Chen, L.; Chen, W.; Ji, Y. Effect of Land-Use Patterns on Total Nitrogen Concentration in the Upstream Regions of the Haihe River Basin, China. Environ. Manag. 2013, 51, 45–58. [Google Scholar] [CrossRef] [PubMed]
  59. Petry, J.; Soulsby, C.; Malcolm, I.A.; Youngson, A.E. Hydrological controls on nutrient concentrations and fluxes in agricultural catchments. Sci. Total Environ. 2002, 294, 95–110. [Google Scholar] [CrossRef]
  60. Yates, A.G.; Brua, R.B.; Corriveau, J.; Culp, J.M.; Chambers, P.A. seasonality driven variation in spatial relationships between agricutural land use and in-stream nutrient concentrations. River Res. Appl. 2014, 30, 476–493. [Google Scholar] [CrossRef]
  61. Mouri, G.; Takizawa, S.; Oki, T. Spatial and temporal variation in nutrient parameters in stream water in a rural-urban catchment, Shikoku, Japan: Effects of land cover and human impact. J. Environ. Manag. 2011, 92, 1837–1848. [Google Scholar] [CrossRef] [PubMed]
  62. Woli, K.P.; Nagumo, T.; Kuramochi, K.; Hatano, R. Evaluating river water quality through land use analysis and N budget approaches in livestock farming areas. Sci. Total Environ. 2004, 329, 61–74. [Google Scholar] [CrossRef] [PubMed]
  63. Buck, O.; Niyogi, D.K.; Townsend, C.R. Scale-dependence of land use effects on water quality of streams in agricultural catchments. Environ. Pollut. 2004, 130, 287–299. [Google Scholar] [CrossRef] [PubMed]
  64. Lowrance, R.; Altier, L.S.; Newbold, J.D.; Schnabel, R.R.; Groffman, P.M.; Denver, J.M.; Correll, D.L.; Gilliam, J.W.; Robinson, J.L.; Brinsfield, R.B.; et al. Water Quality Functions of Riparian Forest Buffers in Chesapeake Bay Watersheds. Environ. Manag. 1997, 21, 687–712. [Google Scholar] [CrossRef]
  65. Chen, J.; Heinke, G.W.; Zhou, M.J. The pearl river estuary pollution project. Cont. Shelf Res. 2004, 24, 1739–1744. [Google Scholar] [CrossRef]

