
Assessing the Water Parallel Pricing System against Drought in China: A Study Based on a CGE Model with Multi-Provincial Irrigation Water


Abstract
:1. Introduction
2. Background to the Drought of 2000 and the Water Parallel Pricing System
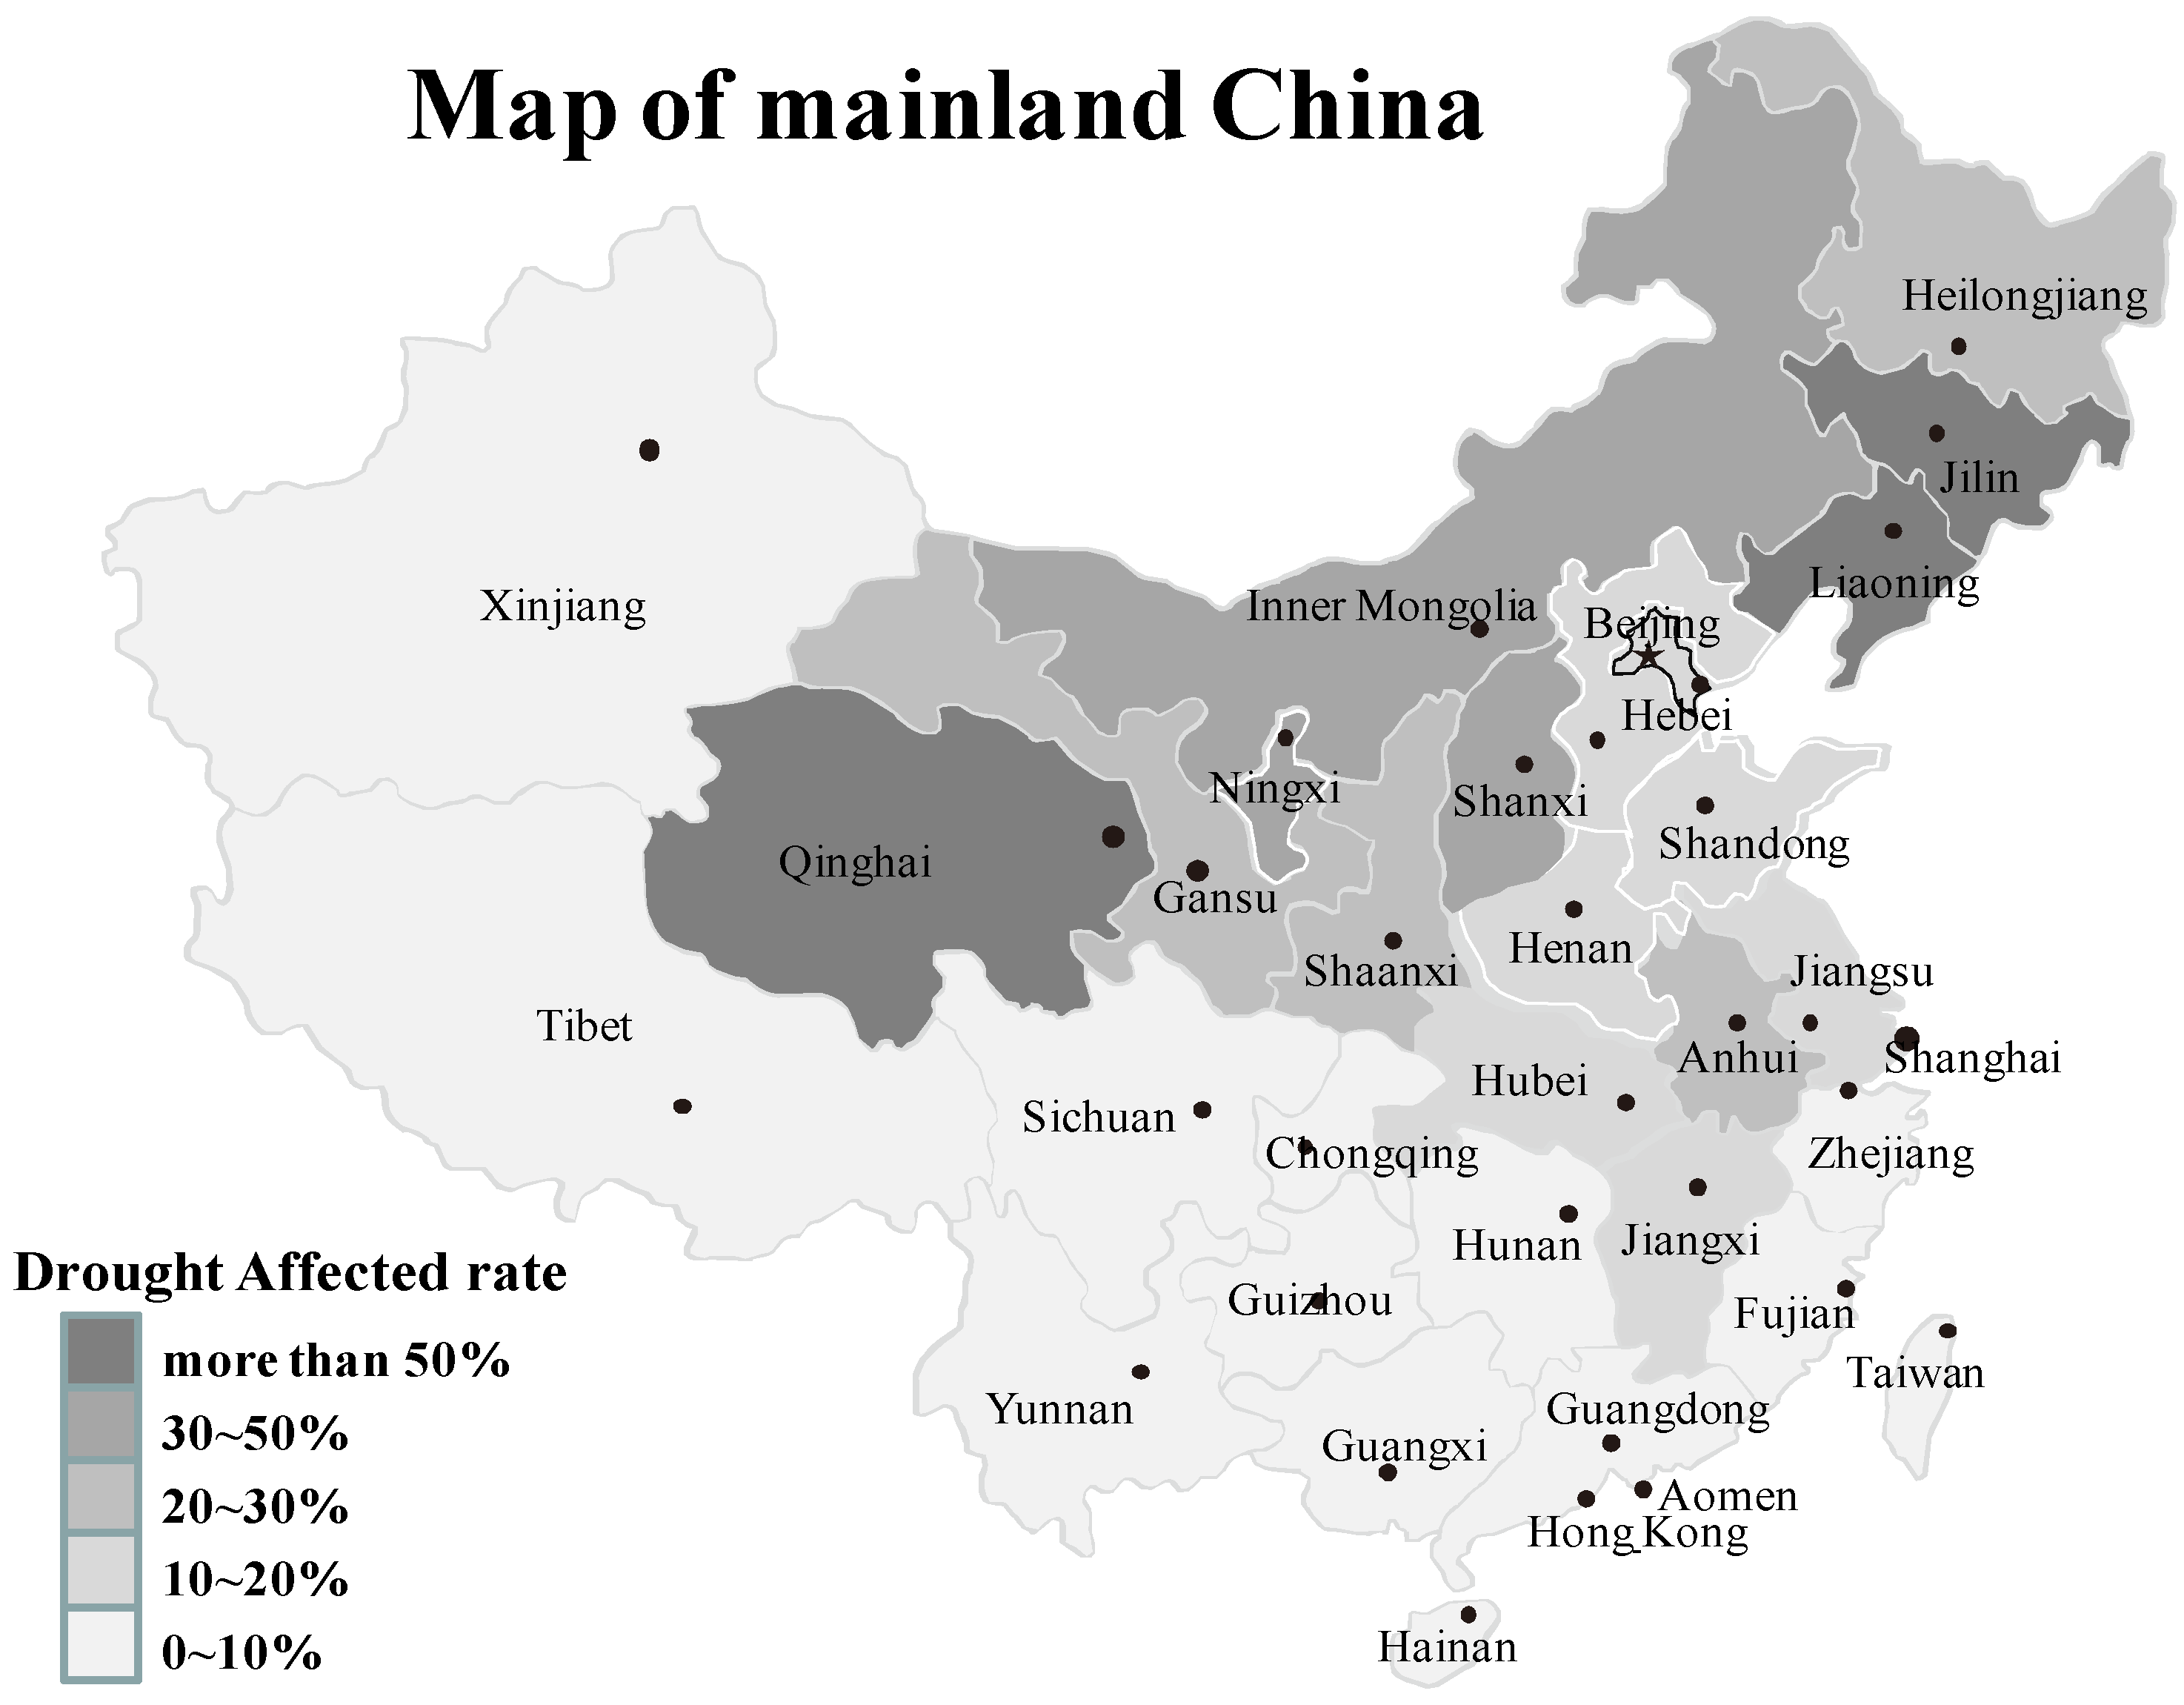
2.1. The Drought of 2000
2.2. The Water Parallel Pricing System and Water Price Distortion
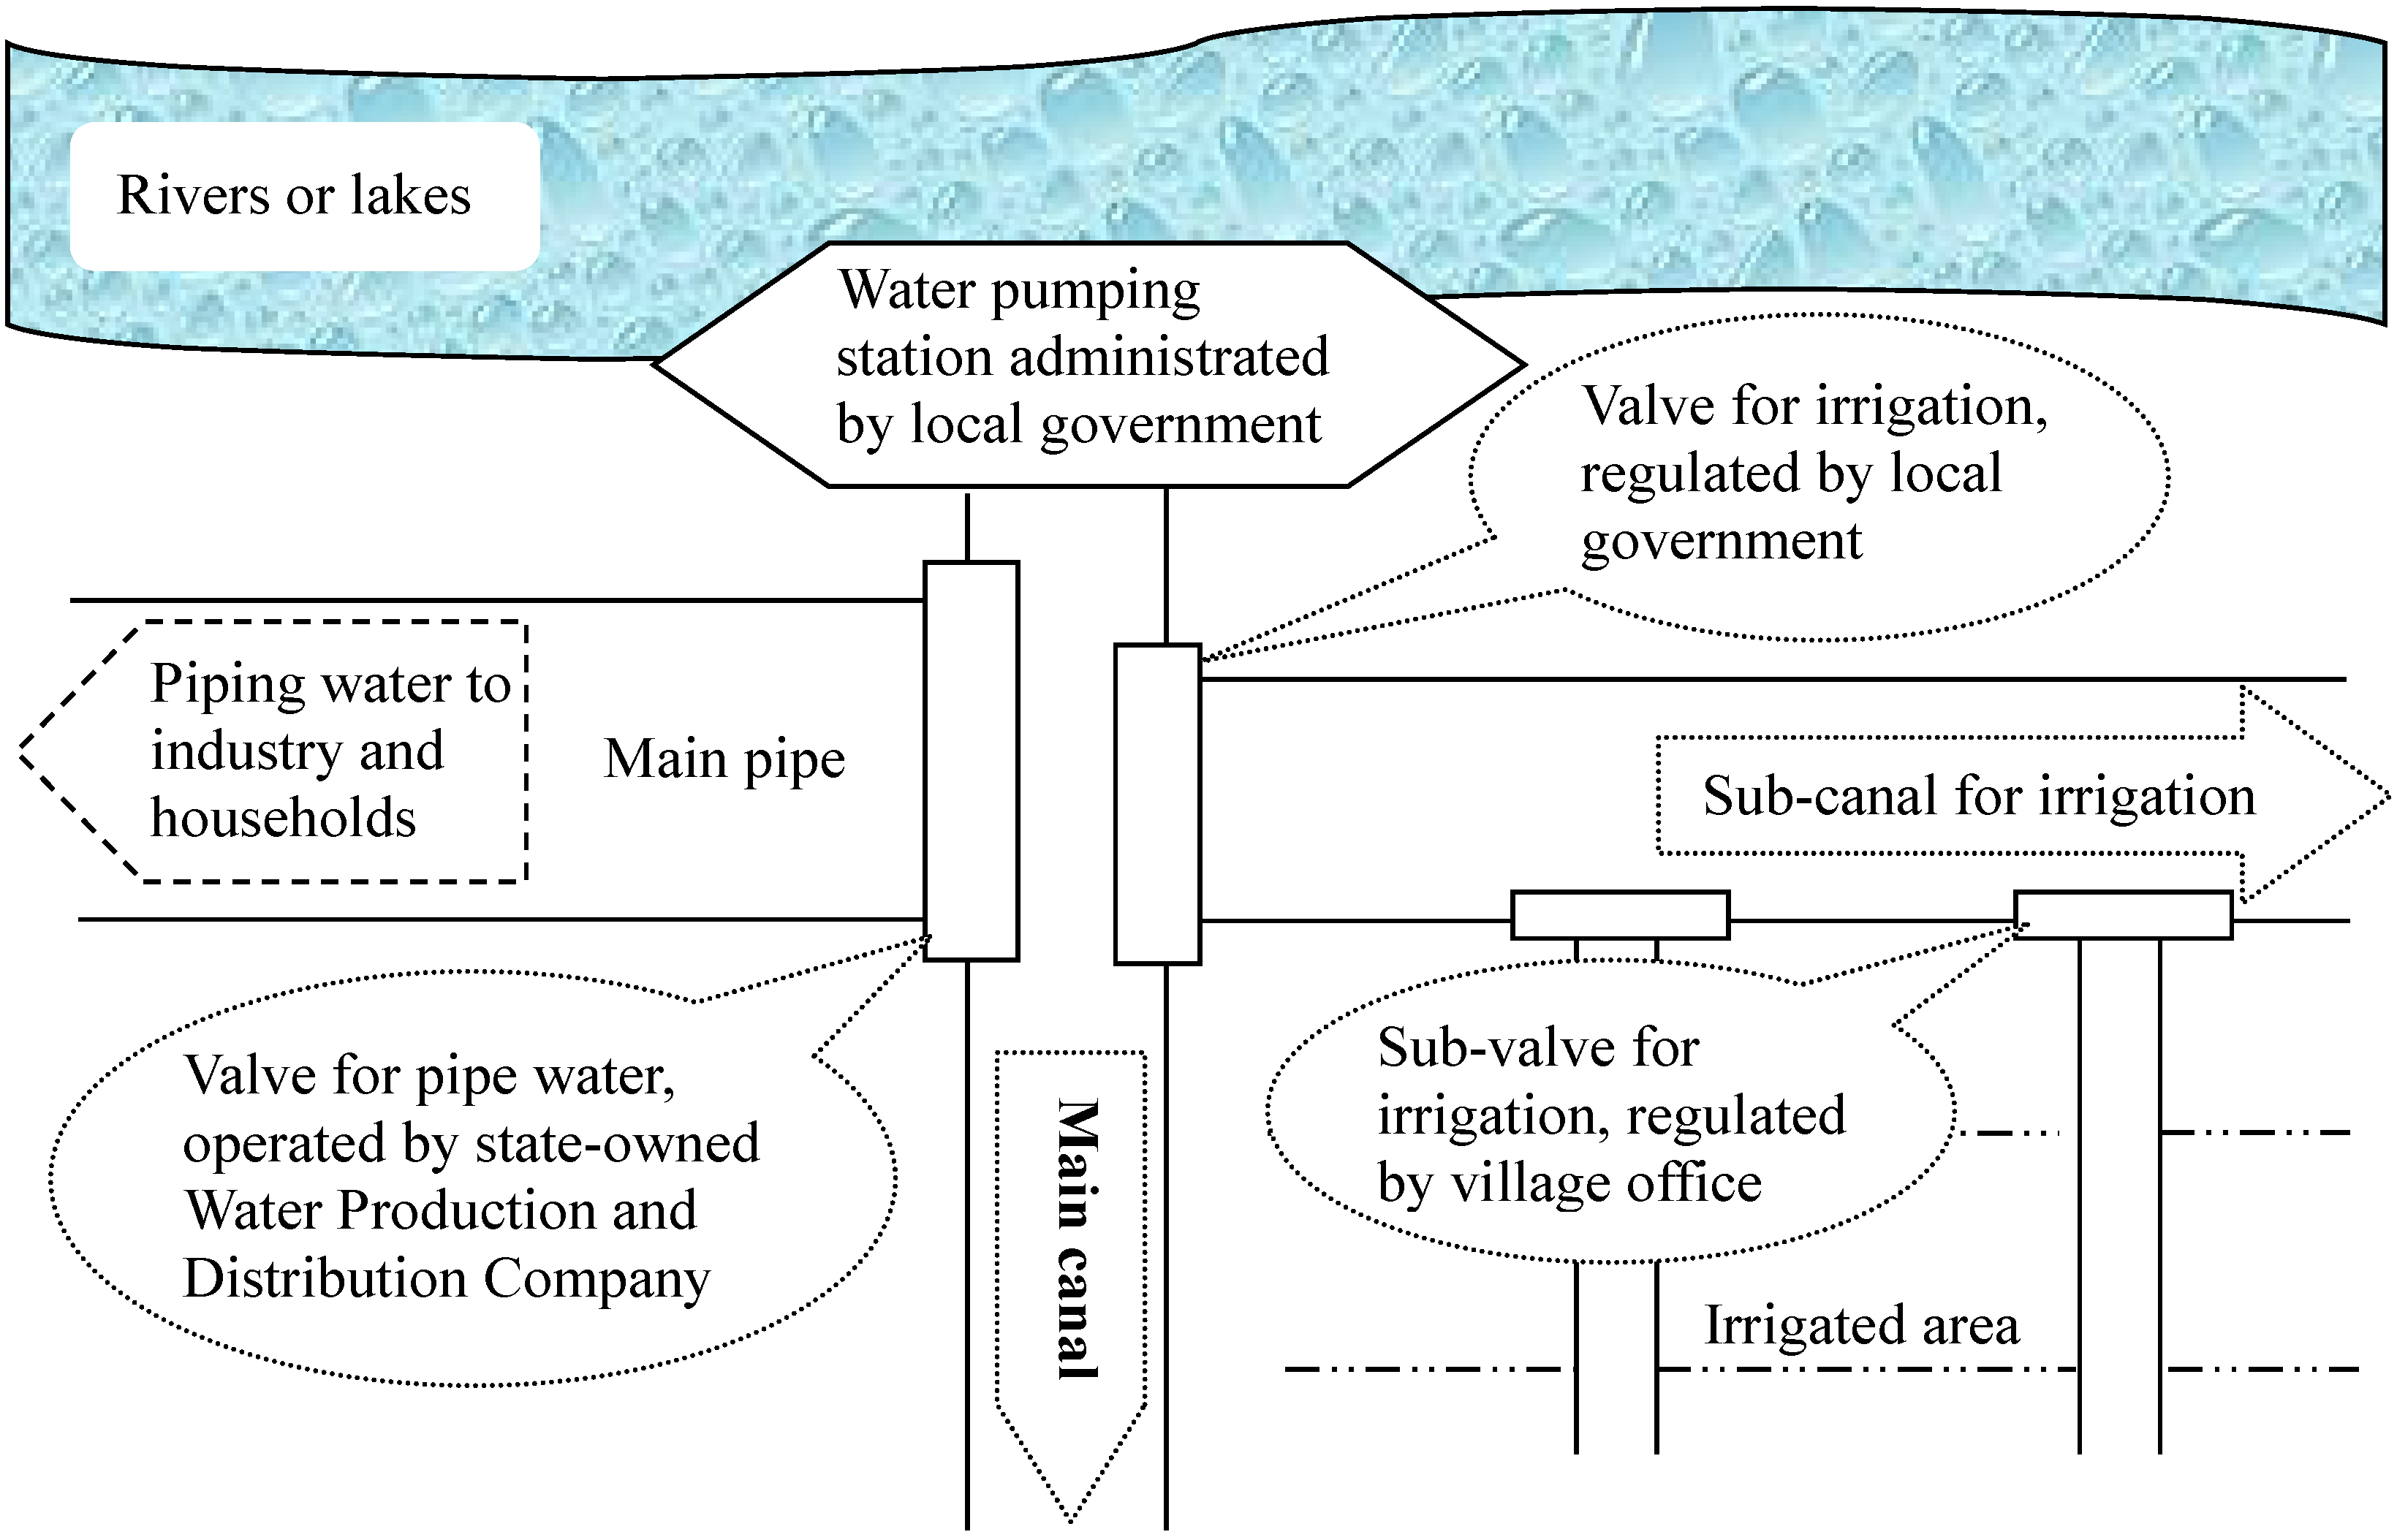
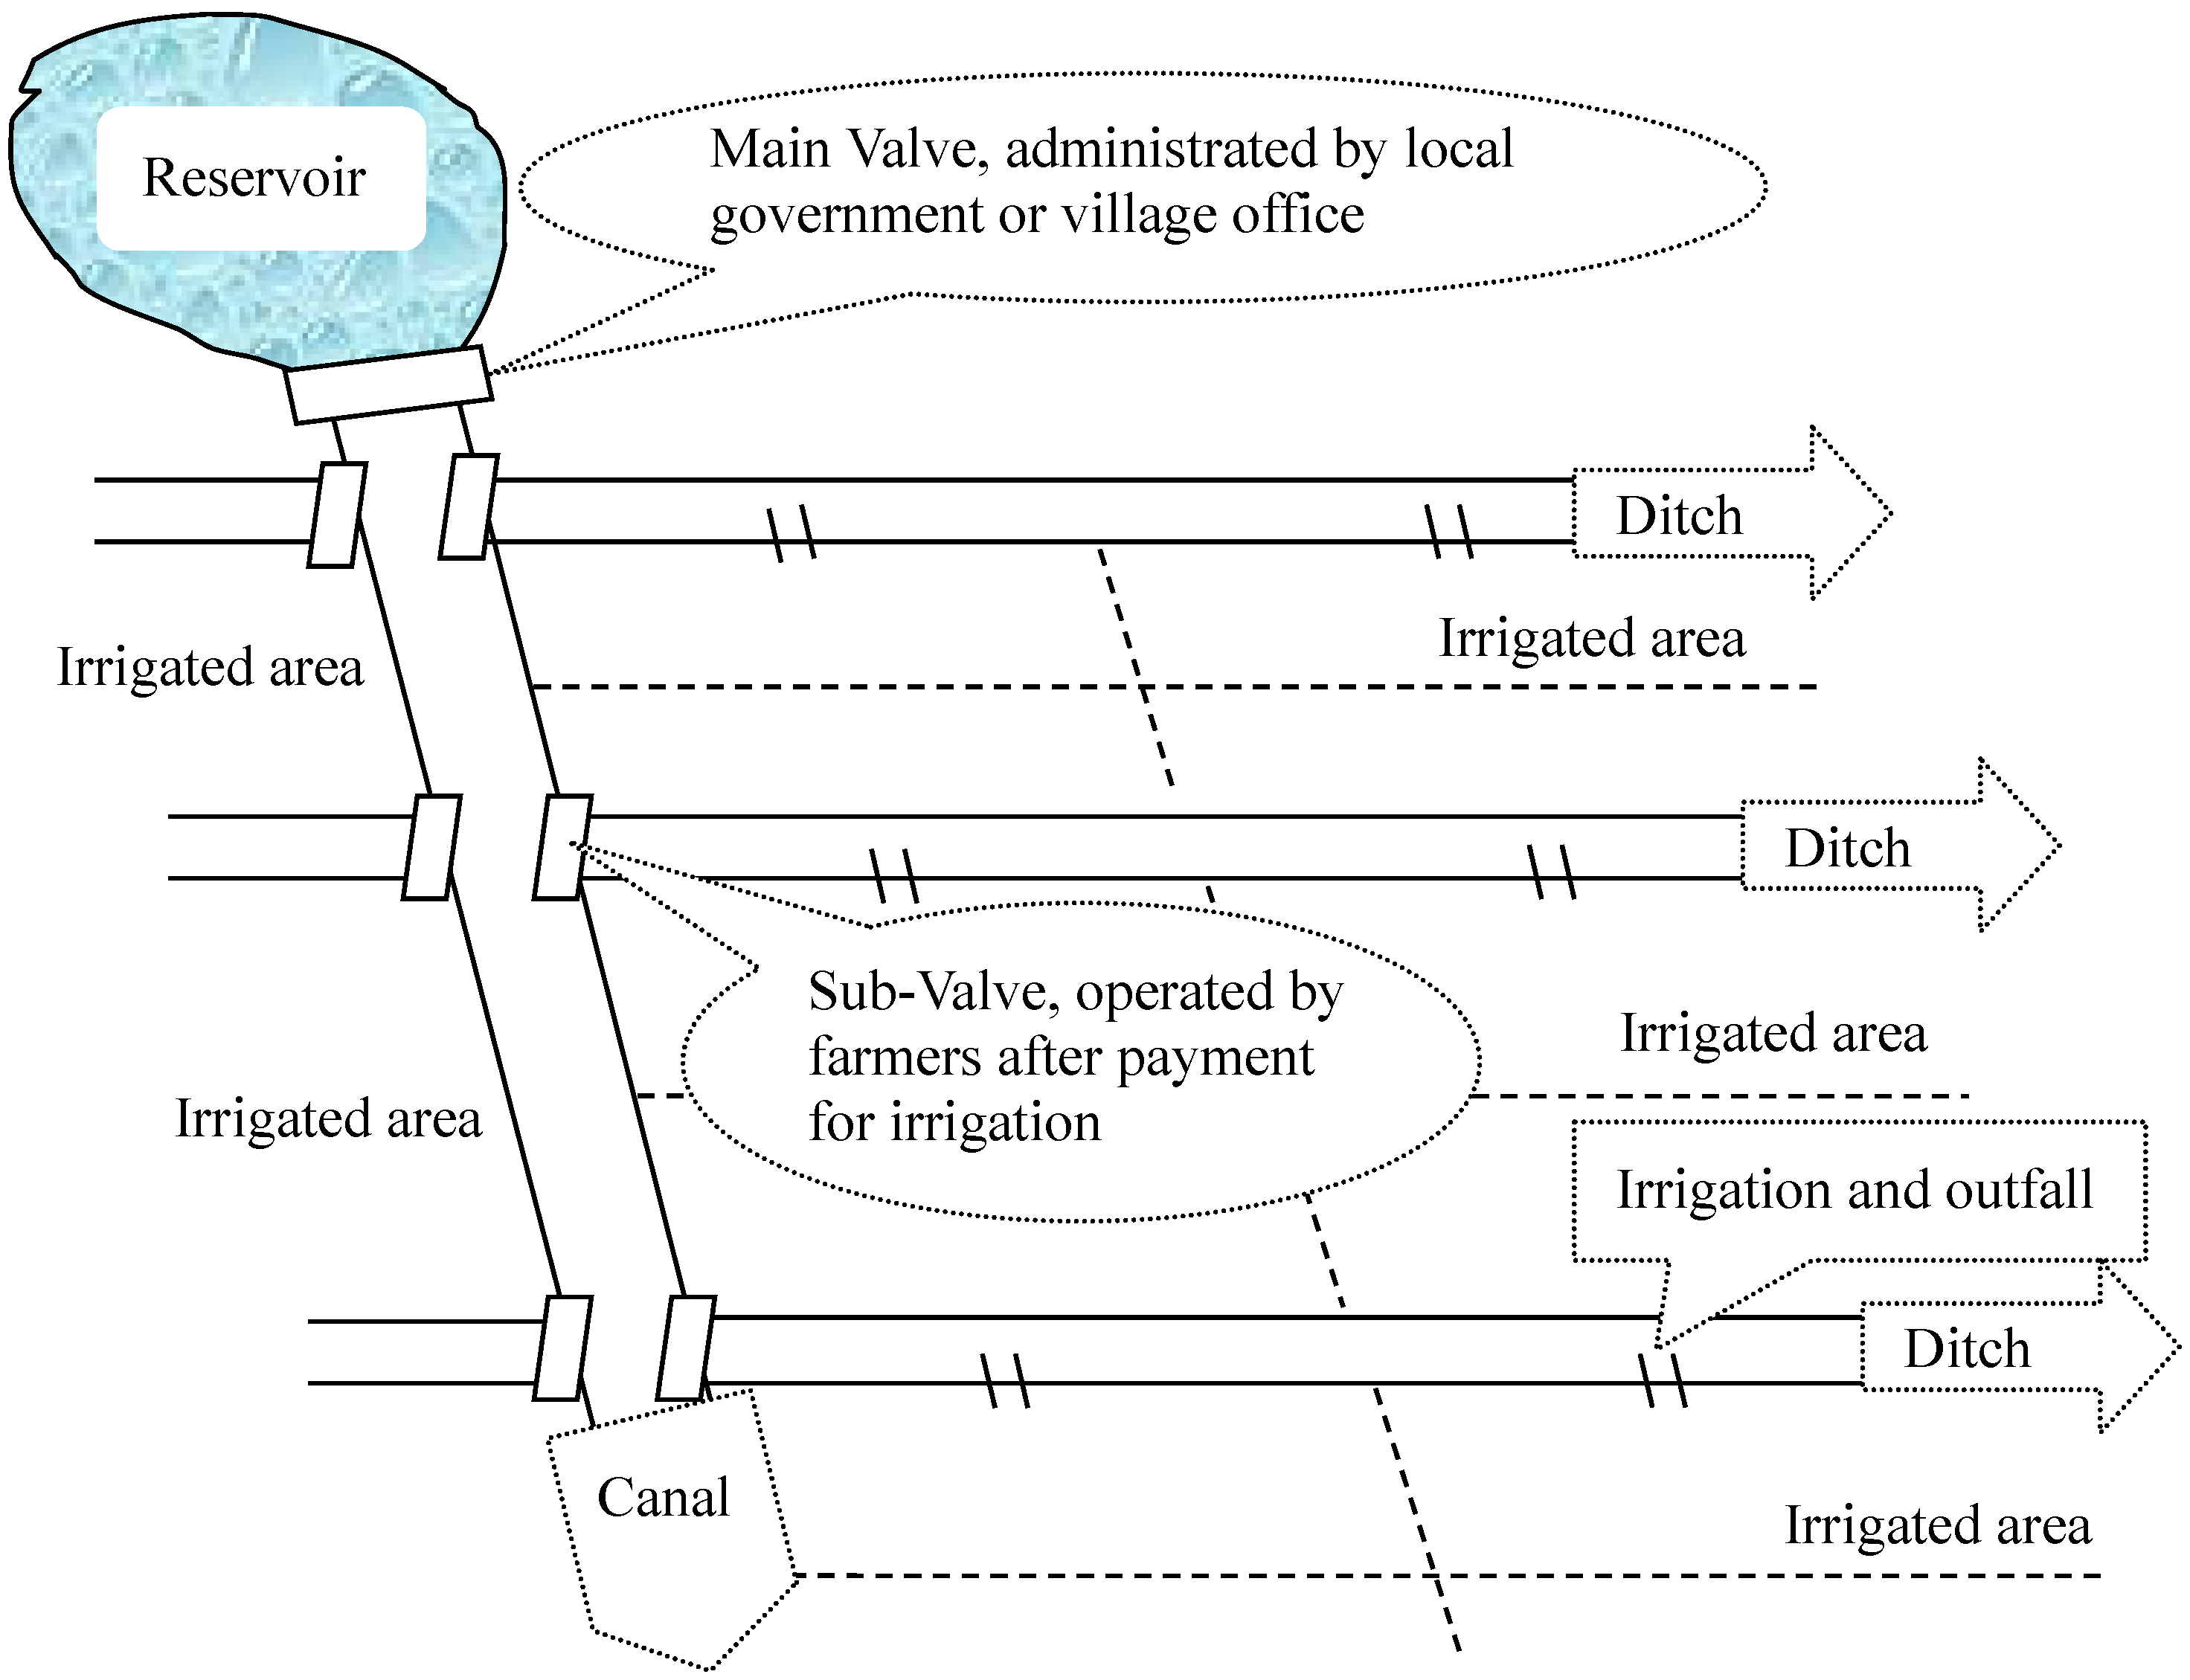
2.2.1. The Water Parallel Pricing System Observed from an Interview Survey

2.2.2. Water Price Distortion and Equilibrium Irrigation Water Inputs

| Provincial Level | Water Uses (100 Million Yuan) | Water Withdrawals (100 million m3) *** | Water Prices (Yuan/m3) **** | Subsidy Rates **** | |||
|---|---|---|---|---|---|---|---|
| Agricultural * | Industrial, Service and Households ** | Agricultural | Industrial and Residential | Agricultural (= Irrigation Water Price) | Industrial, Service and Households (= Pipe Water Price) | ||
| National level | 166.73 | 1199.87 | 3599.51 | 2219.16 | 0.05 | 0.54 | −0.91 |
| Guangdong | 7.13 | 255.24 | 224.84 | 237.67 | 0.03 | 1.07 | −0.97 |
| Jiangxi | 4.73 | 48.79 | 151.35 | 83.52 | 0.03 | 0.58 | −0.95 |
| Hainan | 1.95 | 5.56 | 35.84 | 10.85 | 0.05 | 0.51 | −0.89 |
| Yunnan | 6.61 | 12.72 | 105.95 | 44.08 | 0.06 | 0.29 | −0.78 |
| Guangxi | 5.89 | 27.31 | 208.39 | 102.01 | 0.03 | 0.27 | −0.89 |
| Henan | 18.20 | 26.03 | 120.07 | 89.21 | 0.15 | 0.29 | −0.48 |
| Jilin | 4.72 | 38.41 | 67.53 | 33.25 | 0.07 | 1.16 | −0.94 |
| Anhui | 6.68 | 68.21 | 120.56 | 111.49 | 0.06 | 0.61 | −0.91 |
| Heilongjiang | 15.22 | 54.86 | 214.75 | 76.62 | 0.07 | 0.72 | −0.90 |
| Hebei | 15.66 | 33.78 | 151.59 | 50.91 | 0.10 | 0.66 | −0.84 |
| Hubei | 6.20 | 70.38 | 132.65 | 126.09 | 0.05 | 0.56 | −0.92 |
| Chongqing | 2.42 | 21.53 | 18.75 | 58.67 | 0.13 | 0.37 | −0.65 |
| Sichuan | 11.62 | 42.19 | 118.71 | 95.27 | 0.10 | 0.44 | −0.78 |
| Inner Mongolia | 11.34 | 19.52 | 141.77 | 38.27 | 0.08 | 0.51 | −0.84 |
| Shandong | 10.40 | 105.38 | 159.71 | 59.83 | 0.07 | 1.76 | −0.96 |
| Other provinces | 37.95 | 369.97 | 1627.03 | 1001.43 | 0.02 | 0.37 | −0.93 |
| Unit: 10 thousand Yuan | Paddy | Wheat | Corn | Vegetables | Fruits | Oil Seeds | Sugarcane | Potato | Sorghum | Other Crops | Total |
|---|---|---|---|---|---|---|---|---|---|---|---|
| National level | 5,523,673 | 1,979,392 | 2,705,227 | 5,227,817 | 521,447 | 514,332 | 84,459 | 376,607 | 72,921 | 1,220,047 | 18,225,922 |
| Guangdong | 333,811 | 244 | 35,676 | 1,089,802 | 30,373 | 86,123 | 58,651 | 43,323 | 85 | 57,686 | 1,735,773 |
| Jiangxi | 670,855 | 1511 | 2299 | 86,829 | 25,978 | 12,353 | 715 | 10,137 | 377 | 44,426 | 855,479 |
| Hainan | 30,361 | 0 | 1317 | 139,560 | 5118 | 656 | 188 | 3044 | 0 | 2820 | 183,064 |
| Yunnan | 83,997 | 6572 | 14,851 | 152,402 | 2056 | 2423 | 6793 | 10,465 | 151 | 25,972 | 305,681 |
| Guangxi | 212,919 | 267 | 36,867 | 231,290 | 12,332 | 8881 | 7769 | 7890 | 298 | 20,365 | 538,879 |
| Henan | 23,692 | 176,274 | 6099 | 103,139 | 12,597 | 15,306 | 20 | 2172 | 80 | 10,909 | 350,288 |
| Jilin | 357,383 | 643 | 140,650 | 169,510 | 20,434 | 15,781 | 0 | 6626 | 14,001 | 39,651 | 764,680 |
| Anhui | 333,409 | 56,341 | 3882 | 173,428 | 38,600 | 29,198 | 211 | 7304 | 139 | 59,715 | 702,226 |
| Heilongjiang | 923,240 | 35,320 | 60,049 | 296,147 | 21,532 | 7010 | 0 | 8766 | 6176 | 150,424 | 1,508,664 |
| Hebei | 25,019 | 9298 | 28,133 | 877,554 | 13,480 | 12,579 | 0 | 6664 | 1951 | 28,951 | 1,003,628 |
| Hubei | 240,074 | 17,472 | 41,331 | 33,334 | 22,735 | 31,578 | 152 | 10,544 | 436 | 44,795 | 442,452 |
| Chongqing | 30,822 | 4090 | 10,220 | 5161 | 1194 | 2152 | 29 | 7782 | 315 | 7040 | 68,804 |
| Sichuan | 233,749 | 64,057 | 116,539 | 40,314 | 4592 | 17,707 | 524 | 20,133 | 2040 | 25,879 | 525,535 |
| Inner Mongolia | 7743 | 24,544 | 405,269 | 125,405 | 6041 | 13,347 | 0 | 15,993 | 8606 | 57,285 | 664,234 |
| Shandong | 34,559 | 343,945 | 310,213 | 1,390,362 | 140,928 | 7481 | 0 | 25,249 | 2351 | 110,911 | 2,365,998 |
| Other provinces | 1,982,039 | 1,238,813 | 1,491,833 | 313,580 | 163,458 | 251,758 | 9406 | 190,515 | 35,914 | 533,221 | 6,210,537 |
| Unit: 10 Thousand Yuan | Paddy | Wheat | Corn | Vegetables | Fruits | Oil Seeds | Sugarcane | Potato | Sorghum | Other Crops | Total |
|---|---|---|---|---|---|---|---|---|---|---|---|
| National level | −5,046,075 | −1,808,246 | −2,471,323 | −4,775,801 | −476,361 | −469,861 | −77,156 | −344,044 | −66,616 | −1,114,557 | −16,650,041 |
| Guangdong | −323,951 | −237 | −34,622 | −1,057,612 | −29,475 | −83,579 | −56,919 | −42,043 | −83 | −55,982 | −1,684,504 |
| Jiangxi | −634,967 | −1430 | −2176 | −82,184 | −24,589 | −11,692 | −676 | −9595 | −357 | −42,049 | −809,715 |
| Hainan | −27,142 | 0 | −1177 | −124,762 | −4575 | −587 | −168 | −2721 | 0 | −2521 | −163,653 |
| Yunnan | −65,832 | −5151 | −11,639 | −119,444 | −1611 | −1899 | −5324 | −8201 | −119 | −20,355 | −239,574 |
| Guangxi | −190,446 | −238 | −32,975 | −206,877 | −11,030 | −7944 | −6949 | −7057 | −267 | −18,216 | −482,000 |
| Henan | −11,384 | −84,702 | −2931 | −49,560 | −6053 | −7355 | −10 | −1044 | −38 | −5242 | −168,319 |
| Jilin | −335,738 | −604 | −132,132 | −159,244 | −19,196 | −14,826 | 0 | −6225 | −13,153 | −37,249 | −718,368 |
| Anhui | −303,209 | −51,237 | −3531 | −157,718 | −35,103 | −26,553 | −192 | −6642 | −127 | −54,306 | −638,618 |
| Heilongjiang | −831,884 | −31,825 | −54,107 | −266,843 | −19,402 | −6316 | 0 | −7899 | −5565 | −135,539 | −1,359,379 |
| Hebei | −21,124 | −7850 | −23,753 | −740,936 | −11,382 | −10,621 | 0 | −5627 | −1647 | −24,444 | −847,383 |
| Hubei | −219,965 | −16,009 | −37,869 | −30,542 | −20,831 | −28,933 | −139 | −9660 | −400 | −41,043 | −405,391 |
| Chongqing | −19,964 | −2649 | −6620 | −3343 | −773 | −1394 | −19 | −5041 | −204 | −4560 | −44,566 |
| Sichuan | −182,070 | −49,895 | −90,774 | −31,401 | −3577 | −13,792 | −408 | −15,682 | −1589 | −20,157 | −409,346 |
| Inner Mongolia | −6529 | −20,696 | −341,724 | −105,742 | −5094 | −11,254 | 0 | −13,485 | −7257 | −48,303 | −560,084 |
| Shandong | −33,281 | −331,224 | −298,739 | −1,338,936 | −135,715 | −7204 | 0 | −24,315 | −2264 | −106,808 | −2,278,487 |
| Other provinces | −1,838,589 | −1,204,498 | −1,396,554 | −300,656 | −147,955 | −235,914 | −6351 | −178,806 | −33,548 | −497,783 | −5,840,655 |
3. A CGE Model with the Water Parallel Pricing System
3.1. Previous CGE Model Focusing on China’s Water Resources
3.2. Data and Modeling Framework
| Unit: 0.1 billion yuan | Activities and Commodities | Factors | Institutions | Others | Total | |||||||||||||||
| AGR | OTH | WAP | 16WAR | 16LAND | 16AGRLB | NAGRLB | CAP | 16HHDRUAL | HHDURBN | GOV | ENT | S-I | DTAX | INDTAX | 16SUBWAR | TAR | ROW | |||
| Activities and Commodities | AGR | 6877 | 27,514 | 0 | 6013 | 6301 | 342 | 3581 | 666 | 51,294 | ||||||||||
| OTH | 13,348 | 503,647 | 590 | 19,106 | 65,968 | 34,849 | 109,503 | 94,875 | 841,886 | |||||||||||
| WAP | 9 | 837 | 41 | 52 | 270 | −30 | 1179 | |||||||||||||
| Factors | 16WAR | 1823 | 1823 | |||||||||||||||||
| 16LAND | 157 | 157 | ||||||||||||||||||
| 16AGRLB | 26,564 | 26,564 | ||||||||||||||||||
| NAGRLB | 618 | 82621 | 244 | 83,484 | ||||||||||||||||
| CAP | 1115 | 115,819 | 229 | 117,163 | ||||||||||||||||
| Institutions | 16HHDRUAL | 157 | 26,564 | 5036 | 6651 | 793 | 8105 | 905 | 48,211 | |||||||||||
| HHDURBN | 78,448 | 2328 | 5602 | 20,512 | 2008 | 108,898 | ||||||||||||||
| GOV | 1823 | 5700 | 11,965 | 38,519 | −1665 | 1433 | -12 | 57,761 | ||||||||||||
| ENT | 106,560 | 106,560 | ||||||||||||||||||
| Others | S-I | 22,013 | 34,199 | 16,053 | 69,163 | −22,675 | 118,754 | |||||||||||||
| DTAX | 1027 | 2158 | 8779 | 11,965 | ||||||||||||||||
| INDTAX | 48 | 38,396 | 75 | 38,519 | ||||||||||||||||
| 16SUBWAR | −1665 | −1665 | ||||||||||||||||||
| TAR | 73 | 1360 | 0 | 1433 | ||||||||||||||||
| ROW | 2328 | 71693 | 0 | 1623 | 122 | 75,766 | ||||||||||||||
| Total | 51,294 | 841,886 | 1179 | 1823 | 157 | 26,564 | 83,484 | 117,163 | 48,211 | 108,898 | 57,761 | 106,560 | 118,754 | 11,965 | 38,519 | -1665 | 1433 | 75,766 | ||

 ; endogenous variables are circled by
  .
; endogenous variables are circled by .
.
; endogenous variables are circled by .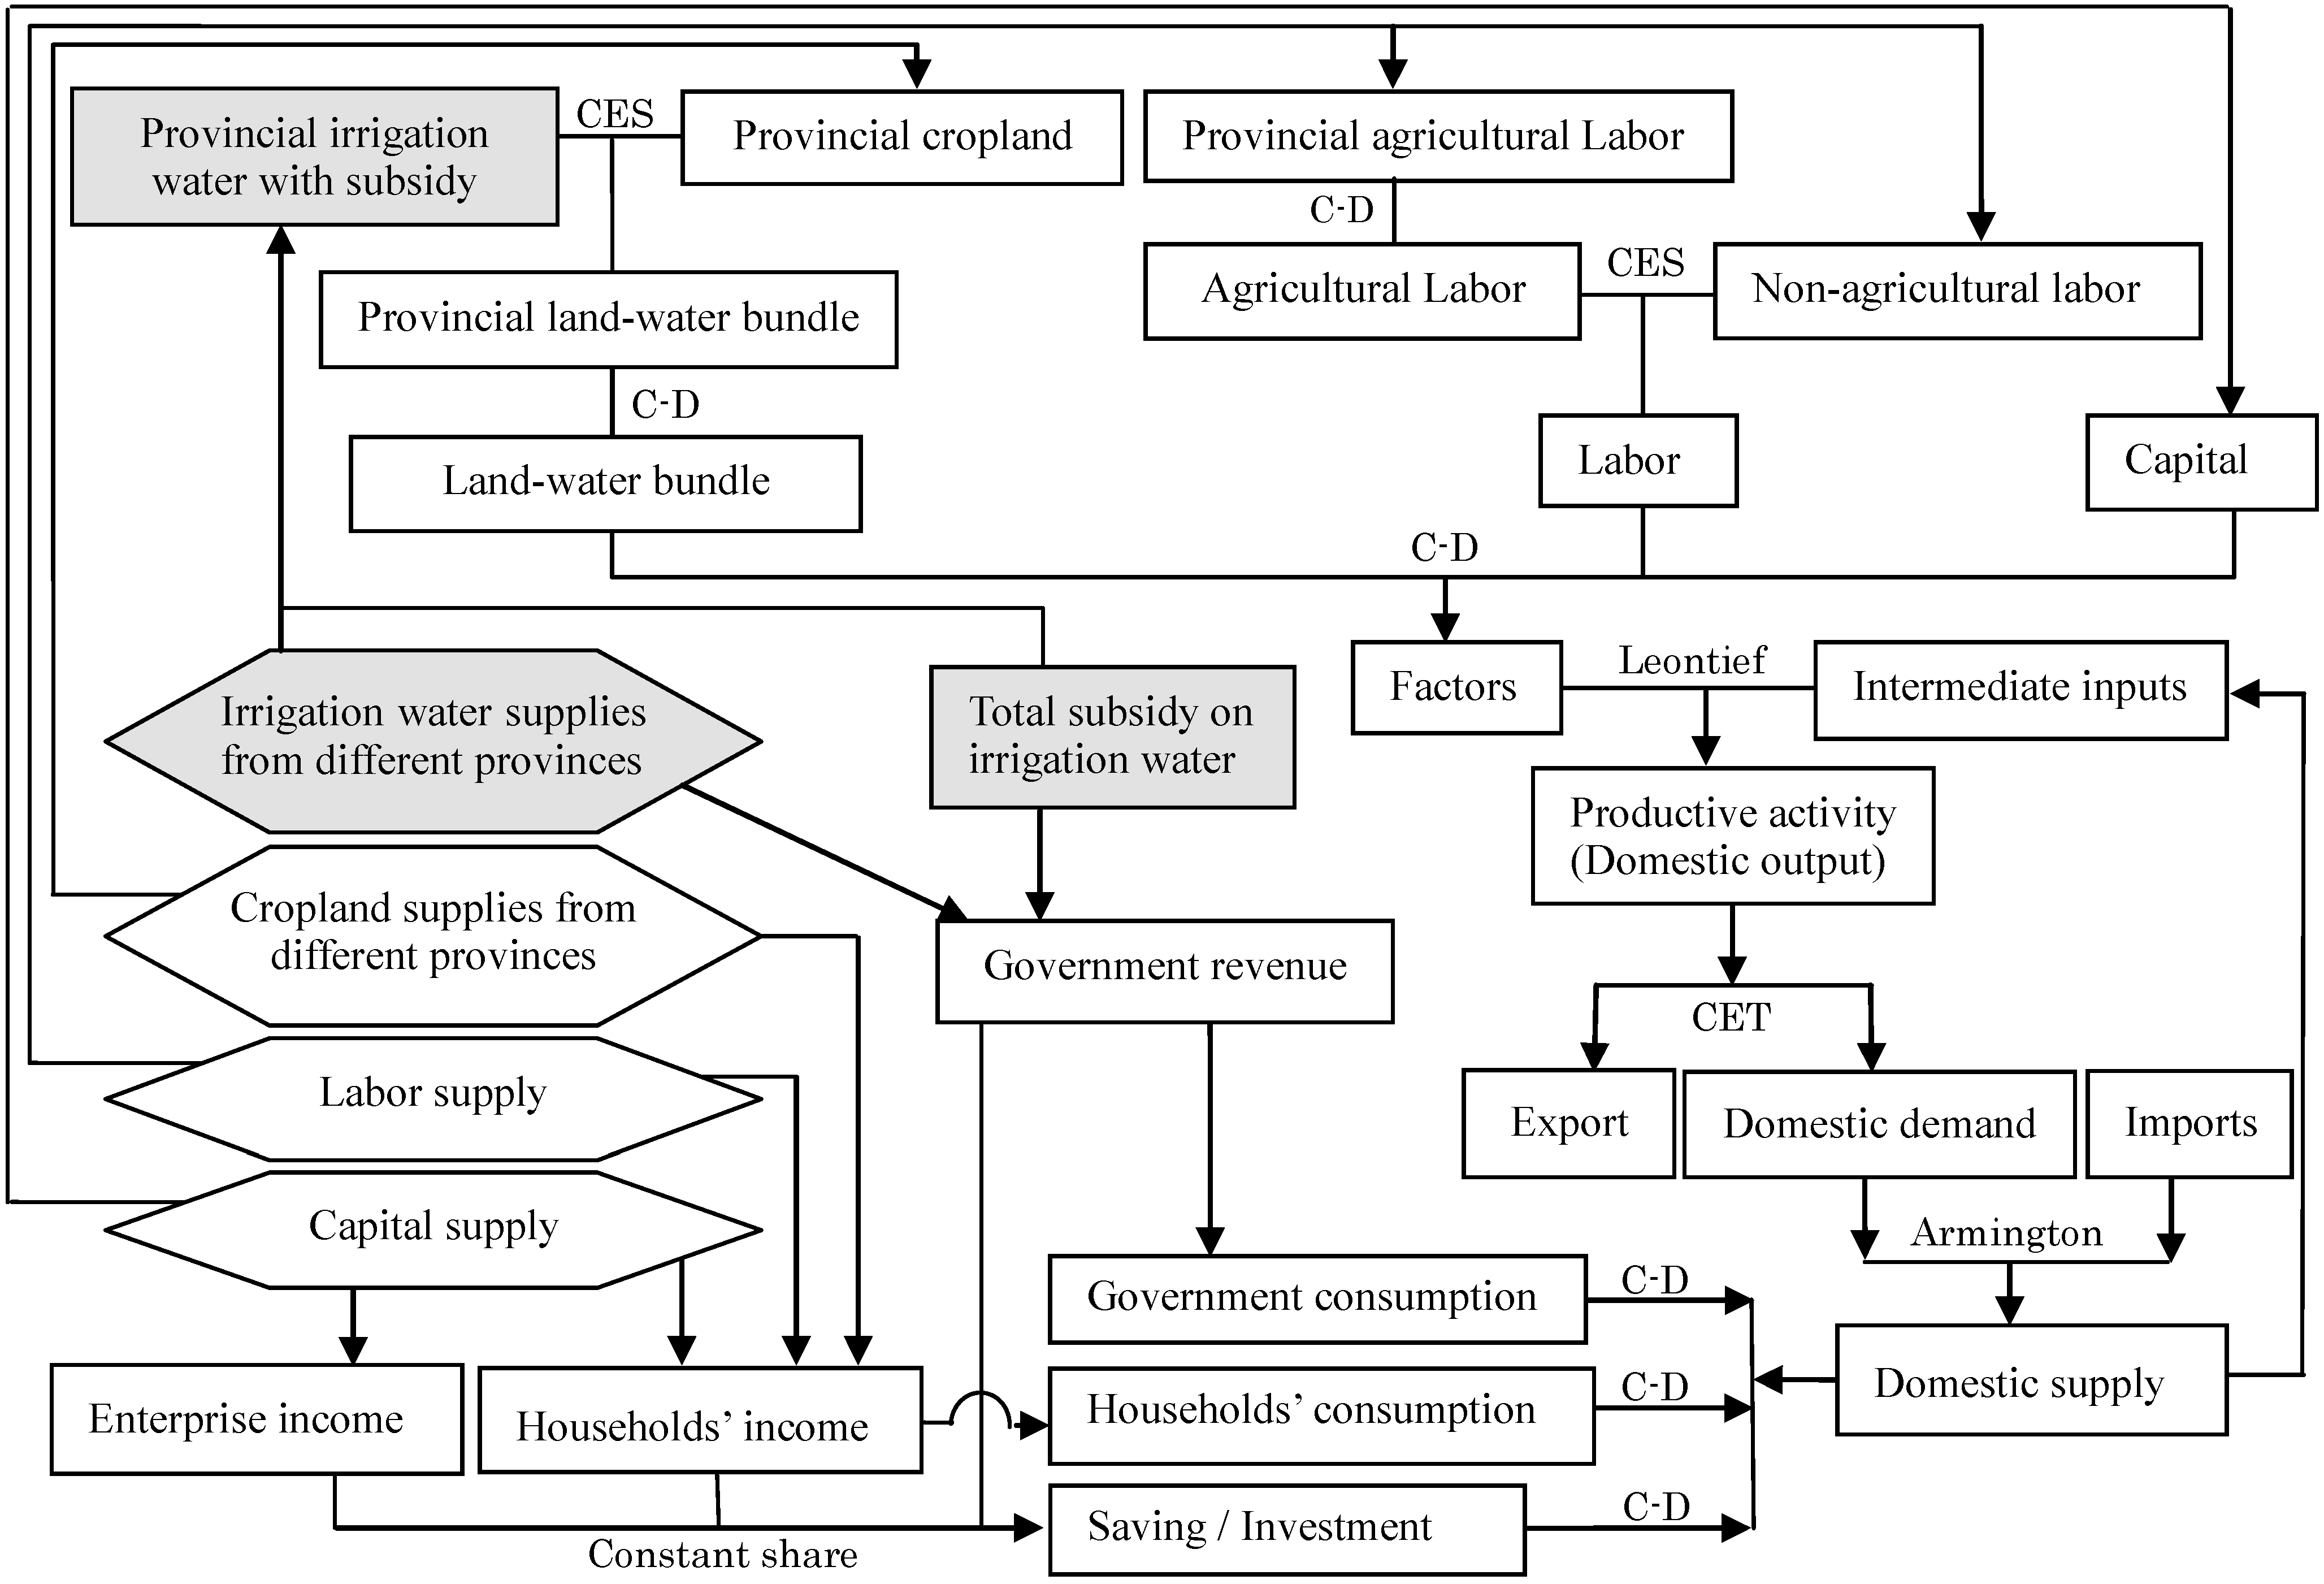
4. Simulation Results and Discussion
4.1. Simulation on the Drought of 2000
| Provincial Level | Simulating Cropland Supply | Simulating Irrigation Water Supply | ||||
|---|---|---|---|---|---|---|
| Cultivated Area of Farming 2007, Unit: 1000 ha * | Affected Rate of 2000 Drought ** | Simulated Rate ***** | Water Withdrawals in Agriculture 2007 Unit: 0.1 billion m3*** | Water Withdrawals in Agriculture 2000 Unit: 0.1 billion m3**** | Simulated Rate ***** | |
| Guangdong | 4363.10 | 1.551% | 0.995 | 224.84 | 258.42 | 1.028 |
| Jiangxi | 5245.10 | 11.096% | 0.967 | 151.35 | 152.79 | 1.067 |
| Hainan | 754.30 | 0.000% | 1.000 | 35.84 | 35.43 | 1.215 |
| Yunnan | 5801.90 | 1.953% | 0.994 | 105.95 | 111.80 | 0.945 |
| Guangxi | 5594.40 | 8.641% | 0.974 | 208.39 | 224.70 | 1.038 |
| Henan | 14,087.80 | 10.048% | 0.970 | 120.07 | 134.10 | 0.835 |
| Jilin | 4944.00 | 54.819% | 0.836 | 67.53 | 85.42 | 0.726 |
| Anhui | 8853.90 | 24.984% | 0.925 | 120.56 | 121.31 | 1.011 |
| Heilongjiang | 11,898.50 | 23.999% | 0.928 | 214.75 | 185.58 | 0.907 |
| Hebei | 8652.70 | 18.173% | 0.945 | 151.59 | 161.74 | 0.978 |
| Hubei | 7030.00 | 19.383% | 0.942 | 132.65 | 164.90 | 0.868 |
| Chongqing | 3134.70 | 5.291% | 0.984 | 18.75 | 18.54 | 1.158 |
| Sichuan | 9278.20 | 7.940% | 0.976 | 118.71 | 132.30 | 0.929 |
| Inner Mongolia | 6761.50 | 37.197% | 0.888 | 141.77 | 155.13 | 0.799 |
| Shandong | 10,724.40 | 18.892% | 0.943 | 159.71 | 175.92 | 0.944 |
| Other provinces | 46,339.40 | 17.632% | 0.947 | 1627.03 | 1665.45 | 1.047 |
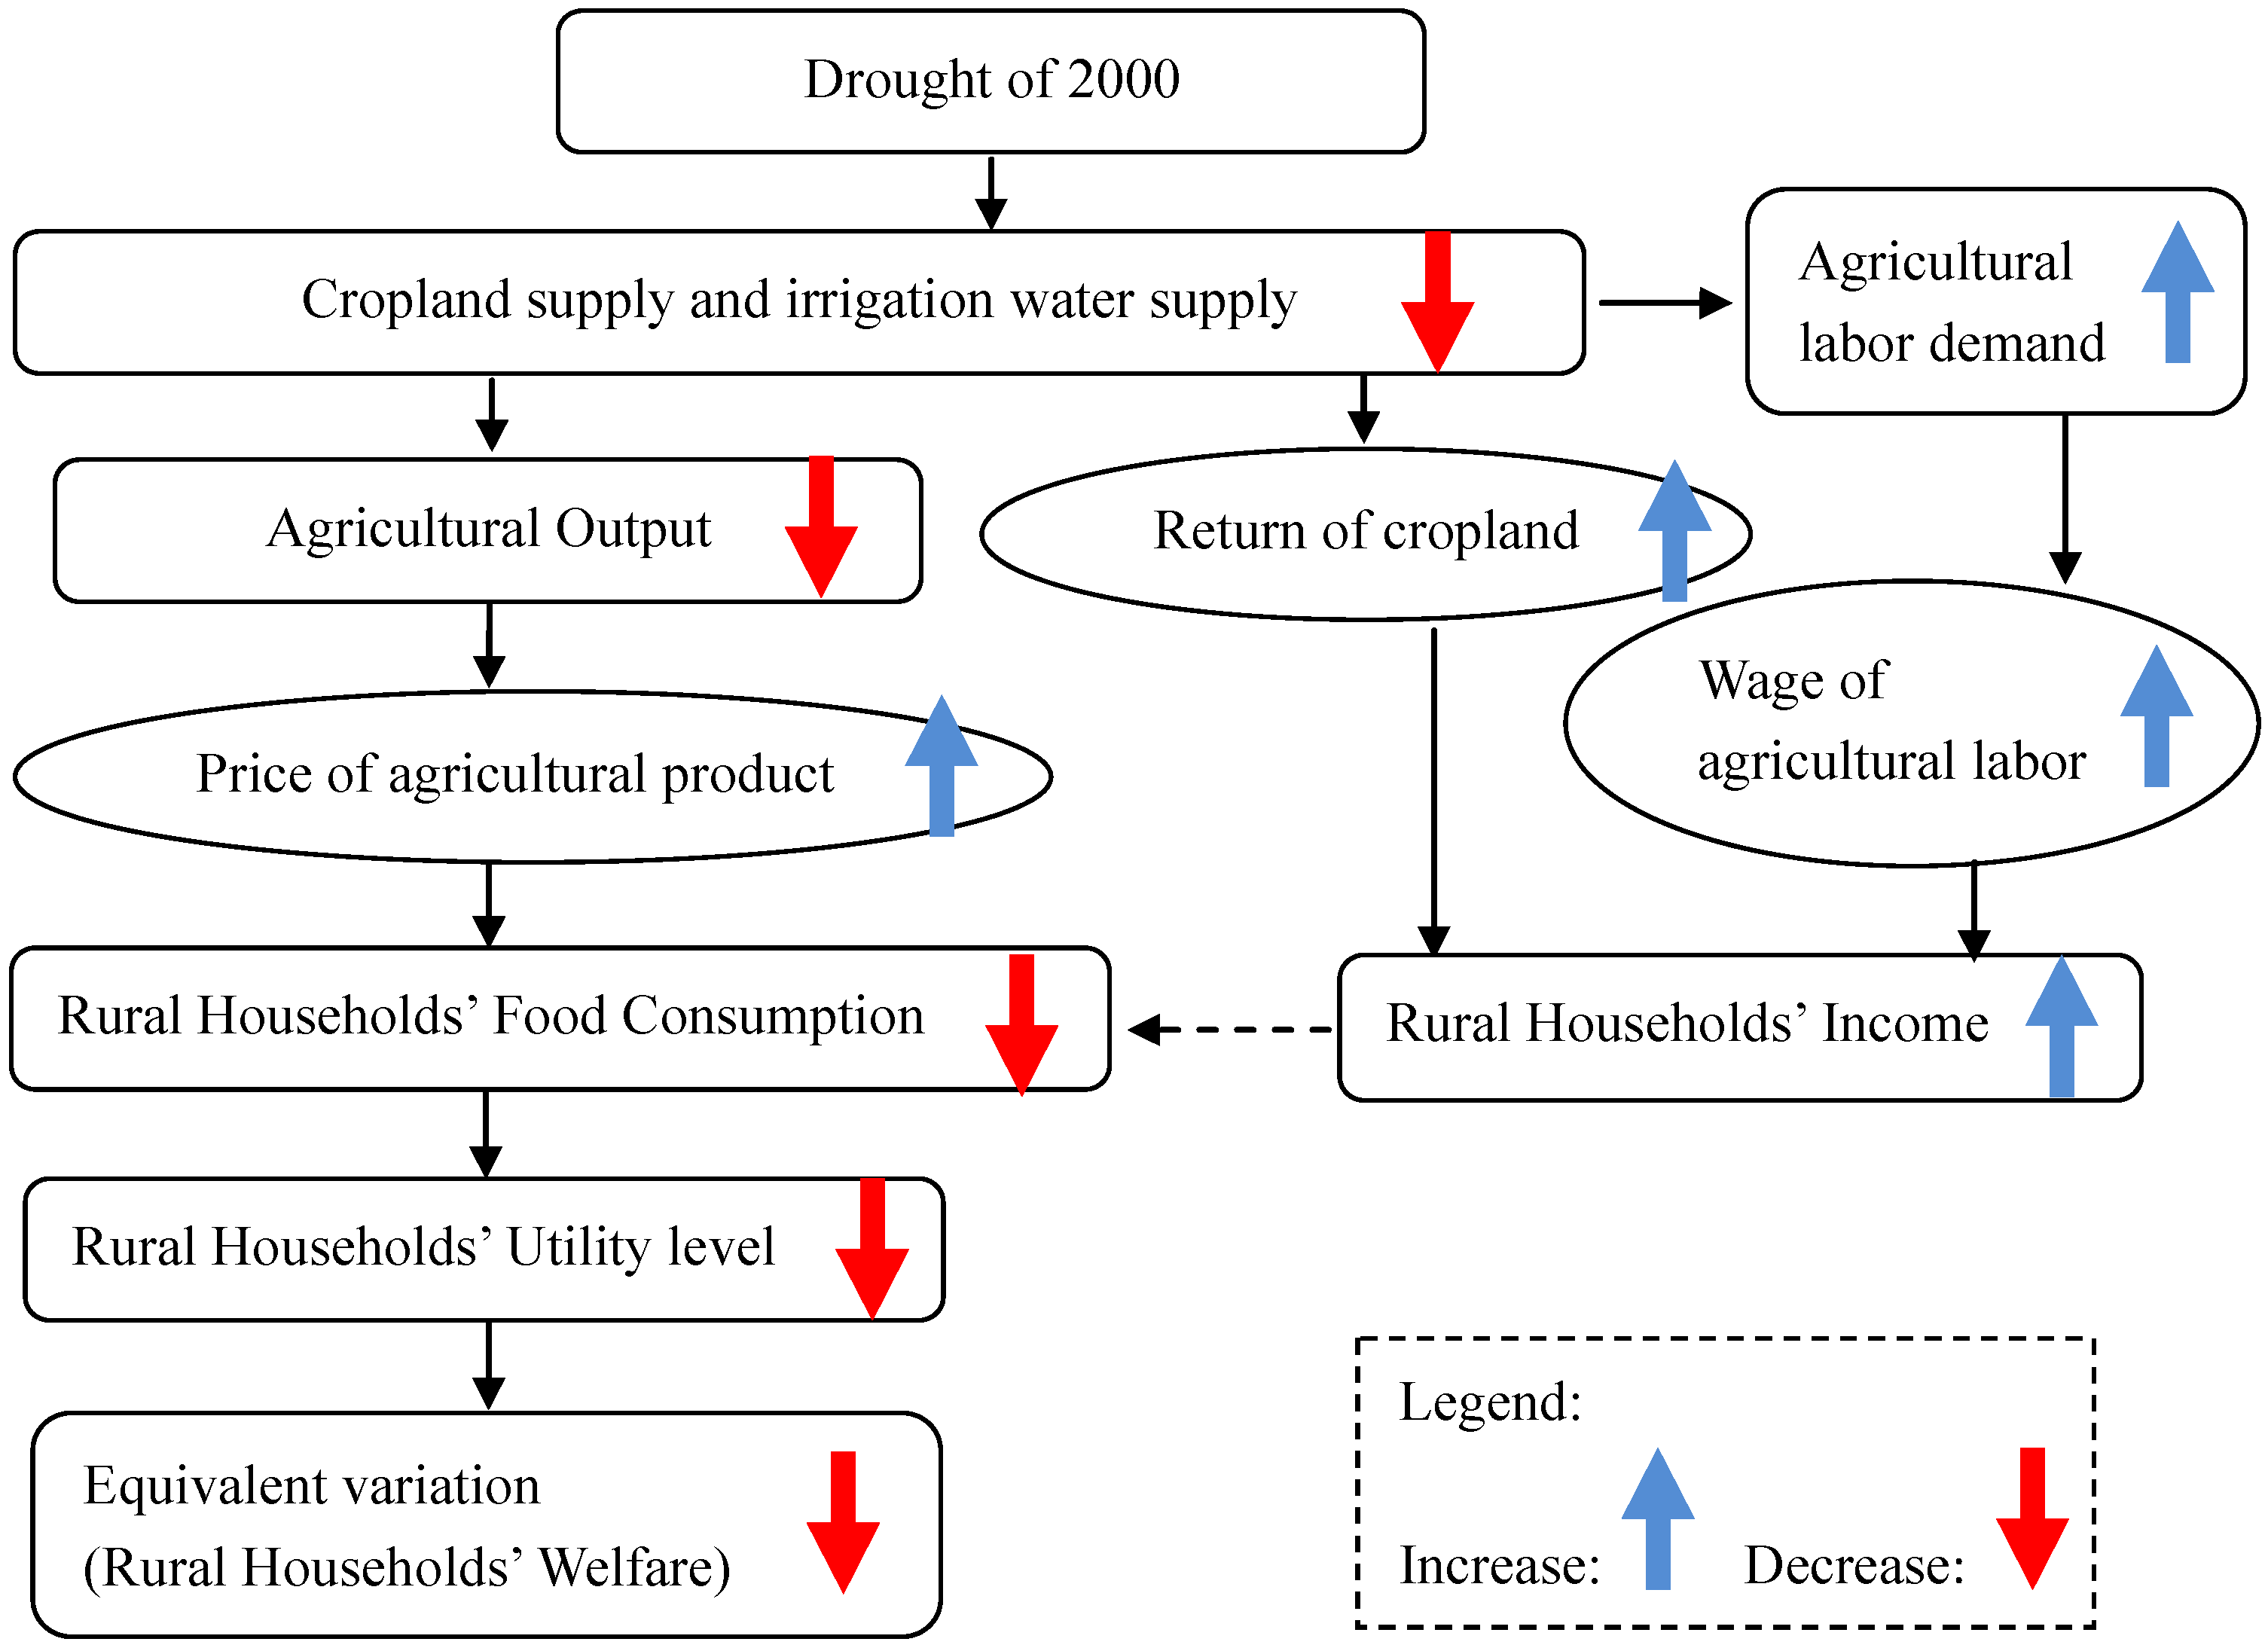
4.2. Effects of the 2000 Drought on the Agricultural Economy
| Changes in Macro Indexes | Level | |
|---|---|---|
| Nominal GDP, % | 0.013 | |
| Real GDP, % | −0.001 | |
| Total output of farming, % | −0.078 | |
| Total output of agriculture, % | −0.052 | |
| Total consumption, % | −0.012 | |
| Total food consumption, % | −0.068 | |
| Total change in welfare of households, 10 million Yuan | −116.036 | |
| Consumer price index, % | 0.028 | |
| Capital return, % | 0.009 | |
| Exchange rate, % | 0.010 | |
| Pipe water price, % | 0.006 | |
| Provincial Prices of Irrigation Water, % | Guangdong | −5.43 |
| Jiangxi | −19.87 | |
| Hainan | −23.68 | |
| Yunnan | 9.68 | |
| Guangxi | −12.96 | |
| Henan | 38.64 | |
| Jilin | 51.80 | |
| Anhui | −9.79 | |
| Heilongjiang | 11.18 | |
| Hebei | 1.50 | |
| Hubei | 26.20 | |
| Chongqing | −32.06 | |
| Sichuan | 11.46 | |
| Inner Mongolia | 38.59 | |
| Shandong | 6.03 | |
| Other provinces | −14.74 | |
| Unit: % | Producer Prices | Outputs | Exports | Imports | Capital Inputs | Composite Agricultural Labor Inputs | Non-Agricultural Labor Inputs | Composite Land and Water Inputs |
|---|---|---|---|---|---|---|---|---|
| Paddy | 0.156 | −0.114 | −0.636 | 0.645 | 0.172 | 0.132 | 0.172 | −2.875 |
| Wheat | 0.385 | −0.407 | −1.741 | 1.454 | 0.349 | 0.306 | 0.348 | −8.882 |
| Corn | 0.338 | −0.084 | −1.255 | 0.512 | 0.403 | 0.360 | 0.402 | −5.864 |
| Vegetable | 0.223 | −0.196 | −0.958 | 0.371 | 0.044 | 0.004 | 0.043 | −6.252 |
| Fruit | 0.066 | −0.064 | −0.265 | 0.099 | 0.098 | 0.058 | 0.098 | −4.365 |
| Oil seed | 0.129 | −0.295 | −0.722 | 0.061 | −0.113 | −0.153 | −0.113 | −4.075 |
| Sugarcane | 0.075 | −0.024 | 0.139 | 0.077 | 0.040 | 0.077 | −2.600 | |
| Potato | 0.189 | −0.150 | −0.791 | 0.327 | 0.045 | 0.005 | 0.045 | −4.469 |
| Sorghum | 0.974 | −2.278 | −5.595 | 2.648 | −1.252 | −1.292 | −1.252 | −9.220 |
| Other crops | 0.044 | −0.017 | −0.140 | 0.071 | 0.029 | −0.012 | 0.028 | −1.848 |
| Animal Husbandry | 0.061 | −0.030 | −0.213 | 0.048 | 0.006 | −0.033 | 0.006 | |
| Forestry | 0.038 | −0.017 | −0.116 | 0.052 | 0.020 | −0.020 | 0.020 | |
| Fishery | 0.042 | −0.021 | −0.134 | 0.023 | 0.014 | −0.023 | 0.014 |
| Unit: for Welfare, 10 million Yuan;for Income and Consumption, % | Welfare | Income | Consumption | Food Consumption | |
|---|---|---|---|---|---|
| 16 Provincial Rural Households | Guangdong | −3.754 | 0.033 | −0.026 | −0.103 |
| Jiangxi | −0.638 | 0.064 | −0.007 | −0.099 | |
| Hainan | 0.125 | 0.080 | 0.009 | −0.077 | |
| Yunnan | −1.985 | 0.037 | −0.024 | −0.103 | |
| Guangxi | −0.571 | 0.061 | −0.006 | −0.091 | |
| Henan | −9.280 | −0.053 | −0.069 | −0.087 | |
| Jilin | −1.970 | 0.008 | −0.041 | −0.127 | |
| Anhui | 0.566 | 0.053 | 0.005 | −0.086 | |
| Heilongjiang | −0.492 | 0.036 | −0.008 | −0.089 | |
| Hebei | 1.941 | 0.048 | 0.017 | −0.041 | |
| Hubei | −5.489 | 0.011 | −0.049 | −0.145 | |
| Chongqing | 0.718 | 0.083 | 0.016 | −0.066 | |
| Sichuan | −7.767 | 0.018 | −0.048 | −0.124 | |
| Inner Mongolia | −2.393 | −0.022 | −0.055 | −0.124 | |
| Shandong | 1.674 | 0.036 | 0.009 | −0.050 | |
| Other provinces | 14.365 | 0.059 | 0.014 | −0.069 | |
| Total change in rural households | −14.952 | 0.037 | −0.006 | −0.086 | |
| Urban households | −101.085 | 0.007 | −0.014 | −0.057 | |
5. Conclusions and Policy Recommendation
Acknowledgments
Author Contributions
Conflicts of Interest
Appendix: SCGE Model with Irrigation Water from 16 Provinces (SCGE-16P)
A1. Model Equations
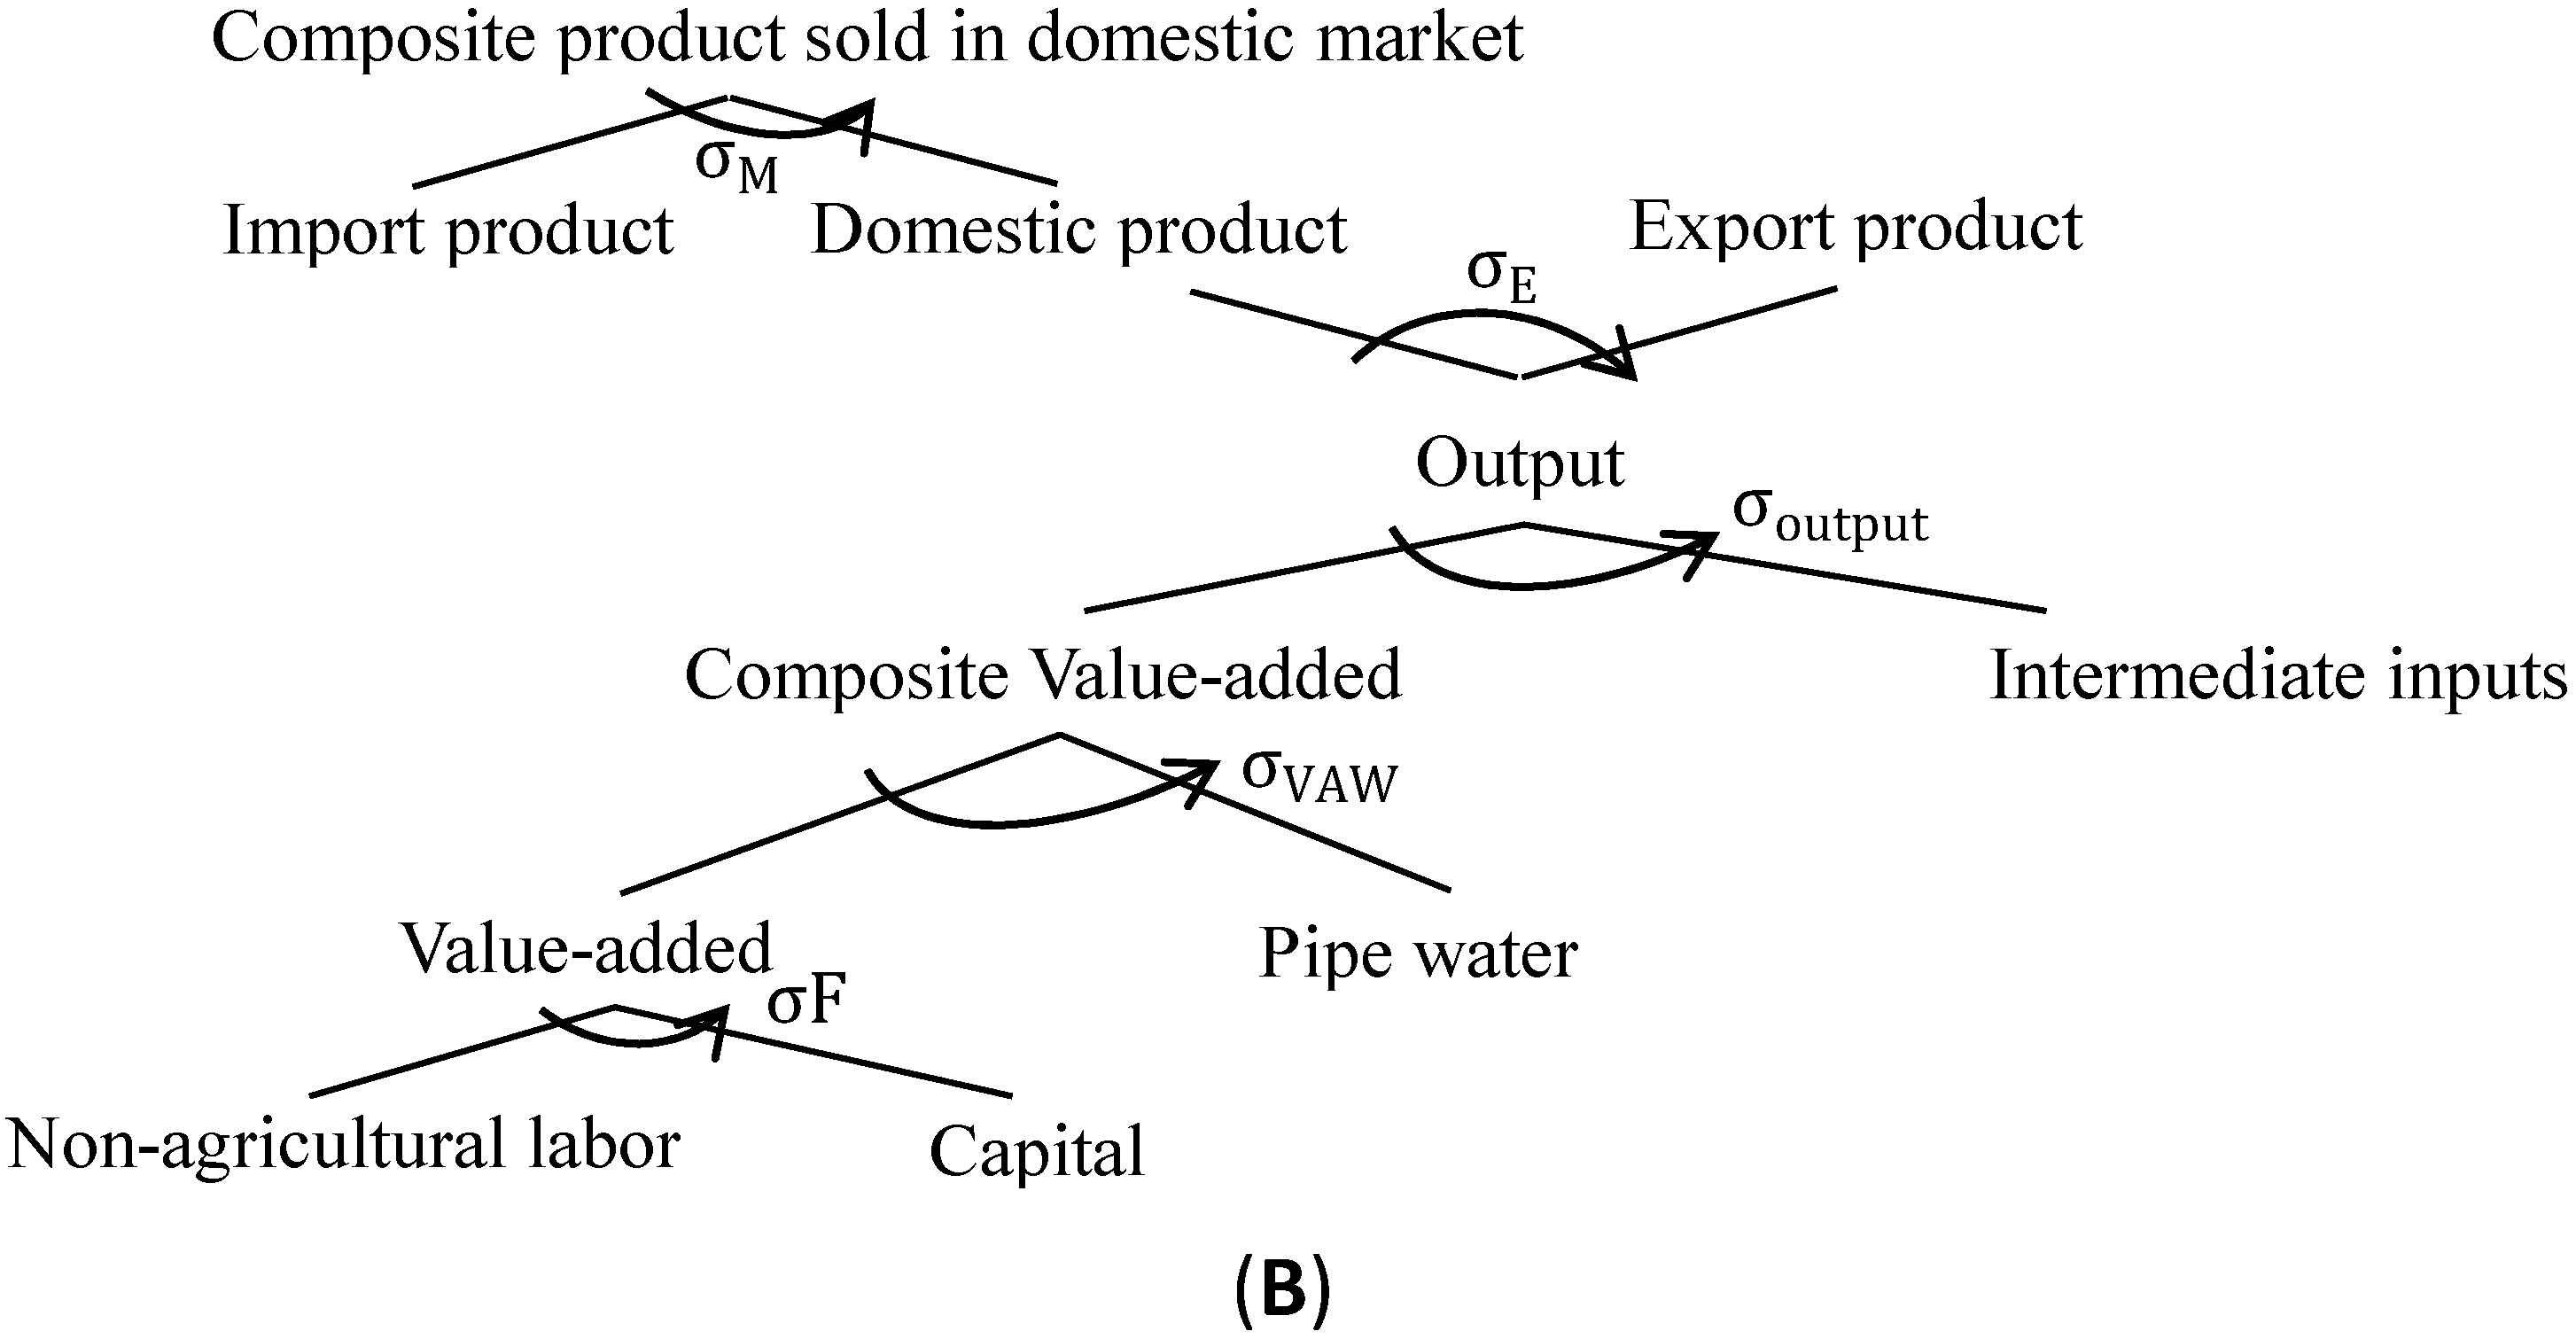
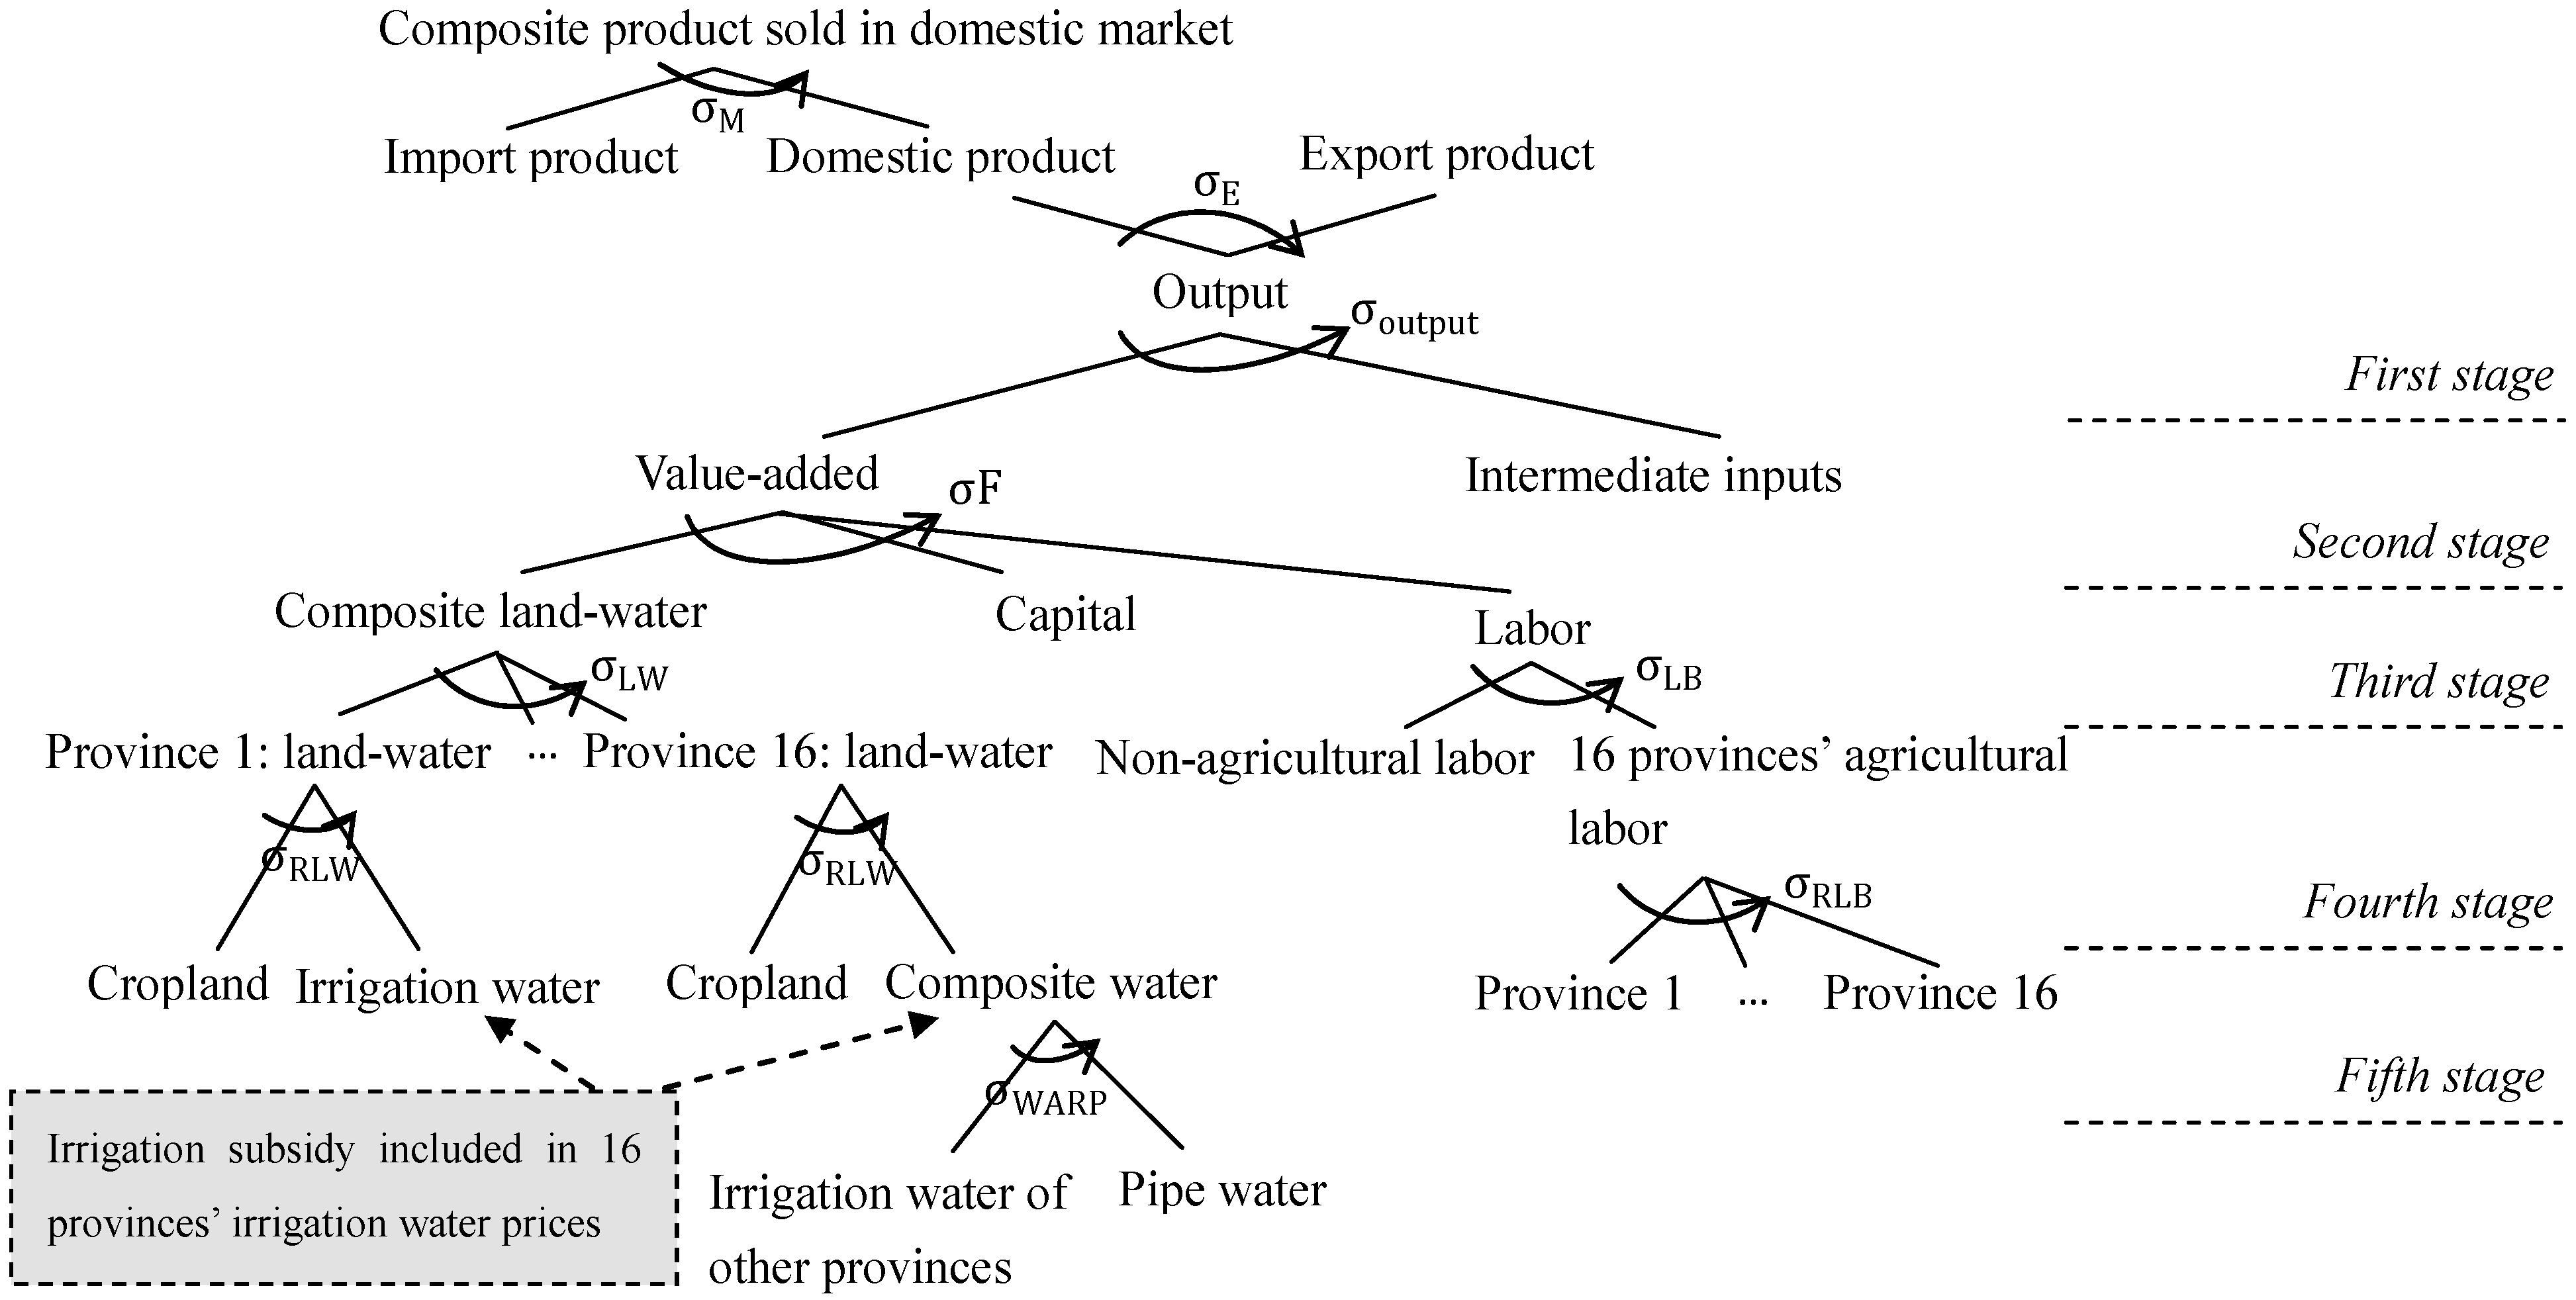
A1.1. Production Block
A1.1.1. Provinces’ Agricultural Labor in Cobb-Douglas Function
A1.1.2. Composite Agricultural Labor in Cobb-Douglas Function
A1.1.3. Non-agricultural Labor in CES Function
A1.1.4. Composite Agricultural Labor in CES Function
A1.1.5. Zero-profit Condition in CES Function for the Labor
A1.1.6. Irrigation Water Demand of “Other Provinces” for Farming Production Sectors
A1.1.7. Pipe Water Demand of “Other Provinces” for Farming Production Sectors
A1.1.8. Zero-profit Condition in CES Function for the Composite Water Demand of “Other Provinces” for Farming Production Sectors
A1.1.9. Composite Water Demand of “Other Provinces” for Farming Production Sectors
A1.1.10. Cropland Demand of “Other Provinces” for Farming Production Sectors
A1.1.11. Zero-profit Condition in CES Function for the Land-Water Bundles of “Other Province” for Farming Production Sectors
A1.1.12. Irrigation Water Demand of 16 Provinces except “Other Provinces” for Farming Production Sectors
A1.1.13. Cropland Demand of 16 Provinces except “Other Provinces” for Farming Production Sectors
A1.1.14. Zero-profit Condition in CES Function for Land-water Bundles of 16 Provinces Except “Other Provinces” for Farming Production Sectors
A1.1.15. Demand of Land-water Bundle of 16 Provinces in Cobb-Douglas Function for Farming Production Sectors
A1.1.16. Composite Land-Water Demand in Cobb-Douglas Function for Farming Production Sectors
A1.1.17. Capital Demand in Cobb-Douglas Function for Agricultural Production Sectors
A1.1.18. Composite Labor Demand in Cobb-Douglas Function for Agricultural Production Sectors
A1.1.19. Composite Land-Water Demand in Cobb-Douglas for Farming Production Sectors
A1.1.20. Value-Added Demand in Cobb-Douglas Function for Farming Production Sectors
A1.1.21. Value-Added Demand in Cobb-Douglas Function for Non-farming Production Sectors
A1.1.22. Capital Demand in CES Function for the Production of Other Sectors
A1.1.23. Non-agricultural Labor Demand in CES Function for the Production of Other Sectors
A1.1.24. Zero-profit Condition in CES Function for Value Added of Other Sectors
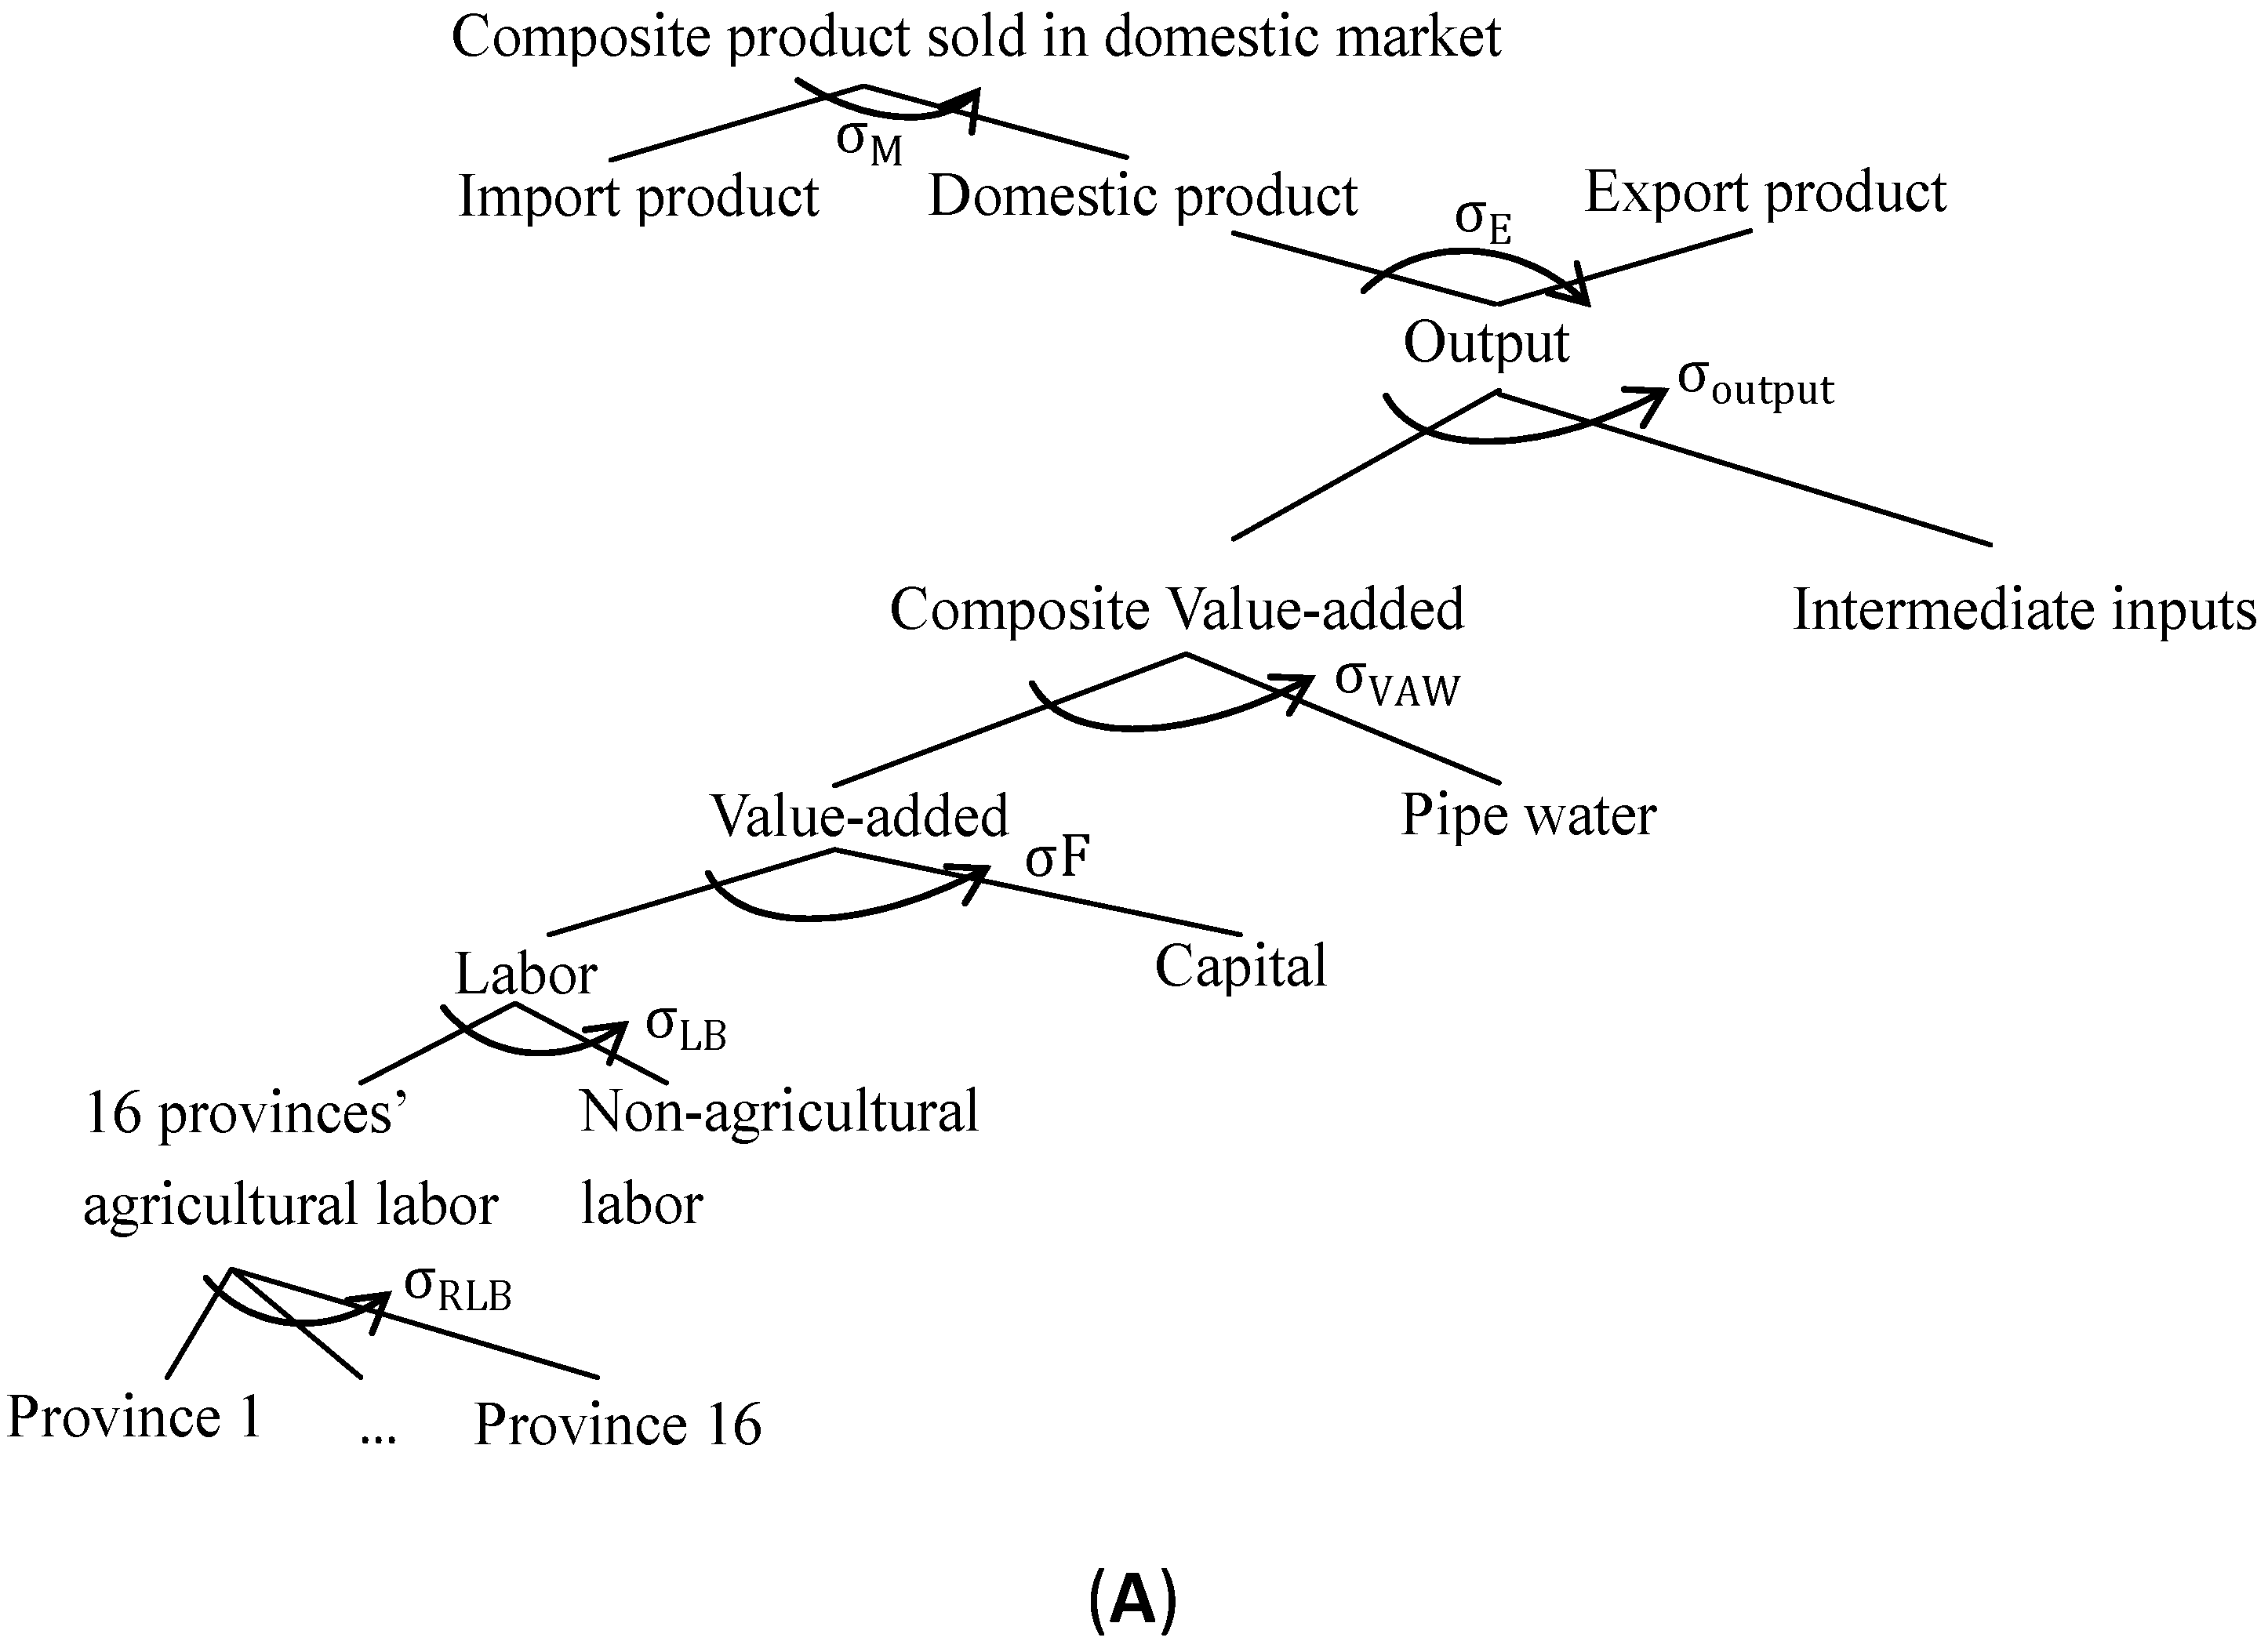
A1.1.25. Value-Added Demand in CES Function for Non-farming Agricultural and Other Sectors
A1.1.26. Pipe Water Demand in CES Function for Non-farming Agricultural and Other Sectors
A1.1.27. Zero-profit Condition in CES Function for the Pipe Water Demand and Value-added Demand of Non-farming Agricultural and Other Sectors
A1.1.28. Intermediate Demand Except Water in Leontief Function
A1.1.29. Vale-Added Demand in Leontief Function for Farming Sectors
A1.1.30. Composite Vale-Added Demand in Leontief Function for Non-farming Agricultural and Other Sectors
A1.1.31. Relationship between the Producer Price, the Price of Value-Added and the Price of Intermediate Inputs for Production Sectors
A1.1.32. Relationship between the Producer Price, the Price of Value-Added and the Price of Intermediate Inputs for Non-farming Agricultural and Other Sectors
A1.2. Trade Block
A1.2.1. Import Demand in Armington Function
A1.2.2. Domestic Product Demand in Armington Function
A1.2.3. Zero-profit Condition in Armington Function
A1.2.4. Export Demand in CET Function
A1.2.5. Domestic Product Demand in CET Function
A1.2.6. Zero-profit Condition in CET Function
A1.2.7. Import Price
A1.2.8. Export Price
A1.3. Blocks of Households and Enterprise
A1.3.1. Household Consumption
A1.3.2. Initial Utility Level of Households
A1.3.3. Proposed Change in Utility Level of Households
A1.3.4. Initial Level of Equivalent Variation Level
A1.3.5. Proposed Change in the Level of Equivalent Variation
A1.3.6. Equivalent Variation to Measure the Welfare Changing of Households
A1.3.7. Income of Households and Enterprise
A1.3.8. Savings of Household and Enterprise
A1.4. Saving/Investment
A1.4.1. Total Saving
A1.4.2. Sectoral Investment of Bank
A1.5. Government Block
A1.5.1. Government Saving
A1.5.2. Interest Payments to Government
A1.5.3. Total Subsidy for Irrigation Water
A1.5.4. Government Consumption
A1.5.5. Total Tax Revenue
A1.6. Market Condition
A1.6.1. Consumer Price Index
A1.6.2. Non-agricultural Labor Markets
A1.6.3. Agricultural Labor Markets of 16 Provinces
A1.6.4. Capital Markets
A1.6.5. Cropland Markets of 16 Provinces
A1.6.6. Irrigation Markets of 16 Provinces
A1.6.7. Commodity Markets except Pipe Water
A1.6.8. Commodity Markets of Pipe Water
A1.6.9. Balance of International Payments
A1.6.10. Nominal Gross Domestic Products (NGDP)
A1.6.11. Real Gross Domestic Products (RGDP)
A2. Model Variables
A2.1. Sets
| sec | Activities and commodities |
| prov | 16 provinces |
| agc: agcsec | Agricultural sectors including farming and non-farming |
| cro: crosec; croagc | Farming sectors |
| ncro: ncrosec; ncroagc | Non-farming agricultural sectors |
| ncpinse: ncpinsesec | Non-farming agricultural, construction, industrial and service sectors |
| inse: insesec; insencpinse | Construction, industrial and service sectors |
| nwa: nwasec | Non-water sectors |
| insd | Domestic institutions including government, enterprise and households |
| insdng: insdnginsd | Domestic institutions except government |
| hou: houinsdng | Urban and rural households |
A2.2. Variables
| PK | Return to capital |
| Wage rate of composite labor | |
| Wage rate of composite agricultural labor | |
| Wage rate of provincial agricultural labor | |
| PLE | Wage rate of non-agricultural labor (fixed as the numeraire) |
| Return to cropland of 16 provinces | |
| Irrigation water price of 16 provinces | |
| Price of composite water of “Other provinces” | |
| Price of provincial land-water bundle of 16 provinces | |
| Price of land-water bundle | |
| Price level of value-added | |
| Price level of composite demand of water and value-added | |
| Price level of domestic sales of composite commodities | |
| Price level of domestic output of firm | |
| Price of domestic output delivered to home market | |
| Import price with tariffs in local currency | |
| Price of exports in local currency | |
| PCINDEX | Consumer price index (commodities) |
| ER | Exchange rate (RMB against U.S. dollar) |
| Domestic sales of composite commodity | |
| Gross domestic production (output) level firm | |
| Domestic production delivered to home markets | |
| Export demand | |
| Import demand | |
| Capital demand | |
| Composite labor demand | |
| Composite agricultural labor demand | |
| Non-agricultural labor demand | |
| Agricultural labor demand at provincial level | |
| Pipe water demand | |
| Cropland demand of farming sectors of 16 provinces | |
| Irrigation demand of farming sectors of 16 provinces | |
| Composite water demand of “Other provinces” for farming sector | |
| Demand of provincial land-water bundle of 16 provinces | |
| Demand of land-water bundle | |
| Value-added demand | |
| Composite demand of pipe water and value-added | |
| Intermediate input demand | |
| Consumer households’ demand for commodities and leisure | |
| Government commodity demand | |
| Proposed change in utility level of households | |
| Proposed change in the level of equivalent variation | |
| Equivalent variation to measure the welfare changing of households | |
| Investment demand | |
| Interests payment to government | |
| TAXR | Total tax revenue of government |
| TSDWR | Total subsidies on irrigation water |
| Households and enterprise savings | |
| Income level of households and enterprise | |
| NGDP | Nominal gross domestic products of macro economy |
| RGDP | Real gross domestic products of macro economy |
| Supply of provincial irrigation water of 16 provinces (exogenous) | |
| Domestic cropland endowment of 16 provinces (exogenous) | |
| Transfers between institutions (exogenous) | |
| SF | Foreign savings (exogenous) |
| Total non-agricultural labor supply (exogenous) | |
| Total agricultural labor supply of 16 provinces (exogenous) | |
| Total capital supply (exogenous) | |
| Initial world price level of exports (exogenous) | |
| Initial world price level of exports (exogenous) | |
| Net revenue of factor from foreign market (exogenous) | |
| KSRW | Foreign capital demand in local current (exogenous) |
| RGF | Foreign revenue of government (exogenous) |
| EGF | Foreign expenditure of government (exogenous) |
| Initial households’ consumer demand for commodities and leisure (exogenous) | |
| Initial utility level of households (exogenous) | |
| Initial level of equivalent variation (exogenous) | |
| Initial price level of domestic sales of composite commodities (exogenous) | |
| Initial import price with tariffs in local currency (exogenous) | |
| Initial Price of exports in local currency (exogenous) |
A2.3. Parameters
| Elasticity of substitution between cropland and irrigation water of 16 provinces | |
| Efficiency parameter for land-water bundle of 16 provinces | |
| CES distribution parameter for land-water bundle of 16 provinces | |
| Elasticity of substitution between agricultural and non-agricultural labor | |
| Substitution elasticity of Armington function | |
| Substitution elasticity of CET function | |
| CES distribution parameter for composite labor | |
| CES distribution parameter for Armington function | |
| CES distribution parameter for CET function | |
| Cobb-Douglas power of provincial water-land bundle of 16 provinces | |
| Cobb-Douglas power of provincial agricultural labor of 16 provinces | |
| Cobb-Douglas power of composite labor in value-added bundle | |
| Cobb-Douglas power of capital in value-added bundle | |
| Cobb-Douglas power of composite land-water in value-added bundle | |
| Scale parameter for composite provincial water-land bundle | |
| Efficiency parameter for provincial agricultural labor | |
| Elasticity of substitution between the pipe water and irrigation water of “Other provinces” | |
| CES distribution parameter for the pipe water and irrigation water of “Other provinces” | |
| Efficiency parameter for the pipe water and irrigation water of “Other provinces” | |
| Elasticity of substitution between the pipe water and value-added | |
| CES distribution parameter for the pipe water and value-added | |
| Efficiency parameter for the pipe water and value-added | |
| Efficiency parameter for composite labor | |
| Efficiency parameter for value-added bundle | |
| Elasticity of substitution between capital and non-agricultural labor | |
| CES distribution parameter for the capital and non-agricultural labor | |
| Efficiency parameter for the capital and non-agricultural labor | |
| Efficiency parameter of Armington function of commodity | |
| Efficiency parameter of CET function of commodity | |
| Technical coefficients of Leontief function for value-added | |
| Technical coefficients of Leontief function | |
| Power in nested-ELES household utility function | |
| Domestic institutions’ marginal propensity to save | |
| mpg | Government's marginal propensity to save |
| Tax rate on domestic institution’s income including households and enterprise | |
| Tariff rate for each import | |
| Subsidy rates for irrigation waterof 16 provinces | |
| Cobb-Douglas power in the bank’s utility function | |
| Net production tax on value-added | |
| Cobb-Douglas power of the government utility function (commodities) | |
| Cobb-Douglas power of the interests payment of government |
References
- Mu, J.; Khan, S.; Hanjra, M.A.; Wang, H. A food security approach to analyse irrigation efficiency improvement demands at the country level. Irrig. Drain. 2009, 58, 1–16. [Google Scholar] [CrossRef]
- Parry, M.L. (Ed.) Climate Change 2007: Impacts, Adaptation and Vulnerability: Working Group II Contribution to the Fourth Assessment Report of the IPCC Intergovernmental Panel on Climate Change; Cambridge University Press: Cambridge, UK, 2007; Volume 4.
- Tao, F.; Yokozawa, M.; Xu, Y.; Hayashi, Y.; Zhang, Z. Climate changes and trends in phenology and yields of field crops in China, 1981–2000. Agric. For. Meteorol. 2006, 138, 82–92. [Google Scholar] [CrossRef]
- Zhai, P.; Sun, A.; Ren, F.; Liu, X.; Gao, B.; Zhang, Q. Changes of climate extremes in China. Climatic Chang. 1999, 42, 203–218. [Google Scholar] [CrossRef]
- Kendy, E.; Wang, J.; Molden, D.J.; Zheng, C.; Liu, C.; Steenhuis, T.S. Can urbanization solve inter-sector water conflicts? Insight from a case study in Hebei Province, North China Plain. Water Policy 2007, 9, 75–93. [Google Scholar] [CrossRef]
- National Bureau of Statistics of China (NBSC). China Statistic Yearbook 2012; China Statistics Press: Beijing, China, 2012. [Google Scholar]
- Wu, P.; Jin, J.; Zhao, X. Impact of climate change and irrigation technology advancement on agricultural water use in China. Clim. Chang. 2010, 100, 797–805. [Google Scholar] [CrossRef]
- Wei, X.; Declan, C.; Erda, L.; Yinlong, X.; Hui, J.; Jinhe, J.; Ian, H.; Yan, L. Future cereal production in China: The interaction of climate change, water availability and socio-economic scenarios. Glob. Environ. Chang. 2009, 19, 34–44. [Google Scholar] [CrossRef]
- Webber, M.; Barnett, J.; Finlayson, B.; Wang, M. Pricing China’s irrigation water. Glob. Environ. Chang. 2008, 18, 617–625. [Google Scholar] [CrossRef]
- Lohmar, B.; Wang, J.; Rozelle, S.; Huang, J.; Dawe, D. China’s Agricultural Water Policy Reforms: Increasing Investment, Resolving Conflicts, and Revising Incentives; No. 33643; United States Department of Agriculture, Economic Research Service: Washington, DC, USA, 2003. [Google Scholar]
- Pearce, D.; Markandya, A. Marginal opportunity cost as a planning concept in natural resource management. Ann. Reg. Sci. 1987, 21, 18–32. [Google Scholar] [CrossRef]
- World Bank. Water Supply Pricing in China: Economic Efficiency, Environment, and Social Affordability, World Bank Analytical and Advisory Assistance (AAA) program China: Addressing Water Scarcity—From Analysis to Action Policy Note; Report No. 42176; World Bank: Washington, DC, USA, 2007. [Google Scholar]
- Xie, J. Addressing China’s Water Scarcity: Recommendations for Selected Water Resource Management Issues; World Bank-free PDF: Washington, DC, USA, 2009. [Google Scholar]
- Nitikin, D.; Shen, C.; Wang, J.Q.; Zou, H.F. Water Service Delivery Reform in China: Safeguarding the Interests of the Poor. Ann. Econ. Financ. 2012, 13, 471–495. [Google Scholar]
- National Bureau of Statistics of China (NBSC). China Rural Statistical Yearbook 2000-2002; China Statistics Press: Beijing, China, 2000–2002. [Google Scholar]
- Center for International Earth Science Information Network, Socioeconomic Data and Applications Center (CIESIN and SEDAC). Variable Definition Overview. In Agriculture Statistics of People’s Republic of China: 1949–1990; CIESIN and SEDAC: Palisades, NY, USA, 1997–2009. [Google Scholar]
- National Development and Reform Commission of China (NDRCC). National Agricultural Production Cost and Revenue Information Summary 2008; China Statistics Press: Beijing, China, 2008. [Google Scholar]
- National Bureau of Statistics of China (NBSC). Input-Output Tables of China 2007; China Statistics Press: Beijing, China, 2009. [Google Scholar]
- National Bureau of Statistics of China (NBSC). China Regional Input-Output Tables 2007; China Statistics Press: Beijing, China, 2011. [Google Scholar]
- National Bureau of Statistics of China and National Bureau of Environmental Protection of China (NBSC & NBEPC). China Statistic Yearbook on Environment 2008; China Statistics Press: Beijing, China, 2008. [Google Scholar]
- Zhao, Y.; Wang, J.F.; Cai, H.J. Review of CGE models on water resources. Adv. Water Sci. 2008, 5, 756–762. [Google Scholar]
- Chou, C.E.; Hsu, S.H.; Huang, C.H.; Li, P.; Tseng, C.-M. Water right fee and green tax reform— A computable general equilibrium analysis. In Proceedings of the 4th Annual Conference on Global Economic Analysis, Purden University, West Lafayette, IN, USA, 27–29 June 2001; Available online: https://www.gtap.agecon.purdue.edu/resources/download/432.pdf (accessed on 24 March 2015).
- Calzadilla, A.; Rehdanz, K.; Tol, R.S. Water Scarcity and the Impact of Improved Irrigation Management: A CGE Analysis (No. 1436); Kiel Working Paper; Kiel Institute: Kiel, Germany, 2008. [Google Scholar]
- Calzadilla, A.; Rehdanz, K.; Tol, R.S. The GTAP-W Model: Accounting for Water Use in Agriculture (No. 1745); Kiel Working Papers; Kiel Institute: Kiel, Germany, 2011. [Google Scholar]
- Dixon, P.B.; Rimmer, M.T.; Wittwer, G. Saving the South Murray-Darling Basin: The economic effects of a buyback of irrigation water. Econ. Rec. 2011, 87, 153–168. [Google Scholar] [CrossRef]
- Wittwer, G.; Dixon, J. Upgrading Irrigation Infrastructure in the Murray-Darling Basin: Is it Worth It? Monash University, Centre of Policy Studies and the Impact Project: Melbourne, Australia, 2012. [Google Scholar]
- Diao, X.; Roe, T. Can a water market avert the “double-whammy” of trade reform and lead to a “win–win” outcome? J. Environ. Econ. Manag. 2003, 45, 708–723. [Google Scholar] [CrossRef]
- Gómez, C.M.; Tirado, D.; Rey-Maquieira, J. Water exchanges versus water works: Insights from a computable general equilibrium model for the Balearic Islands. Water Resour. Res. 2004, 40, 1–11. [Google Scholar] [CrossRef]
- Horridge, M.; Madden, J.; Wittwer, G. The impact of the 2002–2003 drought on Australia. J. Policy Model. 2005, 27, 285–308. [Google Scholar] [CrossRef]
- Watson, P.S.; Davies, S. Modeling the effects of population growth on water resources: A CGE analysis of the South Platte River Basin in Colorado. Ann. Reg. Sci. 2011, 46, 331–348. [Google Scholar] [CrossRef]
- Shen, D.J.; Liang, R.J.; Wang, H.; Yang, X.L. Water Price: Theory and Practice; Science Press: Beijing, China, 1999. [Google Scholar]
- Ma, M. The Impact Study of Water Shortage on Economy: A CGE Modeling Approach. Ph.D. Thesis, Institute of Geographic Sciences and Natural Resources Research, Chinese Academy of Sciences, Beijing, China, 2001. [Google Scholar]
- Li, C.Y.; Wang, H.M.; Tong, J.P.; Liu, S. Water resource policy simulation and analysis in Jiangxi province based on CGE model. Resour. Sci. 2014, 36, 84–93. [Google Scholar]
- Wang, Y.; Xiao, H.L.; Zou, S.B.; Li, C.Z.; Ren, J.; Lu, M.F. Study and simulation on water resources regulation in Zhangye city based on CGE model. J. Nat. Resour. 2010, 25, 959–966. [Google Scholar]
- Liu, T.T.; Zhang, L.L. Impacts of change in water price on sectoral prices of national economy Based on CGE Model. J. Econ. Water Resour. 2013, 3, 40–53. [Google Scholar]
- Berrittella, M.; Rehdanz, K.; Tol, R.S. The Economic Impact of the South-North Water Transfer Project in China: A Computable General Equilibrium Analysis; FEEM Working Paper No. 154.06; FEEM: Milan, Italy, 2006; Available online: http://papers.ssrn.com/sol3/papers.cfm?abstract_id=952938 (accessed on 6 December 2013).
- Feng, S.; Li, L.X.; Duan, Z.G.; Zhang, J.L. Assessing the impacts of South-to-North Water Transfer Project with decision support systems. Decis. Support Syst. 2007, 42, 1989–2003. [Google Scholar] [CrossRef]
- Yu, H.W.; Shen, D.J. Application and outlook of CGE model in water resources. J. Nat. Resour. 2014, 29, 1626–1636. [Google Scholar]
- Ge, J.; Tokunaga, S. Impacts of expanding non-grain based fuel ethanol on regional equality in China: Using a computable general equilibrium model. Stud. Reg. Sci. 2011, 41, 883–896. [Google Scholar] [CrossRef]
- Zhong, S.; Okiyama, M.; Tokunaga, S. Impact of natural hazards on agricultural economy and food production in China: Based on a general equilibrium analysis. J. Sustain. Dev. 2014, 7, 45–69. [Google Scholar] [CrossRef]
- Akune, Y.; Okiyama, M.; Tokunaga, S. Applied general equilibrium model using for the elimination of the tariffs of agricultural products in Japan. In Proceedings of the 48th Annual Meeting of the Japan Section of the RSAI, Wakayama, Japan, 8–10 October 2011.
- Okiyama, M.; Tokunaga, S. Impact of expanding bio-fuel consumption on household income of farmers in Thailand: Utilizing the computable general equilibrium Model. Rev. Urban Reg. Dev. Stud. 2010, 22, 109–142. [Google Scholar] [CrossRef]
- Tokunaga, S.; Resosudarmo, B.P.; Wuryanto, L.E.; Dung, N.T. An inter-regional CGE model to assess the impacts of tariff reduction and fiscal decentralization on regional economy: The case of Indonesia. Stud. Reg. Sci. 2003, 33, 1–25. [Google Scholar] [CrossRef]
- Hosoe, N.; Gasawa, K.; Hashimoto, H. Textbook of Computable General Equilibrium Modeling: Programming and Simulations; Palgrave Macmillan: London, UK, 2010. [Google Scholar]
- Ge, J.; Lei, Y.; Tokunaga, S. Non-Grain fuel ethanol expansion and its effects on food security: A computable general equilibrium analysis for China. Energy 2014, 65, 346–356. [Google Scholar] [CrossRef]
- Zhao, Y.; Wang, J. CGE Model and Its Applications in Economic Analysis; China Economic Press: Beijing, China, 2008. [Google Scholar]
- Zhai, F.; Hertel, T. Impacts of the DDA on China: The role of labor markets and complementary education reforms. In Poverty and the WTO: Impact of the Doha Development Agenda; Palgrave Macmillan: London, UK; World Bank: Washington, DC, USA, 2005; pp. 285–318. [Google Scholar]
- Willenbockel, D. Structural effects of a real exchange rate revaluation in China: A CGE assessment. 2006. Available online: http://dx.doi.org/10.2139/ssrn.945562 (accessed on 18 June 2013).
- Yang, H.; Zhang, X.; Zehnder, A.J. Water scarcity, pricing mechanism and institutional reform in northern China irrigated agriculture. Agric. Water Manag. 2003, 61, 143–161. [Google Scholar] [CrossRef]
- Han, H.Y.; Zhao, L.G. The impact of water pricing policy on local environment-an analysis of three irrigation districts in China. Agric. Sci. China 2007, 6, 1472–1478. [Google Scholar] [CrossRef]
- Armington, P. A theory of demand for products distinguished by place of production. IMF Staff Pap. 1969, 16, 159–178. [Google Scholar] [CrossRef]
- National Bureau of Statistics of China (NBSC). China Agricultural Yearbook: 2008; China Statistics Press: Beijing, China, 2008. [Google Scholar]
- National Bureau of Statistics of China (NBSC). China Agricultural Yearbook: 2001; China Statistics Press: Beijing, China, 2001. [Google Scholar]
- The Ministry of Water Resources of China [MWRC]. In China Water Resources Bulletin 2000; Beijing, China, 2000. Available online: http://www.mwr.gov.cn/zwzc/hygb/szygb/qgszygb/200001/t20000101_29449.html (accessed on 30 October 2013).
- Simelton, E.; Fraser, E.D.G.; Termansen, M.; Forster, P.M.; Dougill, A.J. Typologies of crop-drought vulnerability: An empirical analysis of the socio-economic factors that influence the sensitivity and resilience to drought of three major food crops in China (1961–2001). Environ. Sci. Policy 2009, 12, 438–452. [Google Scholar] [CrossRef]
© 2015 by the authors; licensee MDPI, Basel, Switzerland. This article is an open access article distributed under the terms and conditions of the Creative Commons Attribution license (http://creativecommons.org/licenses/by/4.0/).
Share and Cite
Zhong, S.; Shen, L.; Sha, J.; Okiyama, M.; Tokunaga, S.; Liu, L.; Yan, J. Assessing the Water Parallel Pricing System against Drought in China: A Study Based on a CGE Model with Multi-Provincial Irrigation Water. Water 2015, 7, 3431-3465. https://doi.org/10.3390/w7073431
Zhong S, Shen L, Sha J, Okiyama M, Tokunaga S, Liu L, Yan J. Assessing the Water Parallel Pricing System against Drought in China: A Study Based on a CGE Model with Multi-Provincial Irrigation Water. Water. 2015; 7(7):3431-3465. https://doi.org/10.3390/w7073431
Chicago/Turabian StyleZhong, Shuai, Lei Shen, Jinghua Sha, Mitsuru Okiyama, Suminori Tokunaga, Litao Liu, and Jingjing Yan. 2015. "Assessing the Water Parallel Pricing System against Drought in China: A Study Based on a CGE Model with Multi-Provincial Irrigation Water" Water 7, no. 7: 3431-3465. https://doi.org/10.3390/w7073431
APA StyleZhong, S., Shen, L., Sha, J., Okiyama, M., Tokunaga, S., Liu, L., & Yan, J. (2015). Assessing the Water Parallel Pricing System against Drought in China: A Study Based on a CGE Model with Multi-Provincial Irrigation Water. Water, 7(7), 3431-3465. https://doi.org/10.3390/w7073431