
Spatiotemporal Analysis of Extreme Hourly Precipitation Patterns in Hainan Island, South China


Abstract
:1. Introduction
2. Study Area and Datasets
2.1. Study Area
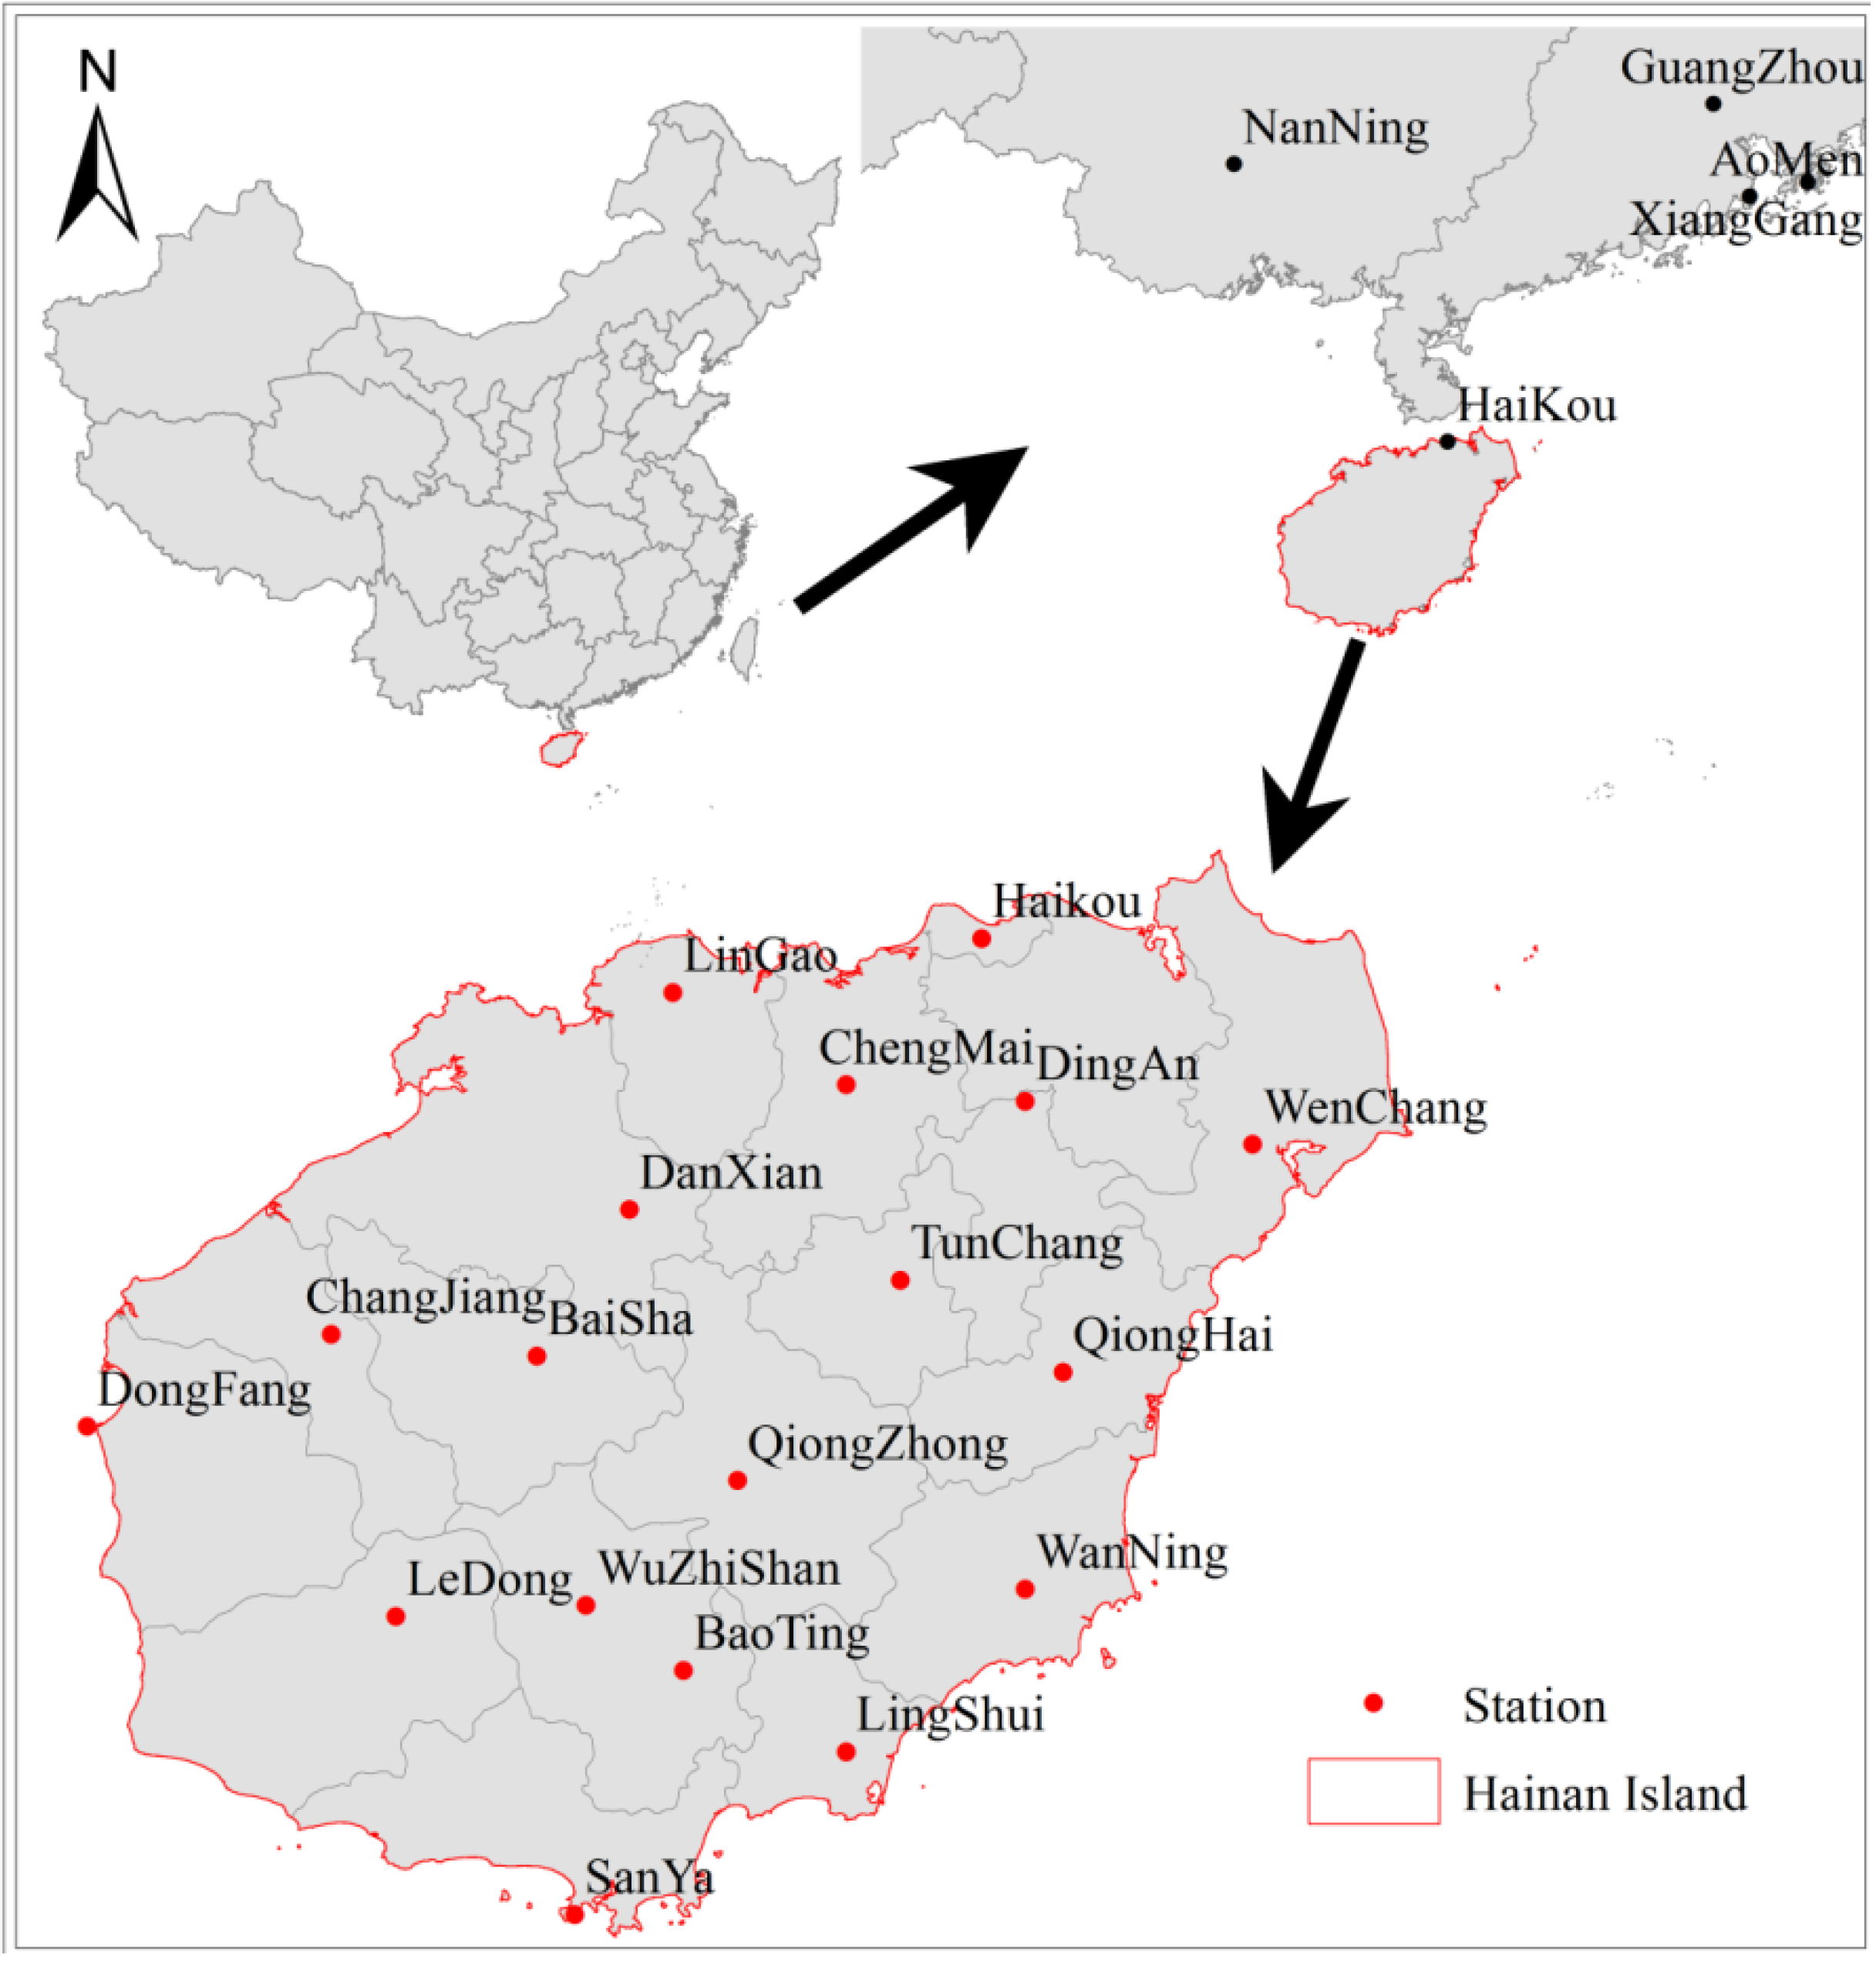
2.2. Datasets

| Station Name | Abbreviation | Longitude (°) | Latitude (°) | Elevation (m) |
|---|---|---|---|---|
| Baisha | BS | 19.23 | 109.43 | 215.6 |
| Baoting | BT | 18.65 | 109.7 | 68.6 |
| Changjiang | CJ | 19.27 | 109.05 | 98.1 |
| Chengmai | CM | 19.73 | 110 | 31.4 |
| Danzhou | DZ | 19.52 | 109.58 | 169 |
| Dingan | DA | 19.7 | 110.33 | 24.2 |
| Dongfang | DF | 19.1 | 108.62 | 7.6 |
| Ledong | LD | 18.75 | 109.17 | 155 |
| Lingao | LG | 19.9 | 109.68 | 31 |
| Lingshui | LS | 18.5 | 110.03 | 13.9 |
| Qionghai | QH | 19.23 | 110.47 | 24 |
| Qiongzhong | QZ | 19.03 | 109.83 | 250.9 |
| Sanya | SY | 18.22 | 109.58 | 419.4 |
| Tunchang | TC | 19.37 | 110.1 | 118.3 |
| Wanning | WN | 18.8 | 110.33 | 39.9 |
| Wenchang | WC | 19.62 | 110.75 | 21.7 |
| Wuzhishan | WZS | 18.77 | 109.52 | 328.5 |
| Haikou | HK | 20 | 110.25 | 63.5 |
3. Methods
3.1. Precipitation Concentration Indices (PCI)

3.2. Extreme Precipitation Indices
| Index | Definition | Unit |
|---|---|---|
| FQ 90 | Frequency of precipitation greater than the 90th percentile threshold value during the flood season | h |
| FQ 95 | Frequency of precipitation greater than the 95th percentile threshold value during the flood season | h |
| FQ 97.5 | Frequency of precipitation greater than the 97.5th percentile threshold value during the flood season | h |
| TP 90 | Total amounts of precipitation greater than the 90th percentile threshold value during the flood season | mm |
| TP 95 | Total amounts of precipitation greater than the 95th percentile threshold value during the flood season | mm |
| TP 97.5 | Total amounts of precipitation greater than the 97.5th percentile threshold value during the flood season | mm |
| Max 1 h | Largest hourly precipitation during the flood season | mm |
| Max 3 h | Largest continuous 3-h precipitation during the flood season | mm |
| Max 6 h | Largest continuous 5-h precipitation during the flood season | mm |
| FQ 20 mm | Frequency of hourly precipitation during the flood season greater than 20 mm | h |
| FQ 30 mm | Frequency of hourly precipitation during the flood season greater than 30mm | h |
3.3. Principal Component Analysis (PCA)
| Correlation Coefficient | FQ 90 | FQ 95 | FQ 97.5 | TP 90 | TP 95 | TP 97.5 | Max 1 h | Max 3 h | Max 6 h | FQ 20 mm | FQ 30 mm |
|---|---|---|---|---|---|---|---|---|---|---|---|
| FQ 90 | 1.000 | -- | -- | -- | -- | -- | -- | -- | -- | -- | -- |
| FQ 95 | 0.942 | 1.000 | -- | -- | -- | -- | -- | -- | -- | -- | -- |
| FQ 97.5 | 0.857 | 0.858 | 1.000 | -- | -- | -- | -- | -- | -- | -- | -- |
| TP 90 | 0.946 | 0.913 | 0.930 | 1.000 | -- | -- | -- | -- | -- | -- | -- |
| TP 95 | 0.908 | 0.923 | 0.934 | 0.988 | 1.000 | -- | -- | -- | -- | -- | -- |
| TP 97.5 | 0.810 | 0.788 | 0.949 | 0.948 | 0.956 | 1.000 | -- | -- | -- | -- | -- |
| Max 1 h | 0.732 | 0.668 | 0.702 | 0.829 | 0.806 | 0.805 | 1.000 | -- | -- | -- | -- |
| Max 3 h | 0.728 | 0.629 | 0.806 | 0.822 | 0.790 | 0.852 | 0.817 | 1.000 | -- | -- | -- |
| Max 6 h | 0.698 | 0.580 | 0.750 | 0.772 | 0.732 | 0.791 | 0.650 | 0.923 | 1.000 | -- | -- |
| FQ 20 mm | 0.816 | 0.806 | 0.922 | 0.918 | 0.927 | 0.944 | 0.697 | 0.826 | 0.777 | 1.000 | -- |
| FQ 30 mm | 0.580 | 0.558 | 0.608 | 0.762 | 0.783 | 0.808 | 0.748 | 0.698 | 0.661 | 0.788 | 1.000 |
| EPI | FQ 90 | FQ 95 | FQ 97.5 | TP 90 | TP 95 | TP 97.5 | Max 1 h | Max 3 h | Max 6 h | FQ 20 mm | FQ 30 mm |
|---|---|---|---|---|---|---|---|---|---|---|---|
| Loading | 0.907 | 0.873 | 0.938 | 0.987 | 0.979 | 0.969 | 0.845 | 0.889 | 0.833 | 0.946 | 0.798 |
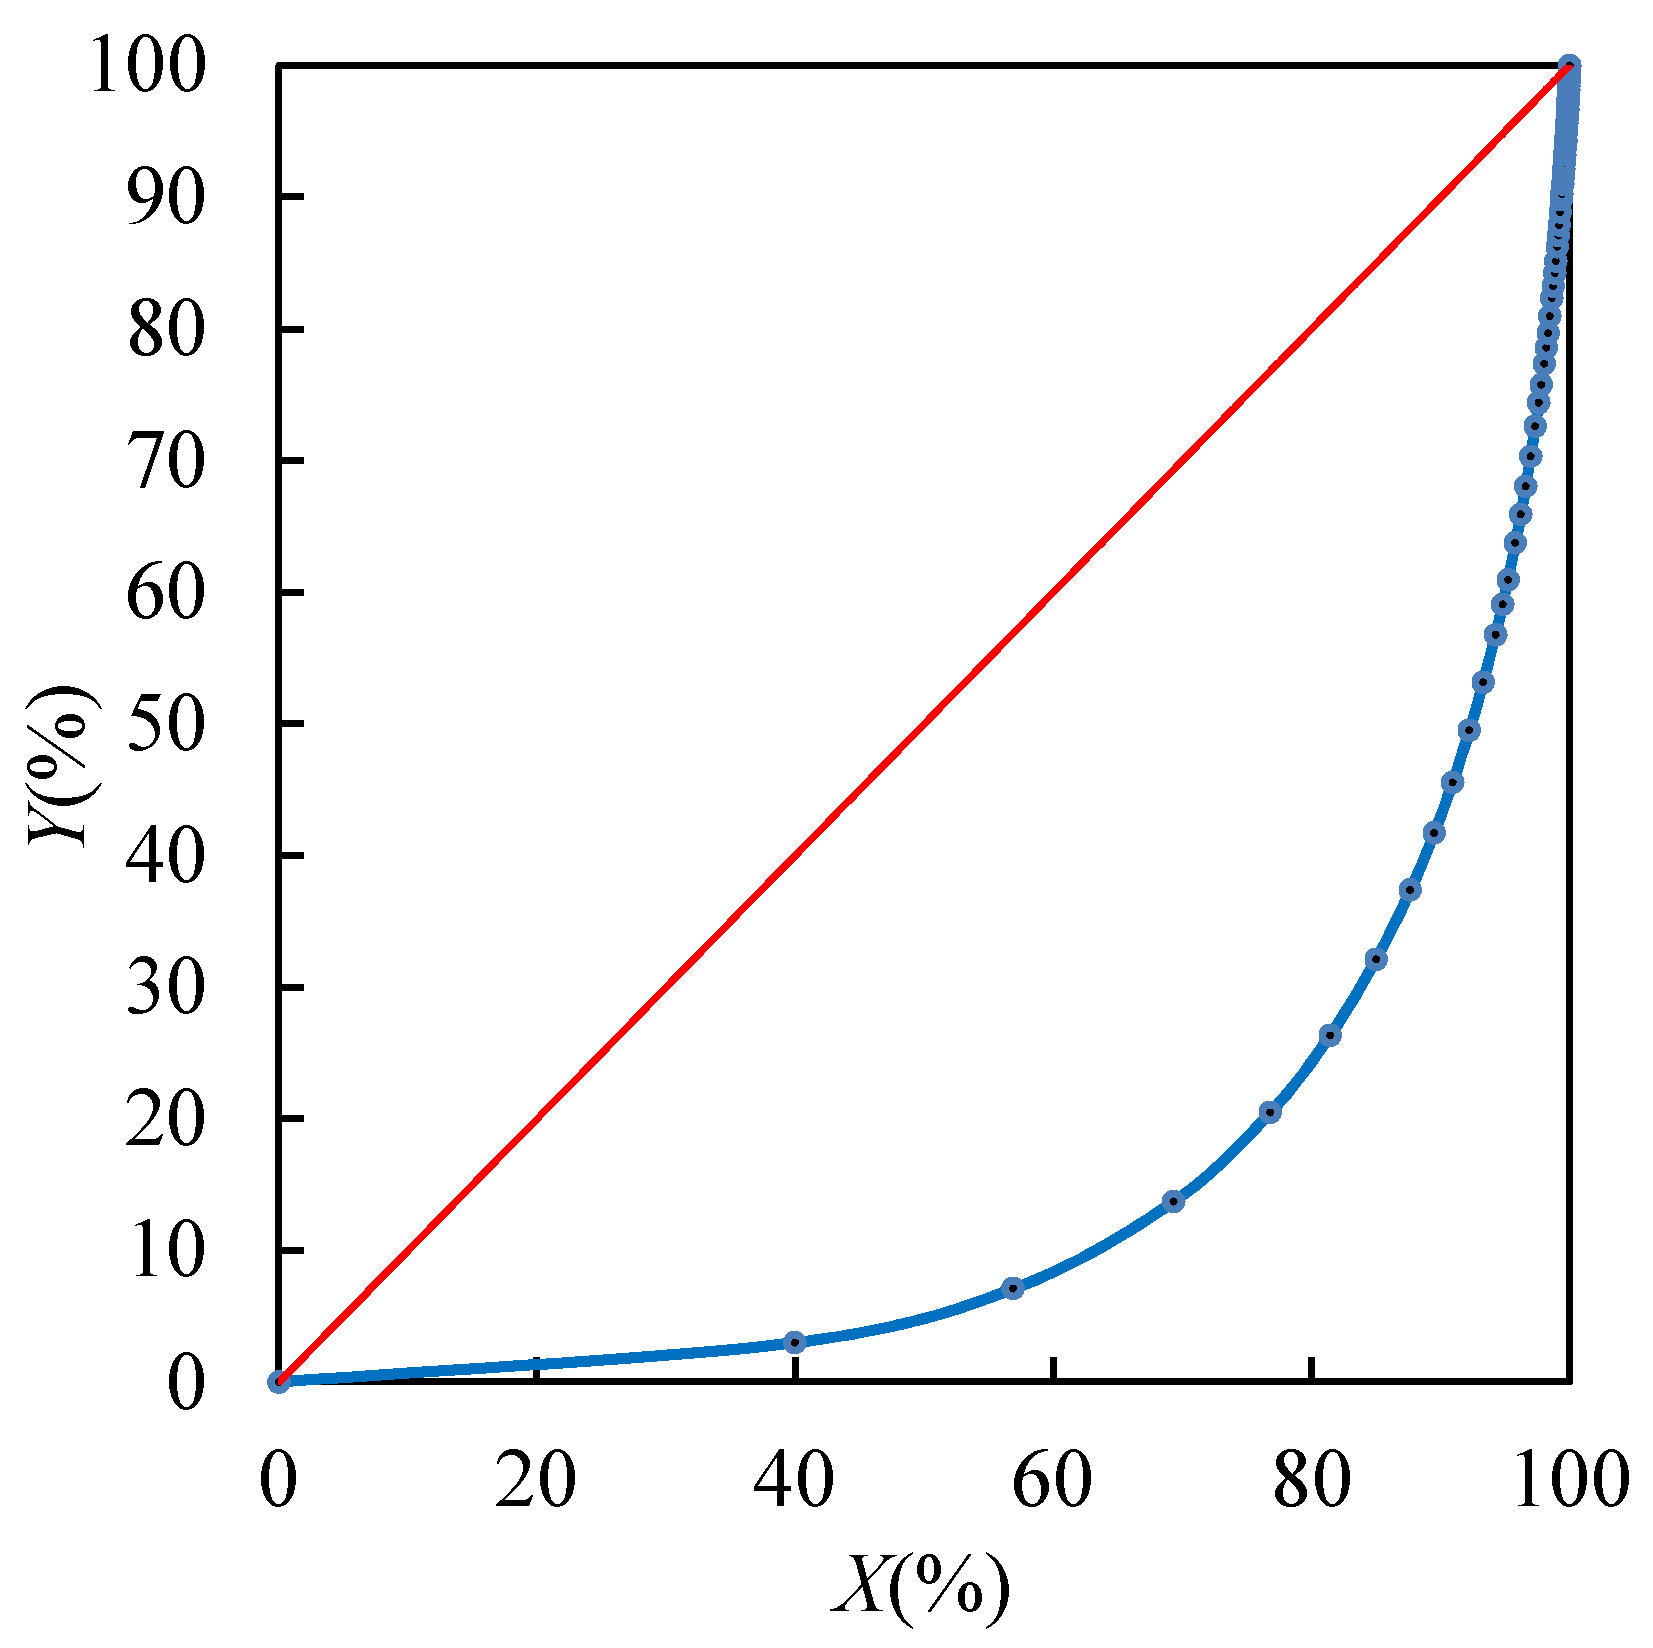
3.4. Stability Test
4. Results and Discussion
4.1. Spatial Pattern of PCI for 1967–2012
4.1.1. PCI1
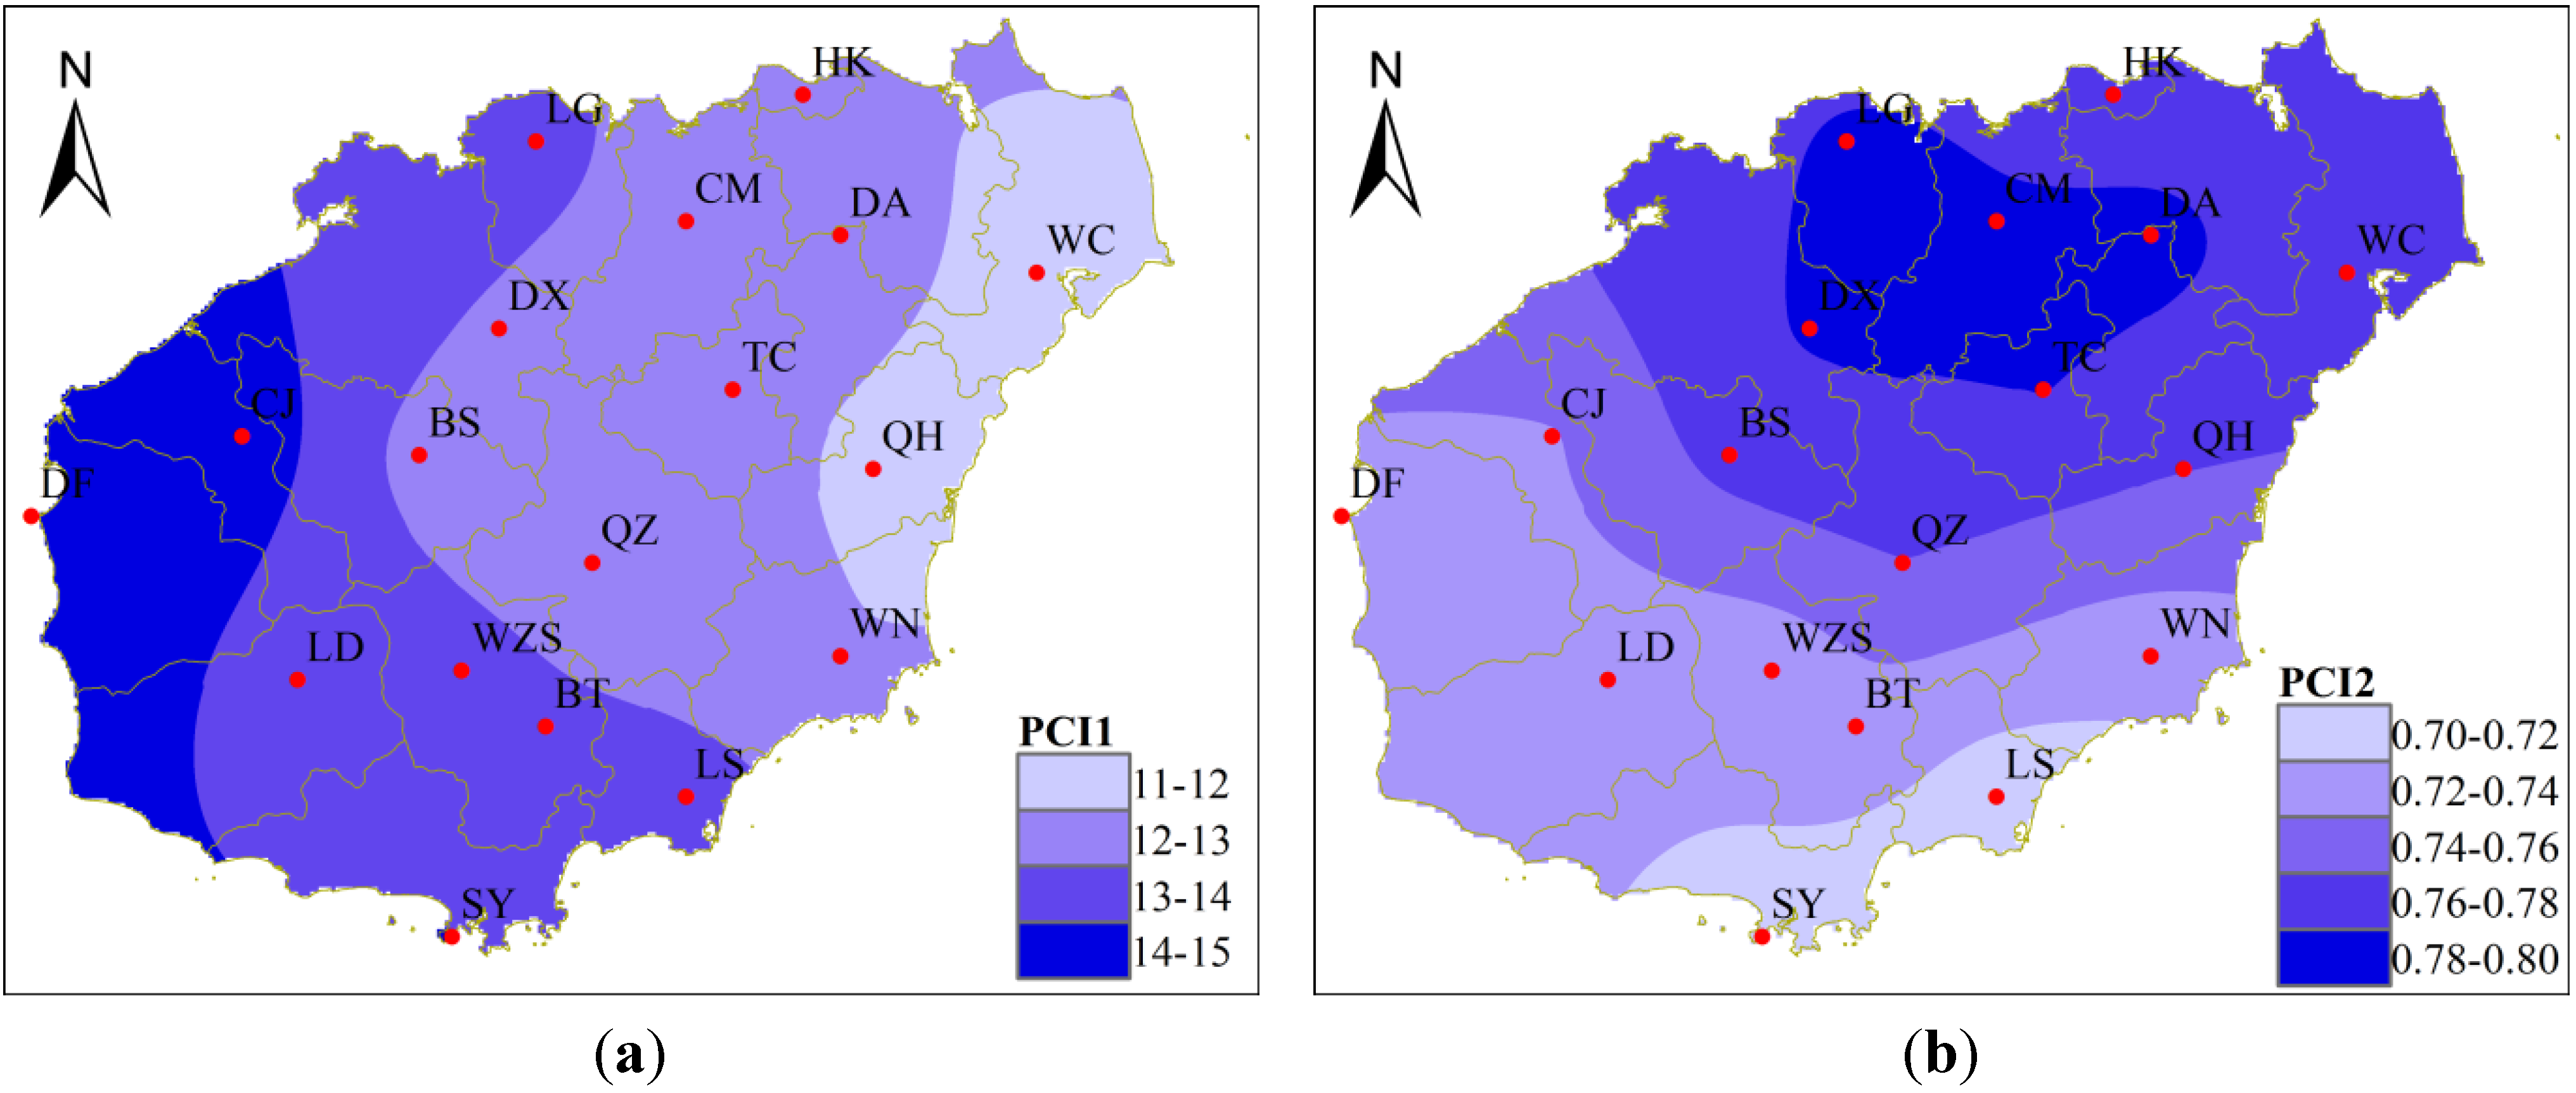
4.1.2. PCI2
4.2. Extreme Precipitation Indices (EPI) Trends
4.2.1. Statistical Trends
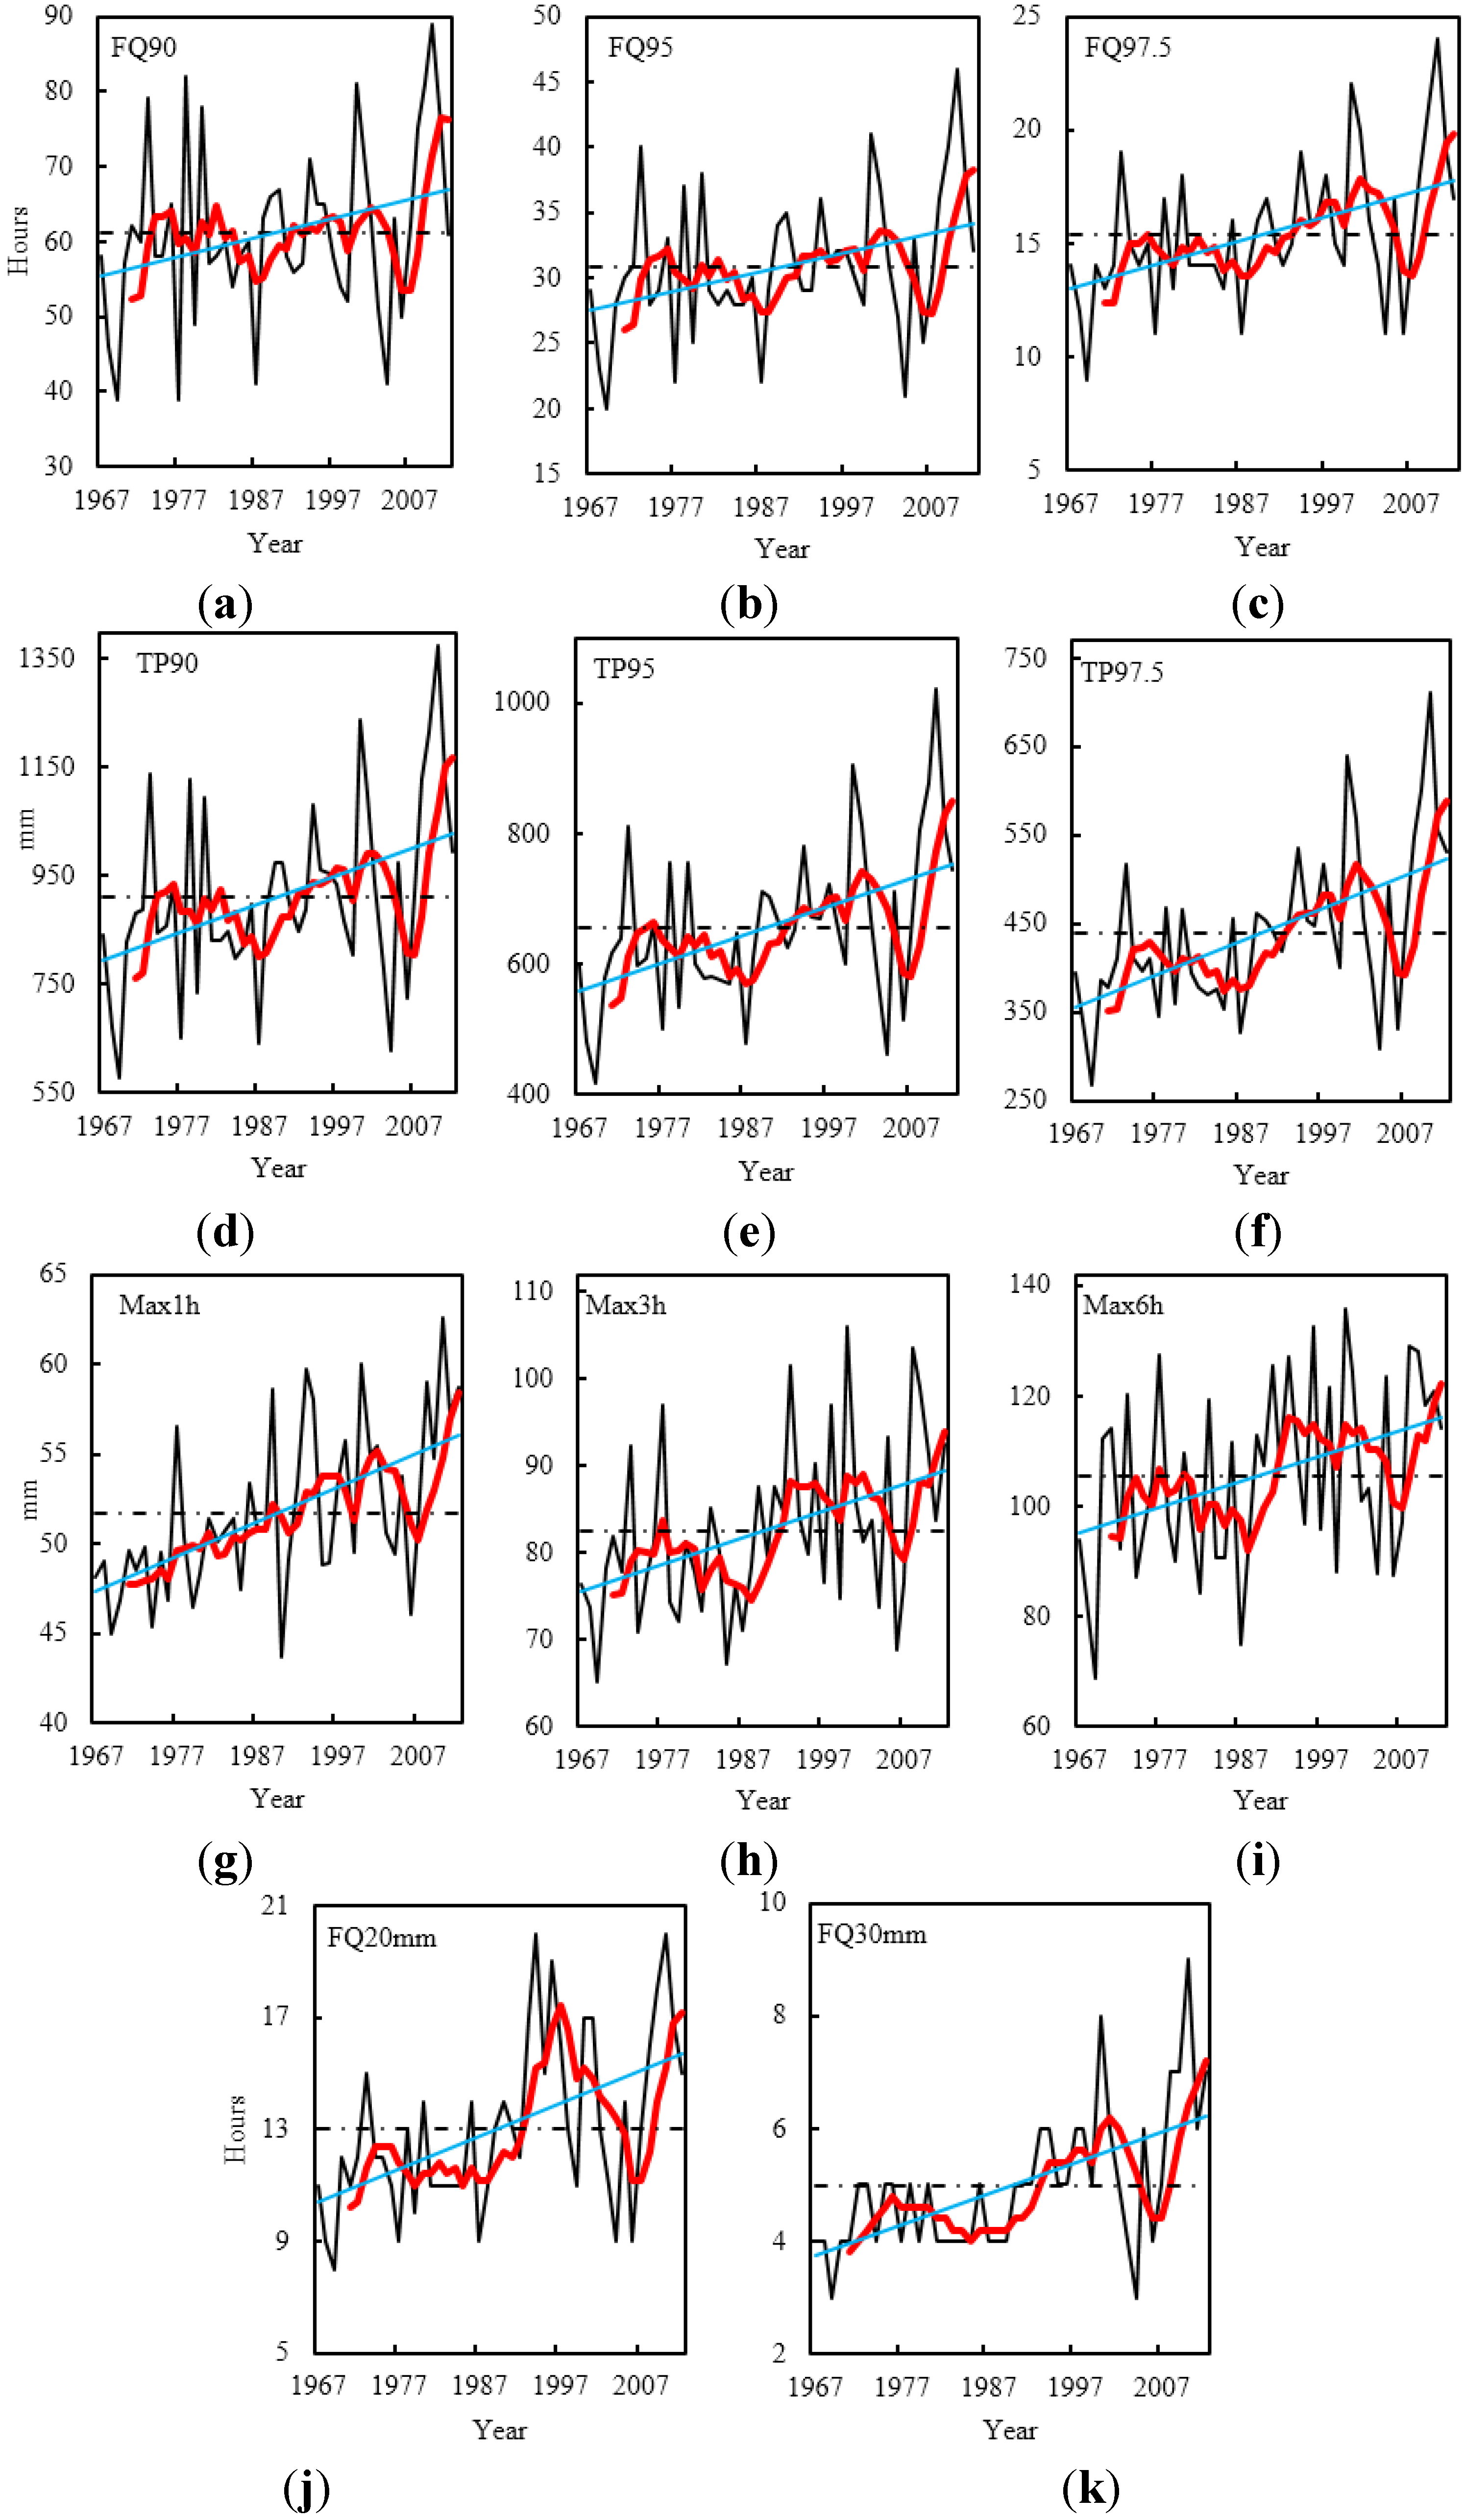
4.2.2. Trend Significance
| EPI | FQ 90 | FQ 95 | FQ 97.5 | TP 90 | TP 95 | TP 97.5 | Max 1 h | Max 3 h | Max 6 h | FQ 20 mm |
|---|---|---|---|---|---|---|---|---|---|---|
| Z value | 1.79 * | 2.49 ** | 3.31 *** | 2.84 *** | 3.26 *** | 3.60 *** | 4.07 *** | 2.78 *** | 2.36 ** | 3.42 *** |
| Statistical trends | Sut | Sut | Sut | Sut | Sut | Sut | Sut | Sut | Sut | Sut |
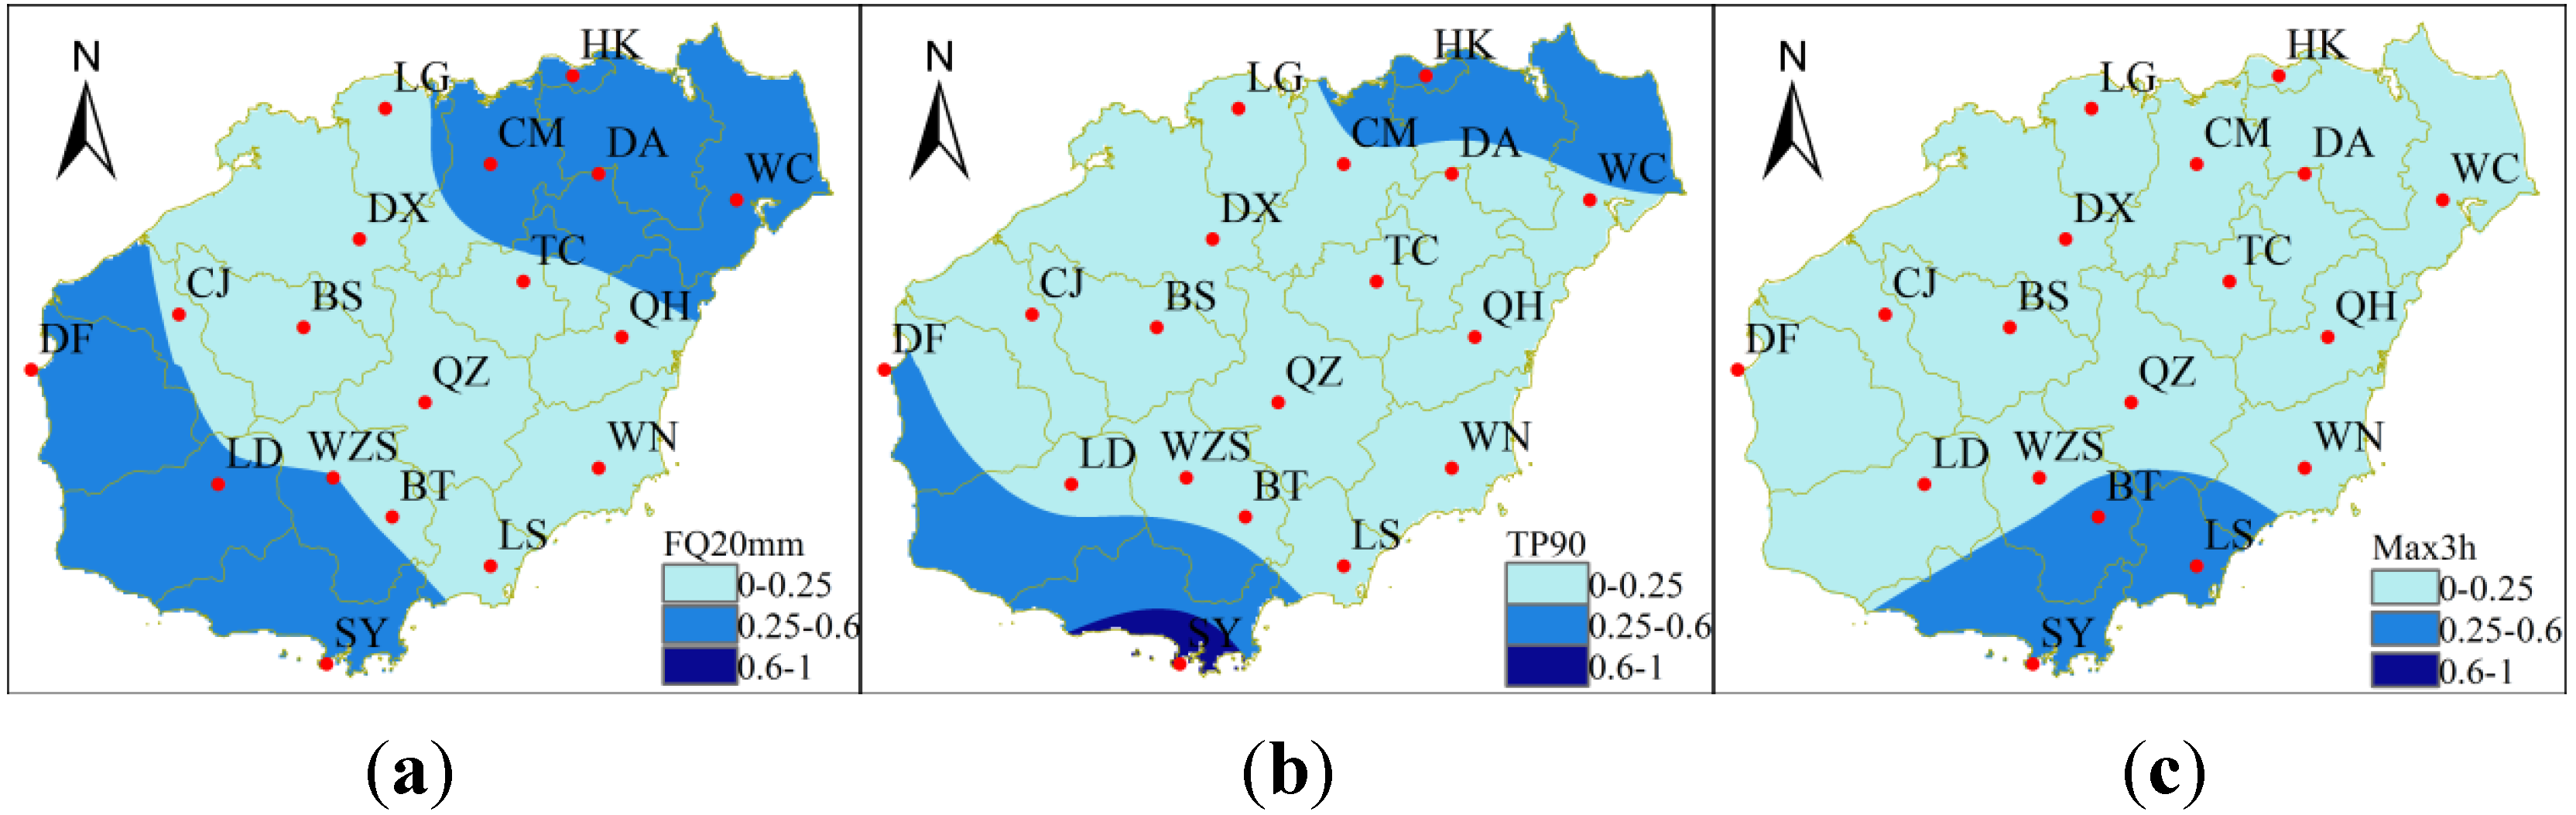
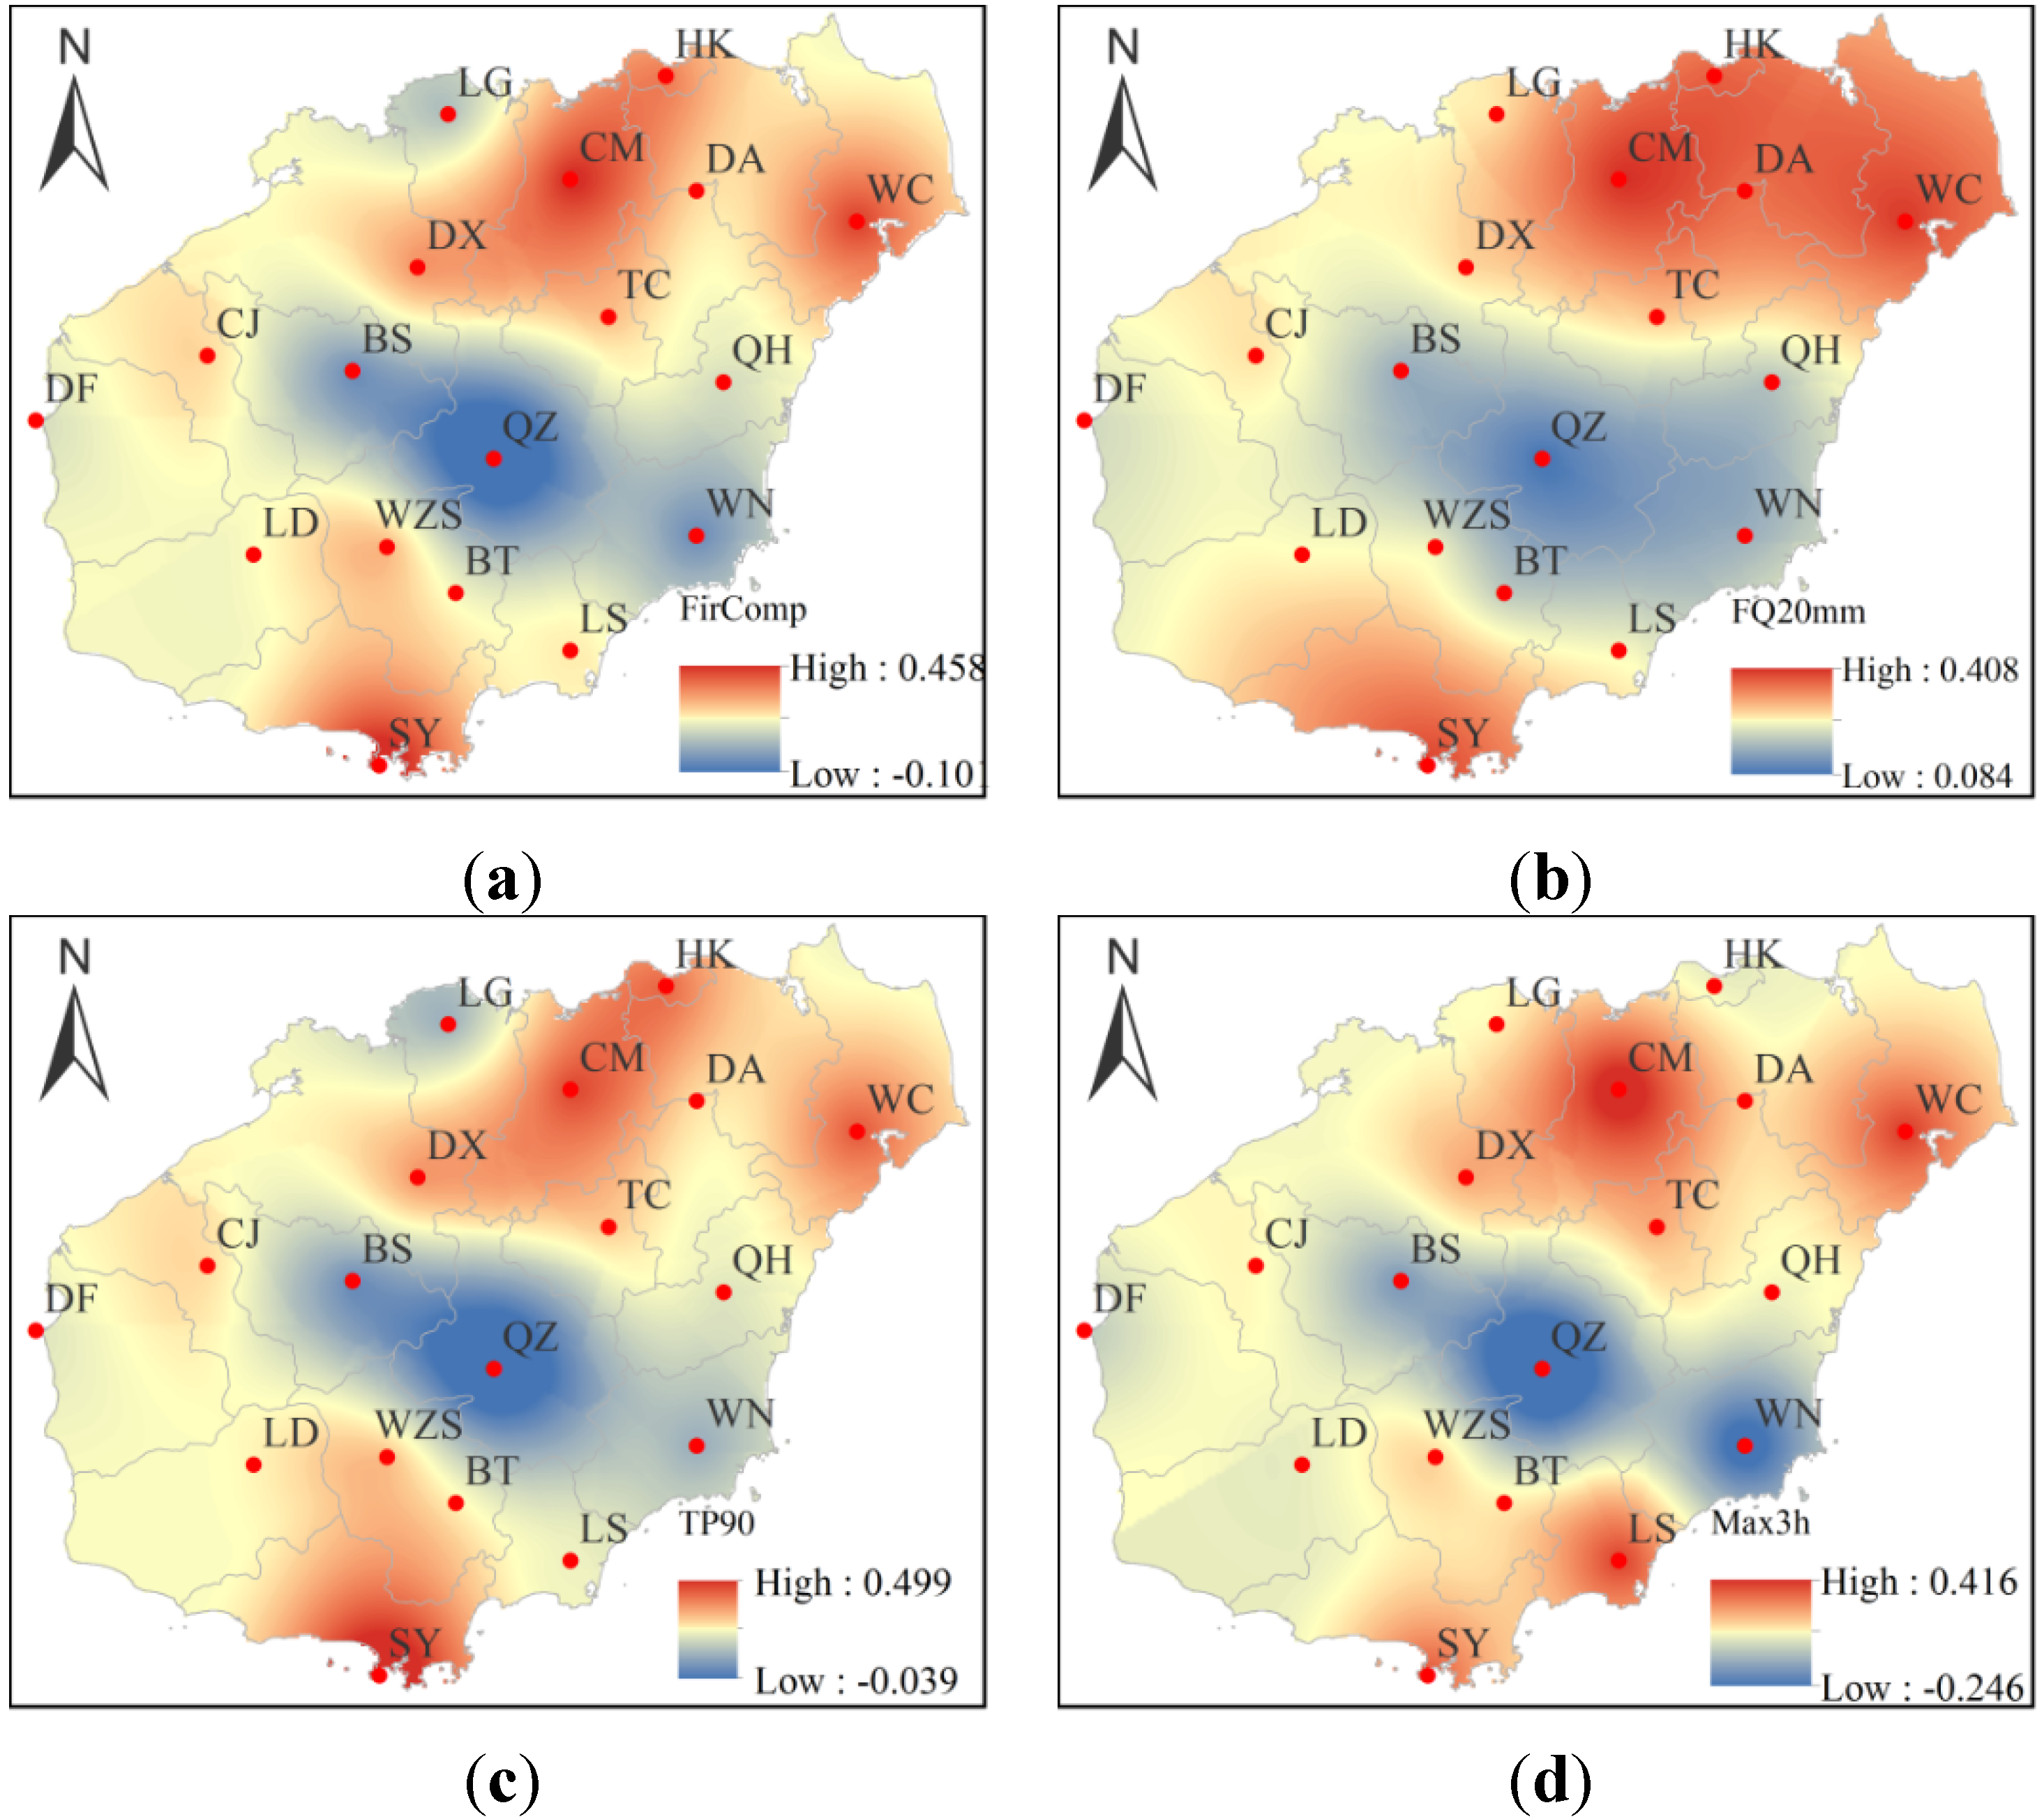
4.3. Spatial Patterns of the Trends
4.4. Trend Stability

5. Conclusions
Acknowledgments
Author Contributions
Conflicts of Interest
References
- Working Group I Contribution to the Fifth Assessment Report of the Intergovernmental Panel on Climate Change. Available online: http://www.ipcc.ch/pdf/assessment-report/ar5/wg1/WG1AR5_Frontmatter_FINAL.pdf (accessed on 12 May 2015).
- Keggenhoff, I.; Elizbarashvili, M.; Amiri-Farahani, A.; King, L. Trends in daily temperature and precipitation extremes over Georgia, 1971–2010. Weather Clim. Extrem. 2014, 4, 75–85. [Google Scholar]
- Huang, J.; Sun, S.L.; Xue, Y.; Zhang, J.C. Spatial and temporal variability of precipitation indices during 1961–2010 in Hunan province, Central South China. Theor. Appl. Climatol. 2014, 118, 581–595. [Google Scholar] [CrossRef]
- Sen Roy, S.; Balling, R.C. Trends in extreme daily precipitation indices in India. Int. J. Climatol. 2004, 24, 457–466. [Google Scholar]
- Beck, F.; Bárdossy, A.; Seidel, J.; Müller, T.; Fernandez Sanchis, E.; Hauser, A. Statistical analysis of sub-daily precipitation extremes in Singapore. J. Hydrol. Reg. Stud. 2015, 3, 337–358. [Google Scholar] [CrossRef]
- RClimDex. Available online: http://etccdi.pacificclimate.org/software.shtml (accessed on 17 November 2013).
- Oliver, J.E. Monthly precipitation distribution: A comparative index. Prof. Geogr. 1980, 32, 300–309. [Google Scholar] [CrossRef]
- Martin-Vide, J. Spatial distribution of a daily precipitation concentration index in peninsular Spain. Int. J. Climatol. 2004, 24, 959–971. [Google Scholar] [CrossRef]
- Haylock, M.R.; Goodess, C.M. Interannual variability of European extreme winter rainfall and links with mean large-scale circulation. Int. J. Climatol. 2004, 24, 759–776. [Google Scholar] [CrossRef]
- Sen Roy, S.; Rouault, M. Spatial patterns of seasonal scale trends in extreme hourly precipitation in South Africa. Appl. Geogr. 2013, 39, 151–157. [Google Scholar] [CrossRef]
- Mann, H.B. Non-parametric tests against trend. Econometrica 1945, 13, 245–259. [Google Scholar] [CrossRef]
- Kendall, M.G. Rank Correlation Methods, 4th ed.; Charles Griffin: London, UK, 1975. [Google Scholar]
- Wan, L.; Zhang, X.P.; Ma, Q.; Zhang, J.J.; Ma, T.Y.; Sun, Y.P. Spatiotemporal characteristics of precipitation and extreme events on the loess plateau of china between 1957 and 2009. Hydrol. Process. 2014, 28, 4971–4983. [Google Scholar] [CrossRef]
- Bocchiola, D. Long term (1921–2011) hydrological regime of alpine catchments in northern Italy. Adv. Water Resour. 2014, 70, 51–64. [Google Scholar] [CrossRef]
- Taxak, A.K.; Murumkar, A.R.; Arya, D.S. Long term spatial and temporal rainfall trends and homogeneity analysis in wainganga basin, Central India. Weather Clim. Extrem. 2014, 4, 50–61. [Google Scholar] [CrossRef]
- Anghileri, D.; Pianosi, F.; Soncini-Sessa, R. Trend detection in seasonal data: From hydrology to water resources. J. Hydrol. 2014, 511, 171–179. [Google Scholar] [CrossRef]
- Lupikasza, E. Spatial and temporal variability of extreme precipitation in Poland in the period 1951–2006. Int. J. Climatol. 2010, 30, 991–1007. [Google Scholar]
- Hidalgo-Munoz, J.M.; Argueso, D.; Gamiz-Fortis, S.R.; Esteban-Parra, M.J.; Castro-Diez, Y. Trends of extreme precipitation and associated synoptic patterns over the Southern Iberian Peninsula. J. Hydrol. 2011, 409, 497–511. [Google Scholar] [CrossRef]
- Zhang, Q.; Xu, C.Y.; Gemmer, M.; Chen, Y.D.; Liu, C.L. Changing properties of precipitation concentration in the pearl river basin, China. Stoch. Environ. Res. Risk A 2009, 23, 377–385. [Google Scholar] [CrossRef]
- Chi, Y.; Zhang, C.; Liang, C.; Wu, H. The precipitation change in eastern forest regions of China in recent 50 years. Acta Ecol. Sin. 2013, 33, 217–226. [Google Scholar] [CrossRef]
- Gocic, M.; Trajkovic, S. Analysis of precipitation and drought data in Serbia over the period 1980–2010. J. Hydrol. 2013, 494, 32–42. [Google Scholar] [CrossRef]
- Shinjiro Kanae, T.O.; Akira, K. Changes in hourly heavy precipitation at Tokyo from 1890 to 1999. J. Meteorol. Soc. Jpn. 2004, 82, 241–247. [Google Scholar] [CrossRef]
- Zhu, J. 80 Year oscillation of summer rainfall over North China and East Asian summer monsoon. Geophys. Res. Lett. 2002, 29. [Google Scholar] [CrossRef]
- Minobe, S. A 50–70 year climatic oscillation over the north pacific and North America. Geophys. Res. Lett. 1997, 24, 683–686. [Google Scholar] [CrossRef]
- Sen Roy, S. A spatial analysis of extreme hourly precipitation patterns in India. Int. J. Climatol. 2009, 29, 345–355. [Google Scholar] [CrossRef]
- Zhang, K.; Pan, S.; Cao, L.; Wang, Y.; Zhao, Y.; Zhang, W. Spatial distribution and temporal trends in precipitation extremes over the hengduan mountains region, china, from 1961 to 2012. Quat. Int. 2014, 349, 346–356. [Google Scholar] [CrossRef]
- Chen, F.; Chen, H.; Yang, Y. Annual and seasonal changes in means and extreme events of precipitation and their connection to elevation over Yunnan province, China. Quat. Int. 2015, in press. [Google Scholar]
- Wu, C.H.; Huang, G.R.; Yu, H.J.; Chen, Z.Q.; Ma, J.G. Spatial and temporal distributions of trends in climate extremes of the feilaixia catchment in the upstream area of the Beijiang river basin, South China. Int. J. Climatol. 2014, 34, 3161–3178. [Google Scholar] [CrossRef]
- Wu, Y.J.; Wu, S.G.; Zhai, P.M. The impact of tropical cyclones on Hainan Island’s extreme and total precipitation. Int. J. Climatol. 2007, 27, 1059–1064. [Google Scholar] [CrossRef]
© 2015 by the authors; licensee MDPI, Basel, Switzerland. This article is an open access article distributed under the terms and conditions of the Creative Commons Attribution license (http://creativecommons.org/licenses/by/4.0/).
Share and Cite
Chen, W.; Chen, C.; Li, L.; Xing, L.; Huang, G.; Wu, C. Spatiotemporal Analysis of Extreme Hourly Precipitation Patterns in Hainan Island, South China. Water 2015, 7, 2239-2253. https://doi.org/10.3390/w7052239
Chen W, Chen C, Li L, Xing L, Huang G, Wu C. Spatiotemporal Analysis of Extreme Hourly Precipitation Patterns in Hainan Island, South China. Water. 2015; 7(5):2239-2253. https://doi.org/10.3390/w7052239
Chicago/Turabian StyleChen, Wenjie, Chenghao Chen, Longbing Li, Litao Xing, Guoru Huang, and Chuanhao Wu. 2015. "Spatiotemporal Analysis of Extreme Hourly Precipitation Patterns in Hainan Island, South China" Water 7, no. 5: 2239-2253. https://doi.org/10.3390/w7052239
APA StyleChen, W., Chen, C., Li, L., Xing, L., Huang, G., & Wu, C. (2015). Spatiotemporal Analysis of Extreme Hourly Precipitation Patterns in Hainan Island, South China. Water, 7(5), 2239-2253. https://doi.org/10.3390/w7052239