Abstract
The use of contaminated surface water continues to be a pressing issue in areas of the world where people lack improved drinking water sources. In northern coastal Ecuador, many communities rely on untreated surface water as their primary source of drinking water. We undertook a study to explore how microscale river hydrodynamics affect microbial water quality at community water collection locations at three rivers with varying stream velocity and turbidity profiles. To examine how the distance from river shore and physiochemical water quality variables affect microbial contamination levels in the rivers; we collected a total of 355 water samples within six villages on three rivers; and tested for Escherichia coli concentrations using the IDEXX Quanti-tray method. We found that log10 E. coli concentrations decreased with increasing distance from shore (β = −0.017; p = 0.003). Water in the main channel had E. coli concentrations on average 0.12 log10 lower than within eddies along the river shore and 0.27 log10 lower between the sample closest to shore and any sample >6 m from the shore. Higher E. coli concentrations were also significantly associated with increased turbidity (β = 0.003; p < 0.0001) and decreased dissolved oxygen levels (β = −0.310; p < 0.0001). The results of this study can help inform community members about the safest locations to collect drinking water and also provide information on watershed scale transport of microbial contaminants between villages.
1. Introduction
Diarrhea is the fourth leading cause of mortality around the world, killing approximately 1.4–1.9 million people in 2010 [1,2]. The use of contaminated water continues to be a pressing issue in developing countries; approximately 1.8 billion people globally use a source of drinking water which suffers from fecal contamination [3] and 187 million people rely on untreated surface water [4]. Much of this water is consumed without adequate treatment.
Higher concentrations of microbial contaminants in surface water occur at locations near human populations, at observed at points of municipal sewage discharge [5], as well as at areas of activities such as bathing or washing [6]. Limited freshwater resources force many to use and reuse water sources, and in developing countries this contamination of water sources may lead to human exposure through washing/bathing or consumption of untreated water (e.g., [6,7,8]).
The effect of oxygenation and other physiochemical parameters on the die-off of fecal indicators has been extensively studied under laboratory environments; but there is limited research on how far contamination plumes reach within surface sources of drinking water, and what roles velocity, oxygenation, and other physiochemical characteristics of water have on die-off of microorganisms in natural environments. More work has been done on temporal [9,10,11] and spatial variability [11,12,13] in coastal environments than on streams [14], especially in tropical settings [15]. Understanding the impact of these factors on localized contamination processes in regions where people depend on untreated surface sources of drinking water may provide insights that can be used to improve water collection practices.
In this study, we explore these issues through a consideration of the spatial variability of microbial contamination on three different rivers of the Esmeraldas Province in northern coastal Ecuador. In this region, most human activities occur on the riverbanks, and contaminated water recirculates in eddies close to shore. The primary goal of this study was to understand how localized stream hydrodynamics, such as velocity of the channel, presence of eddies along the shore, and physiochemical parameters of the water, affect the microbiological quality of surface sources of drinking water. We tested the extent to which microbial contamination changes with increasing distance from shore (moving towards the central flow of a river), presence of turbulent eddies, and physiochemical parameters of water quality.
2. Materials and Methods
2.1. Study Region
This study was carried out in northern coastal Ecuador, in Esmeraldas Province, in association with a larger study on diarrheal disease transmission that has been ongoing since 2003 [16]. In this region, 125 villages line the banks of the Santiago, Onzole, and Cayapas Rivers. Household surveys that we previously conducted found that approximately 68% relied on untreated surface water as their primary source of drinking water [17], and on average 29% of households report treating their drinking water. Villagers also routinely access the river for bathing, washing and recreation, and only 46% of households report access to improved sanitation [18]. Through these human activities, the rivers become contaminated with fecal material.
Our investigation took place in six villages along three different rivers in the region. These three rivers represented a gradient of riverine conditions: the Santiago River has fast-flowing water, bedrock substrate, and clear waters; the Cayapas River has intermediate conditions; and the Onzole River has slow-flowing water, muddy substrate, and, is highly turbid. The structure and cultures of the human communities living along the three rivers are similar.
2.2. Study Design
In each community, we identified two to three locations where villagers wash clothes and dishes, bathe, and collect water for drinking and household purposes. The majority of sites were located at the base of community stairways, which serve as river access points. At each river access site, we established a transect perpendicular to the shoreline, along which we collected six point samples, both within eddies (recirculating water near the shoreline) and outside of eddies, in the main stream channel (Figure 1). Eddies and eddy boundaries were determined by visual assessment. Samples were collected by boat, and distance from shore was measured using a Yardage Pro range-finder (Bushnell, Overland Park, KS, USA). Distances were validated by checking the range finder’s value three to four times before a point sample was collected.
In locations where there was an eddy along the shore at the sampling site, samples were taken 2 m apart within the eddy for the width of the eddy, and the remaining samples were taken 2 m apart beyond the eddy line (n = 156). If the eddy size was wider than 6 m, three samples were taken within the eddy, each 2 m apart, and three beyond the eddy, each line 2 m apart; in this case a gap existed between the last eddy sample and first sample outside of the eddy (n = 120). In locations with no flow (i.e., no distinguishable eddy), all six samples were taken 2 m apart (n = 18). If the eddy size was less than 6 m, one or two samples were taken 2 m apart within the eddy, and the remaining outside the eddy (n = 48). The sampling design is shown in Figure 1.
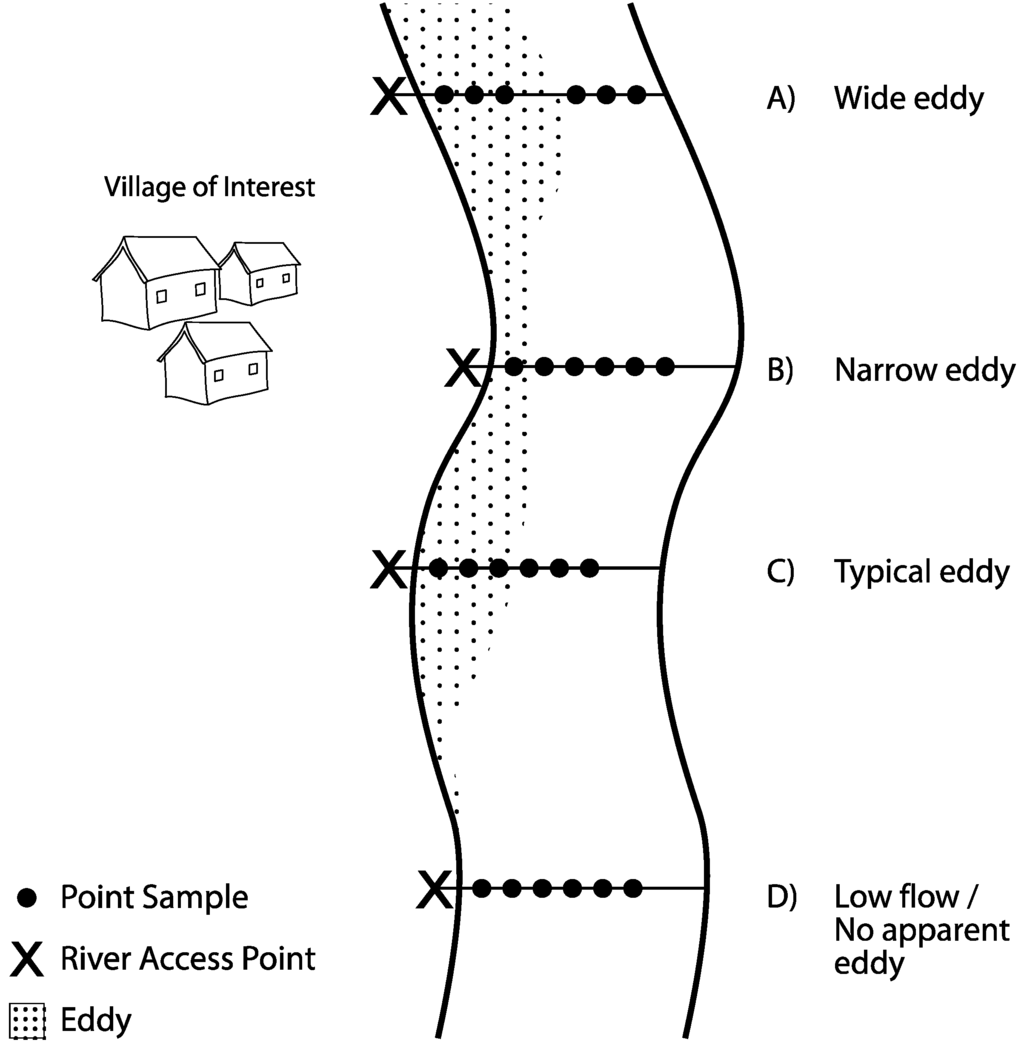
Figure 1.
Field sampling schematic. At each village of interest, we sampled at sites along the banks of the river where the population accesses the river. We established river transects perpendicular to the river bank and took samples 2 m apart either within or outside of the eddy. Four different situations occurred, depending on the geometry of the river: (A) Wide eddy: when the eddy was >6 m wide, we took three samples within the eddy (each collected 2 m apart) and three samples outside of the eddy (each collected 2 m apart), with a gap between the third and fourth sample; (B) Narrow eddy: If the eddy was <6 m wide, we took as many samples as possible from within the eddy and the remainder outside of the eddy, with all samples collected 2 m apart; (C) Typical eddy: If the eddy was 6 m, we took three samples from within and three samples outside of the eddy, with all samples collected 2 m apart; (D) No apparent eddy: If there was no apparent eddy due to low flow, all samples were collected 2 m apart.
2.3. Water Sample Characterization
Samples were collected during three field visits over 24 sampling days between 5 June and 19 July 2012. Water samples were collected between 10:00 and 11:00 am in Whirl-Pak bags (Nasco, Fort Atkinson, WI, USA), stored on ice, and tested for Escherichia coli within 6–8 h of collection using the IDEXX Quanti-tray most probable number (MPN) method (IDEXX, Westbrook, ME, USA). A negative control sample was also processed every day using sterilized water. Trays were incubated at 41 ± 3 °C for 18–24 h in a small portable incubator (Boekel, Feasterville, PA, USA). When centralized energy was not available, a generator was used to maintain power. On one day, voltage in the community was too low (<220 V) for the sealer to turn on, so a conventional iron was used to seal the trays, ensuring that all wells contained sample water (n = 18 samples). If turbidity levels were visibly high, we performed a 1:10 dilution by using syringes to extract 10 mL of the river water sample and adding to 90 mL of sterile water, in order to avoid plates with values too numerous to count (TNTC).
Physiochemical water quality measurements were also taken at the time of water sample collection. All probes were calibrated before each field visit. Temperature (°C) and pH were measured using a waterproof handheld device (Hannah Instruments, Woonsocket, RI, USA). Turbidity (Nephelometric Turbidity Units; NTU) was measured using a Hach 2100Q turbidimeter (Hach Company, Loveland, CO, USA). Dissolved Oxygen (DO2; ppm) was measured using a YSI handheld probe (YSI Inc., Yellow Springs, OH, USA). Instantaneous velocity was measured with a Flow Probe (Global Water Instrumentation Inc., Model FP111, College Station, TX, USA).
2.4. Statistical Analysis
Data analysis was conducted using SAS v9.3 (Cary, NC, USA), and graphics were produced in STATA v12 (College Station, TX, USA). A total of 332/355 (93.5%) samples fell within a countable E. coli range. Twelve (3.4%) samples were above the detection limit and treated as the maximum countable 2419.6 MPN/100 mL. Eleven samples (3.1%) were under the detection limit and treated as 0.5 MPN/100 mL, halfway between 0 and the lower detection limit of 1 MPN/100 mL. All E. coli concentrations were log10-transformed for analysis.
Simple linear regression and scatter plots were used to evaluate univariate relationships of water quality parameters (turbidity, stream velocity, temperature, and DO2) and distance from shore versus the continuous outcome variable of log10 E. coli concentration. Additionally, a correlated linear mixed modeling process was carried out, using an autoregressive (AR1) correlation structure, with transect defined as the cluster variable and included as a random intercept. This approach takes into account both autocorrelation by transect, and serial correlation by sampling day along each transect. Log10 concentration of E. coli was the primary outcome, distance from shore was the primary exposure variable, and temperature, DO2, turbidity, dichotomized velocity (>0 vs. 0 m/s), and the interactions of each of these variables with distance from shore were evaluated as potential confounders. Collinearity between the variables was assessed using a collinearity macro [19,20], and variables were removed sequentially if the condition index was above 30 and at least two proportions of variance, not including the intercept, was above 0.5. Interaction terms were evaluated by comparing the full model with all interaction terms included to the reduced model without any interaction terms, and backwards elimination was used on the full model to remove non-significant terms (i.e., p > 0.05). Confounding was assessed using the all-possible subsets approach by comparing the point estimates from this model to a reduced model without the variable of interest. If the estimate for the reduced model differed by 10% from the full model, then the variable was retained in the model.
3. Results and Discussion
3.1. River Characteristics
Water quality river parameters are summarized by river and village in Table 1. While there is variability in the measurements, relative to the other rivers, the Santiago is generally characterized as fast-flowing water with high DO2 levels and low E. coli concentrations, whereas the Onzole has slow-moving water with low DO2 levels and high E. coli concentrations. The Cayapas is intermediate for all parameters except turbidity, which is lower than the Santiago. The temperatures of the Santiago and Cayapas are similar, with both running cooler than the Onzole. The Onzole has far higher turbidity levels than either of the other rivers. Villages on the same river share similar characteristics, with no statistically significant differences from one another for any of the parameters considered.

Table 1.
Summary of water quality river parameters by river and village.
| River/Village | Geometric Mean E. coli Concentration (MPN/100 mL) | Median River Width (m) | Mean Temperature (°C) | Median Velocity (m/s) | Mean Dissolved Oxygen (ppm) | Median Turbidity (NTU) | Total # Samples |
|---|---|---|---|---|---|---|---|
| ONZOLE | 1248 | 54 | 26.1 | 0.2 | 6.96 | 91.1 | 120 |
| (21.8, 5172) | (35, 66) | (24.0, 28.1) | (0.0, 0.9) | (5.60, 7.89) | (32.2, 340) | ||
| Arenales | 1041 | 42 | 25.7 | 0.5 | 7.44 | 101 | 48 |
| Tangare | 1408 | 57 | 26.4 | 0.06 | 6.65 | 87.9 | 72 |
| CAYAPAS | 474.4 | 88 | 25.0 | 0.3 | 7.87 | 7.03 | 120 |
| (22.3, 4611) | (73, 93) | (24.6, 26.1) | (0.0, 1.3) | (7.06, 8.45) | (3.3, 55.9) | ||
| Telembi | 561.6 | 81 | 25.2 | 0.3 | 7.93 | 6.2 | 48 |
| Trinidad | 424.0 | 89 | 25.0 | 0.3 | 7.84 | 7.6 | 72 |
| SANTIAGO | 128.0 | 144 | 24.9 | 0.8 | 8.61 | 19.4 | 102 |
| (0.5, 2420) | (18, 166) | (23.4, 27.0) | (0.0, 2.1) | (5.79, 9.40) | (8.2, 106) | ||
| Rocafuerte | 104.6 | 24 | 25.6 | 0.2 | 7.63 | 21.0 | 30 |
| La Peña | 139.3 | 160 | 24.5 | 1.1 | 9.05 | 15.9 | 72 |
Notes: Range of observed values for each river shown in parentheses.
3.2. Impact of Distance from Shore on Water Quality
We observed significantly higher geometric mean E. coli concentrations within the eddy versus the main flow of the river (p = 0.0243) for the Santiago and Cayapas Rivers (Table 2), with an average within-transect paired difference of 0.12 log10 (n = 8). The Onzole was excluded from this analysis for lack of observable eddies due to low flow. Average paired E. coli concentrations decreased by 0.27 log10 (n = 15) between the sample closest to shore and any sample >6 m from shore.
Table 2.
E. coli concentrations within the eddy versus in the main flow of the river for the Santiago & Cayapas Rivers.
| Location | n | Geometric Mean | 95% CL Mean | Coefficient of Variation | p-Value |
|---|---|---|---|---|---|
| Main Flow | 85 | 197.3 | (144.4, 269.4) | 2.67 | 0.0243 * |
| Within Eddy | 137 | 308.4 | (242.8, 391.7) | 2.53 | - |
Notes: Student’s t-test of the mean values was used to test significance; * Indicates significant difference.
Log10 E. coli concentrations decreased with increasing distance from shore (m) in all three rivers (Figure 2). The Santiago River demonstrated the strongest association (β = −0.352, p = 0.003, r2 = 0.084), followed by the Cayapas River (β = −0.020, p = 0.003, r2 = 0.072), and the Onzole River (β = −0.015, p = 0.037, r2 = 0.037). However, all three rivers had a poor linear fit, as demonstrated by the r2 values.
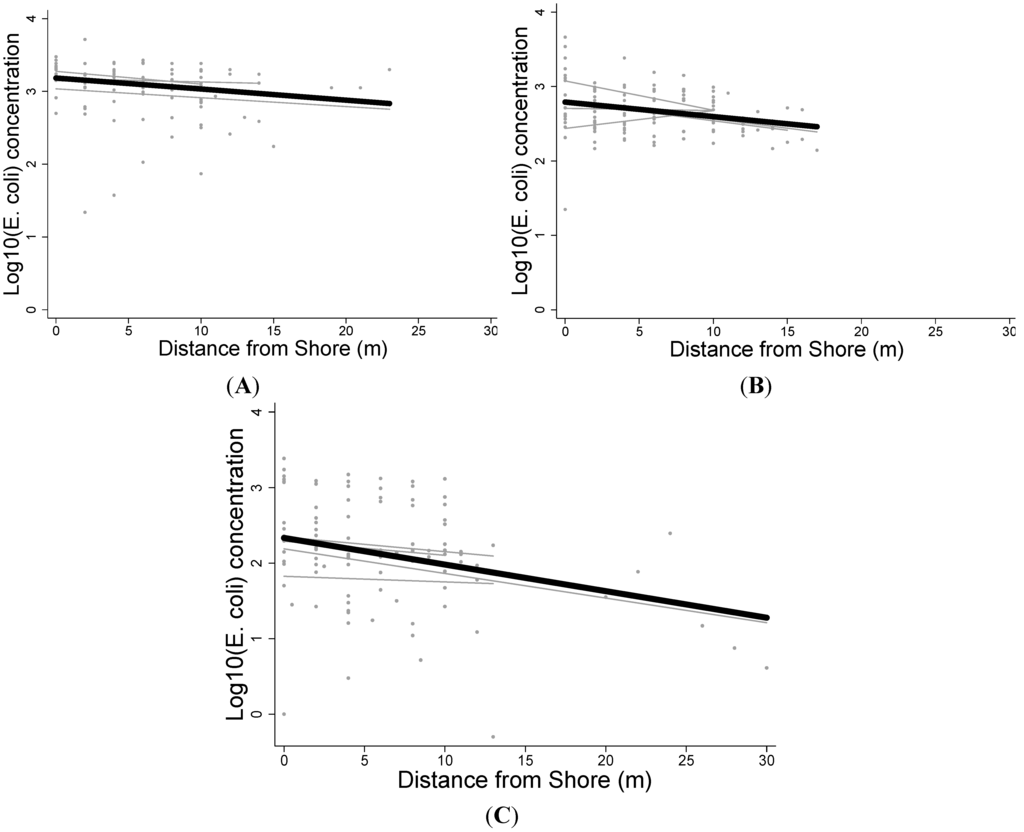
Figure 2.
Log10 E. Coli concentration versus distance from shore. Best-fit lines are shown for each transect (light grey) and for each river (black) for the (A) Onzole; (B) Cayapas; and (C) Santiago Rivers in northern coastal Ecuador. The relationships were significantly inversely associated for all rivers (p < 0.05).
The relationships between distance from shore and physiochemical measures of water quality are shown in Figure S1. DO2 increased with distance from shore for all three rivers, but this relationship was only statistically significant for the Cayapas and Onzole Rivers (Onzole: β = 0.035, p = 0.0003, r2 = 0.105; Cayapas: β = 0.027, p < 0.0001, r2 = 0.369; Santiago: β = 0.020, p = 0.168, r2 = 0.019). Turbidity decreased with distance from shore for all three rivers but this relationship was only significant for the Cayapas River (Onzole: β = −0.154, p = 0.908, r2 = 0.0001; Cayapas: β = −0.433, p = 0.007, r2 = 0.061; Santiago: β = −0.065, p = 0.900, r2 = 0.0002). There was a strong positive association between velocity and distance from shore for all three rivers (Onzole: β = 0.135, p = 0.0001, r2 = 0.411; Cayapas: β = 0.126, p < 0.0001, r2 = 0.596; Santiago: β = 0.174, p < 0.0001, r2 = 0.219).
3.3. Relationship between Water Quality Parameters and E. coli Concentrations
There was an inverse association between dissolved oxygen and log10 E. coli concentrations for all rivers, although the strength and significance of this relationship varied by river (Onzole: β = −0.109, p = 0.102, r2 = 0.023; Cayapas: β = −0.491, r2 = 0.093, p = 0.001; Santiago: β = −0.179, p = 0.028, r2 = 0.047). All three rivers showed a significant positive association between turbidity and log10 E. coli concentrations (Onzole: β = 0.001, p = 0.008, r2 = 0.058; Cayapas: β = 0.023, p < 0.0001, r2 = 0.321; Santiago: β = 0.013, p < 0.0001, r2 = 0.282). There was no significant trend between velocity and log10 E. coli concentration for any of the three rivers.
3.4. Analysis of Factors Associated with E. coli Concentrations
All variables were retained after the model selection process, except for the interaction terms. While velocity was not statistically significant, dropping it from the model did not significantly improve the AIC so it was retained in the model. The equation for the final model is given as:
where i = 1 − k; k = 15 for number of transects; and j = 1 − 6 points for each transect.
(Log10 E. coli)ij = β0 + β1 Distance from shore1ij + β2 Turbidity2ij + β3(DO2)3ij + β4Velocity4ij + eij
Results of the univariate analysis and correlated mixed model are shown in Table 3. In the unadjusted and adjusted estimates, distance from shore and dissolved oxygen were both negatively associated with log10 E. coli concentrations. Increased turbidity was associated with increased log10 E. coli concentrations. Velocity maintained a negative effect in the unadjusted model, but was not statistically significant when controlling for the other variables in the final adjusted model. Adjusting for turbidity, dissolved oxygen, and velocity we observed a 2% decrease in log10 E. coli concentrations with every meter from shore.
Table 3.
Final unadjusted (univariate) and adjusted (multivariate) correlated mixed model assessing factors associated with log10 E. coli concentrations. Samples were correlated at the transect level.
| Parameter | Unadjusted | Adjusted | ||||
|---|---|---|---|---|---|---|
| Estimate | σ | p-Value | Estimate | Σ | p-Value | |
| Intercept | - | - | - | 4.91 | 0.531 | <0.0001 |
| Distance from Shore (m) | −0.026 | 0.005 | <0.0001 | −0.017 | 0.006 | 0.003 |
| Turbidity (NTU) | 0.004 | 0.0007 | <0.0001 | 0.003 | 0.001 | <0.0001 |
| DO2 (ppm) | −0.4138 | 0.064 | <0.0001 | −0.31 | 0.07 | <0.0001 |
| Velocity | −0.151 | 0.071 | 0.0335 | 0.077 | 0.077 | 0.317 |
4. Conclusions
For three rivers that serve as surface drinking water sources for communities in northern coastal Ecuador, we found a modest reduction in E. coli concentrations with increasing distance from shore, for each river we examined and also when all three rivers were examined together. Log10 E. coli concentrations decreased by 2% with each meter from shore, controlling for other water quality variables. In addition, water in the main channel had E. coli concentrations on average 0.12 log10 lower than within eddies along the river shore and samples collected >6 m from shore had concentrations on average 0.27 log10 lower than those collected at the location closest to shore.
These findings suggest that localized microscale river dynamics, including stream velocity, eddies, and physiochemical water parameters, affect the levels of contamination encountered by people who depend on surface water. Collecting water farther from shore, in the main river channel rather than at the river shore, could offer a way for villagers to reduce the concentrations of microbes to which they are exposed through their drinking water. While the reductions are modest, and do not meet WHO health-based targets and microbiological performance specifications for household water treatment [21], in the absence of other water treatments this simple intervention could reduce the initial source water concentrations. In another study in this region, we found that baseline source water concentrations affected the effectiveness of chlorine water treatment [22]. In this region, community members could easily and safely implement this intervention because children and other community members commonly use canoes that are often available at river access points. However, it is important to note that this may not always be the case in other parts of the world.
The pattern of decreasing E. coli concentrations with increasing distance from shore has been observed in other studies [23,24], but this observation has mostly been limited to coastal environments. Mechanisms that could contribute to these reductions in E. coli with distance from shore include die-off, sedimentation, predation and more rapid transport away from the point source due to higher flow velocities in the main channel. Additional studies have shown that soil or sand at the shore can be a potential source of bacterial contamination [25,26,27,28], which could explain the spatial pattern we observed. However, our results do not depend on whether the source of contamination originates from people bathing and washing in the river or from reservoirs of microorganisms in riverbank sediments. In this study, we found increased oxygenation and decreased turbidity with distance from shore. Increased oxygenation has been shown in the literature to be associated with increased die-off, and high turbidity is also well known to be associated with high E. coli levels [15,28,29]. It is also possible that E. coli in the shore is associated with biofilms in sand particles, whereas there are less resilient, planktonic cells in the middle of the stream [30,31].
These results also suggest that contamination originating within a village is unlikely to accumulate downstream on a watershed scale, as reductions in microorganisms were observed on the scale of tens of meters. This suggests that locations where community members access the river may be serving as point sources of contamination that is limited to the village scale and is most relevant to localized transmission processes. Even greater reductions may occur over the larger scales that separate villages located kilometers away.
Our study had several limitations, suggesting lines of further research. We collected samples during only one season (the dry season), and we were unable to collect any volumetric stream flow data or fully characterize the complexities of hydrodynamic flows. Future studies could use a microbial tracer to see where the water is flowing to distinguish eddy lines more clearly. This would contribute to further water quality and hydrodynamic models for surface water. The observed reductions may be within measurement error or natural variability of the samples, so it would have been preferable to run samples in duplicate or triplicate to reduce this variability. However, given the logistical constraints of carrying out a study in a remote field location, our total sample size was limited and we chose to optimize the study design by evaluating more samples rather than running multiple IDEXX trays per sample. This allowed us to examine the relationships of interest across multiple sites. It should also be noted that false positive rates have been reported for Colilert with freshwater samples [32,33]. Additionally, other fecal indicator organisms, such as Enterococci and coliphage, should be tested to determine the generalizability of these results.
This study, along with others, suggests that a surface water body is heterogeneous. Predicting locations of low contamination may be beneficial in minimizing exposure to contamination [13,28,34,35,36].
Acknowledgments
This study was supported by a Rollins Global Field Experience grant and National Institute of Allergy and Infectious Diseases Grants #R01AI050038 and #K01AI103544. We thank Chelo Ortiz and Sixto Medina for their assistance in the field and Baiyu Yang for her support and guidance on the data analysis. Bang Tran created the illustration presented in Figure 1.
Author Contributions
Gouthami Rao carried out the fieldwork and the data analysis. Karen Levy conceived of the project. Joseph Eisenberg, William Cevallos, and Gabriel Trueba advised on design and implementation of field project. Gouthami Rao and Karen Levy wrote the manuscript, with input from all co-authors. David Kleinbaum and Joseph Eisenberg advised on statistical analysis.
Supplementary Information
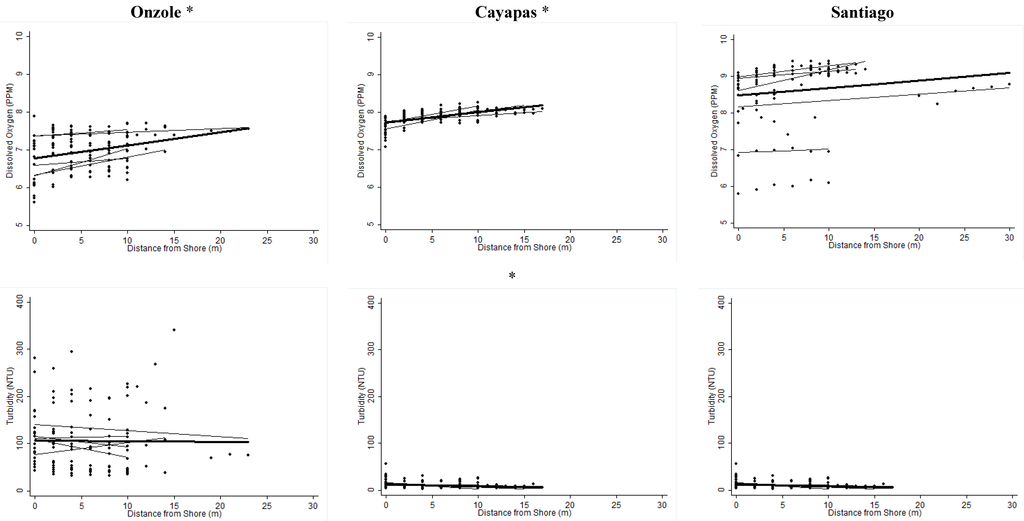
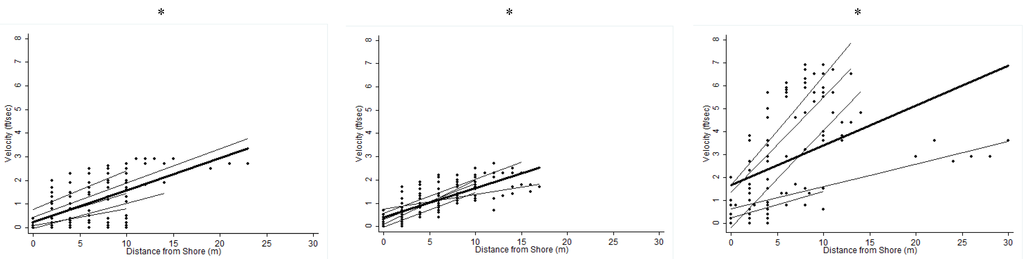
Figure S1.
Overall trend of water quality variables compared to distance from shore. Best-fit lines are shown for each transect (light grey) and for each river (black). * Significant at the 95% confidence interval level.
Conflicts of Interest
The authors declare no conflict of interest.
References
- Lozano, R.; Naghavi, M.; Foreman, K.; Lim, S.; Shibuya, K.; Aboyans, V.; Abraham, J.; Adair, T.; Aggarwal, R.; Ahn, S.Y.; et al. Global and regional mortality from 235 causes of death for 20 age groups in 1990 and 2010: A systematic analysis for the global burden of disease study 2010. Lancet 2012, 380, 2095–2128. [Google Scholar] [CrossRef] [PubMed]
- World Health Organization (WHO). Number of Deaths: World by Cause. Available online: http://apps.who.int/gho/data/node.main.CODWORLD?lang=en (accessed on 3 July 2013).
- Bain, R.; Cronk, R.; Hossain, R.; Bonjour, S.; Onda, K.; Wright, J.; Yang, H.; Slaymaker, T.; Hunter, P.; Pruss-Ustun, A.; et al. Global assessment of exposure to faecal contamination through drinking water based on a systematic review. Trop. Med. Int. Health TM & IH 2014, 19, 917–927. [Google Scholar] [CrossRef]
- Progress on Drinking Water and Sanitation: 2012 Update; United Nations International Children’s Emergency Fund (UNICEF): New York, NY, USA; WHO: Geneva, Switzerland, 2012; pp. 2–58.
- Baudart, J.; Grabulos, J.; Barusseau, J.P.; Lebaron, P. Salmonella spp. and fecal coliform loads in coastal waters from a point vs. nonpoint source of pollution. J. Environ. Qual. 2000, 29, 241–250. [Google Scholar] [CrossRef]
- Hamner, S.; Tripathi, A.; Mishra, R.K.; Bouskill, N.; Broadaway, S.C.; Pyle, B.H.; Ford, T.E. The role of water use patterns and sewage pollution in incidence of water-borne/enteric diseases along the ganges river in varanasi, india. Int. J. Environ. Health Res. 2006, 16, 113–132. [Google Scholar] [CrossRef] [PubMed]
- Begum, Y.A.; Talukder, K.A.; Nair, G.B.; Qadri, F.; Sack, R.B.; Svennerholm, A.M. Enterotoxigenic Escherichia coli isolated from surface water in urban and rural areas of bangladesh. J. Clin. Microbiol. 2005, 43, 3582–3583. [Google Scholar] [CrossRef] [PubMed]
- Strauch, A.M.; Almedom, A.M. Traditional water resource management and water quality in rural tanzania. Hum. Ecol. 2011, 39, 93–106. [Google Scholar] [CrossRef]
- Boehm, A. Enterococci concentrations in diverse coastal environments exhibit extreme variability. Environ. Sci. Technol. 2007, 41, 8227–8232. [Google Scholar] [CrossRef] [PubMed]
- Doering, P.H. Temporal variability of water quality in the st. Lucie estuary, south florida. JAWRA J. Am. Water Resour. Assoc. 1996, 32, 1293–1306. [Google Scholar] [CrossRef]
- Sampling and Consideration of Variability (Temporal and Spatial) for Monitoring of Recreational Waters; U.S. Environmental Protection Agency—Office of Water: Washington, DC, USA, December 2010; pp. 23–40.
- Bertke, E. Composite analysis for Escherichia coli at coastal beaches. J. Gt Lakes Res. 2007, 33, 335–341. [Google Scholar] [CrossRef]
- Byappanahalli, M.; Fowler, M.; Shively, D.; Whitman, R. Ubiquity and persistence of Escherichia coli in a midwestern coastal stream. Appl. Environ. Microbiol. 2003, 69, 4549–4555. [Google Scholar] [CrossRef] [PubMed]
- Hellweger, F.L.; Masopust, P. Investigating the fate and transport of Escherichia coli in the charles river, boston, using high-resolution observation and modeling. J. Am. Water Resour. Assoc. 2008, 44, 509–522. [Google Scholar] [CrossRef]
- Levy, K.; Hubbard, A.E.; Nelson, K.L.; Eisenberg, J. Drivers of water quality variability in northern coastal ecuador. Environ. Sci. Technol. 2009, 43, 1788–1797. [Google Scholar] [CrossRef] [PubMed]
- Eisenberg, J.N.; Cevallos, W.; Ponce, K.; Levy, K.; Bates, S.J.; Scott, J.C.; Hubbard, A.; Vieira, N.; Endara, P.; Espinel, M.; et al. Environmental change and infectious disease: How new roads affect the transmission of diarrheal pathogens in rural ecuador. Proc. Natl. Acad. Sci. USA 2006, 103, 19460–19465. [Google Scholar] [CrossRef] [PubMed]
- Levy, K.; Nelson, K.; Hubbard, A.; Eisenberg, J. Rethinking indicators of microbial drinking water quality for health studies in tropical developing countries: Case study in northern coastal ecuador. Am. J. Trop. Med. Hyg. 2012, 86, 499–507. [Google Scholar] [CrossRef] [PubMed]
- Carlton, E.J.; Eisenberg, J.N.; Goldstick, J.; Cevallos, W.; Trostle, J.; Levy, K. Heavy rainfall events and diarrhea incidence: The role of social and environmental factors. Am. J. Epidemiol. 2014, 179, 344–352. [Google Scholar] [CrossRef] [PubMed]
- Kleinbaum, D.G.; Klein, M. Logistic Regression: A Self-Learning Text, 3rd ed.; Springer: New York, NY, USA, 2010. [Google Scholar]
- Delaney, K.P.; Zack, M.; Singleton, J.; Satterwhite, C.; Collinearity macro (SAS), Department of Epidemiology, Rollins School of Public Health, Emory University, Druid Hills, GA, USA. Unpublished work. 2013.
- Evaluating Household Water Treatment Options: Health-Based Targets and Microbiological Performance Specifications; WHO: Geneva, Switzerland, 2011.
- Levy, K.; Anderson, L.; Robb, K.A.; Cevallos, W.; Trueba, G.; Eisenberg, J.N.S. Household effectiveness vs. laboratory efficacy of point-of-use chlorination. Water Res. 2014, 54, 69–77. [Google Scholar] [CrossRef] [PubMed]
- Shibata, T.; Solo-Gabriele, H.M.; Fleming, L.E.; Elmir, S. Monitoring marine recreational water quality using multiple microbial indicators in an urban tropical environment. Water Res. 2004, 38, 3119–3131. [Google Scholar] [CrossRef] [PubMed]
- Whitman, R.L.; Nevers, M.B. Escherichia coli sampling reliability at a frequently closed chicago beach: Monitoring and management implications. Environ. Sci. Technol. 2004, 38, 4241–4246. [Google Scholar] [CrossRef] [PubMed]
- Ishii, S.; Sadowsky, M.J. Escherichia coli in the environment: Implications for water quality and human health. Microbes Environ. 2008, 23, 101–108. [Google Scholar] [CrossRef]
- Pachepsky, Y.A.; Sadeghi, A.M.; Bradford, S.A.; Shelton, D.R.; Guber, A.K.; Dao, T. Transport and fate of manure-borne pathogens: Modeling perspective. Agric. Water Manag. 2006, 86, 1–92. [Google Scholar] [CrossRef]
- Rehmann, C.R.; Soupir, M.L. Importance of interactions between the water column and the sediment for microbial concentrations in streams. Water Res. 2009, 43, 4579–4589. [Google Scholar] [CrossRef] [PubMed]
- Solo-Gabriele, H.M.; Wolfert, M.A.; Desmarais, T.R.; Palmer, C.J. Sources of Escherichia coli in a coastal subtropical environment. Appl. Environ. Microbiol. 2000, 66, 230–237. [Google Scholar] [CrossRef] [PubMed]
- He, L.M.; Lu, J.; Shi, W. Variability of fecal indicator bacteria in flowing and ponded waters in southern california: Implications for bacterial tmdl development and implementation. Water Res. 2007, 41, 3132–3140. [Google Scholar] [CrossRef] [PubMed]
- Ksoll, W.B.; Ishii, S.; Sadowsky, M.J.; Hicks, R.E. Presence and sources of fecal coliform bacteria in epilithic periphyton communities of lake superior. Appl. Environ. Microbiol. 2007, 73, 3771–3778. [Google Scholar] [CrossRef] [PubMed]
- Moreira, S.; Brown, A.; Ha, R.; Iserhoff, K.; Yim, M.; Yang, J.; Liao, B.; Pszczolko, E.; Qin, W.; Leung, K.T.; et al. Persistence of Escherichia coli in freshwater periphyton: Biofilm-forming capacity as a selective advantage. FEMS Microbiol. Ecol. 2012, 79, 608–618. [Google Scholar] [CrossRef] [PubMed]
- Chao, W.L. Evaluation of colilert-18 for the detection of coliforms and escherichia coli in tropical fresh water. Lett. Appl. Microbiol. 2006, 42, 115–120. [Google Scholar] [CrossRef] [PubMed]
- Sercu, B.; van de Werfhorst, L.C.; Murray, J.L.; Holden, P.A. Cultivation-independent analysis of bacteria in idexx quanti-tray/2000 fecal indicator assays. Appl. Environ. Microbiol. 2011, 77, 627–633. [Google Scholar] [CrossRef] [PubMed]
- Carrillo, M.; Estrada, E.; Hazen, T.C. Survival and enumeration of the fecal indicators bifidobacterium adolescentis and Escherichia coli in a tropical rain forest watershed. Appl. Environ. Microbiol. 1985, 50, 468–476. [Google Scholar] [PubMed]
- Lyautey, E.; Lu, Z.; Lapen, D.; Wilkes, G.; Scott, A.; Berkers, T.; Edge, T.; Topp, E. Distribution and diversity of Escherichia coli populations in the south nation river drainage basin, eastern ontario, canada. Appl. Environ. Microbiol. 2010, 76, 1486–1496. [Google Scholar] [CrossRef] [PubMed]
- Quilliam, R.; Clements, K.; Duce, C.; Cottrill, S.; Malham, S.; Jones, D. Spatial variation of waterborne Escherichia coli—Implications for routine water quality monitoring. J. Water Health 2011, 9, 734–737. [Google Scholar] [CrossRef] [PubMed]
© 2015 by the authors; licensee MDPI, Basel, Switzerland. This article is an open access article distributed under the terms and conditions of the Creative Commons Attribution license (http://creativecommons.org/licenses/by/4.0/).