Article

Reducing Agricultural Water Footprints at the Farm Scale: A Case Study in the Beijing Region

1
School of Life Science and Engineering, Southwest University of Science and Technology, Avenue Qinglong 59, Fucheng, Mianyang 621010, China
2
Development Center of Science and Technology, Ministry of Agriculture, South Road of East Third Ring 96, Chaoyang, Beijing 100122, China
3
Commonwealth Scientific and Industrial Research Organisation (CSIRO), Private Bag 10, Clayton South, Victoria 3169, Australia
4
Department of Agricultural Economics, University of the Free State, Bloemfontein 9300, South Africa
5
College of Agronomy and Biotechnology, China Agricultural University, Yuan-ming-yuan West Road 2, Haidian, Beijing 100193, China
*
Author to whom correspondence should be addressed.
These authors contributed equally to this work.
Water 2015, 7(12), 7066-7077; https://doi.org/10.3390/w7126674
Submission received: 25 October 2015 / Revised: 5 December 2015 / Accepted: 14 December 2015 / Published: 18 December 2015
(This article belongs to the Special Issue Sustainable Water Consumption)

Abstract

:
Beijing is one of the most water-stressed regions in the world. Reducing agricultural water use has long been the basis of local policy for sustainable water use. In this article, the potential to reduce the life cycle (cradle to gate) water footprints of wheat and maize that contribute to 94% of the local cereal production was assessed. Following ISO 14046, consumptive and degradative water use for the wheat-maize rotation system was modeled under different irrigation and nitrogen (N) application options. Reducing irrigation water volume by 33.3% compared to current practice did not cause a significant yield decline, but the water scarcity footprint and water eutrophication footprint were decreased by 27.5% and 23.9%, respectively. Similarly, reducing the N application rate by 33.3% from current practice did not cause a significant yield decline, but led to a 52.3% reduction in water eutrophication footprint while maintaining a similar water scarcity footprint. These results demonstrate that improving water and fertilizer management has great potential for reducing the crop water footprints at the farm scale. This situation in Beijing is likely to be representative of the challenge facing many of the water-stressed regions in China, where a sustainable means of agricultural production must be found.

1. Introduction

In many parts of the world, excessive water consumption and pollution are depleting and degrading freshwater resources [1]. The pressure humanity exerts on freshwater systems needs to be immediately reduced [2]. Agriculture contributes around 92% of humanity’s total water consumption and pollution, and about 89% of this is linked to crop production [3]. Thus, from the perspective of the production of goods and services, the solution depends overwhelmingly on optimizing the crop production patterns.
In recent years, the water footprint metric has been employed as a priority tool to make transparent the impacts of humanity’s consumption and production on global freshwater resources. In the earliest stages of water footprint research, product water footprints were typically defined as the summation of direct and indirect water use from the various stages of production (Water Footprint Network (WFN) [4]). A number of water footprint assessments were based on this definition [3,5,6]. However, more recently, it has been recognized that there is not one single water footprint method, but various approaches. Except the water footprint method proposed by the WFN, which uses the term in the context of water volumes used, a variety of methods have been developed in the context of life cycle assessment (LCA), which is the analytical technique used to quantify the various environmental interventions caused by products from cradle to grave [7,8,9,10]. Several earlier studies based on LCA have demonstrated that these impact-oriented approaches are more meaningful to reflect the environmental impacts of water use than the volumetric water footprint indicators. This is because there are different types of water use and different local water scarcity contexts. As such, to provide an internationally-consistent method, the International Organization for Standardization (ISO) has published the LCA-based ISO 14046 water footprinting standard [11].
Many LCA-based water footprint case studies have been carried out on crops and crop-derived products, such as wheat [12], tomato [13], tea [14], mango [15] and cotton textile [16]. However, most previous water footprint assessments of crops grown at the farm scale only provide information about the related environmental impacts of consumptive water use and degradative water use, but seldom report the irrigation or fertilization management, which often have potential for improvement. Therefore, the water footprint indicator should be accompanied by related mitigation options to achieve both sustainable water use and food production goals.
Beijing is one of the most water-scarce regions in the world. The average water resources per capita have fallen to 138 m3 in the latest five years, which is far below the internationally-recognized lowest limit of 1000 m3 [17]. With rapid population growth and accelerating urbanization, the quantity and quality of available water resources in the Beijing region have become matters of broad concern. Reducing agricultural water use has been long used as a policy measure to save water resources. In response to this policy, the overall cropped land area has progressively decreased over the past 20 years [18]. However, for the interests of food security and to stimulate cropping systems with higher ecosystem services provision, current policies aim to conserve agricultural land [19]. In this context, to further explore the potential of water-saving from agricultural production, realistic measures should depend on cropping pattern adjustment together with improvements to farming practices. Our previous study has identified that cropping pattern changes in peri-urban regions and rural communities surrounding the Beijing metropolitan area can have a substantial impact on water resources [18]. Cropping cereals rather than intensive vegetables in greenhouses could reduce local blue water consumption by 7216 m3·ha−1·year−1 and N pollution by 45 kg·ha−1·year−1 [19]. These results conclusively indicated that cropping pattern adjustment offers the potential to relieve pressure on local water resources. The major cereal cropping rotation of wheat-maize has been recommended to alleviate local water stress [19]. To further reduce the impact of cereal production on water resources in the Beijing region, improvements on traditional farming practices are also needed. However, current farm management of irrigation and fertilization for the wheat-maize rotation system typically involves excessive application of these inputs, not only giving rise to the waste of water resources, but also exerting chemical pollution on local water bodies [20,21]. Improving water and fertilizer management for crops can greatly reduce the irrigation water consumption and water pollution [22]. Beijing needs to apply such measures to optimize cereal production, further exploring the potential for water stress alleviation by agriculture.
The objective of this study was to assess the potential of optimizing irrigation and fertilization management for water footprint reduction of the wheat-maize rotation system. Field experiments were conducted to assess the yields of crops under different water and N management. A water footprint approach, based on the ISO 14046 water footprinting standard, was then applied to assess the impact of crop production on water availability and water degradation, which were reported as the water scarcity footprint and the water eutrophication footprint, respectively. Our purpose is to contribute science-based evidence that will enable local policy makers in Beijing to implement strategies for reducing the impact of crop production on local water resources. The wider dissemination of results is also intended to increase the understanding of alleviating water stress from crop production in other regions of China, where a sustainable means of food production must be found.

2. Materials and Methods

2.1. Field Experiments

A rotation of wheat and maize is the traditional cereal cropping pattern in the Beijing region. Currently, the total area of these two crops is about 1.5 × 10⁵ ha, accounting for 94% of the total cropping area of cereals [17]. During the years 2006–2009, field experiments were conducted to assess the water and fertilizer utilization efficiency of the wheat-maize cropping system in Tongzhou district (39°57′ N, 116°40′ E; 18.8 m above sea level), one of the main crop production areas in Beijing. The climate of Tongzhou is a continental monsoon climate. The mean total rainfall is 593 mm, which is mainly distributed from April–September. The texture of soil has been characterized as sandy loamy topsoil resting on loamy subsoil [21,23].
Irrigation experiments were conducted during 2006–2008, and in 2008–2009, fertilization experiments were added (Table 1). The local farmers’ irrigation volume (FI) was set as the baseline against which reduced irrigation water use levels (I-1, I-2, I-3 and I-4) were evaluated (Table 2). The farmers’ current irrigation practice is applying 50 mm of water each at the crop growing stage of overwintering, seedling establishment, jointing and grain filing for wheat and to each crop growing stage of jointing and booting for maize. I-1 was the option for reducing irrigation at the filling stage for wheat and at the jointing stage for maize. I-2 was the option of reducing irrigation at seedling establishment and the filling stage for wheat and at the jointing stage for maize. I-3 was the option for reducing irrigation at overwintering, seedling establishment and the filling stage for wheat and at the jointing stage for maize. I-4 was zero irrigation. Similarly, for fertilization experiments, the local farmers’ N practice (FN) was set as the baseline against which reduced fertilizer application levels (N-1, N-2 and N-3) were tested (Table 3). Farmers’ current N application practice is applying 112.5 kg·ha−1 of N each before seeding and at the jointing stage for wheat and before seeding and at the booting stage for maize. N-1 and N-2 were the options for reducing N application by 33.3% and 66.7% for each fertilization stage compared to farmers’ practice. N-3 was zero N application. For both irrigation and fertilization experiments, other local common agronomic practices were applied for seeding date and depth, planting density, pest and weed control. For each crop growing season, crop yield and the physical quantity of farm inputs (fertilizer, fuel, electricity and pesticides) were collected and profiled.
Table 1. Description of the wheat-maize rotation field experiments.
YearPlanting DateHarvest DateStudy Variables
2006~20072 October 200615 June 2007Different irrigation options were set to be compared to local farmers’ usual irrigation practice. Other aspects of farm management, such as fertilization, pest and weed control, followed the farmers’ usual practices.
24 June 20071 October 2007
2007~200810 October 200715 June 2008Same as above
25 June 200826 September 2008
2008~20096 October 20088 June 2009Different fertilization options were set to be compared to local farmers’ usual fertilization practice. Other aspects of farm management, such as irrigation, pest and weed control, followed the farmers’ usual practices.
13 June 20092 October 2009
Table 2. Irrigation options for the wheat-maize rotation system (mm). FI, farmers’ irrigation volume; I-1, Irrigation Level 1.
CropIrrigation TimeIrrigation Options
FII-1I-2I-3I-4
WheatOverwintering50505000
Seedling establishment5050000
Jointing505050500
Filling500000
Total200150100500
MaizeJointing500000
Booting505050500
Total1005050500
Table 3. N fertilizer options for the wheat-maize rotation system (kg·ha−1). FN, farmers’ N practice; N-1, Nitrogen Level 1.
CropN Application Options
FNN-1N-2N-3
wheat225150750
maize225150750
Total4503001500

2.2. Calculation of Crop Water Footprint

The water footprint calculations were preformed following ISO 14046 as described below.

2.2.1. Goal and Scope Definition

The aim of this study was to assess the impact of alternative irrigation and fertilizer application options on the water scarcity and water eutrophication footprints of crops and to understand the potential of agricultural water footprint reduction at the farm level. The system boundary for water footprint assessment was the cultivation process of wheat and maize in the Beijing region, and the functional unit was defined as 1 kg wheat and 1 kg maize at the farm gate.

2.2.2. Water Footprint Inventory Analysis

Quantities of water used, including water extracted from surface and groundwater resources for irrigation and farm-input production, were classified into two types, i.e., direct water consumption and indirect water consumption.
The direct water consumption for crop production was determined by the crop water requirement (ETc[t]), accessible effective rainfall (Reff[t]) and effective irrigation (Ieff[t]). Crop water requirement (ETc[t]) and accessible effective rainfall (Reff[t]), which were computed using the Simulation of Evapotranspiration of Applied Water (SIMETAW) model, determine the irrigation requirement (Ir[t]) [23,24]. SIMETAW is a hydrological model that employs the classic Penman–Monteith equation to estimate reference evapotranspiration following the methodology recommended by FAO [25]. Climate data used for model simulation were obtained from the China Meteorological Data Sharing Service System (http://cdc.nmic.cn/home.do).
I r [ t ] = E T c [ t ] R e f f [ t ]
Direct water consumption in each growth stage, such as the overwintering stage and the jointing stage (DW[t]), equaled the minimum of the irrigation requirement (Ir[t]) and effective irrigation (Ieff[t]). Effective irrigation refers to the irrigation water stored in the soil for crop growth.
D W [ t ] = min ( I r [ t ] , I e f f [ t ] )
The direct water consumption throughout the crop growth period (DW) was the aggregation of direct water consumption during each of the crop growth stages (DW[t]), n (day).
D W = t = 1 n D W [ t ]
The indirect water consumption associated with the production of farm inputs (such as fertilizer, pesticides, diesel, etc.) was determined using the Chinese Reference Life Cycle Database (http://www.ike-global.com) implemented in SimaPro Version 7.3.2. Water use associated with the production of capital goods, such as the construction of machinery, equipment and buildings, was excluded from the calculation. Both the direct and indirect water consumption throughout the life cycle formed the water use inventory.
Apart from the water consumption, water pollution was also considered in the inventory phase, since it related to the water eutrophication footprint indicator in the impact assessment stage. Agricultural non-point emissions to water are a major water pollution concern in the Beijing region. In this study, nitrate leaching was not measured through field experiments, but instead simulated using a denitrification-decomposition (DNDC) model. The DNDC model was initially developed for estimating C sequestration in and trace gas emissions from the U.S. agricultural soils [26]. Based on the widely-tested processes embedded in the model, nowadays, the DNDC has been modified and improved to serve N leaching simulations [27,28,29]. For the Chinese agricultural situation, model calibration and validation have previously been undertaken by Li et al. [29] and Huang et al. [23], where it has been shown that the model is able to reliably describe the grain yield of wheat-maize rotation, as well as the N leaching.

2.2.3. Water Footprint Impact Assessment

Impacts of the crop production process related to water can be represented by one or more parameters, which quantify the potential environmental impacts. In the absence of a complete inventory about agro-chemical emissions, water-related potential environmental impacts related to water degradation were not comprehensively assessed. The water footprint results were profiled using two impact category indicators: water scarcity footprint and water eutrophication footprint.
To quantify the water scarcity footprint, we employed the water stress index (WSI) of Pfister et al. [16] as the characterization factor at the mid-point level for the impact assessment phase. A number of publications have demonstrated the applicability of this WSI as the characterization factor in the life cycle impact assessment of water use [30,31]. The local WSI for Beijing is 1.000 (on a scale of 0–1), and the national average WSI (0.478) was used in relation to farm and industrial inputs where the location of production was uncertain. The water scarcity footprint of each crop was calculated by multiplying each location-specific volume of water consumption by the relevant WSI and then by dividing by the global average WSI (0.602). The results were reported in units of L H2O equivalent (H2Oe), where 1 L H2Oe represents 1 L of consumptive water use at the global average WSI. This reference unit is considered useful for communication purposes, enabling decision makers and stakeholders to quantitatively compare life cycle water scarcity footprints in relation to an equivalent volume of water use.
The water eutrophication footprint was determined to address water degradation from agricultural non-point source N pollution. Due to the increased input of nutrients, incidences of the excessive growth and accumulation of algae and higher aquatic plants have increased, representing an important environmental burden on surface water bodies. In this study, the water eutrophication footprint was assessed using the aquatic eutrophication potential method [32], multiplying the simulated quantity of N leaching by the relevant equivalency factor (0.42) with the result expressed in the reference unit PO43− equivalent (PO43−e).

2.3. Statistical Analysis

Data for the crop yield under different water and N application options were compared statistically by one-way analysis of variance (ANOVA) with least significant difference (LSD) tests at the 0.05 probability level in SPSS Statistics 17.0 (SPSS Inc., Chicago, IL, USA). Arithmetic means for three replicates were calculated for yield, and the data for each year were submitted to ANOVA separately. For the calculation of water footprint under different irrigation options, the two years of experimental data were averaged.

3. Results

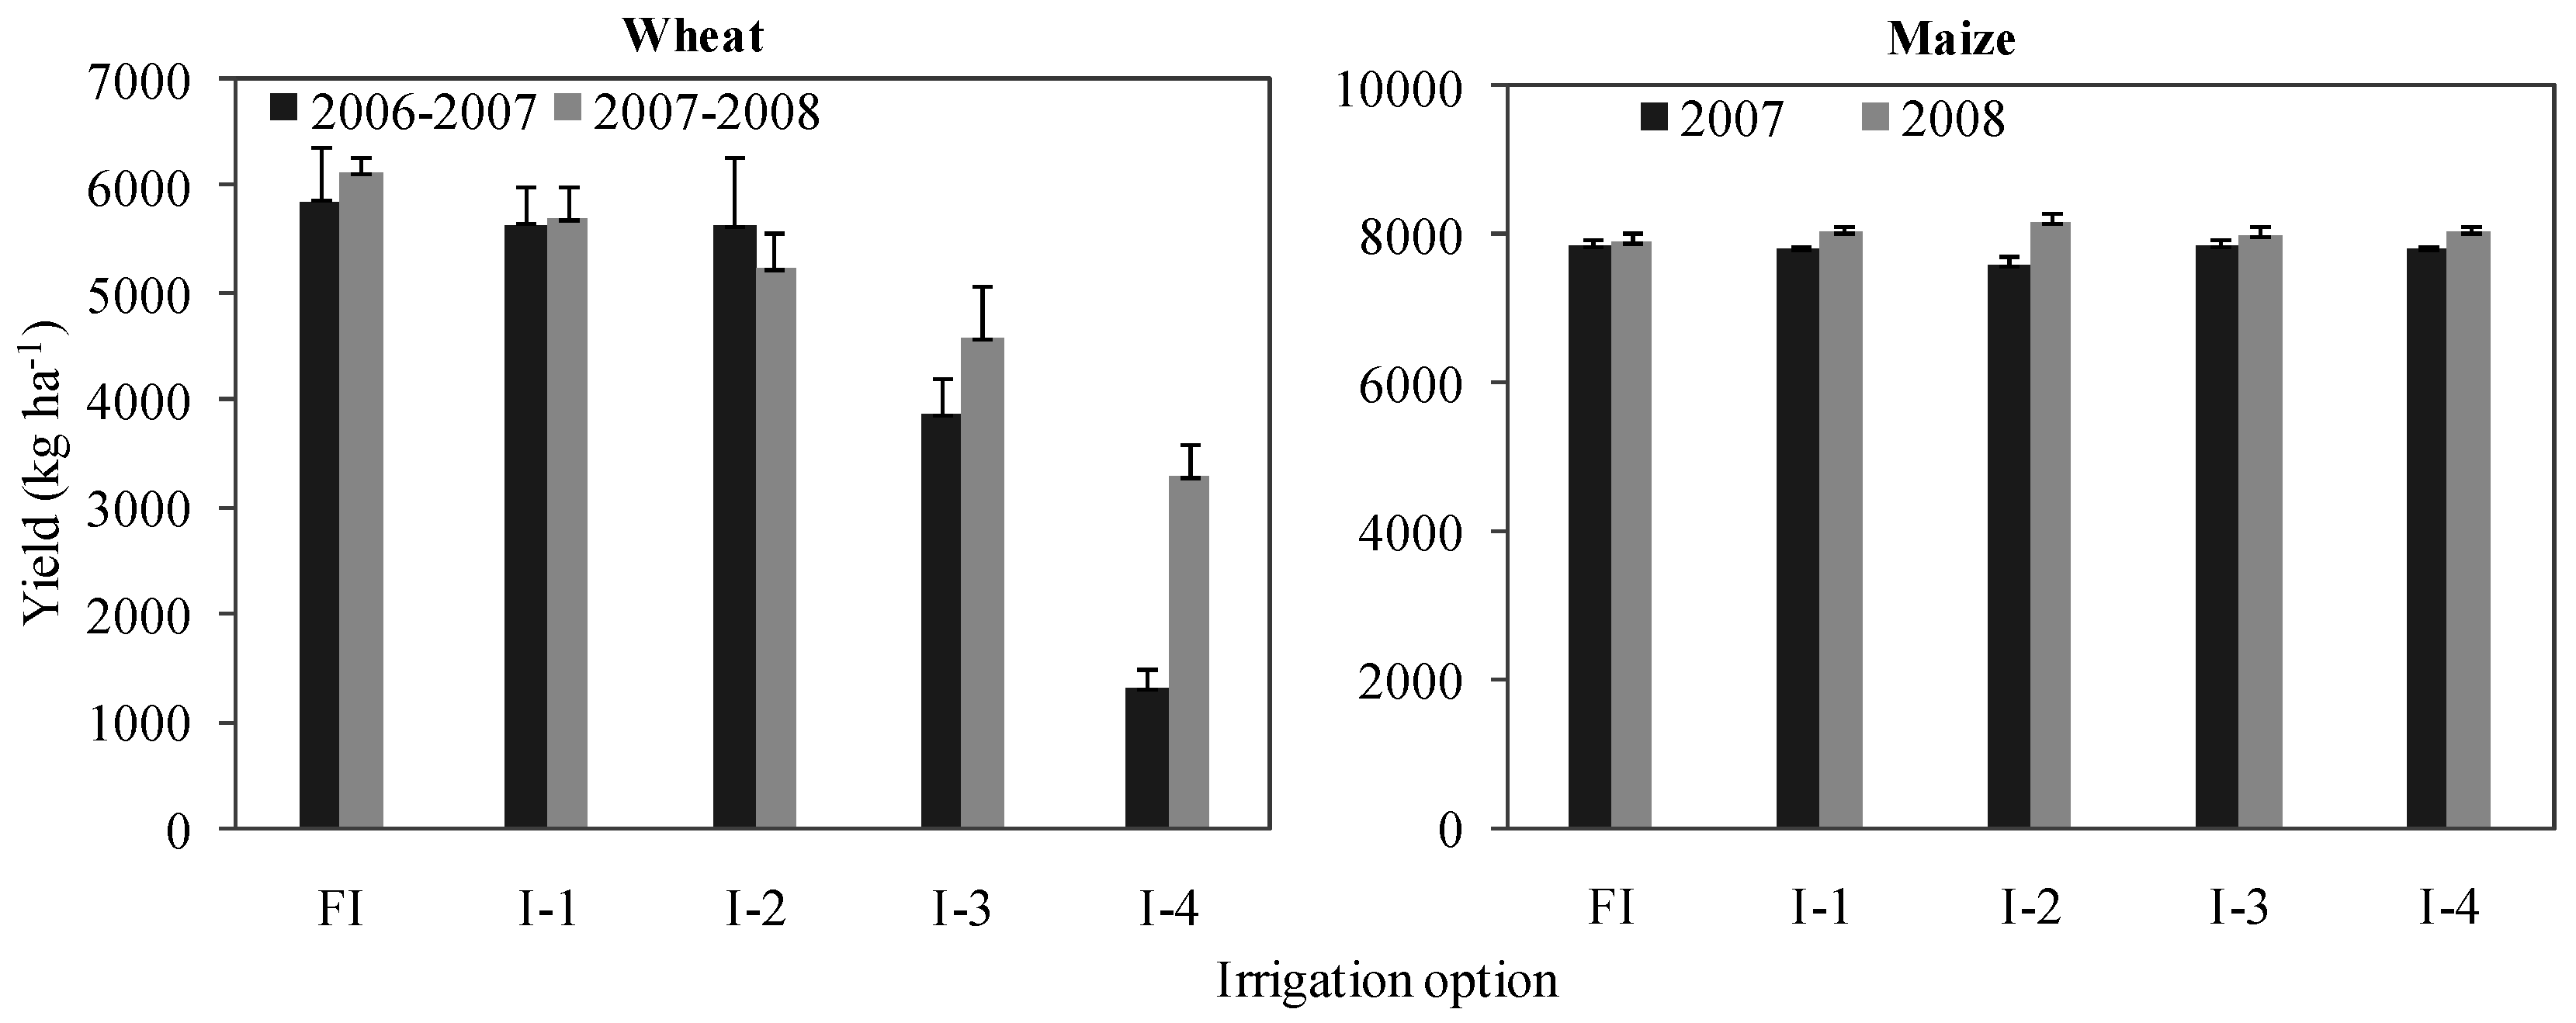
3.1. Crop Yield under Different Irrigation and N Application Options

As a general trend, the yield of wheat increased as irrigation volume increased (Figure 1), indicating the necessity of supplementary irrigation for wheat cropping in the Beijing region. During 2006–2007, there were no significant differences (p > 0.05) observed for the yields between FI, I-1 and I-2 options, while during 2007–2008, there were no significant differences (p > 0.05) observed for the yields between FI and I-1 options. In contrast, the growth of maize can completely rely on natural rainfall. No significant differences (p > 0.05) in yields were detected among the irrigation options for maize. For the wheat-maize rotation system, irrigation at the overwintering, seedling establishment and jointing stage for wheat and irrigation at the booting stage for maize were the best irrigation schema (i.e., I-1) among all of the studied options, which can save 33.3% irrigation water use and not cause significant yield decline.
Figure 1. The yield of wheat and maize under different irrigation options.
Water 07 06674 g001
When the N application rate was set at the level of the farmers’ practice (225 kg·ha−1, FN), the yield of wheat reached 6750.0 kg·ha−1, the highest among different N options (Figure 2). However, the yield did not significantly decrease (p > 0.05) when the N application rate was reduced by 75 kg·ha−1(33.3%, N-1) or by 150 kg·ha−1 (66.7%, N-2). The yield variation of maize followed a similar trend to wheat. When the N application rate was set at 150 kg·ha−1 (N-1), the yield of maize reached 95.8% of the highest yield, with no significant difference (p > 0.05) compared to the current practice. However, when the N application rate was set at 75 kg·ha−1 (N-2), the yield of maize was significantly decreased (p < 0.05) by 890.3 kg·ha−1 (9.8%) compared to the yield under FN. For the wheat-maize rotation system, reducing the total N application rate by 150 kg·ha−1 (33.3%) (i.e., N-1 option) compared to current practice did not cause a significant decrease of yield.
Figure 2. The yield of wheat and maize under different N options.
Water 07 06674 g002

3.2. Water Scarcity Footprint and Water Eutrophication Footprint

The water scarcity footprint and water eutrophication footprint of wheat and maize under different irrigation options are shown in Table 4. As the irrigation level went up, both the water scarcity footprint and water eutrophication footprint per unit yield of wheat and maize increased. For the option without irrigation (I-4), the water scarcity footprints were entirely from farm inputs and less than 10% of those from other irrigation options. The increase of water footprint mainly resulted from the increase of irrigation. However, considering the yield, the option I-1 showed the greatest potential to reduce the water footprint while not causing significant yield decline. For the wheat-maize rotation, under the I-1 management option, the total irrigation water input was reduced by 100 mm, the water scarcity footprint was reduced by 27.5% and the water eutrophication footprint was reduced by 23.9% compared to current farming practice.
Table 4. Water scarcity footprints and water eutrophication footprints of wheat and maize under different irrigation options. H2Oe, H2O equivalent; PO4−3e, PO4−3 equivalent.
CropItemUnitIrrigation Options
FII-1I-2I-3I-4
WheatIrrigation water useL·kg−1324.6264.3184.1119.40.0
Farm input water useL·kg−16.87.27.59.721.6
Water scarcity footprintL H2Oe kg−1544.6444.7311.7206.117.2
N leaching amountg·kg−12.11.91.10.70.0
Water eutrophication footprintg PO4−3e·kg−10.90.80.40.30.0
MaizeIrrigation water useL·kg−1121.057.157.557.00.0
Farm input water useL·kg−14.94.94.94.94.9
Water scarcity footprintL H2Oe·kg−1204.998.799.598.63.9
N leaching amountg·kg−11.00.50.40.50.0
Water eutrophication footprintg PO4−3e·kg−10.40.20.20.20.0
The water scarcity footprint and water eutrophication footprint of wheat and maize under different N options are shown in Table 5. As the N application level went up, N pollution per unit yield increased, resulting in an increase in the crop water eutrophication footprint. As a tradeoff, the increase of crop yields resulting from increased nitrogen application led to declines in the water scarcity footprints. Considering the yield, the option N-1 showed the greatest potential for N management, which can reduce the water eutrophication footprint while not causing significant yield decline. For the wheat-maize rotation, under the N-1 option, the total N inputs were reduced by 150 kg·ha−1, the water eutrophication footprint of was reduced by 52.3%, while the water scarcity footprint was increased very slightly (2.0%) compared to current farming practices.
Table 5. Water scarcity footprints and water eutrophication footprints of wheat and maize under different N options.
CropItemUnitN Application Options
FNN-1N-2N-3
WheatIrrigation water useL·kg−1291.4293.6319.8354.4
Farm input water useL·kg−16.14.73.72.5
Water scarcity footprintL H2Oe·kg−1488.9491.4534.2590.7
N leaching amountg·kg−10.90.40.10.0
Water eutrophication footprintg PO4−3e·kg−10.40.20.00.0
MaizeIrrigation water useL·kg−1110.4115.2122.5131.6
Farm input water useL·kg−14.33.42.61.6
Water scarcity footprintL H2Oe·kg−1186.8194.0205.5219.8
N leaching amountg·kg−10.6 0.3 0.0 0.0
Water eutrophication footprintg PO4−3e·kg−10.20.10.00.0

4. Discussion

4.1. Water Footprinting Methodology

This study applied the framework for product water footprinting defined by ISO [11]. According to ISO 14046, a water footprint assessment can be reported as a single value or as a profile of impact category indicator results. To facilitate interpretation and avoid potential uncertainty in normalization and aggregation processes, this study reported water scarcity footprint and water eutrophication footprint separately. As such, weighting methods that combine consumptive and degradative water use into a single metric were not applied [33,34]. In some previous studies, the degradative water footprint has been assessed using a critical dilution volume indicator, i.e., the so-called grey water footprint [3,5,6]. However, the grey water footprint results depend substantially on the choice of water quality standard applied [19]. Furthermore, the grey water footprint has been found to be confusing, as the term grey water is already used in the water industry to refer to nutrient-rich sewage from households that lack fecal or urine contamination. A variety of other weaknesses associated with grey water have also been discussed previously [34]. As such, in this study, the degradative water footprint was assessed using the aquatic eutrophication potential method [32]. However, since there exists a lack of reliable data on phosphorus and pesticide losses, this study was limited to modelling the degradative water footprint associated with nitrogen emitted to water. In China, the N cycle in agricultural soils has been extensively studied, due to the relevance to GHG emissions reporting and mitigation, and reliable models exist to quantify flows. This study applied the DNDC model to simulate N leaching from the wheat-maize rotation system, which has been calibrated and validated and shown to deliver reliable results [23,29]. The simulated amount of N leaching ranged from 0.6 to 2.1 g·kg−1 (i.e., 10.9–20 kg·ha−1) for wheat-maize cropping under the farmers’ current practice of 450 kg N application per hectare. Other studies based on field experimentation have assessed the amount of N leaching in the range from 1.5 to 81.8 kg·ha−1 for wheat and maize in the surrounding North China Plain under local N application ranging from 400 to 600 kg N per hectare [20,29,35,36]. N leaching varies among the different studies because of differences in climate, soils and management practices. However, the results of this study showed the overall tendency that reducing farmers’ irrigation and N application rate can decrease the N leaching, which is in agreement with Ju et al. [20] and Li et al. [35]. To enable a comprehensive assessment of potential water degradation impacts, future modelling needs to include phosphorus and pesticides emitted to water from the cropping systems.

4.2. Water Footprint Implications

There is a pressing awareness that the impacts of human production and consumption on freshwater resources must be reduced [2]. The ultimate goal of water footprinting is to reduce the water footprint associated with humanity’s production and consumption of goods and services. However, most of the previous studies focused on reporting the water footprint values only, rather than proposing practical management options [3,5,6]. By one estimate, the water footprint of humanity must be reduced in the order of 50% to achieve the sustainable utilization of global freshwater [2]. It is more urgent to decrease water consumption and pollution in the regions with high WSI. Being situated in the water-scarce northern part of China, the Beijing region, with a very high WSI (1.00), faces severe water stress. Numerous studies have assessed the agricultural water use in Beijing and suggested political and technological measures to be applied [22,37]. However, these studies were based on traditional water use assessment, ignoring the environmental impacts associated with water consumption and pollution from an LCA perspective.
Applying the LCA-based water footprinting method, this study has illustrated the great potential for reducing water consumption and N leaching of the wheat-maize rotation system in the Beijing region. The results showed that farmers who apply excessive water and N fertilizer do not generally obtain a higher yield. Poor irrigation and fertilization practices therefore represent an economic cost to farmers, as well as contributing to the exacerbation of the existing local water scarcity and water pollution problems. Maintaining the yield of wheat and maize at the farmers’ current level, the irrigation water could be reduced by 100 mm for wheat-maize cropping, with a reduction of the water scarcity footprint by 27.5% and the water eutrophication footprint by 23.9%. Considering the total area of 2.3 × 10⁴ ha of wheat-maize cropping (based on the area of wheat [17]), the total volume of irrigation water use and N leaching could be reduced by 2.4 × 10⁷ m3 and 1.4 × 10⁵ kg, respectively. However, the irrigation experiments in this study took place during seasons when normal rainfall patterns prevailed. In seasons when rainfall patterns departed greatly from the norm, the preferred irrigation schema identified in this study may not be practical. Continuing experimentation in various sites is needed to address such conditions. For the N management experiments, the one-year study showed that local farmers’ N application rate was excessive, consistent with other evidence [20,35]. The study found that reducing the current N application rate by 150 kg·ha−1 can maintain crop yields, but substantially reduce N loss to the environment. However, it is questionable whether this optimizing of N management is sustainable to maintain crop yields in the longer term. The crop yields obtained in this experiment could have been supported by residual N from previous rotations. Nevertheless, it appears certain that N application rates can be safely reduced in the short term while steps are taken to enable farmers to more accurately match N applications to long-term crop requirements.
It is important to note that the water and N management experiments in this study were conducted independently. Thus, the optimal water and N application measures identified here cannot be applied together directly. Numerous studies have identified that there exist coupling effects of water-fertilizer management on crop yield, as well as water and fertilizer use efficiency [38,39,40]. Further research is needed to explore a reasonable co-allocation of water and fertilizer application in the wheat-maize rotation system, which can reduce the crop water footprint while maintaining the crop yields. Actually, reducing the water and fertilizer application can not only reduce the crop water footprint, but also can save costs and mitigate other environmental impacts, such as greenhouse gas emissions [41]. In addition, from the technology aspect, measures, such as installing water-saving irrigation equipment (e.g., drip and sprinkler irrigation equipment), rainwater harvesting, irrigation with recycled water and fertilization by soil testing, can all be applied to further improve the water and fertilizer management. Beyond the technology aspect, there are also opportunities to achieve better agricultural water management through improvements in the policy and regulatory environment, as well as enhanced agricultural and environmental education for farmers and consumers.

5. Conclusions

Since agriculture makes a major contribution to humanity’s water consumption and pollution, the solution to reduce water footprints depends overwhelmingly on shifting the patterns of agricultural production. Beijing is one of the most water-stressed regions in the world. For the interests of agricultural land conservation and water stress alleviation, the area of traditional wheat-maize cropping is likely to be increased. However, current farming practice involves excessive irrigation and fertilization in the case of wheat and maize production, leading to serious water wastage and pollution. Based on field experiments, our study provides evidence for the great potential of water footprint reduction from the improvement of farming practices for cereal cropping in water-stressed Beijing. Optimizing the water and N application can greatly reduce both the water scarcity footprint and the water eutrophication footprint, while maintaining the yields of wheat and maize. Reducing the irrigation water volume by 100 mm (33.3%) for wheat-maize cropping, the total water scarcity and the water eutrophication footprint could be lowered by 27.5% and 23.9%, respectively. Similarly, reducing the N application by 150 kg·ha−1 (33.3%), the total water eutrophication footprint could be lowered by 52.3% with a similar water scarcity footprint. However, since the irrigation and N application experiments were conducted separately during seasons when typical rainfall conditions prevailed, further studies are recommended to quantify the coupled effects of water-fertilizer options on crop yield, water consumption and pollution emission under various rainfall conditions. For the Beijing region, optimizing crop management regimes, together with upgrading irrigation and fertilization systems, deserves more attention for future policy directives and farming systems design to achieve sustainable agricultural water management. This situation in Beijing is likely to be representative of the challenge facing many of the agricultural regions in China, where there is currently widespread excessive application of irrigation and fertilization inputs to production, and a sustainable means of food production must be found.

Acknowledgments

This study was supported by the research fund from Southwest University of Science and Technology (No. 14zx7158).

Author Contributions

Jing Huang, Changchun Xu and Fu Chen conceived of and designed the field experiment, Jing Huang and Changchun Xu collected the data. Jing Huang, Changchun Xu and Bradley G. Ridoutt analyzed the data. Jing Huang and Changchun Xu wrote the paper. Bradley G. Ridoutt and Fu Chen edited the paper.

Conflicts of Interest

The authors declare no conflict of interest.

References

  1. The United Nations World Water Development Report 3: Water in a Changing World. Available online: http://webworld.unesco.org/water/wwap/wwdr/wwdr3/pdf/WWDR3_Water_in_a_Changing_World.pdf (assessed on 2 October 2015).
  2. Ridoutt, B.G.; Pfister, S. Reducing humanity’s water footprint. Environ. Sci. Technol. 2010, 44, 6019–6021. [Google Scholar] [CrossRef] [PubMed]
  3. Hoekstra, A.Y.; Mekonnen, M.M. The water footprint of humanity. Proc. Natl. Acad. Sci. USA 2012, 109, 3232–3237. [Google Scholar] [CrossRef] [PubMed]
  4. Hoekstra, A.Y.; Chapagain, A.K.; Aldaya, M.M.; Mekonnen, M.M. The Water Footprint Assessment Manual: Setting the Global Standard, 1st ed.; Earthscan Press: London, UK; Washington, DC, USA, 2011; pp. 194–195. [Google Scholar]
  5. Mekonnen, M.M.; Hoekstra, A.Y. The green, blue and grey water footprint of crops and derived crop products. Hydrol. Earth Syst. Sci. 2011, 15, 1577–1600. [Google Scholar] [CrossRef]
  6. Mekonnen, M.M.; Hoekstra, A.Y. A global assessment of the water footprint of farm animal products. Ecosystems 2012, 15, 401–415. [Google Scholar] [CrossRef]
  7. Bayart, J.B.; Bulle, C.; Deschênes, L.; Margni, M.; Pfister, S.; Vince, F.; Koehler, A. A framework for assessing off-stream freshwater use in LCA. Int. J. Life Cycle Assess. 2010, 15, 439–453. [Google Scholar] [CrossRef]
  8. Berger, M.; Finkbeiner, M. Water footprinting: How to address water use in life cycle assessment? Sustainability 2010, 2, 919–944. [Google Scholar] [CrossRef]
  9. Kounina, A.; Margni, M.; Bayart, J.B.; Boulay, A.M.; Berger, M.; Bulle, C.; Frischknecht, R.; Koehler, A.; Milà i Canals, L.; Motoshita, M.; et al. Review of methods addressing freshwater use in life cycle inventory and impact assessment. Int. J. Life Cycle Assess. 2013, 18, 707–721. [Google Scholar] [CrossRef]
  10. Milà i Canals, L.; Chenoweth, J.; Chapagain, A.; Orr, S.; Anton, A.; Clift, R. Assessing freshwater use in LCA: Part I—Inventory modelling and characterization factors for the main impact pathways. Int. J. Life Cycle Assess. 2008, 14, 28–42. [Google Scholar] [CrossRef]
  11. International Organization for Standardization. ISO 14046: 2014: Environmental Management: Water Footprint—Principles, Requirements and Guidelines; International Organization for Standardization: Geneva, Switzerland, 2014. [Google Scholar]
  12. Ridoutt, B.G.; Poulton, P.L. Dryland and irrigated cropping systems: Comparing the impacts of consumptive water use. In Proceeding of the VII International Conference on Life Cycle Assessment in the Agri-Food Sector, Università degli Studi di Bari Aldo Moro, Italy, 22–24 September 2010; Notarnicola, B., Ed.; pp. 153–158.
  13. Page, G.; Ridoutt, B.; Bellotti, B. Fresh tomato production for the Sydney market: An evaluation of options to reduce freshwater scarcity from agricultural water use. Agric. Water Manag. 2011, 100, 18–24. [Google Scholar] [CrossRef]
  14. Jefferies, D.; Muñoz, I.; Hodges, J.; King, V.J.; Aldaya, M.; Ercin, A.E.; Milà i Canals, L.; Hoekstra, A.Y. Water footprint and life cycle assessment as approaches to assess potential impacts of products on water consumption. Key learning points from pilot studies on tea and margarine. J. Clean. Prod. 2011, 33, 155–166. [Google Scholar] [CrossRef]
  15. Ridoutt, B.G.; Juliano, P.; Sanguansri, P.; Sellahewa, J. The water footprint of food waste: Case study of fresh mango in Australia. J. Clean. Prod. 2010, 18, 1714–1721. [Google Scholar] [CrossRef]
  16. Pfister, S.; Koehler, A.; Hellweg, S. Assessing the environmental impacts of freshwater consumption in LCA. Environ. Sci. Technol. 2009, 43, 4098–4104. [Google Scholar] [CrossRef] [PubMed]
  17. Beijing Municipal Bureau of Statistics (BMBS). Beijing Statistical Yearbook; Chinese Statistics Press: Beijing, China, 2015. (In Chinese) [Google Scholar]
  18. Huang, J.; Ridoutt, B.G.; Xu, C.C.; Zhang, H.L.; Chen, F. Cropping pattern modifications change water resource demands in the Beijing metropolitan area. J. Integr. Agric. 2012, 11, 101–108. [Google Scholar] [CrossRef]
  19. Huang, J.; Ridoutt, B.G.; Zhang, H.L.; Xu, C.C.; Chen, F. Water footprint of cereals and vegetables for the Beijing market: Comparison between local and imported supply. J. Ind. Ecol. 2014, 18, 40–48. [Google Scholar] [CrossRef]
  20. Ju, X.T.; Xing, G.X.; Chen, X.P.; Zhang, S.L.; Zhang, L.J.; Liu, X.J.; Cui, Z.L.; Yin, B.; Christie, P.; Zhu, Z.L.; et al. Reducing environmental risk by improving N management in intensive Chinese agricultural systems. Proc. Natl. Acad. Sci. USA 2009, 106, 3041–3046. [Google Scholar] [CrossRef] [PubMed] [Green Version]
  21. Song, Z.W. The Construction of the Water-Saving Cropping System Based on Simulation Model and Scenario Analysis: A Case of Beijing. Ph.D. Thesis, China Agricultural University, Beijing, China, 1 June 2010. [Google Scholar]
  22. Shock, C.C.; Shock, C.B. Research, extension, and good farming practices improve water quality and productivity. J. Integr. Agric. 2012, 11, 14–30. [Google Scholar] [CrossRef]
  23. Huang, J. The Sustainable Use of Agricultural Water in Beijing Based on Water Footprinting. Ph.D. Thesis, China Agricultural University, Beijing, China, 1 June 2013. [Google Scholar]
  24. Snyder, R.L.; Geng, S.; Orang, M.; Sarreshteh, S. Calculation and simulation of evapotranspiration of applied water. J. Integr. Agric. 2012, 11, 489–501. [Google Scholar] [CrossRef]
  25. Allen, R.G.; Pereira, L.S.; Raes, D.; Smith, M. Crop Evapotranspiration: Guidelines for Computing Crop Water Requirements; FAO Irrigation and Drainage Paper 56; FAO: Rome, Italy, 1998. [Google Scholar]
  26. Li, C.; Frolking, S.; Frolking, T.A. A model of nitrous oxide evolution from soil driven by rainfall events: 1. Model structure and sensitivity. J. Geophys. Res. 1992, 97, 9759–9776. [Google Scholar] [CrossRef]
  27. Kim, Y.; Seo, Y.; Kraus, D.; Klatt, S.; Haas, E.; Tenhunen, J.; Kiese, R. Estimation and mitigation of N2O emission and nitrate leaching from intensive crop cultivation in the Haean catchment, South Korea. Sci. Total Environ. 2015, 529, 40–53. [Google Scholar] [CrossRef] [PubMed]
  28. Li, C.; Farahbakhshazad, N.; Jaynes, D.B.; Dinnes, D.L.; Salas, W.; McLaughlin, D. Modeling nitrate leaching with a biogeochemical model modified based on observations in a row-crop field in Iowa. Ecol. Model. 2006, 196, 116–130. [Google Scholar] [CrossRef]
  29. Li, H.; Wang, L.; Qiu, J.; Li, C.; Gao, M.; Gao, C. Calibration of DNDC model for nitrate leaching from an intensively cultivated region of Northern China. Geoderma 2014, 223–225, 108–118. [Google Scholar] [CrossRef]
  30. Ridoutt, B.G.; Pfister, S. A revised approach to water footprinting to make transparent the impacts of consumption and production on global freshwater scarcity. Glob. Environ. Chang. 2010, 20, 113–120. [Google Scholar] [CrossRef]
  31. Zonderland-Thomassen, M.A.; Ledgard, S.F. Water footprinting–a comparison of methods using New Zealand dairy farming as a case study. Agric. Syst. 2012, 110, 30–40. [Google Scholar] [CrossRef]
  32. Seppälä, J.; Knuuttila, S.; Silvo, K. Eutrophication of aquatic ecosystems: A new method for calculating the potential contributions of nitrogen and phosphorus. Int. J. Life Cycle Assess. 2004, 9, 90–100. [Google Scholar] [CrossRef]
  33. Swiss Ecological Scarcity Method: The New Version 2006. Available online: http://www.esu-services.ch/cms/fileadmin/download/Frischknecht-2006-EcologicalScarcity-Paper.pdf (assessed on 2 October 2015).
  34. Ridoutt, B.G.; Pfister, S. A new water footprint calculation method integrating consumptive and degradative water use into a single stand-alone indicator. Int. J. Life Cycle Assess. 2013, 18, 204–207. [Google Scholar] [CrossRef]
  35. Li, X.; Hu, C.; Delgado, J.A.; Zhang, Y.; Ouyang, Z. Increased nitrogen use efficiencies as a key mitigation alternative to reduce nitrate leaching in North China Plain. Agric. Water Manag. 2007, 89, 137–147. [Google Scholar] [CrossRef]
  36. Zhu, A.; Zhang, J.; Zhao, B.; Cheng, Z.; Li, L. Water balance and nitrate leaching losses under intensive crop production with Ochric Aquic Cambosols in North China Plain. Environ. Int. 2005, 31, 904–912. [Google Scholar] [CrossRef] [PubMed]
  37. Wang, Y.; Wang, H.R. Sustainable use of water resources in agriculture in Beijing: Problems and countermeasures. Water Policy 2005, 7, 345–357. [Google Scholar]
  38. Lü, L.; Dong, Z.; Zhang, J.; Zhang, L.; Liang, S.; Jia, X.; Yao, H. Effect of water and nitrogen on yield and nitrogen utilization of winter wheat and summer maize. Sci. Agric. Sin. 2014, 47, 3839–3849. (In Chinese) [Google Scholar]
  39. Mahajan, G.; Chauhan, B.S.; Timsina, J.; Singh, P.P.; Singh, K. Crop performance and water-and nitrogen-use efficiencies in dry-seeded rice in response to irrigation and fertilizer amounts in northwest India. Field Crop. Res. 2012, 134, 59–70. [Google Scholar] [CrossRef]
  40. Ye, Y.; Liang, X.; Chen, Y.; Liu, J.; Gu, J.; Guo, R.; Li, L. Alternate wetting and drying irrigation and controlled-release nitrogen fertilizer in late-season rice. Effects on dry matter accumulation, yield, water and nitrogen use. Field Crop. Res. 2013, 144, 212–224. [Google Scholar] [CrossRef]
  41. Aguilera, E.; Lassaletta, L.; Sanz-Cobenad, A.; Garniere, J.; Vallejod, A. The potential of organic fertilizers and water management to reduce N2O emissions in Mediterranean climate cropping systems: A review. Agric. Ecosyst. Environ. 2013, 164, 32–52. [Google Scholar] [CrossRef]

