Article

Numerical Simulation of Groundwater Flow in a River Valley Basin in Jilin Urban Area, China

1
Key Laboratory of Groundwater Resources and Environment, Ministry of Education, College of Environment and Resources, Jilin University, 2519 Jiefang Rd, 130021 Changchun, China
2
Canon (China) Co., LTD. Zhongyin Biulding, No.726, Xi’an Rd, 130000 Changchun, China
*
Authors to whom correspondence should be addressed.
Water 2015, 7(10), 5768-5787; https://doi.org/10.3390/w7105768
Submission received: 28 June 2015 / Revised: 9 October 2015 / Accepted: 13 October 2015 / Published: 21 October 2015
(This article belongs to the Special Issue Geospatial Modeling of River Systems)

Abstract

:
In order to evaluate the groundwater resources and aquifer system of the Jilin urban area (JUA), a groundwater numerical flow model was established by using the groundwater modeling system based on data from 190 boreholes. River stages were interpolated to control the groundwater flow field. The input parameters such as hydraulic conductivity and specific yield were based on data from 260 pumping test data. The model was calibrated by trial and error, simulated results were compared to the observed head and contour maps, which were generally in good agreement, and the root mean squared error was 0.66 m. Sensitivity analysis was carried out and recharge proved to be the most sensitive factor in this model. The water budget showed that the input was 2.07× 10⁸ m3/a, which was smaller than the output of 2.21 × 10⁸ m3/a. A groundwater level decline and cone of depression exist in the Songhua and Aolong river valley. The JUA aquifer systems can be well and efficiently modeled by constructing a numerical model. Based on the supply and demand analysis of water resources, the established model would finally provide a scientific basis to use the groundwater resources sustainably in JUA.

1. Introduction

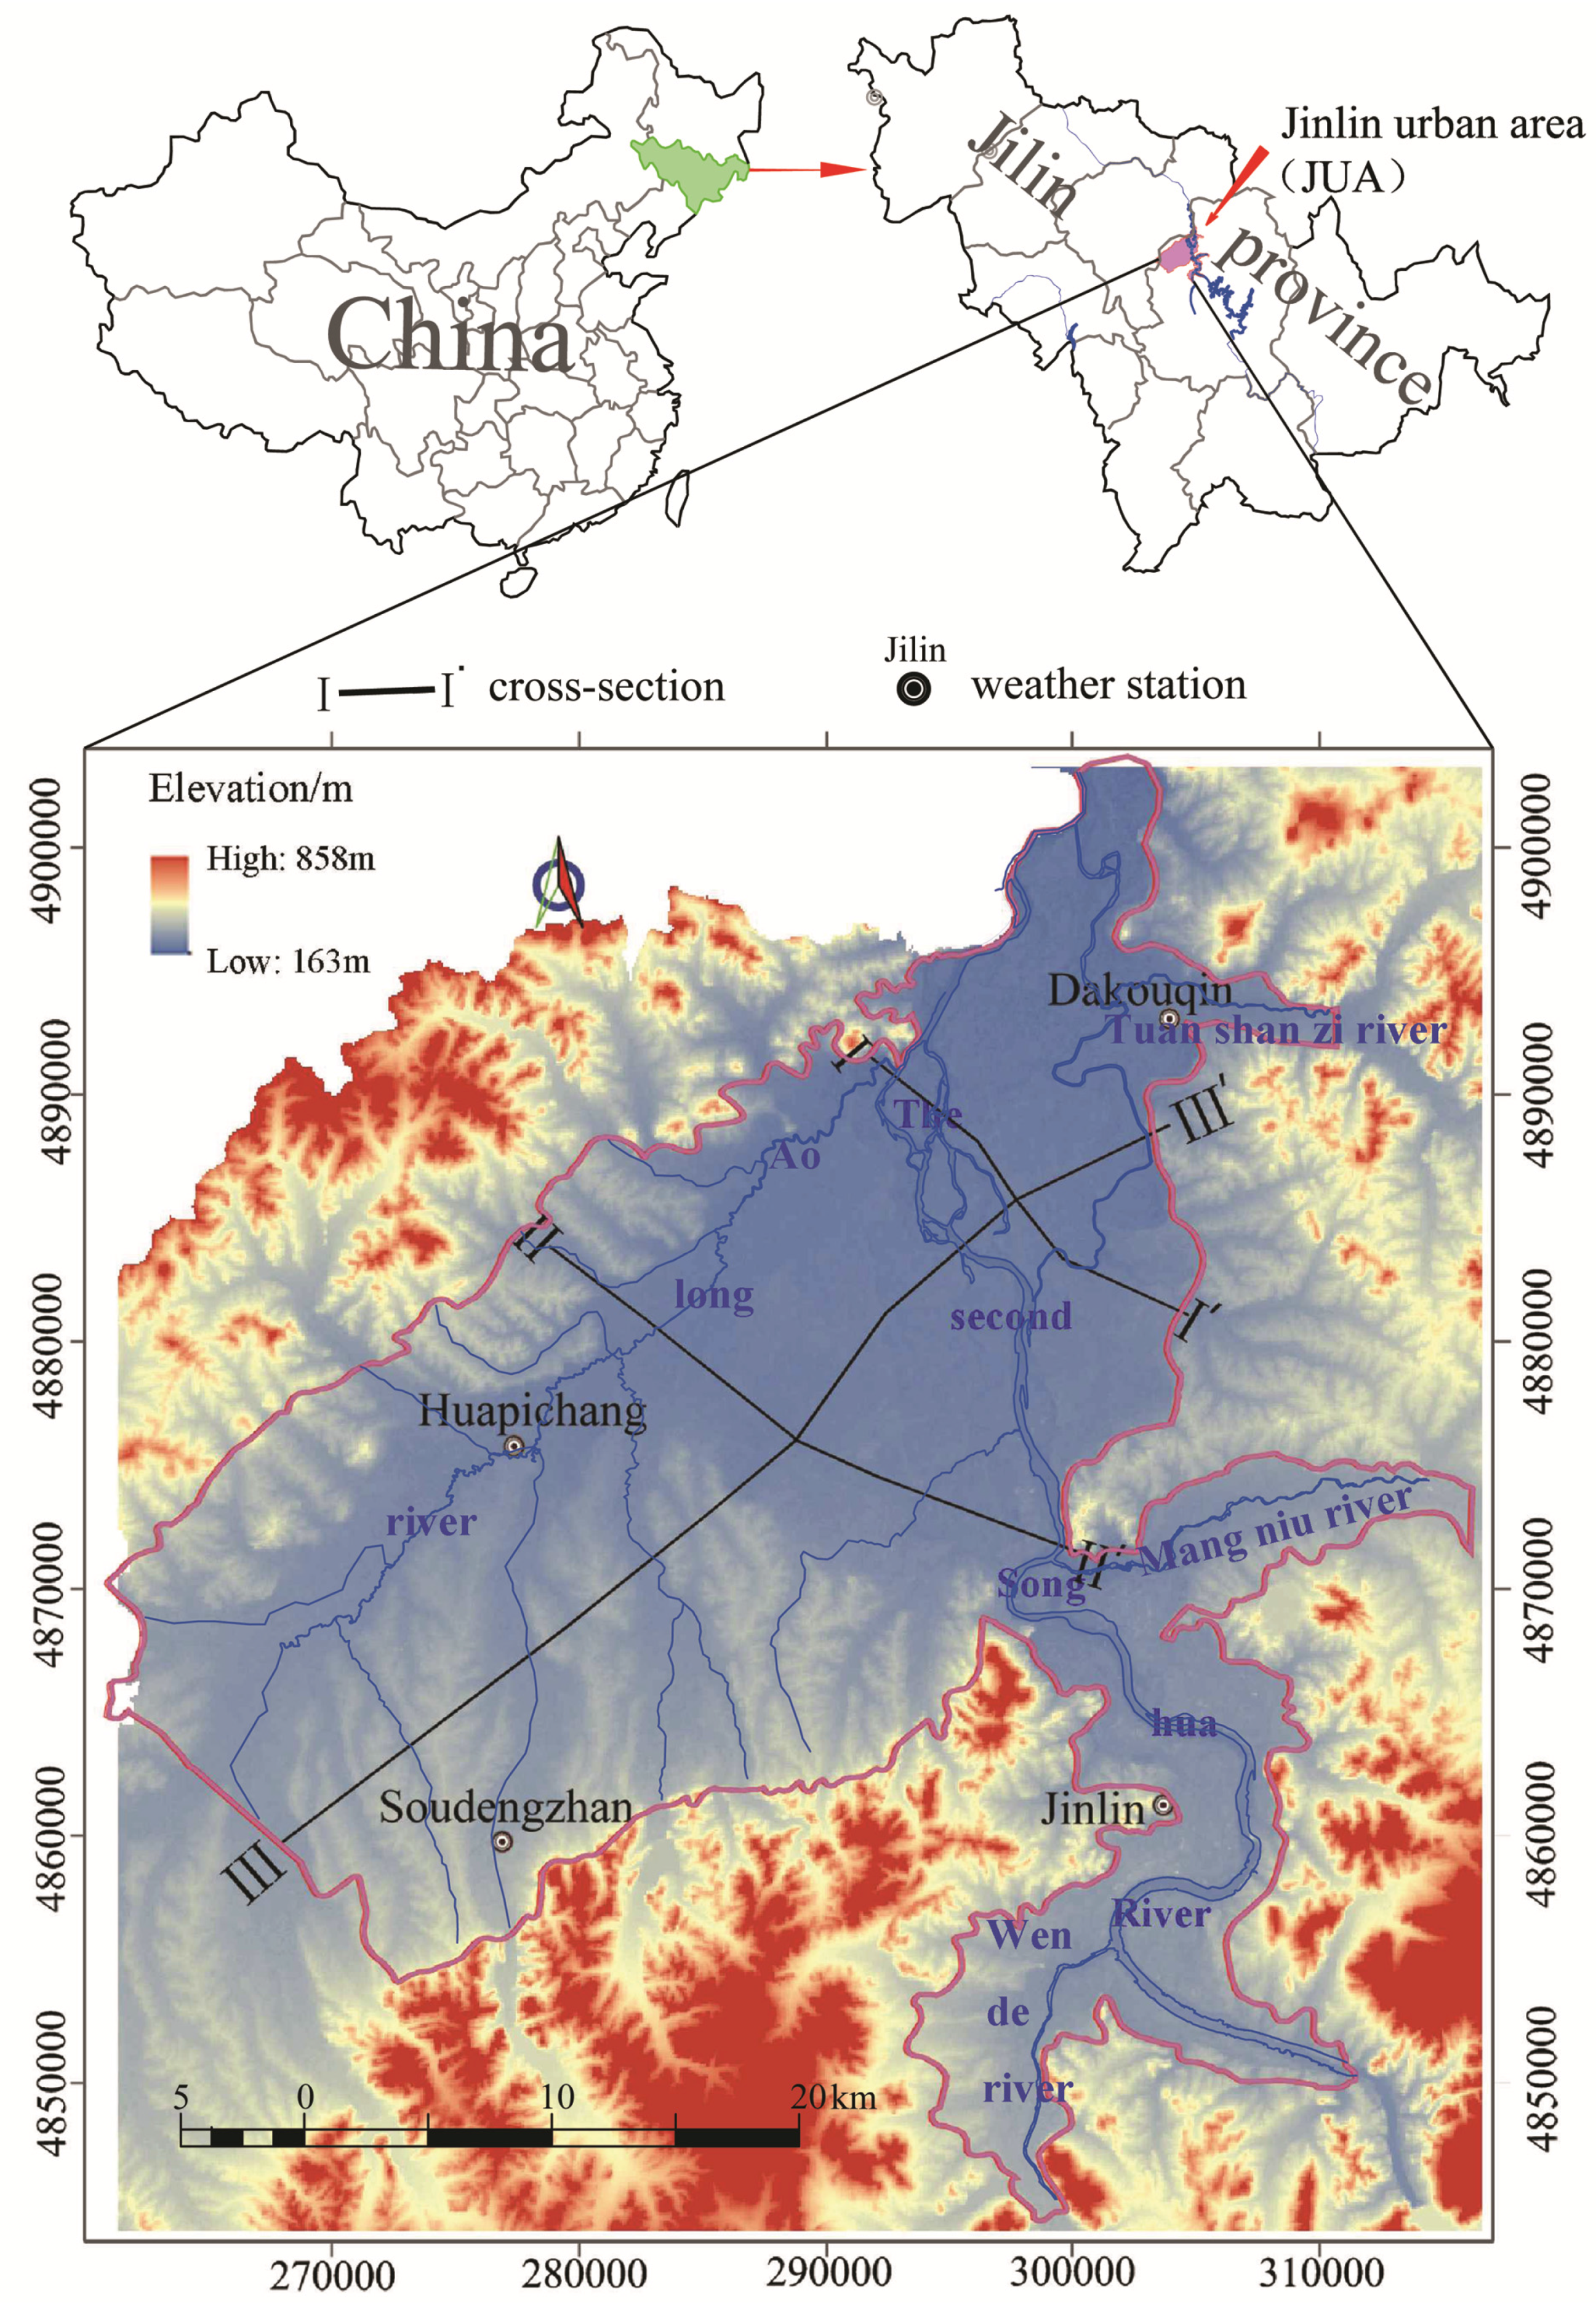
The Jilin urban area (JUA) is located on the banks of the Songhua River (Figure 1). Surface water is abundant in the JUA and is the main source of water, while groundwater is an auxiliary water supply. Excessive reliance on surface water may result in a domestic water supply crisis in the city if the river becomes polluted. For example, an explosion occurred in 2005 at a petrochemical plant owned by the Jilin Petrochemical Corporation, which caused a large spill of toxic substances consisting of a mixture of benzene, aniline, and nitrobenzene (NB) to contaminate the second Songhua River [1,2]. In addition, barrels of trimethyl chlorosilane material were washed into the second Songhua river by a flood in 2010 [3]. Groundwater is a relatively stable and essential source of drinking water, especially when compared to surface water. Before using the groundwater, a proper understanding of the groundwater system behavior is very important [4,5,6].
Groundwater simulation modeling is recognized as a very useful tool for understanding regional groundwater systems, management of groundwater resources, and planning for future water consumption [7,8,9]. Over the years, various models have been developed for modeling subsurface flow. These include the following: Groundwater Modeling System (GMS) [10,11], developed by U.S. Department of Defense, Visual MODFLOW [10] developed by the Waterloo Hydrogeologic Inc., FEFLOW [11] developed by the US Department of Interior, Groundwater Vistas [12] developed by Environmental Simulation, Inc., Interactive Ground Water (IGW) [13] developed by Michigan State University, SWIFT [14] developed by Sandia National laboratories and so on. GMS which supports groundwater modeling computer code MODFLOW 2000 and FEFLOW, is often used for groundwater model set up and can be used for different types of groundwater flow systems, including confined and unconfined aquifers [15,16], simple or multiple aquifers [4], and homogeneous or heterogeneous layered aquifer systems [17,18]. Different types of modeling techniques have already been used by GMS: full [4] and quasi-three dimensional (3D) solutions [19], finite element [20] and finite difference solutions [4]; steady state [20] and transient solutions [21]. GMS allows for model conceptualization, mesh and grid generation, geostatistics and post-processing of output [22]. Auto CAD and Geographic Information System (GIS) [23,24,25] technology can be integrated with the MODFLOW code in GMS for water resources management [26].
The groundwater flow system for the whole JUA district has not been explored and simulated, and there is little guidance on how to deal with the complicated geological conditions, boundaries, the relationship between the groundwater and rivers, and the construction and calibration of the model for the JUA. Zhang only focus on the GMS groundwater quality in the Mangniuhe district, whereas in the east of the JUA [27], Wang analyzed the quantity of surface water using Mikebasin [28]. Meanwhile, the Jilin government began to evaluate and investigate the JUA groundwater resources in order to be better prepared for surface water pollution emergencies and to protect the water supply. Therefore, establishment of a regional groundwater model for the JUA has practical implications for the quantitative evaluation of groundwater resources and the long-term prediction of the groundwater regime in this area. The main purpose of this study was to develop a numerical groundwater flow model to characterize the intermountain river valley groundwater flow system and evaluate the JUA water resources using the GMS software. Based on the supply and demand analysis of water resources, the established model could finally provide a scientific basis for the sustainable use of groundwater resources in the JUA.
Figure 1. Location of Jilin urban area (JUA).
Water 07 05768 g001

2. Materials and Methods

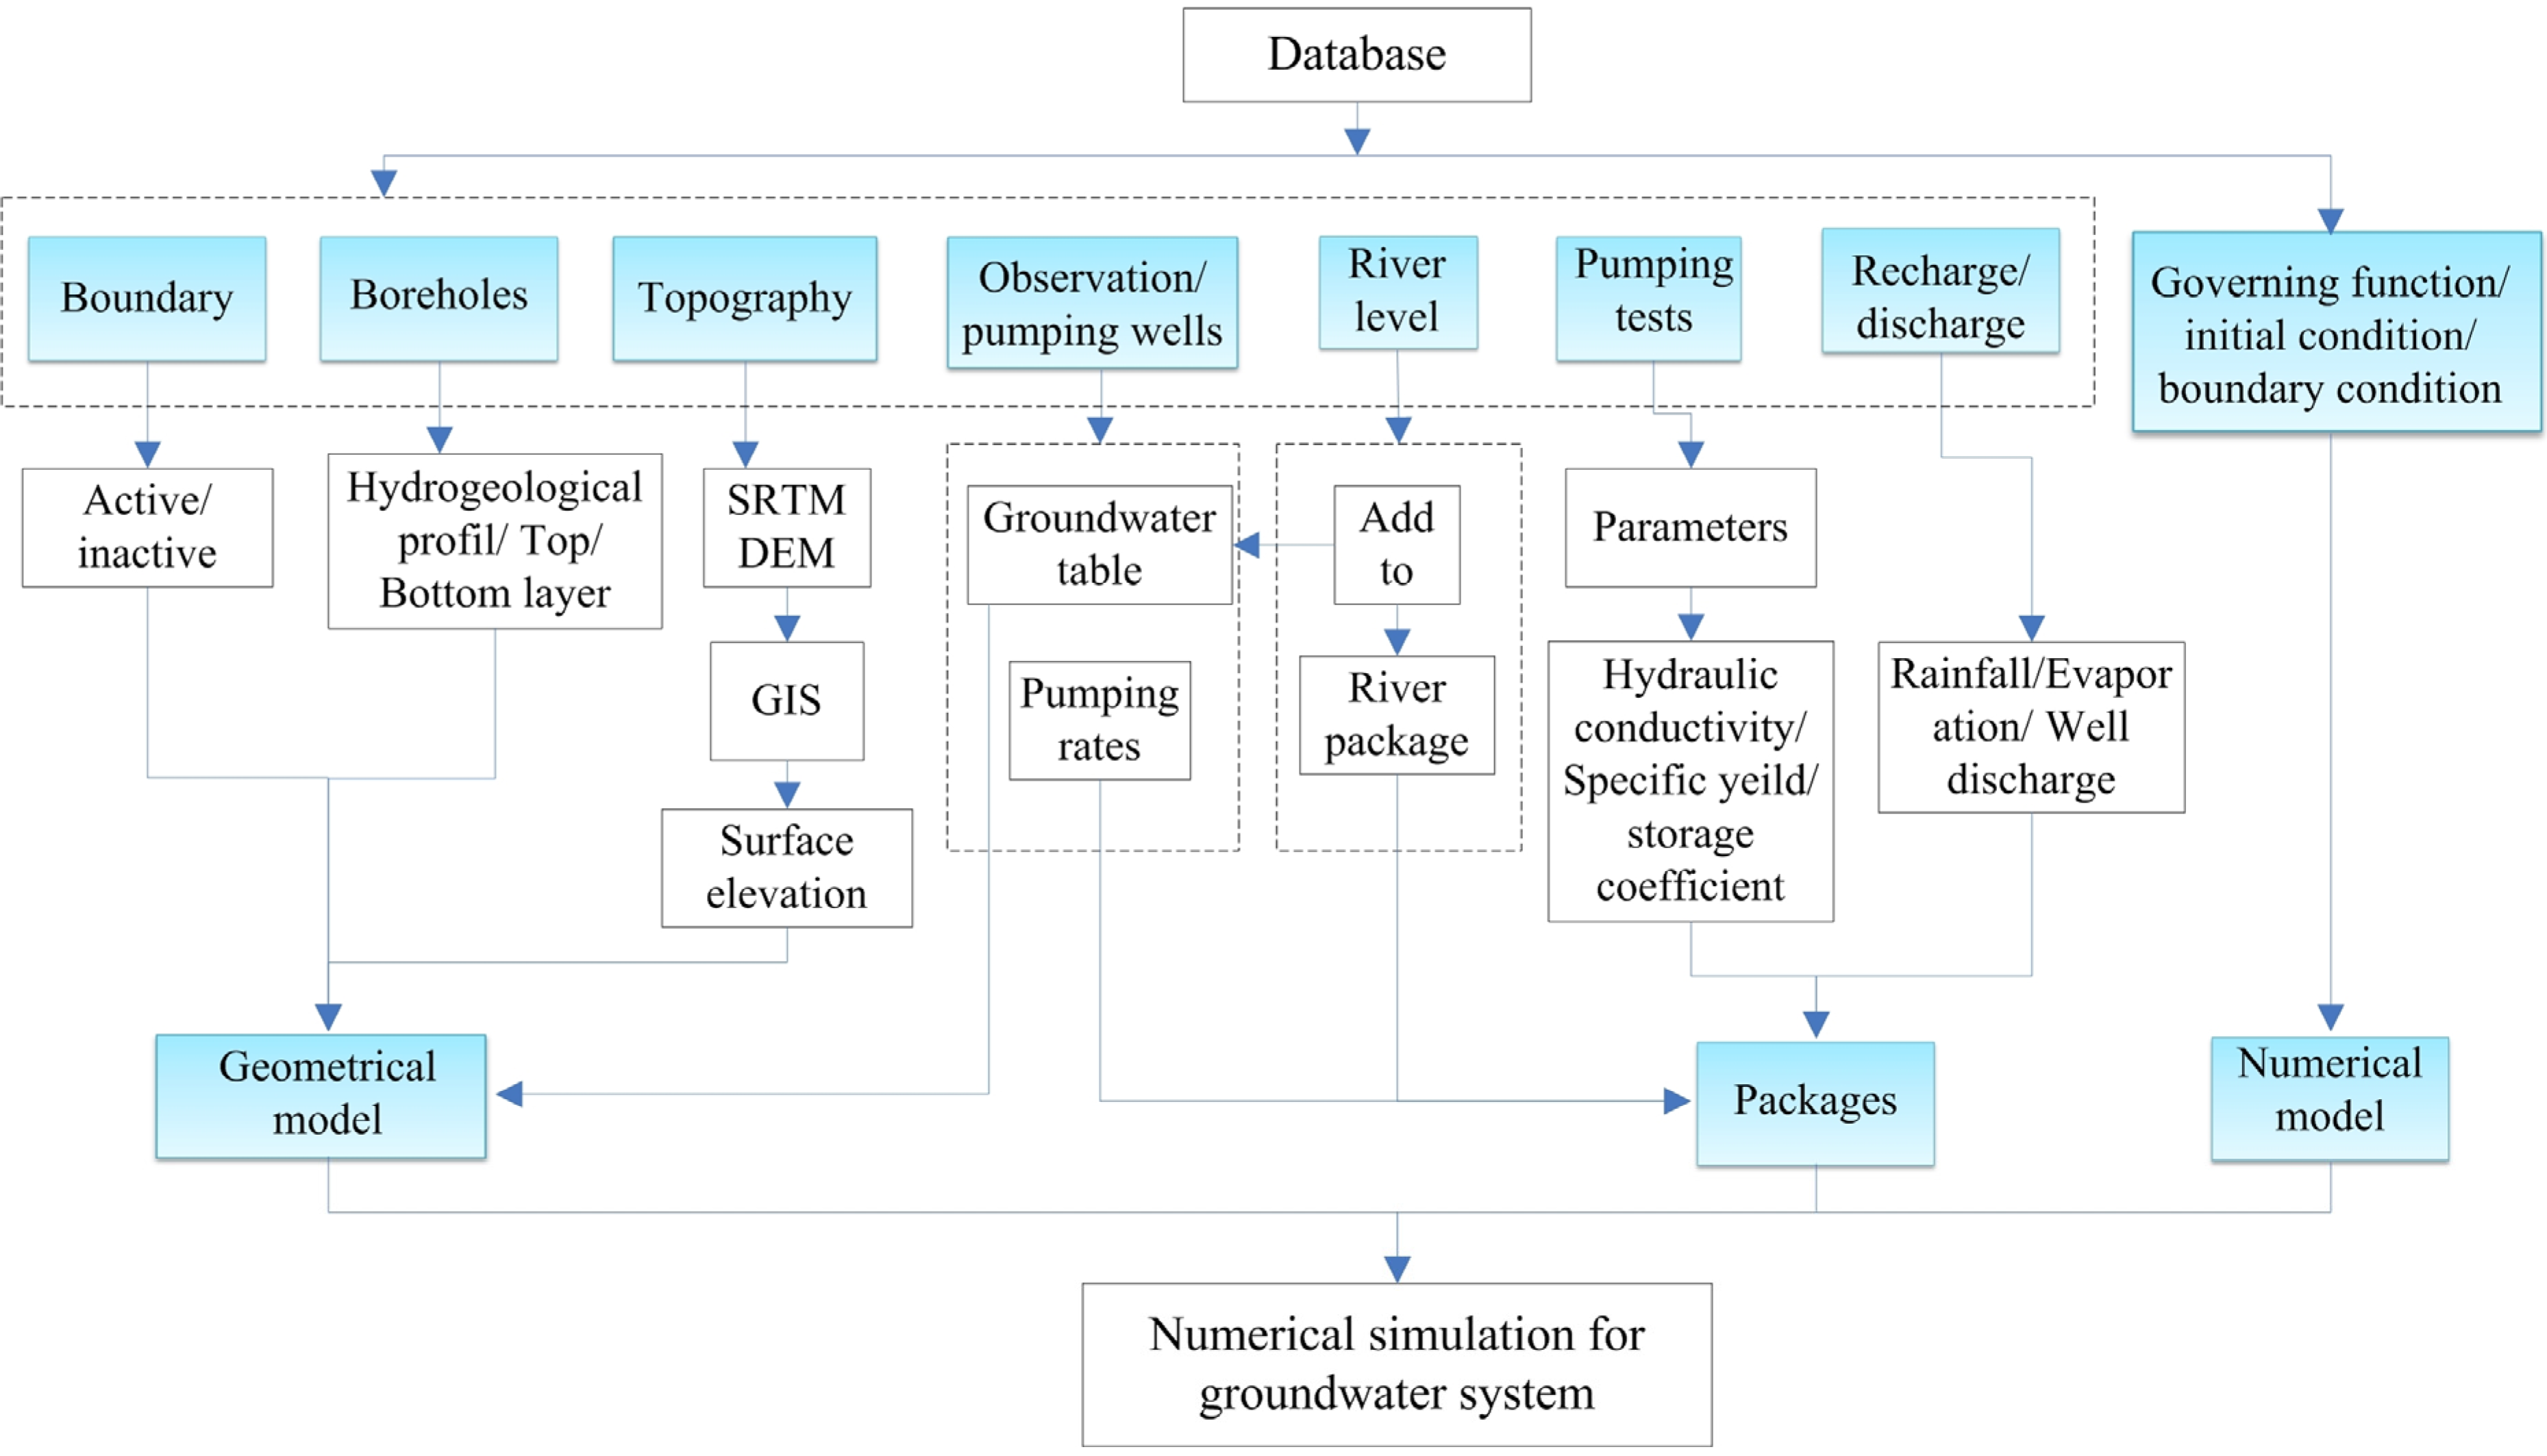
In this paper, GIS was used for analyzing geographic information while conceptualizing hydrogeological systems. All GIS data required for conceptual modeling were converted to the appropriate formats for numerical modeling using ArcGIS 10.0 (ESRI) [6]. The database and groundwater modeling include some stages, which are shown in Figure 2.
Figure 2. Procedure for data processing and groundwater modeling studies.
Water 07 05768 g002

2.1. Study Area

The JUA covers 1267.89 km2 and is located between 4840,000 and 4905,000 north and 260,000 and 320,000 east in the central of Jilin Province, China (Figure 1). JUA has a population of 1.60 million and is an important irrigation and industrial district of China. JUA belongs to the hilly area of Changbai Mountain, and the Songhua River valley plain. JUA stretches from the Xiaobai, Jian, and Mao mountains in the south to Aolongbei, Jiabanling, and the Tiger mountains in the north. It belongs to the temperate zone continental climate. The mean annual rainfall for the last 30 years (from 1981 to 2010) is 580–670 mm and the average evaporation from land is 367 mm (Figure 3). Average yearly temperature is 3.9 °C, with moderate warm summers in July with an average temperature of 21 °C–23 °C and cold winters in January with an average temperature of −20 °C to −18 °C. The second Songhua River, which is the largest river in Jilin province, flows across JUA in a south–north direction. There are four tributaries (Wende River, Mangniu River, Aolong River, and Tuanshanzi River) of the second Songhua River and 10 smaller branches that flow across the JUA (Figure 1). According to the discharge data of the Jilin hydrologic station from 1954 to 2010, the mean annual discharge of the second Songhua River was 414 m3/s. JUA can be divided into irrigation and industrial zones that are divided by Jiuzhan.
Figure 3. Annual precipitation and evaporation of the study area for the last 30 years.
Water 07 05768 g003

2.2. Geological and Hydrogeological Condition
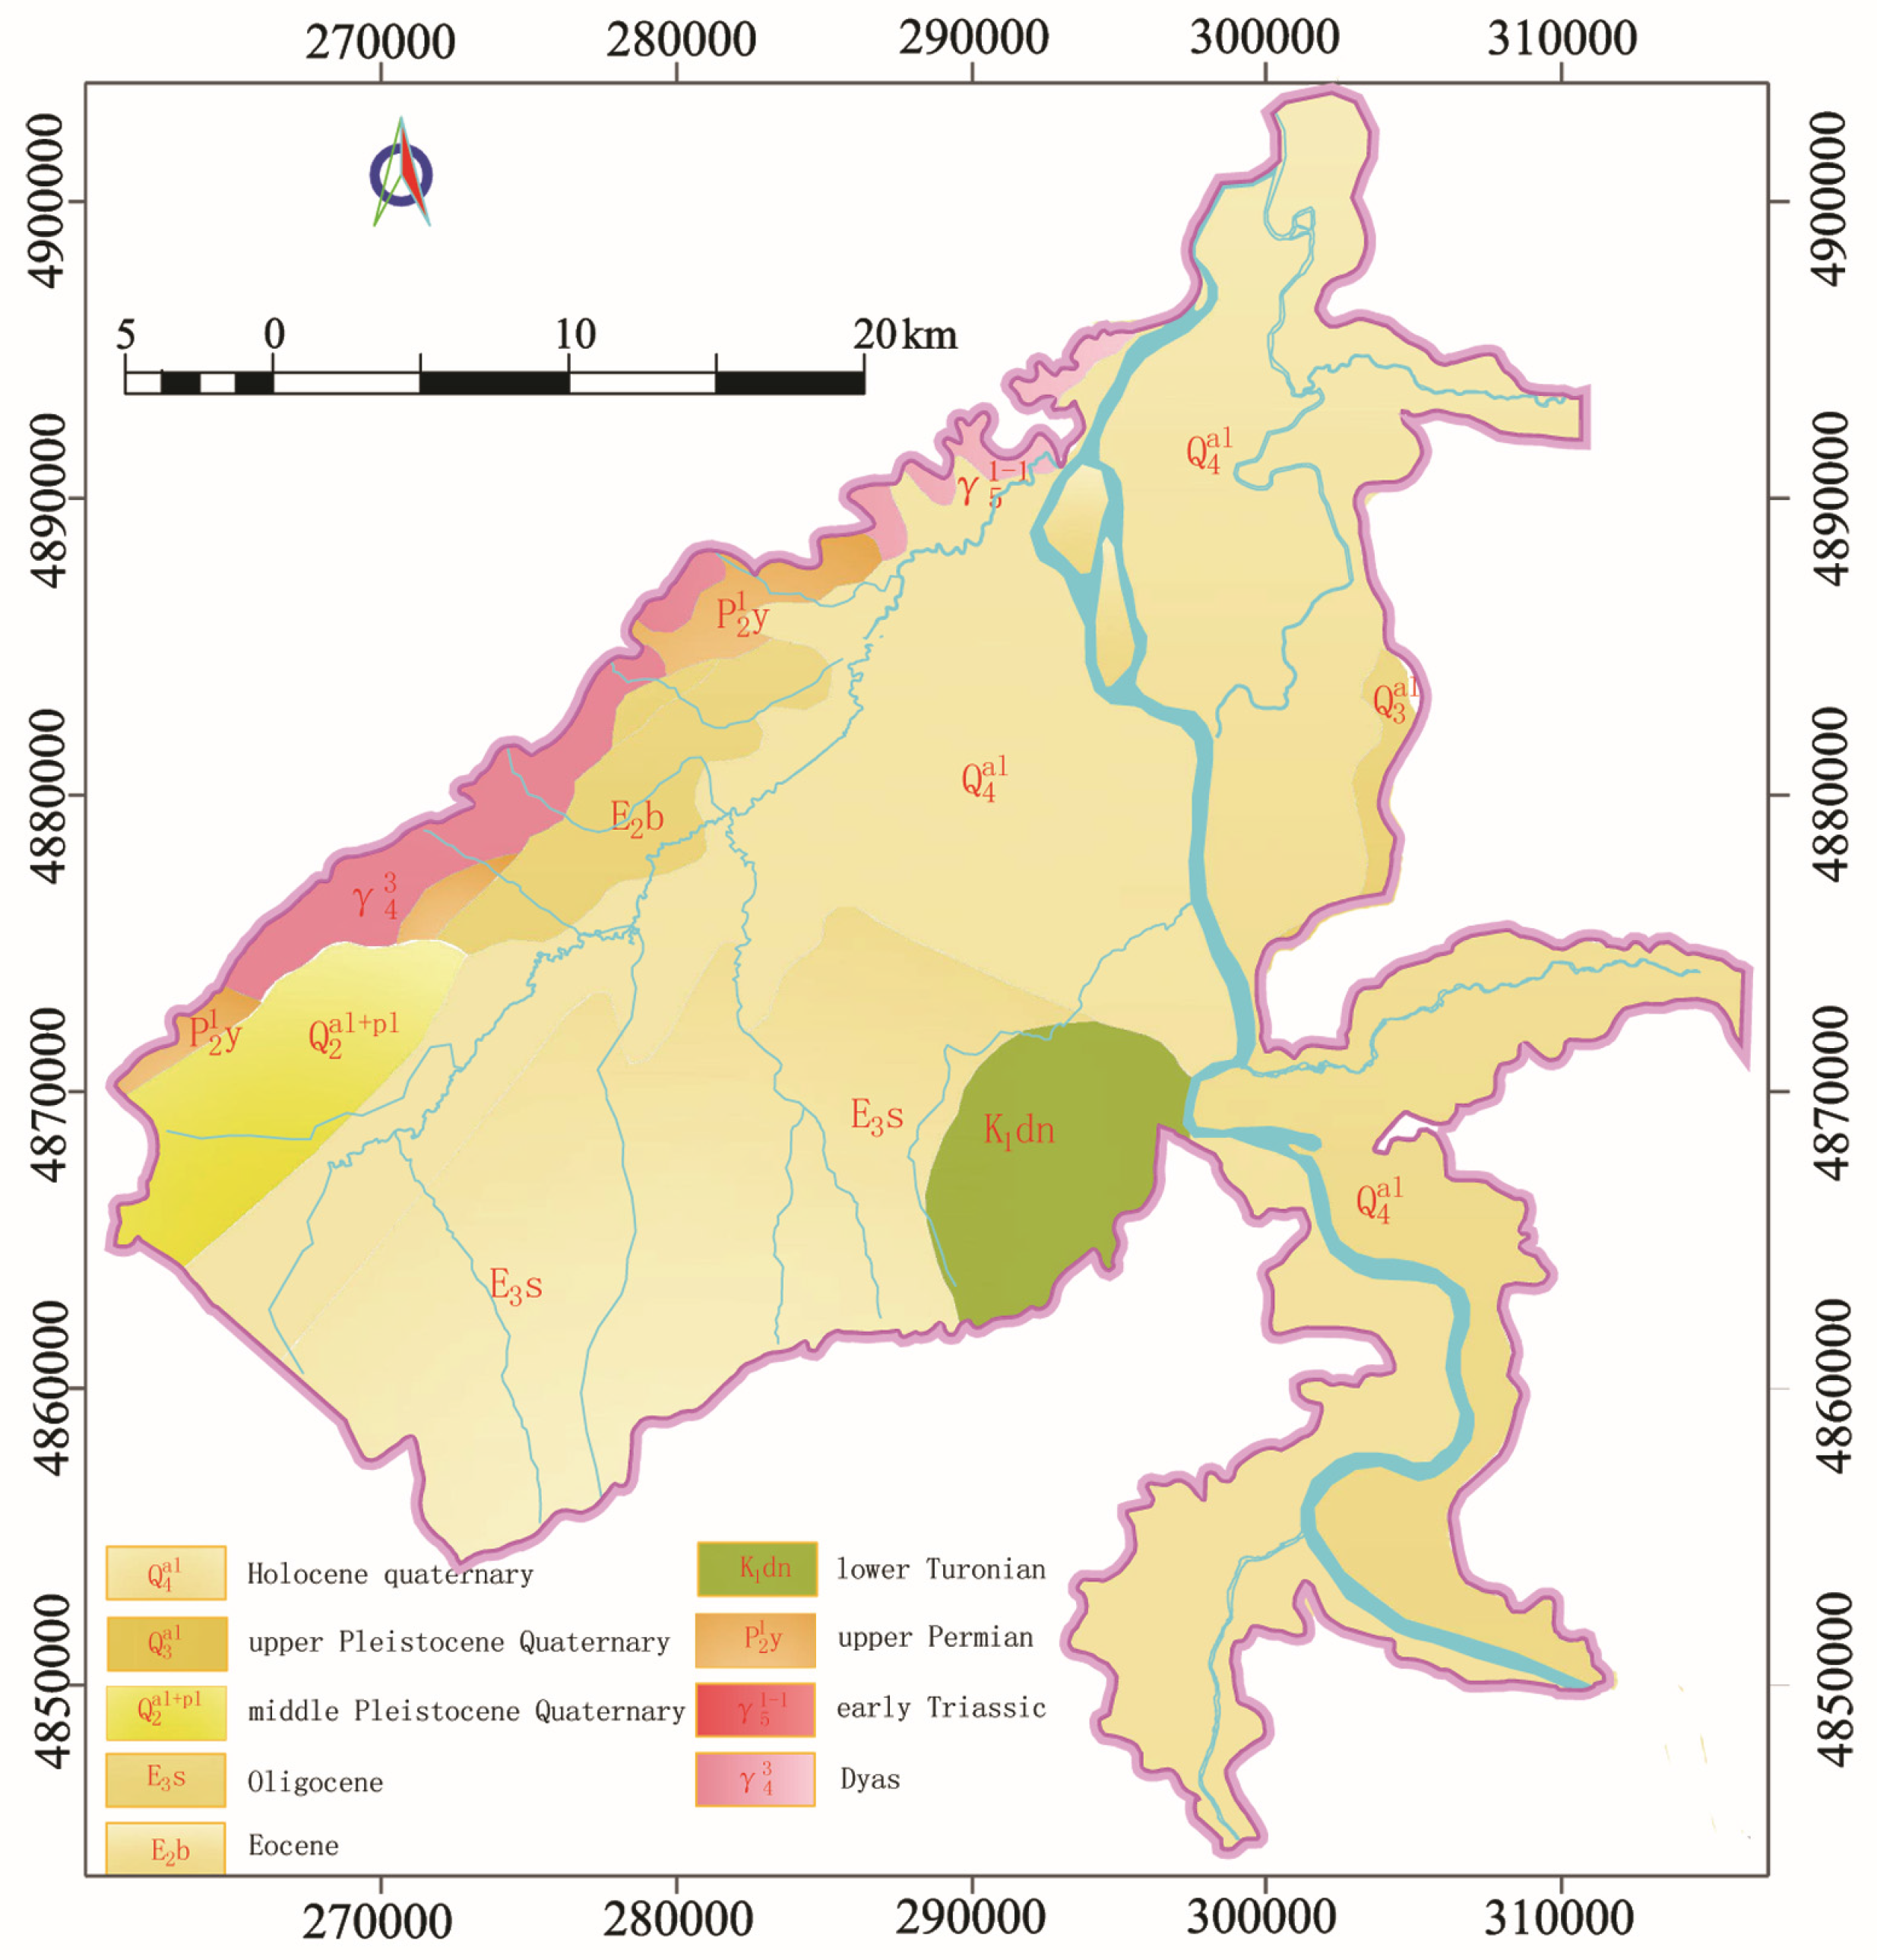
The lithological map of JUA (Figure 4) was obtained using the published geological maps and borehole data. An aquifer formed in Quaternary unconsolidated sediments consisting mainly of clays, sands, and gravels is broadly distributed within the JUA. The oldest sediment outcropping in the JUA is the Permian (tuff), and the Cretaceous system bedrock (sandstone).
Figure 4. Geologic map of JUA.
Water 07 05768 g004
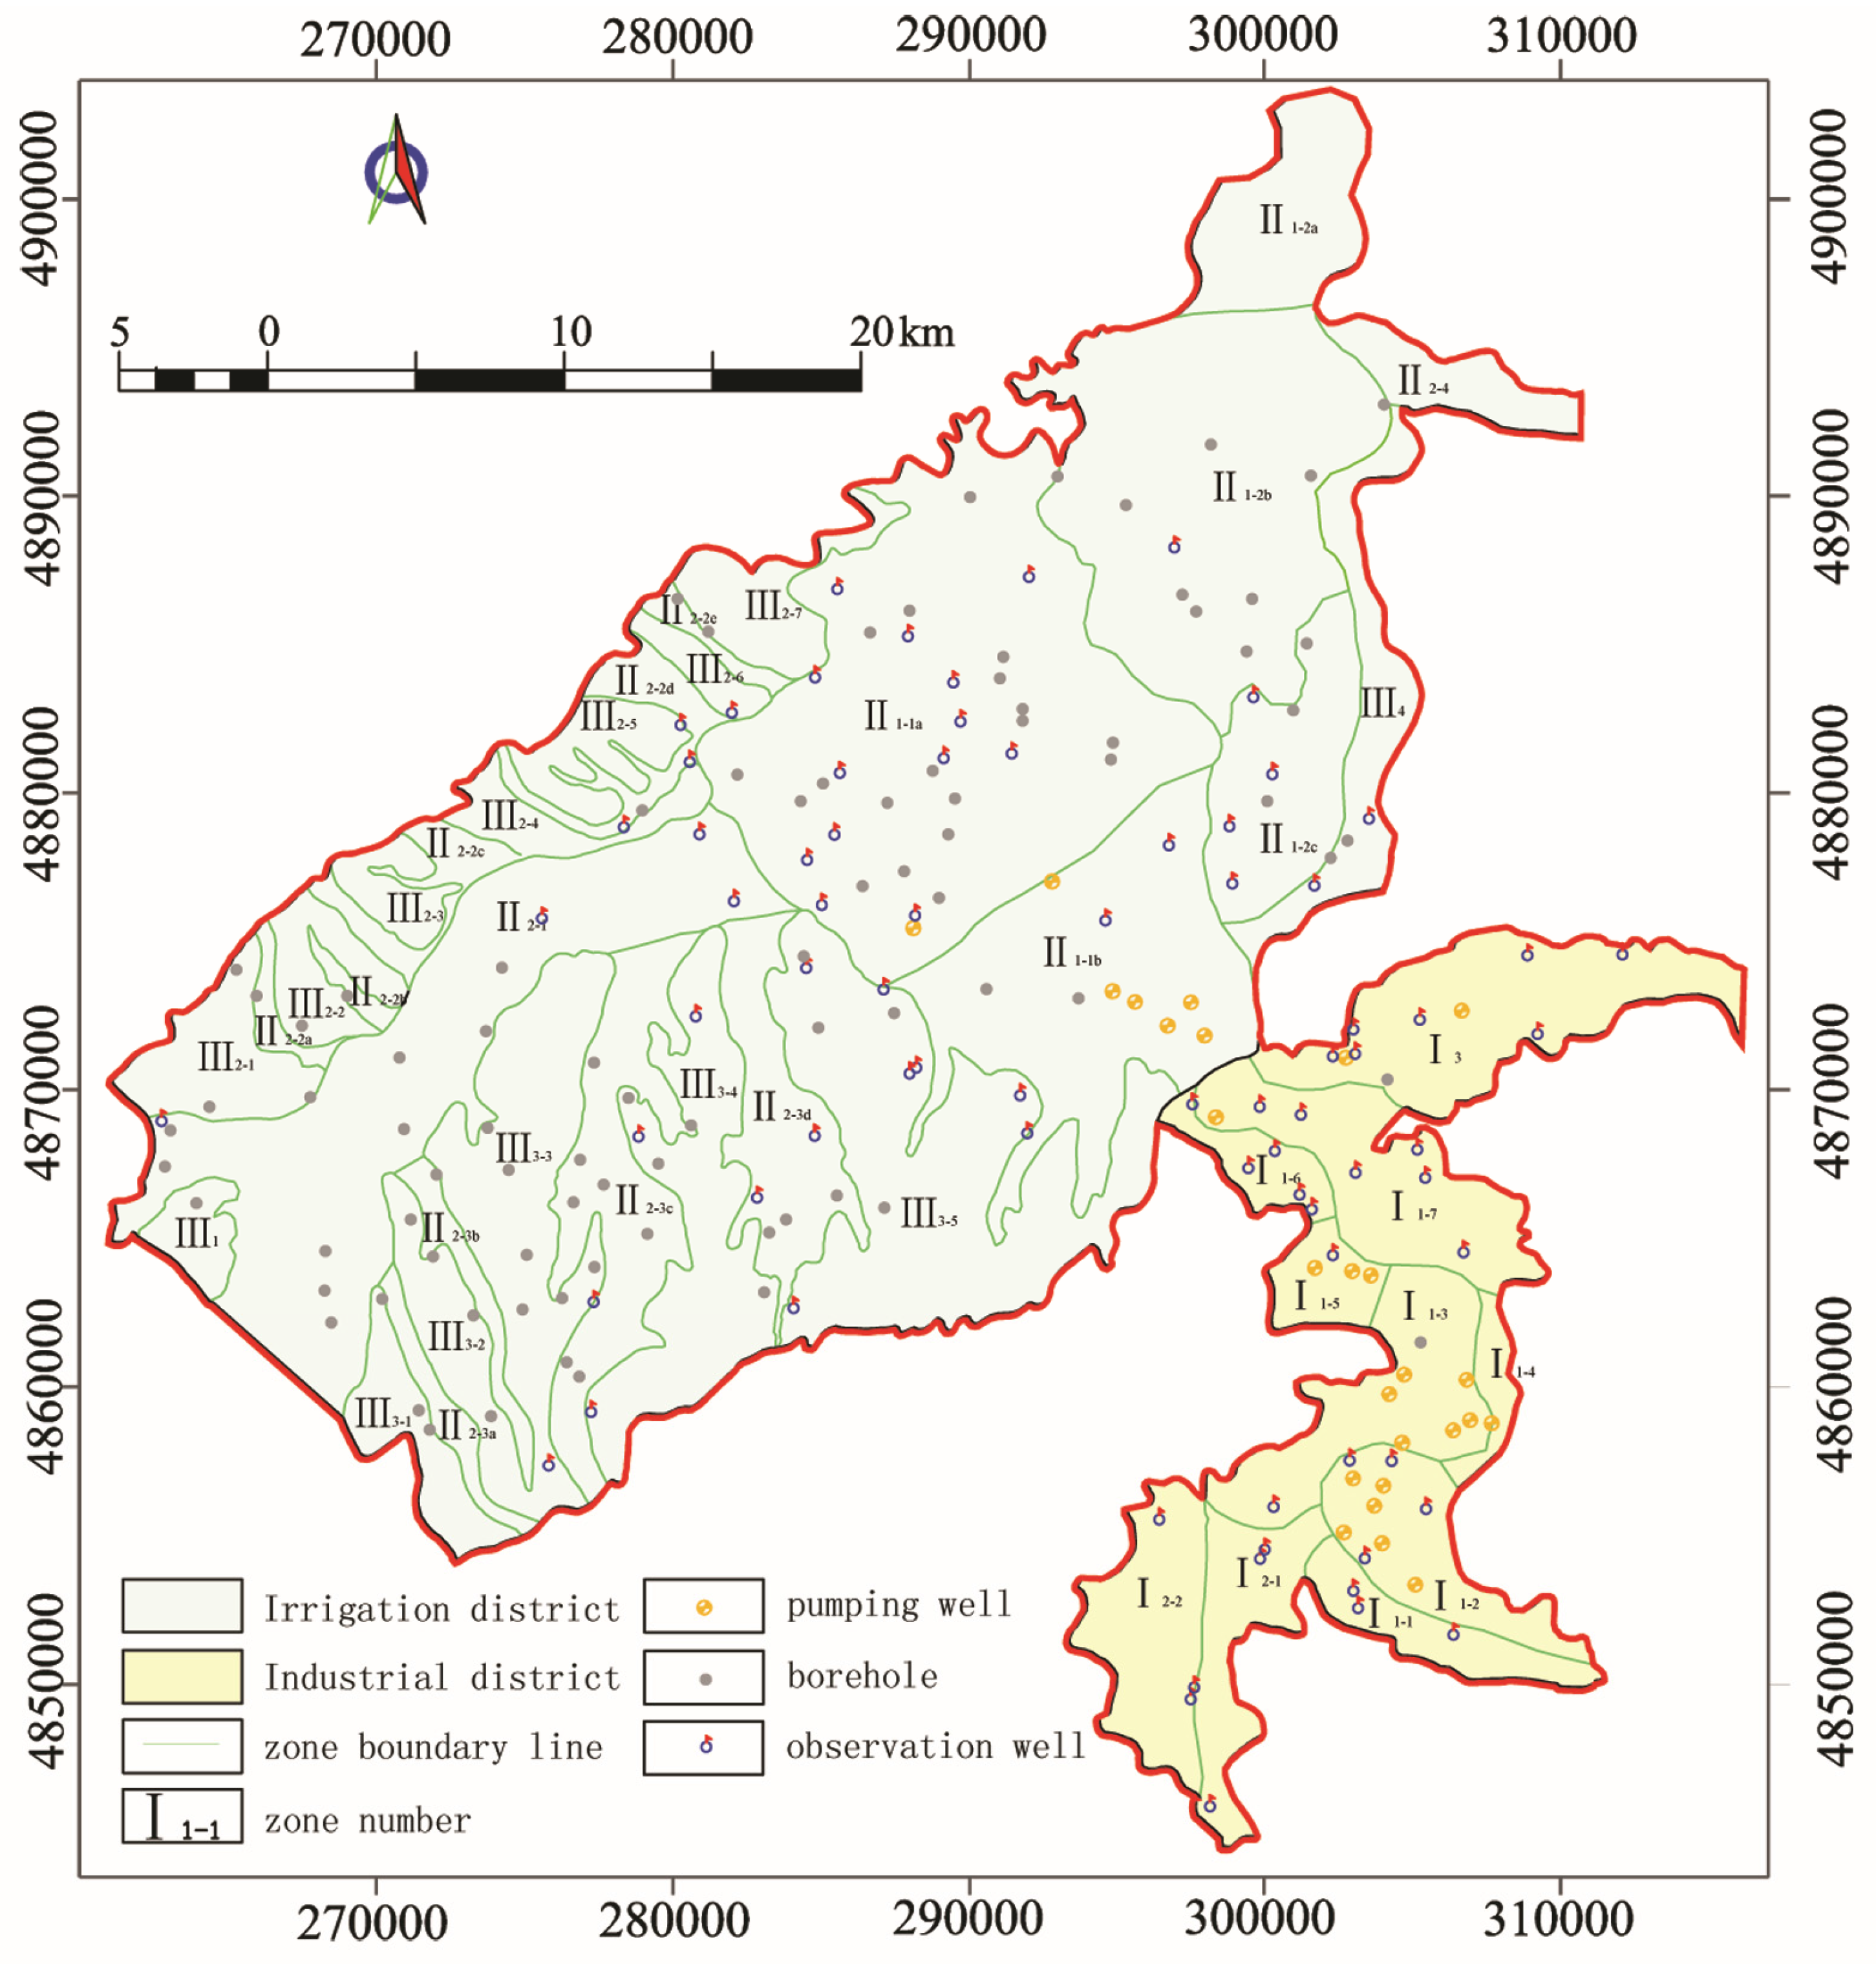
The study area is divided into three hydrogeological zones according to the locations and geomorphic units (Figure 5). Zone I is the valley of the upstream of the second Songhua River, the Wende River and the Mangniu River, Zone II is the valley of the Aolong River, and Zone III is the platform area. The study area can be divided into 37 sub-regions according to the boundary conditions, the water yield properties, the difference of the landforms, the precipitation and irrigation conditions, and the exploitation of the groundwater. The irrigation zone is in the North and the industrial zone is in the South (Figure 5).
Figure 5. Location of the boreholes, observation and pumping wells and zones.
Water 07 05768 g005
The aquifer formed by the Quaternary unconsolidated deposits is simulated in this work. The thickness of the Quaternary unconsolidated deposits is variable. Three cross-sections are made (location of the section lines in Figure 1) and presented in Figure 6 to analyze the sequence of the layers. The cross-section of the study area shows that the thickness of the Quaternary deposits is variable, from 20 to 70 m of sand and gravel deposits in alluvial fans and less than 5 m in the upland areas. The thickness of upper unconfined Quaternary aquifer (loam and clayey silt) is 2–35 m.
Figure 6. Hydrogeological cross-section of Jilin study area (location of the section lines in Figure 1).
Water 07 05768 g006

3. Numerical Model Development

Geological insight and interpretation are crucial, because a conceptual model of the system based only on hydraulic data would be incorrect and misleading [29]. Development of a numerical groundwater model usually requires two steps: developing an accurate geological model that integrates all relevant data; and building a groundwater flow model based on the geological model to numerically represent the conceptual groundwater system.

3.1. Geological Model

High-quality data are very important for constraining physical and hydrogeological conditions [30]. All relevant features, such as topography, digital elevation model (DEM), borehole data, geological structure, drainage density, groundwater flow, and boundary conditions of the aquifer system are very important for setting up the model [31,32].
A total of 190 borehole data points and 75 observation data points were collected, and integrated in GMS to build the geological model. The hydrogeological profiles were drawn to control the interpolation of the top and bottom layers in the conceptual model. There are two hydrogeological systems in the JUA aquifer system. The shallow system is made of silt and the deep one is made of sand and gravel. The hydraulic connection is good between the two systems in the valley region because they are all unconfined aquifers.
The surface elevation is very important in groundwater numerical simulation as the groundwater level, evaporation, and infiltration have a close relationship with the surface elevation. A 1:50,000 topographic map is used to integrate the geological field mapping data, but the contour interval of the 1:50,000 topographic map is 50 m; in the hilly regions it is enough to describe the terrain, but it is rarely enough to describe the terrain in valley districts because of subtle terrain changes. The surface elevation cannot be delineated by only using the borehole data because of the JUA’s large area. Therefore, the JUA was delineated using the Shuttle Radar Terrain Mapping (SRTM) digital elevation model (DEM) data with 90 m resolution from the US Geological Survey (USGS) [33,34]. ArcGIS 10.0 software was used to reset the resolution of the SRTM DEM. Lambert Conformal Conic was adopted as the projection between SRTM and GMS. The Gauss-Krueger projection and Beijing1954 Coordinate System were selected to integrate the different spatial data [35]. ArcGIS was used to analyze, pick up, and section the data and set the contour interval at 10 m. The lines were directly read by GMS and used to scatter the 2D scatters. Then, the 2D contour map was obtained by interpolating the 2D scatters, and the elevations of the 190 boreholes were interpolated to revise the error of the SRTM DEM.
JUA is bounded by the mountains on the south, east, and west and the river on the north. The grid cells were designated as “inactive” and “active”, outside and inside, respectively, the model domain. The boundaries between the shallow and deeper systems are different as the sand and gravel pinch out and the rocks outcrop. Figure 4 shows that the gravel strata is thinning up in the boundaries, and the geologic model will be anamorphic in the boundary using Kriging that was based on the borehole data distributed throughout the valley. Interpolating boreholes are needed for boundary constraint. The hydrogeological cross-section and the borehole near the boundaries were especially important as constraint conditions.
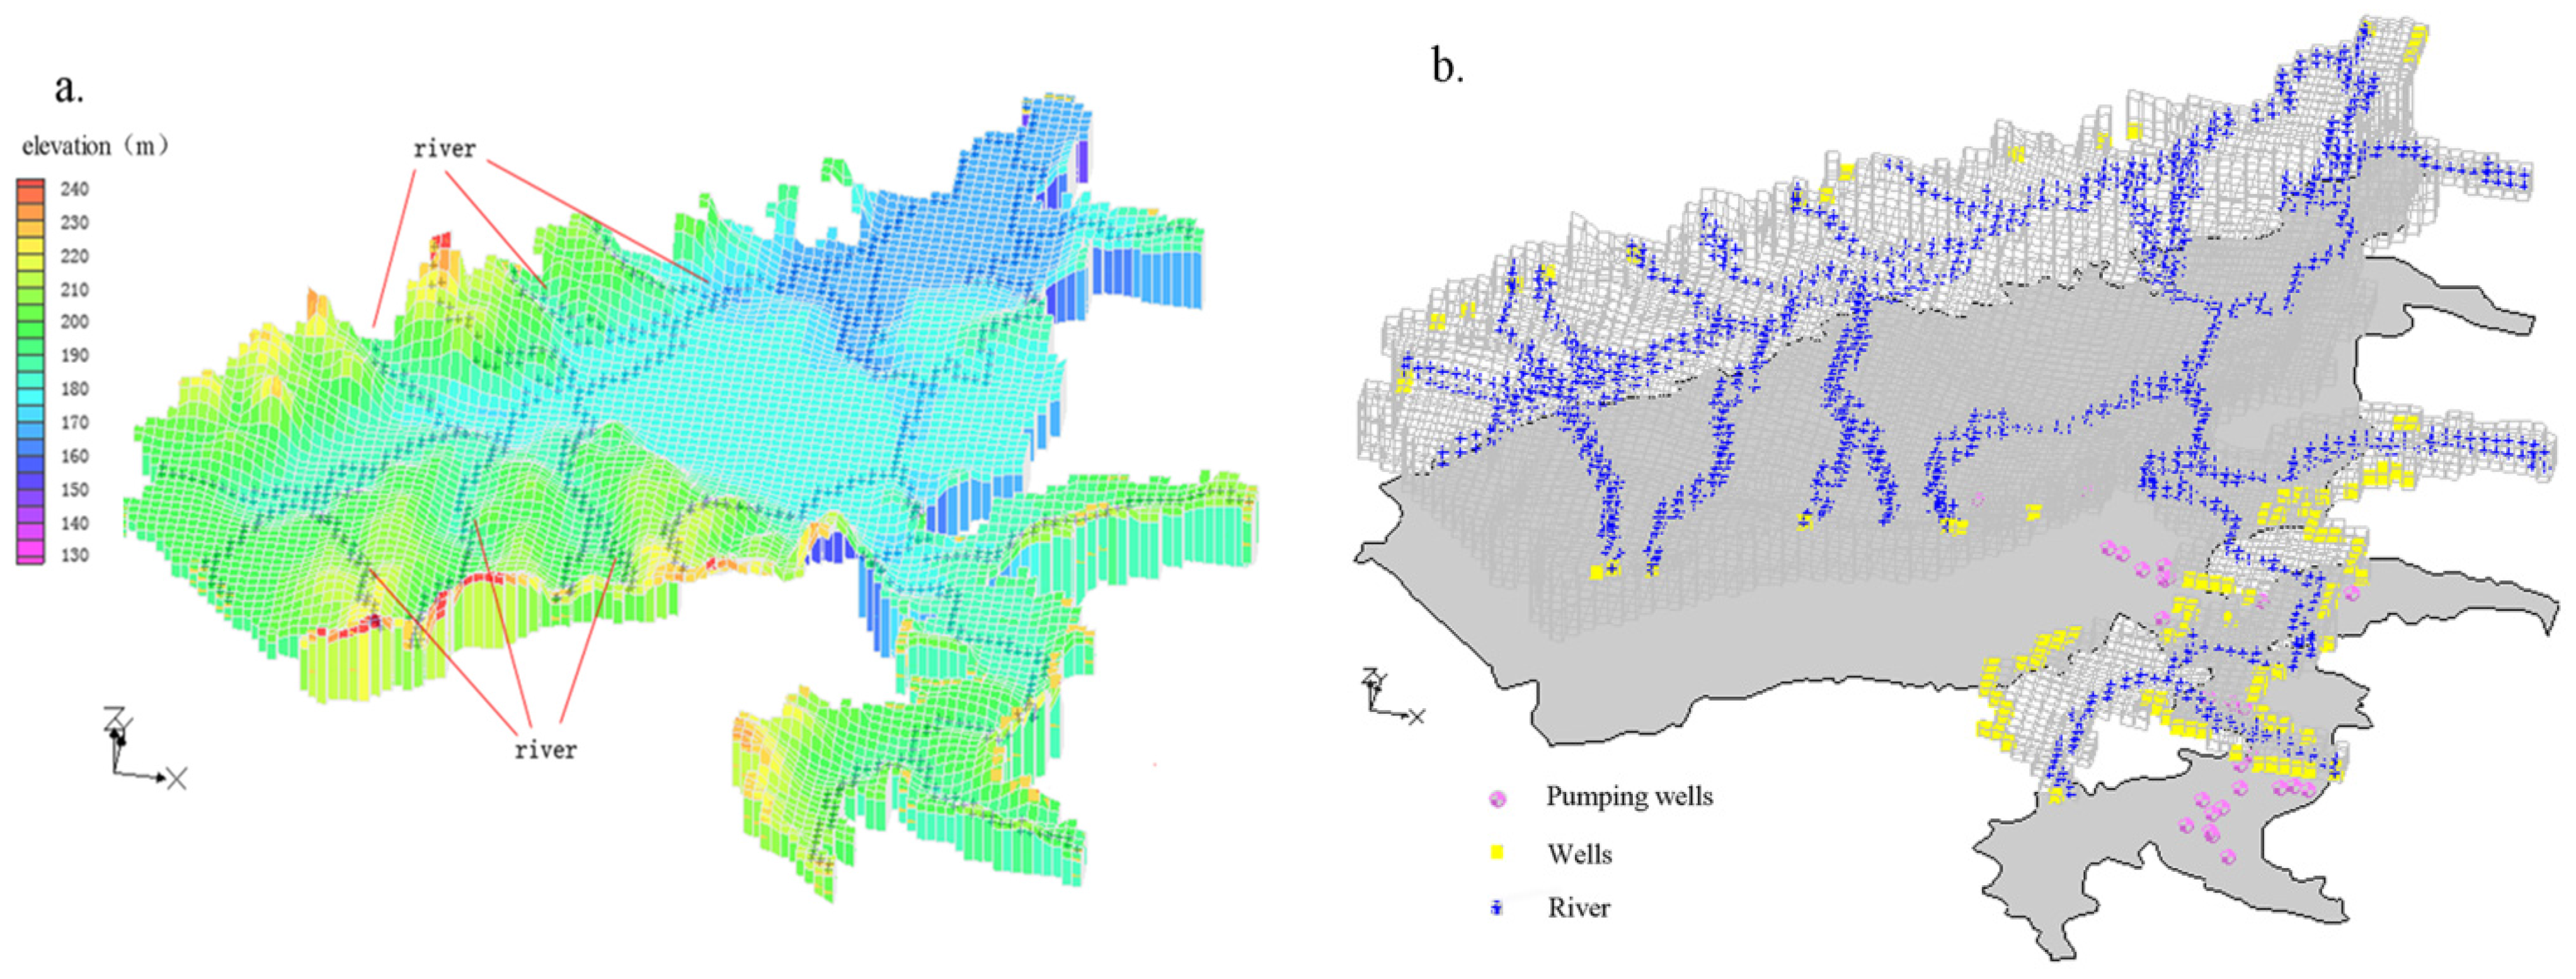
The top and bottom layers and the groundwater table were interpolated using data from the 190 boreholes; artificial interpolating is needed in the districts where the thickness of lithology changes greatly. The geometrical model of JUA is shown in Figure 7a.
Figure 7. Geometrical model of JUA. (a) Geometrical model solid and elevation; (b) Grid, boundary conditions and pumping wells locations of the model.
Water 07 05768 g007

3.2. Groundwater Flow Model

3.2.1. Model Discretization

A groundwater flow model in the JUA was built using MODFLOW-2000 in GMS. The area of JUA is 1267.89 km2 and it is assumed to be a rectangular shape. The grid cells were designated as “inactive” outside the model domain and as “active” inside the model domain. The model was divided into 120 rows and 124 columns with the size of each cell being 500 × 500 m. The model includes two layers to represent the hydrogeological condition and data on the porous aquifers at the study site. The simulation period was from 1 January 2001 to 31 December 2010, with 120 stress periods defined for the simulation. Two time steps were defined for each stress period. Groundwater levels observed in 2001 were used as the initial conditions of the model.

3.2.2. Boundary Conditions

The boundary conditions are shown in Figure 7b. For the lateral boundary conditions, the Dirichlet boundary condition and the Neumann boundary condition exist in the model. The river boundary is the Dirichlet boundary condition because there is a good connection between the groundwater and the river. In the interface of hilly regions and at the places perpendicular to the groundwater flow direction, the boundary is defined as a “no flow” boundary as they are impermeable boundaries. Along the ground water flow direction, the boundary is defined as a “specific flow” boundary. The flow rate is based on the hydraulic conductivities (K), the thickness (M), and the hydraulic gradient (I). The flow boundary was defined as wells in MODFLOW. For the vertical boundary conditions, the top boundary was defined for recharge and discharge flux, infiltration of precipitation, irrigation, river leakage, pumping wells, and phreatic water evaporation on the surface of the water table. The bottom boundary condition at the base of the deep aquifer was treated as no-flow boundaries.

3.2.3. Parameters

The formation and distribution of groundwater is controlled by the formation lithology, the geologic structure and the geomorphologic shape. The field geological observations show that the porous aquifer consists of quaternary clay, sands and gravel, and is the main aquifer in the study area. The fissured aquifer before Quaternary is undeveloped and forms a lower confining bed. Pumping test data from more than 260 tests were obtained from previous hydrologic studies and used to quantify hydraulic characteristics of the aquifer and identify the boundary conditions [36]. The Theis equation and Cooper-Jacob graphical method were used to calculate parameters such as hydraulic conductivity (K) and specific yield (μ). For the sand and gravel aquifer, the calculated K ranges from 10 to 80 m/day, and µ ranges from 0.1 to 0.3. The final results in every zone are shown in Table 1. K is used to identify the boundary conditions.

3.2.4. Recharge and Discharge

Precipitation and withdrawal are the main recharge and discharge, respectively, in JUA. Irrigation is prominent from May to October, the growing season, in every year. The quantity of irrigation is based on the Jilin province Local Standard of Water Quota (DB22/T 389-2010) [37]. Irrigation water is derived from river and groundwater pumping in the irrigation district, but wells in the district are not monitored, so area features were used to simulate the withdrawal of irrigation water with the recharge (RCH) package [38]. The direct evaporation and evapotranspiration (ET) package are based on the data of the four meteorological stations.
Table 1. Final parameters results for each zone.
Zone NumberLayer NumberHydraulic Conductivity (K) (m/day)Specific Yield (μ)Zone NumberLayer NumberHydraulic Conductivity (K) (m/day)Specific Yield (μ)
I1-110.830.06II2-2d10.830.06
240.000.20210.000.15
I1-210.700.07II2-3a10.800.08
280.000.30210.000.15
I1-310.830.06II2-3b10.800.08
280.000.25210.000.15
I1-410.700.07II2-3c10.800.08
215.000.13210.000.15
I1-512.000.11II2-3d10.800.08
210.000.18210.000.15
I1-611.000.07II2-412.100.15
236.000.20225.000.16
I1-710.830.06III110.800.08
280.000.2525.000.12
I2-110.800.07III2-110.300.05
240.000.2525.000.12
I2-210.750.06III2-210.300.05
240.000.2025.000.12
I310.830.08III2-310.300.05
220.000.2025.000.12
II1-1a11.000.13III2-410.300.05
216.000.1525.000.12
II1-1b12.000.11III2-510.300.05
218.640.1925.000.12
II1-2a12.700.14III3-110.700.06
260.000.2029.000.15
II1-2b12.600.13III3-210.700.06
227.000.1629.000.15
II1-2c11.000.11III3-310.700.06
220.310.1429.000.15
II2-110.600.05III3-410.700.06
213.000.1527.000.15
II2-2a10.830.06III3-510.700.05
210.000.1527.000.10
II2-2b10.830.06III410.960.08
210.000.15210.000.10
II2-2c10.830.06
210.000.15
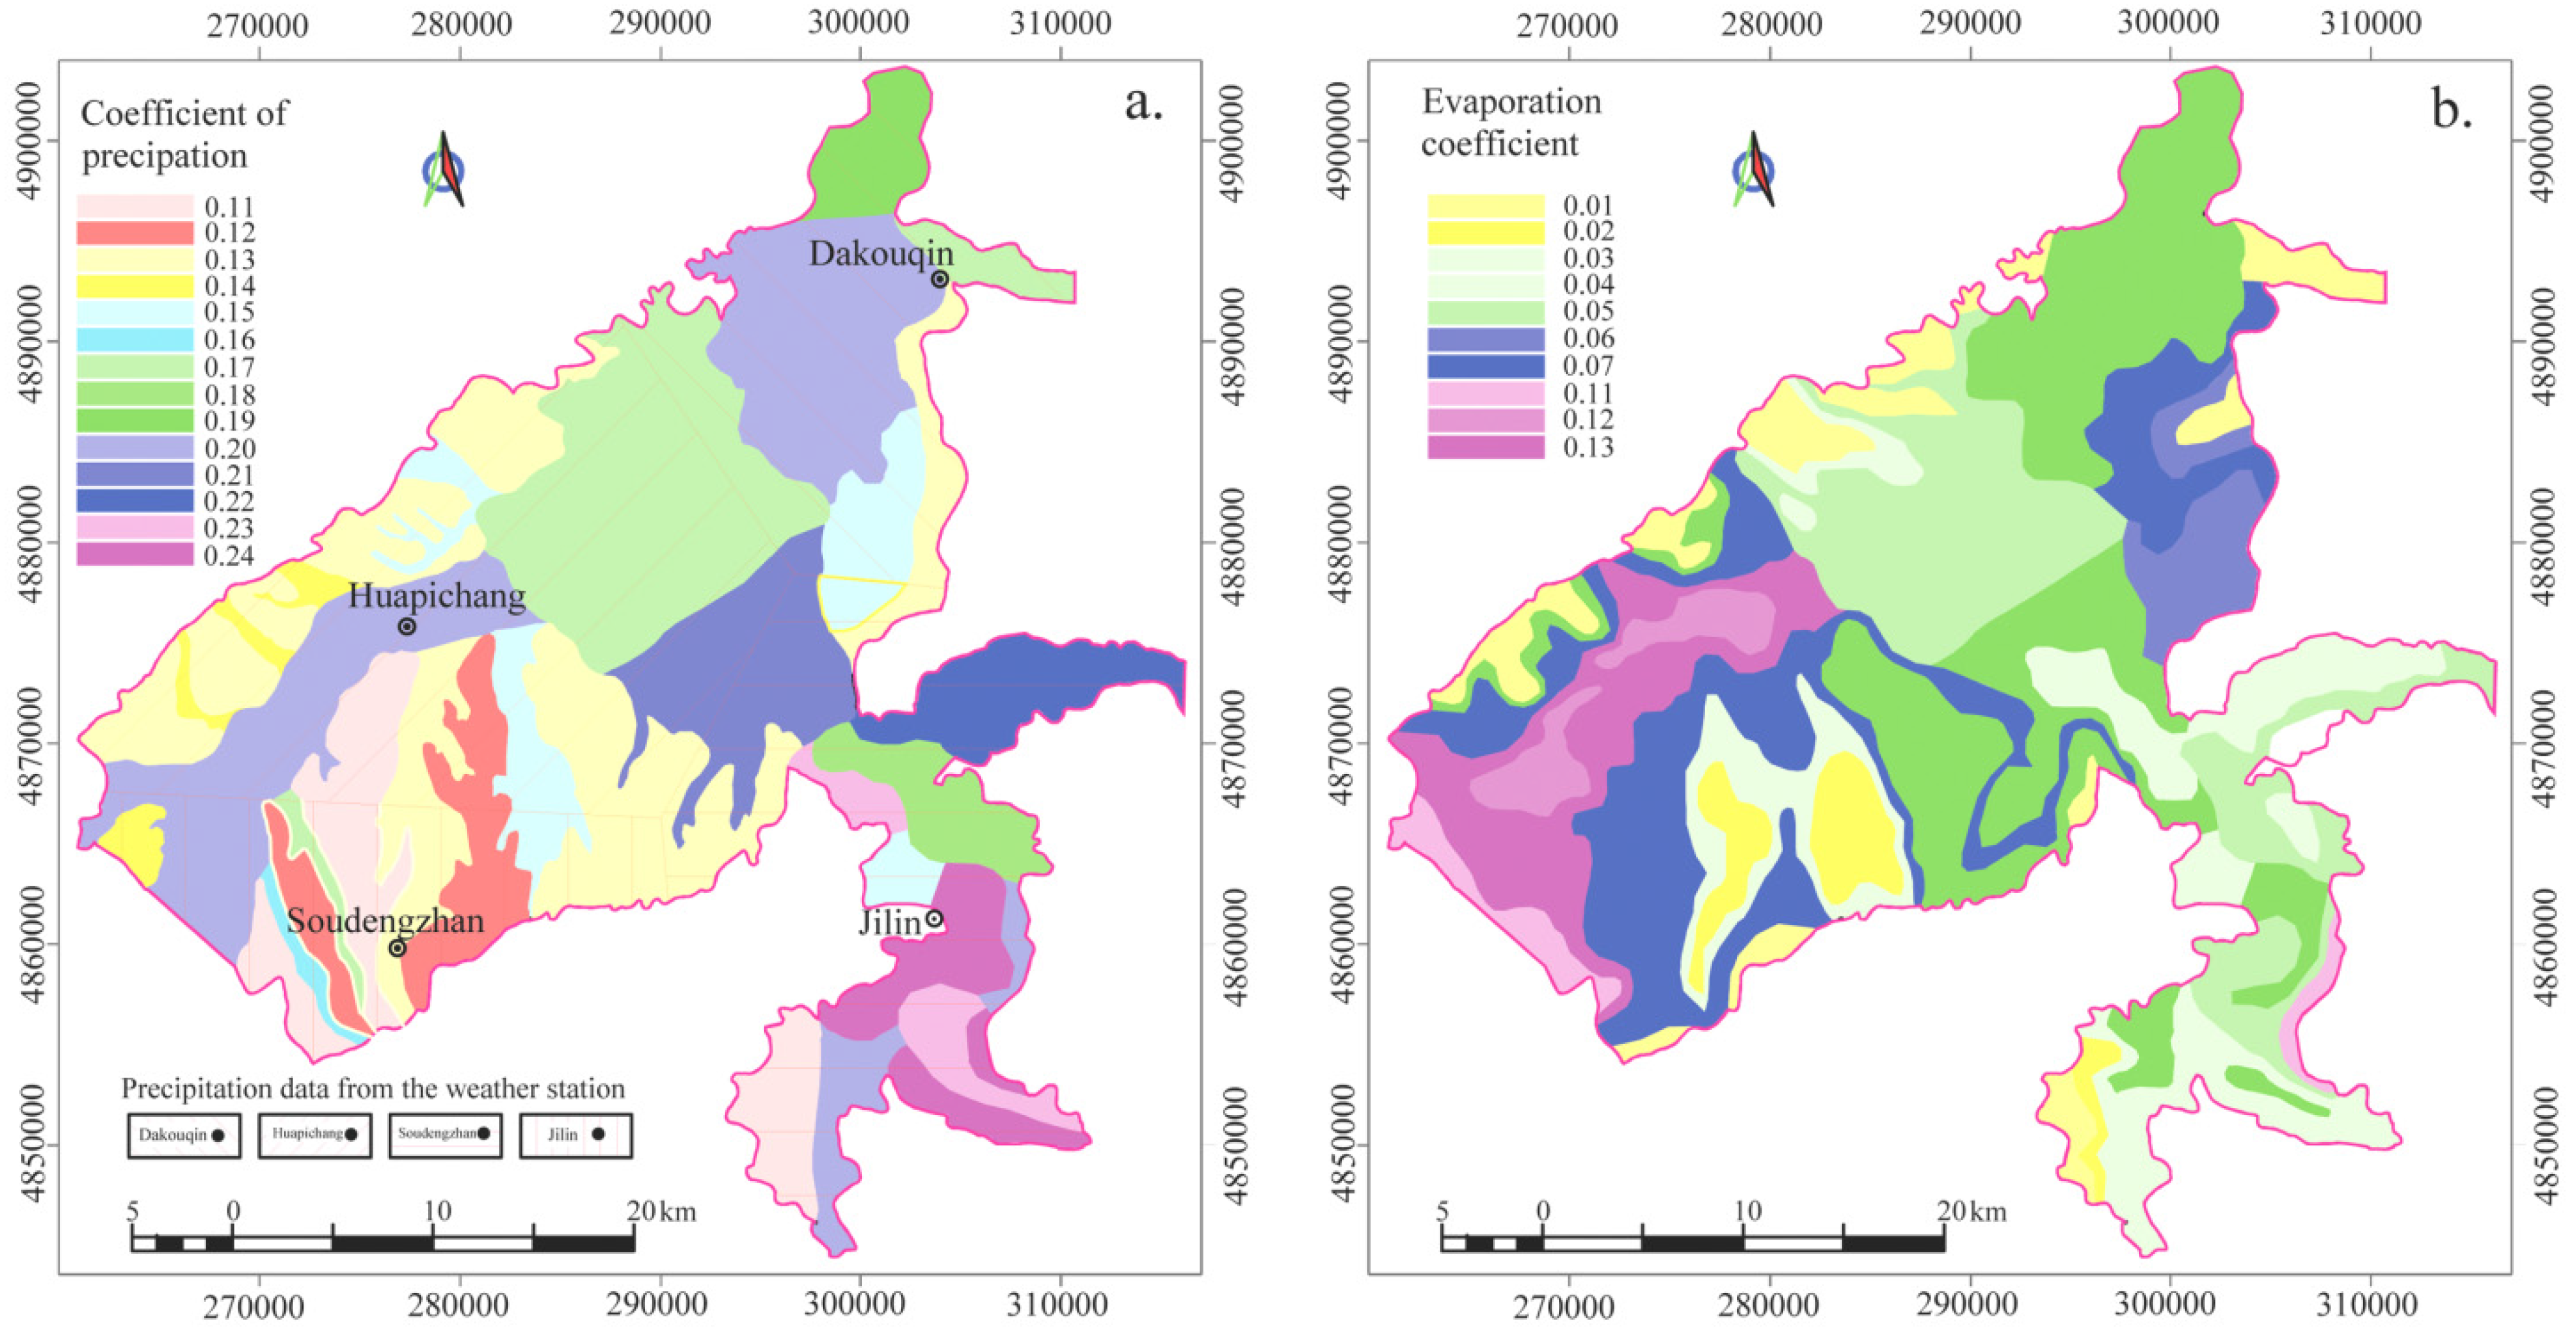
The precipitation (positive recharge rate) is simulated with the RCH package as well as the irrigation (positive recharge rate), and irrigation from groundwater pumping (negative discharge rate); however, the recharge package does not allow for recharge and discharge to occur simultaneously in the same vertical column [10]. Therefore, precipitation and irrigation were superimposed using Microsoft Excel and assigned to the area as a transient recharge rate to the first layer. In the ET package, the parameters of elevation, ET extinction depth, and maximum ET rate are needed. The evaporation extinction depth was 5 m based on reports and literature; the evapotranspiration occurs at the maximum ET rate until the water table rises above the elevation. If the water table elevation lies between these two extremes, the evapotranspiration rate varies linearly with depth [39]. Precipitation, direct evaporation, and irrigation data were collected from Jilin, Dakouqin, Soudenghe, and Huapichang weather stations and the statistical yearbook of the Jilin province. Zone polygons were performed using these four stations by combining the land use, lithology, and the irrigation district, which resulted in 50 recharge zones being defined in the RCH Package and 45 evapotranspiration zones in the ET Package. The zones are shown in Figure 8.
There is a large amount of centralized industrial water in the industrial zone, and the pumping wells are near the second Songhua River; the locations of the industrial pumping well are shown in Figure 5 and the pumping rate is variable with the time. Withdrawal is simulated by the well (WEL) package as point features based on monitoring data. The pumping discharge was based on the 2006 monitoring data. The quantity of irrigation water was large in the agricultural district in the North.
Figure 8. Zones for Recharge (RCH) and evapotranspiration (ET) packages, where different colors represent different zones. (a) Zones are superimposed by precipitation and irrigation for the RCH Package; (b) zones of evaporation for the ET Package.
Water 07 05768 g008

3.2.5. Interaction between Groundwater and Rivers

JUA has an asymmetrical topography. The groundwater level changes substantially because of the varied topography and the crisscross drainage system. Groundwater levels obtained from boreholes were interpolated by Kriging and integrated into the model. There is a good connection between rivers and the aquifer in JUA. Rivers are recharged by groundwater during the dry season, but groundwater is recharged by rivers during the wet season. Rivers are defined as lines in the river package in MODFLOW. Elevation of river water levels and bottoms of each point along the river channel are needed. From Figure 9a we can see that the groundwater level, incorrectly, crosses the river twice in some places. The values of the river stage along the river channel should be added to control the groundwater flow direction when interpolating the groundwater initial head with the existing borehole. There are six steps for interpolating the river stage.
(1)
The 1:50,000 topographic map is imported and registered into GMS and calibrated by using the coordinates in GMS;
(2)
Then, the origin of a river can be defined as (X1, Y1);
(3)
Each coordinate along the river can be read as (Xi, Yi);
(4)
And the length (Li) from each point (Xi, Yi) along the river to the original point on the river (X1,Y1) can be calculated by using the formula below:
L i = i = 2 n ( X i X i 1 ) 2 + ( Y i Y i 1 ) 2
(5)
According to the river stage data (Zi) which are monitored by several hydrometric stations within the Jilin province, the scatters of the river stage (Zi) versus the length (Li) from the river stage to the original point on the river can be obtained (Zi, Li);
(6)
From the trend line of the scatters, we can determine the river stage anywhere along the rivers. (the Songhua River and Mangniu River stage interpolations are shown in Figure 10.
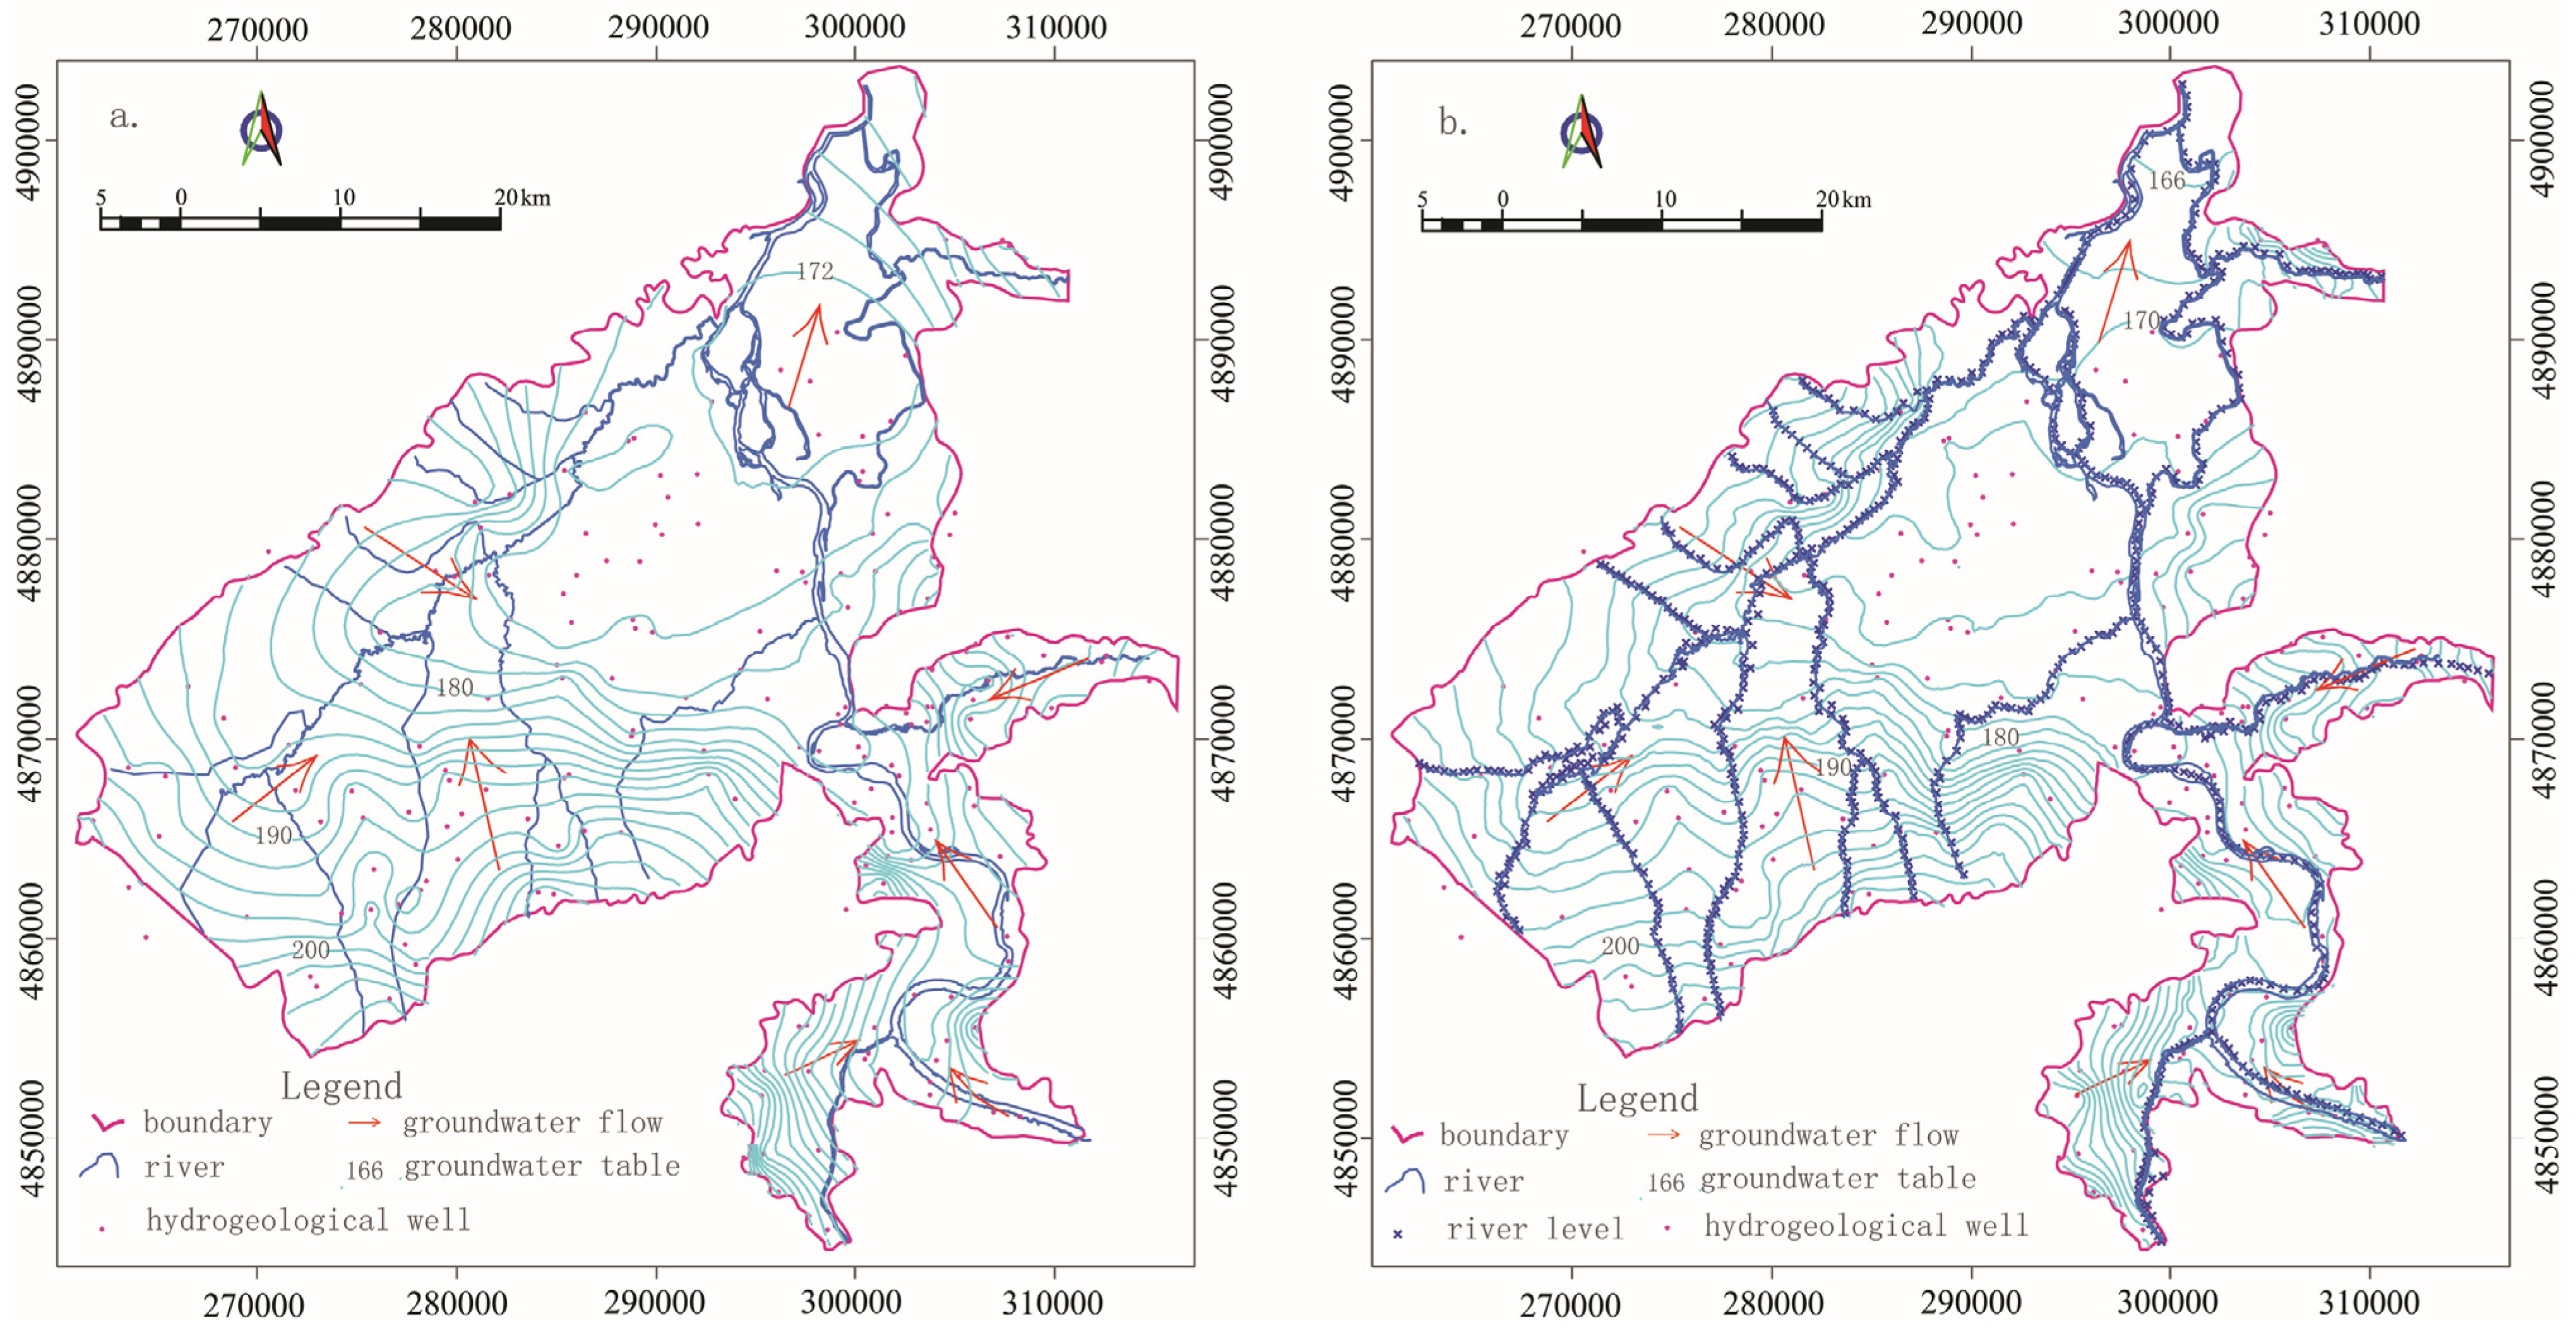
After adding the river stage, the groundwater flow field is shown in Figure 9b.
Figure 9. Groundwater level in JUA (a) interpolated just using the hydrogeological wells and (b) interpolated using the hydrogeological wells and the river stage.
Water 07 05768 g009
Figure 10. Figure10. River stage interpolation in Songhua River (a) and Mangniu River (b).
Water 07 05768 g010

3.3. Model Calibration and Sensitivity Analysis
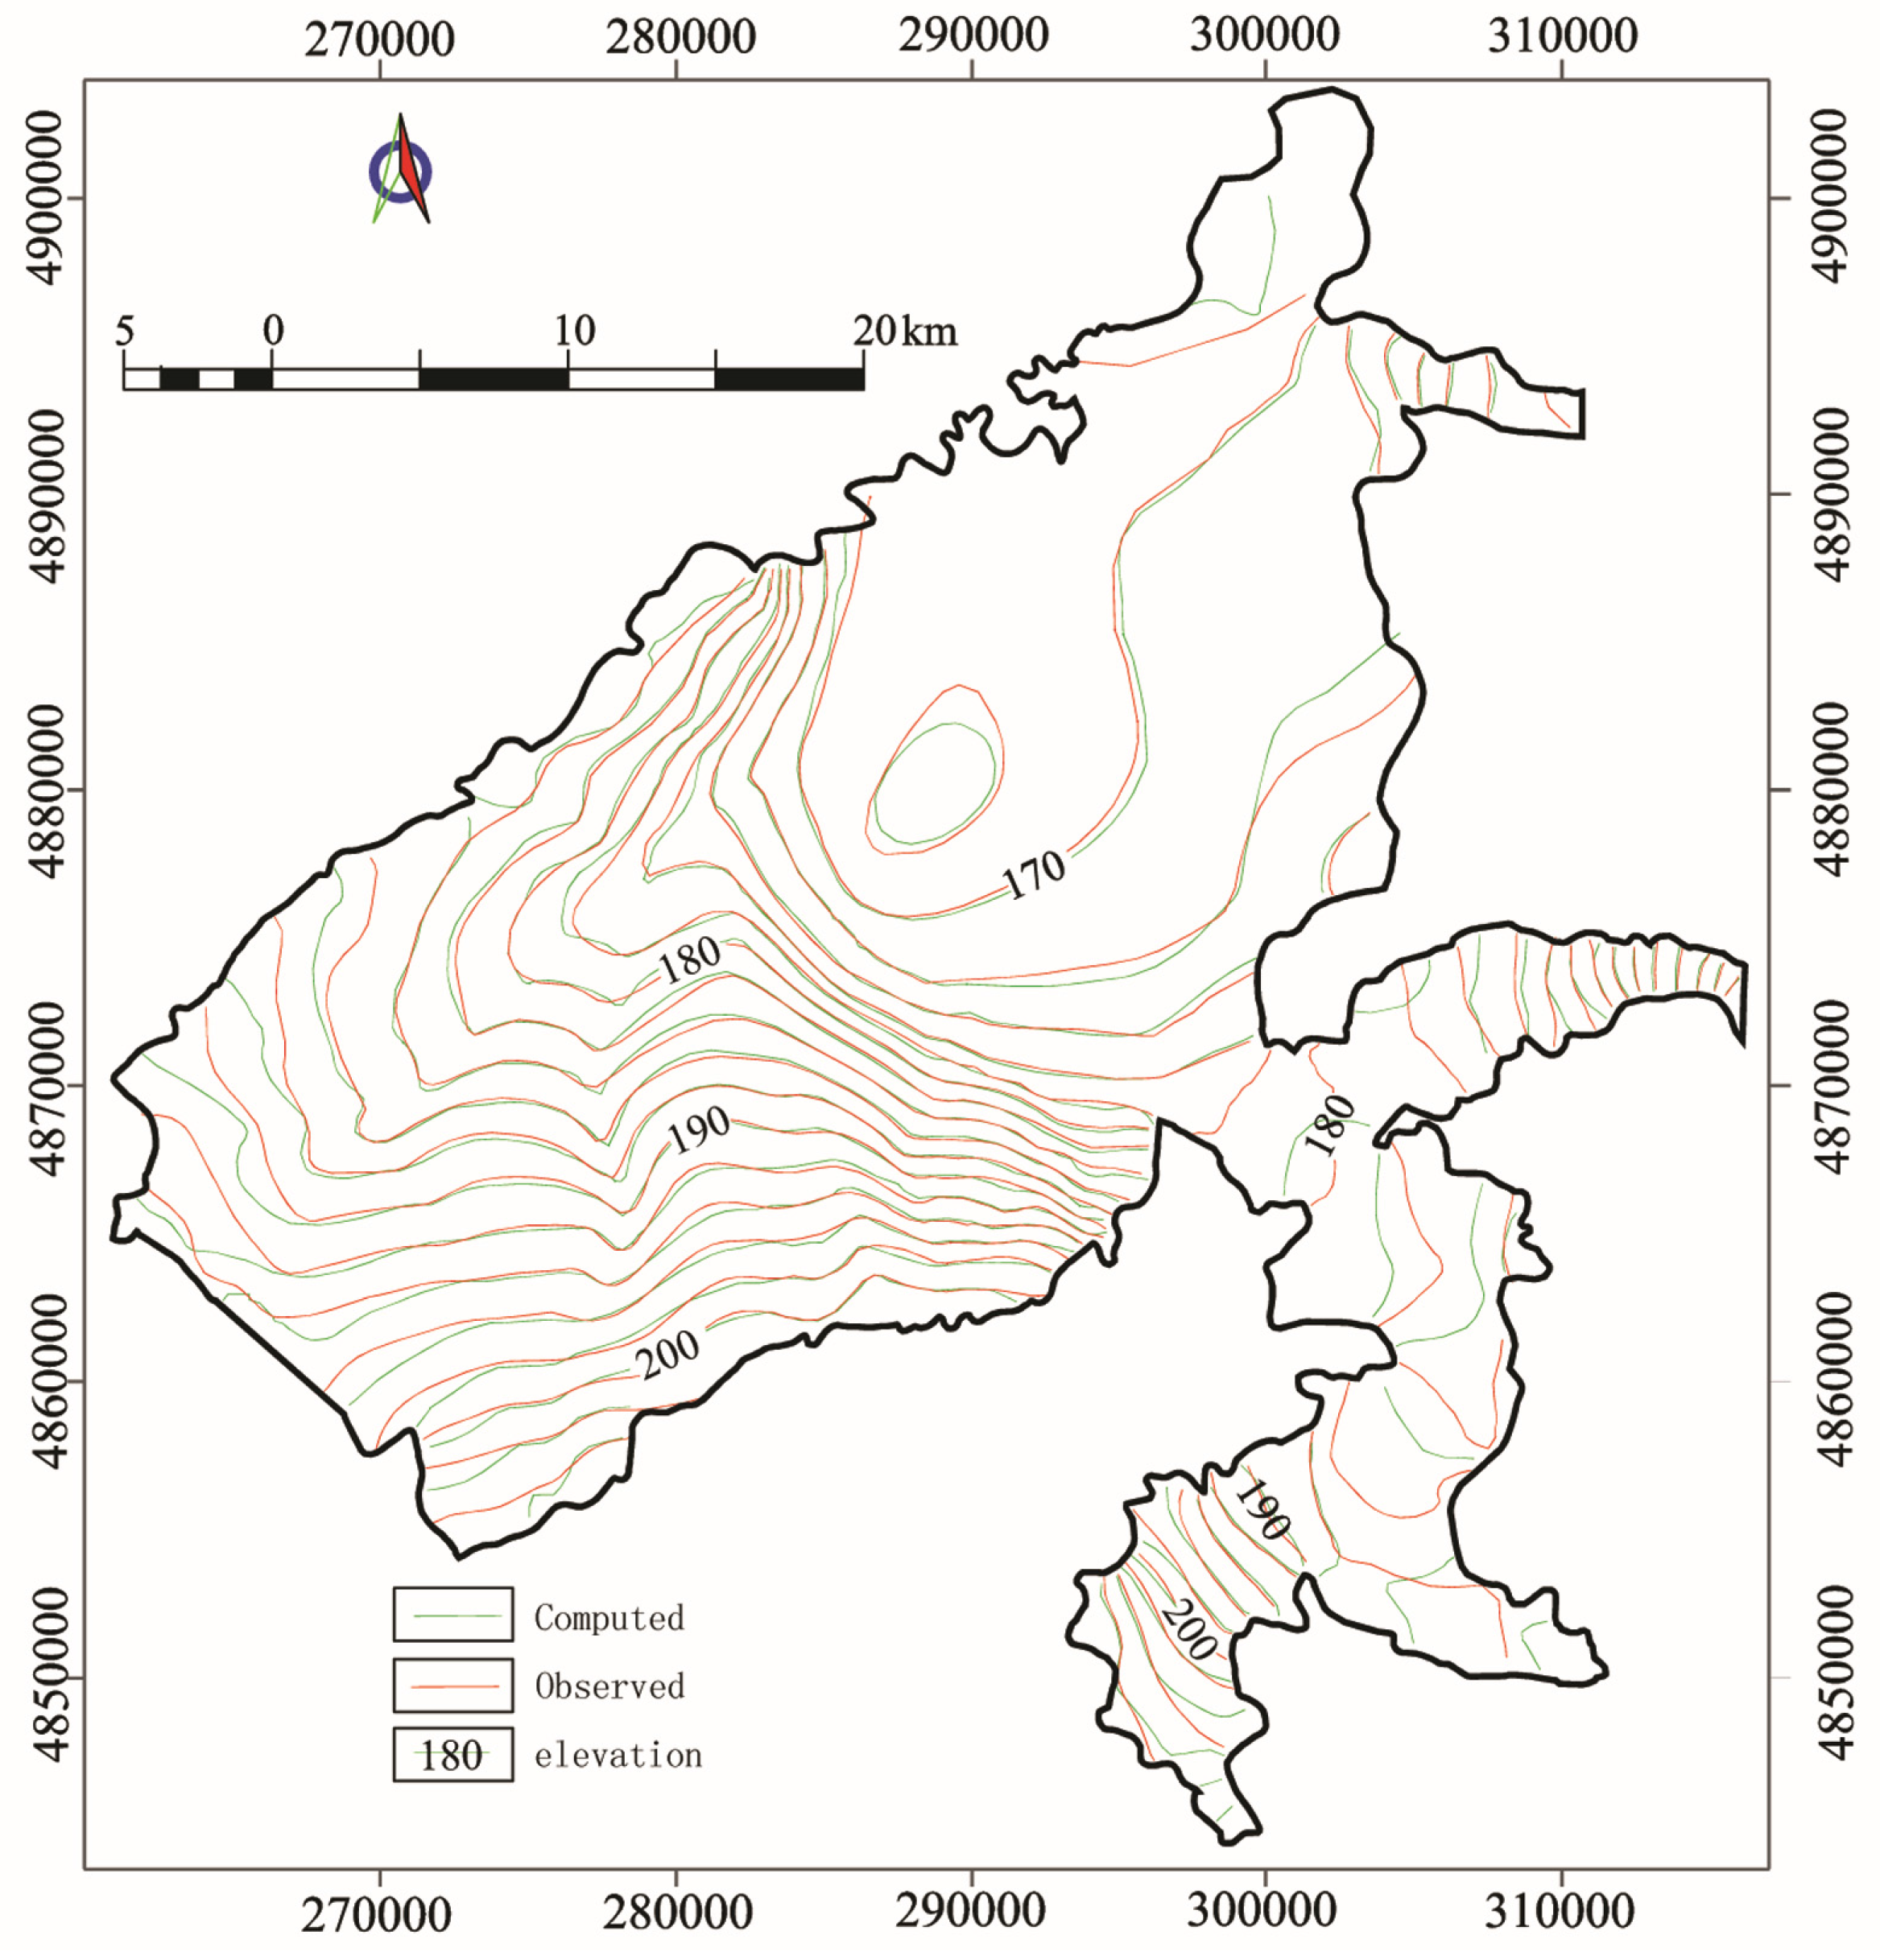
It is important to decide which result is reasonable in the calibration process. In this procedure, two types of data were used to calibrate the regional groundwater flow model for the JUA. First, observed groundwater level contour maps of the unconfined aquifer derived from the 190 borehole data points and 75 observation wells were used to match the computed water levels (Figure 11) as a qualitative step before more comprehensive and quantitative calibration was performed [32]. Second, the variable heads of the 75 observation wells from 2001 to 2010 were used as calibration targets (well locations as shown in Figure 5. The observation wells are distributed throughout the study area and, thus, are representative of the regional aquifer conditions.
Figure 11. Comparison of observed and computed groundwater contour level.
Water 07 05768 g011
Trial and error was used to calibrate the model using the following procedure [31]. First, the recharge rate was adjusted to minimize the difference between the observed and calculated groundwater level contour maps and heads. When this was achieved, the hydraulic conductivity and the specific yield were adjusted to minimize the variance of the differences [40]. The final hydraulic conductivity and the specific yield are shown in Table 1. This procedure was repeated until the variance was in a reasonable range.
It can be seen from Figure 11 that the contour maps of the observed groundwater level and the calculated groundwater level agreed well. Variance existed in the nearby Mangniu River and the upstream of the second Songhua River. The following reasons may lead to this result: (1) there are few monitoring wells for constructing an accurate water level contour map; (2) there are many pumping wells (Figure 5) that influence the water level, but the pumping wells are located close to the rivers, and while there is a good connection between the groundwater and the river, these problems require further study.
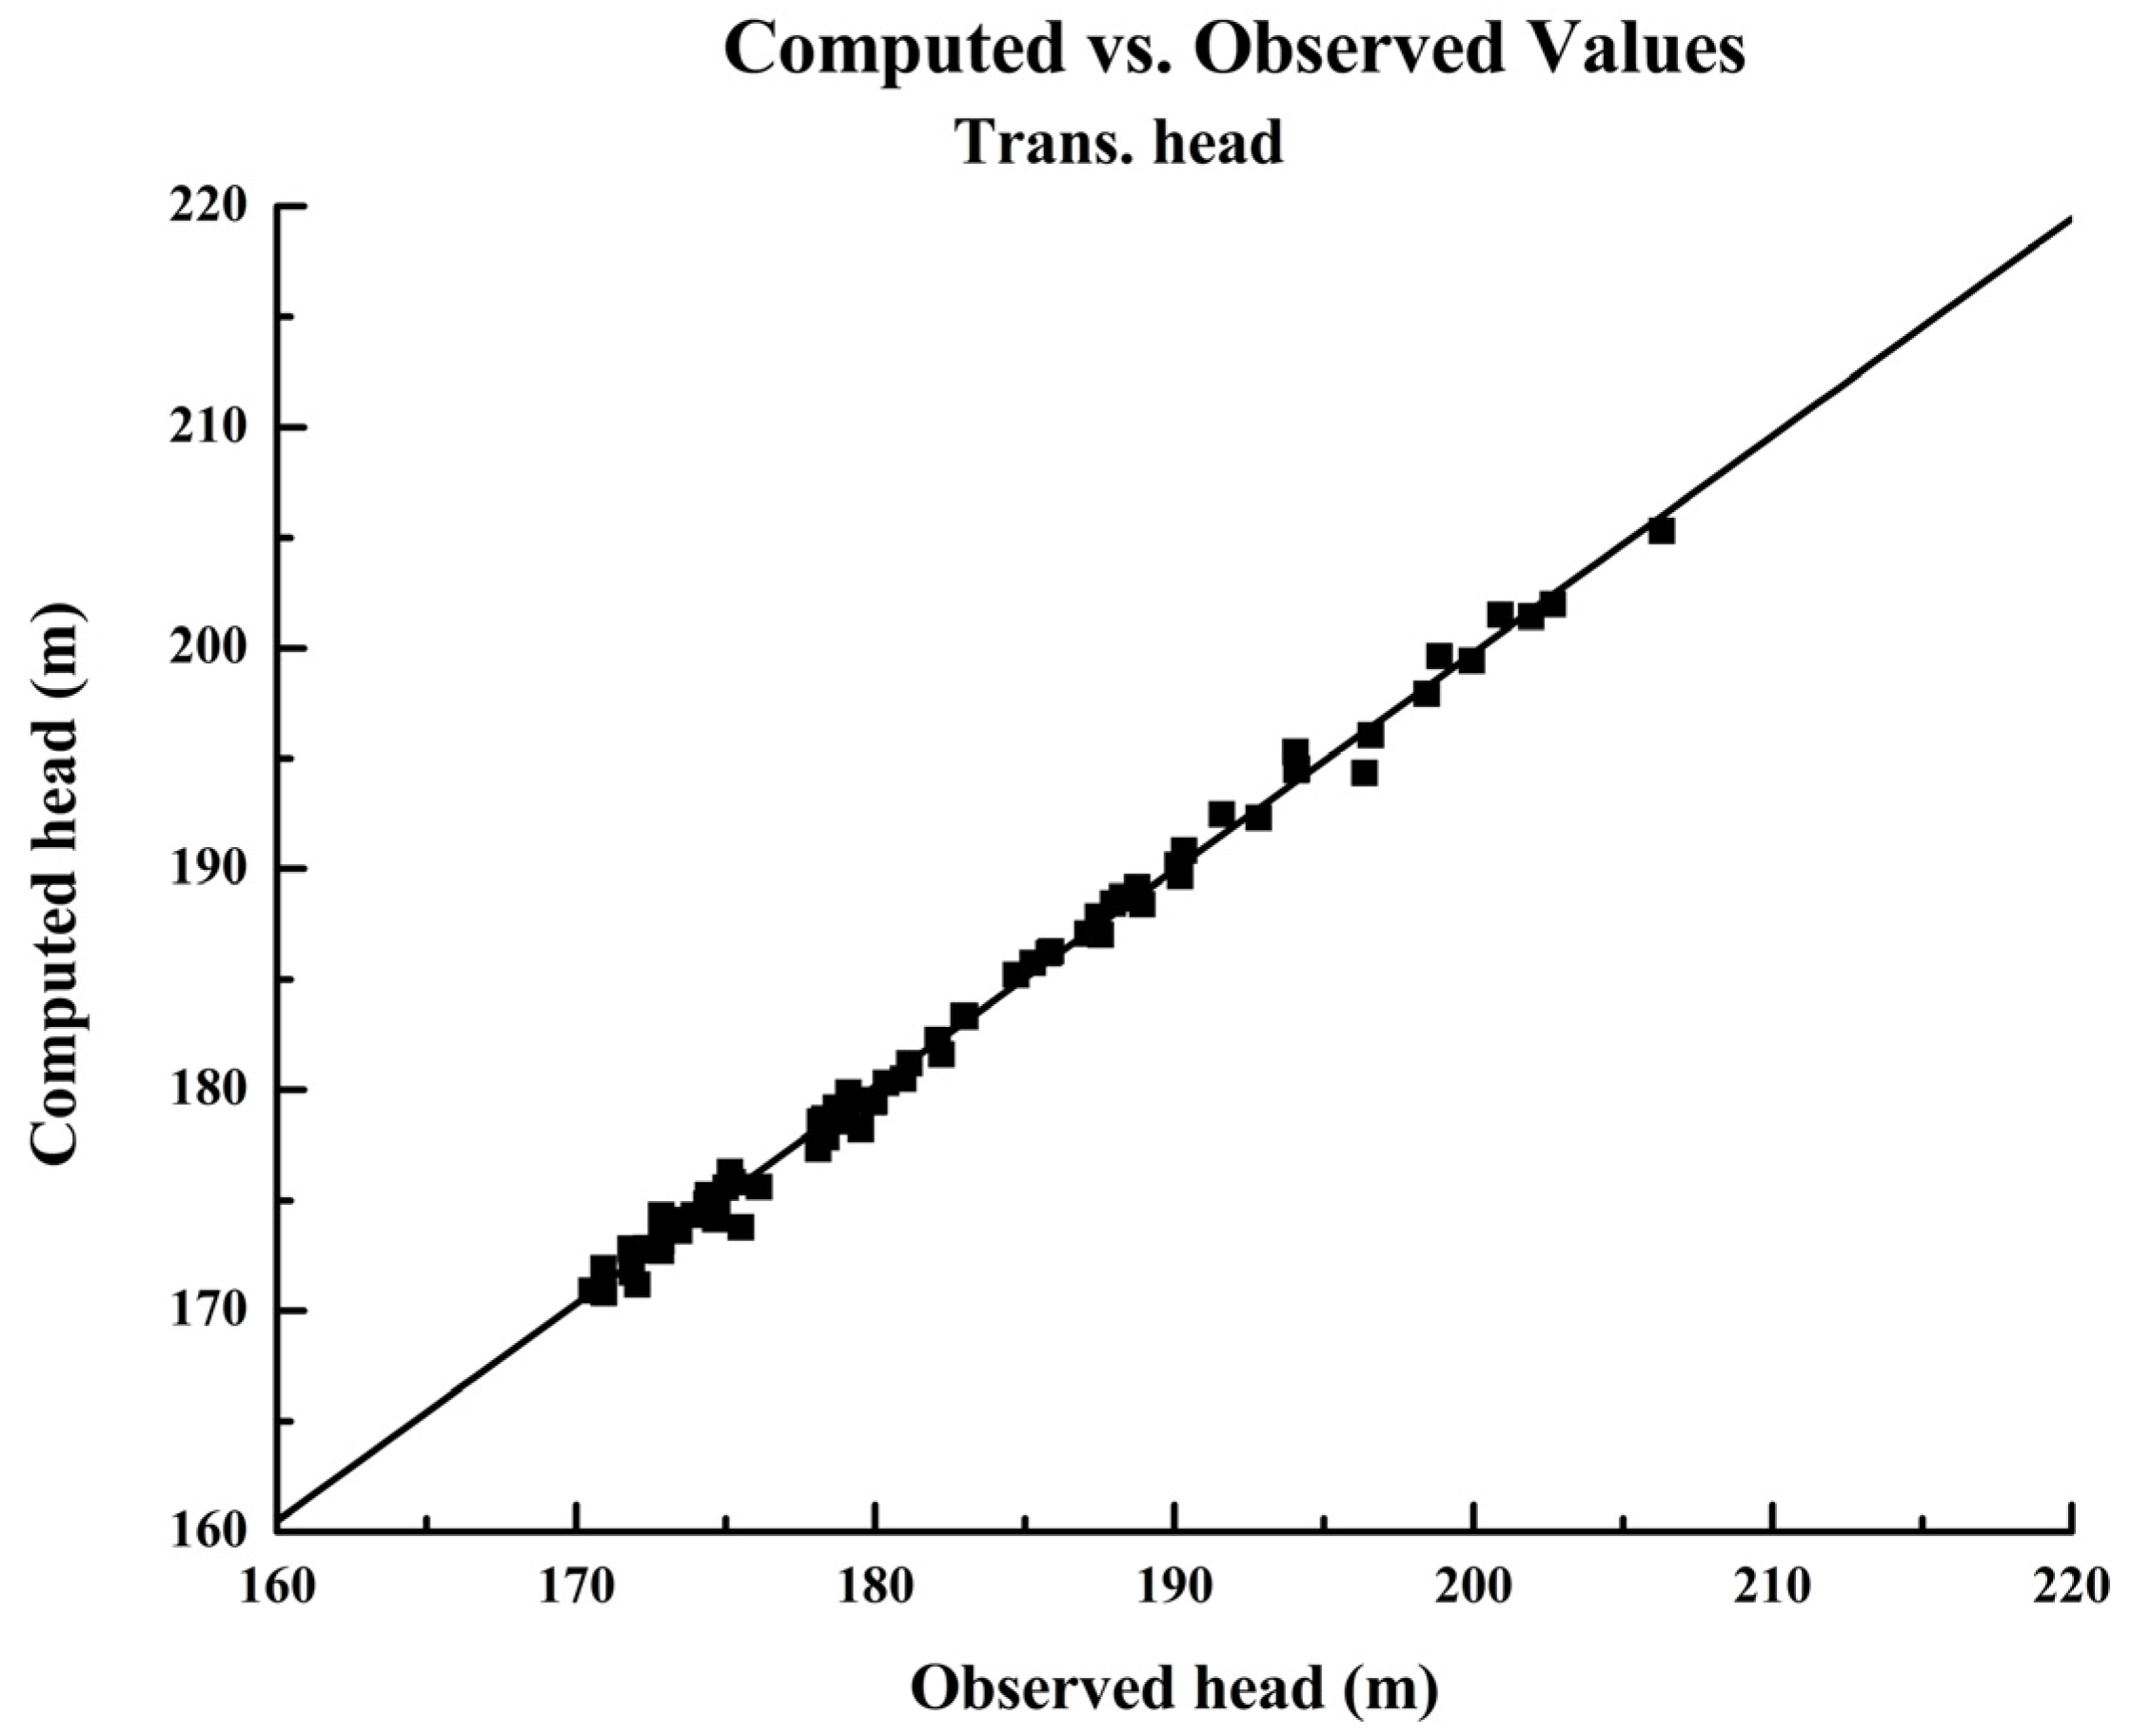
The variable observed hydraulic head and the calculated head were compared with the scatter shown in Figure 12. It can be seen that there was a good match between the observed and calculated head values. The mean error was 0.547 m and the root mean squared error (RMSE) was 0.66 m. The difference of the highest and the lowest water level was over 60 m so the discrepancy was reasonable.
Figure 12. Scatter plot of observed versus computed values of head for model calibration.
Water 07 05768 g012
Sensitivity analysis was performed on parameters such as the horizontal and vertical hydraulic conductivity, specific yield, recharge, and river conductance. In a sensitivity analysis, the input parameter values are varied across the range of likely values [20]. The parameter is increased or decreased 10% or 20% while other parameters remain unchanged. The model runs once for each change in parameters, and the effect upon the computed head is noted. The model is responsive to changes in recharge and horizontal hydraulic conductivity (Kh), river conductance (Cond.), vertical hydraulic conductivity (Kv), and specific yield (sy) are relatively small. The results are shown in Table 2.
Table 2. Groundwater head changes versus the changes of different parameters.
CategoryGroundwater Head Changes (%)
KhKvsyRchCond.
−20%0.0620.0440.03390.0450.042
−10%0.0410.0290.03140.0320.034
10%0.0350.029 0.03020.0460.040
20%0.0440.0300.03120.0640.050

4. Results and Discussion

4.1. Water Budget

It is a difficult task to calculate the water balance in an intermountain river valley model that has complex boundary conditions, and complex interaction between surface water and groundwater.
The water balance equation can be defined as:
(Qp + Qrl + Qirr + Qrb) − (QE + Qr + Qdb + Qw) = ΔQ
where Qp is the infiltration of precipitation, Qrl is the river leakage, Qirr is the infiltration of the irrigation in irrigation districts, Qrb is the recharge from the lateral boundaries, QE is the ET, Qr is the discharge from groundwater to a river, Qdb is the discharge from the lateral boundaries, Qw is the artificial pumping (large quantity wells and pumping water for irrigation), and ΔQ is the storage change of the groundwater system.
The “water budget” in the tools menu of GMS provides an effective tool for analyzing the water budget for the JUA. The repeated recharge from irrigation and precipitation should be subtracted to avoid adding the recharge rate as the irrigation does not occur during a rain spell. Precipitation is based on monitoring data from the four meteorological stations from 2001 to 2010 and is given the same as the step of the model. The average annual precipitation of the 10 years is 1.40 × 10⁸ m3/a, making the total inflow 67.68%. The inflow from the lateral boundaries, the infiltration of the irrigation and the river leakage are the annual average recharge to the groundwater system. The boundary inflow from the mountains is 0.17× 10⁸ m3/a, which makes the total inflow 8.27%. The irrigation is 0.05 × 10⁸ m3/a and the river leakage to groundwater is 0.45 × 10⁸ m3/a, which makes the total inflow 21.73%.
The withdrawal is based on the monitoring data of 2006, with a quantity of 1.57 × 10⁸ m3/a and is the main discharge of the groundwater system, which makes the total outflow 71%. ET from the natural groundwater flow system is 0.10 × 10⁸ m3/a. ET should be further assessed because irrigation may increase the value of ET. Groundwater discharge to the river occurs when the groundwater level is higher than the river stage and was as much as 0.41 × 10⁸ m3/a in the dry season, while outflow from the lateral boundaries was 0.13 × 10⁸ m3/a. The water balance of the model calculated with the JUA flow budget module shows that recharge from precipitation and discharge from withdrawal were the main terms of the water balance and had major influences on the groundwater levels.
In the water budget, the input was 2.07 × 10⁸ m3/a, which was smaller than the output of 2.21 × 10⁸ m3/a. From Figure 11, we see that, in the irrigation district and the industrial district near the big pumping wells, the cone of the depression and the groundwater level decline.

4.2. The Parameters of Each Sub-Region

The study area was divided into three hydrogeological zones with 37 sub-regions. For the top aquifer, the lithology of the Songhua River valley is silt and the K is defined as 1–2.7 m/day. The μ value is 0.07–0.15, which is larger than the other locations where the lithology consists of clay and loam and the K is 0.3–0.96 m/day and μ is 0.05–0.08. For the lower sand and gravel aquifer, the calculated K ranges from 10 to 80 m/day, and µ ranges from 0.1 to 0.3. The K for the Songhua River valley is larger than that of the Aolong River valley and larger than the platform areas. The parameters are based on the average pumping test results in each sub-region, and the parameter results are within the expected empirical values and are similar with Qi’s result [41] in I1-6 where the K is 33.6 m/day, μ is 0.24, and Shi’s [42] result in the Songhua river valley where the K is 25–80 m/day.

4.3. Model Limitations

Numerical modeling can be used to simulate the real groundwater flow system and is based on the literature, borehole data and the experience of the modeler, but limitations of the technology and the data exist:
(1)
Limited borehole and groundwater level monitoring data, especially in the mountains and the outcrops of the underlying basement and where the thickness of the aquifer changes greatly, affect the reliability of the model.
(2)
Aquifer and irrigation recharge rates and spatial distribution of aquifer recharge areas. The irrigation recharge rates are estimated from the literature because there are no monitoring wells in this area, which results in some uncertainty.
(3)
Withdrawal was based on the 2006 data, which may overestimate reality prior to 2006 and underestimate that following 2006, as the plant area increased and there was growth in industry and increased population. Further investigation is required to make a more accurate model for the JUA.
(4)
There are 190 borehole data points and 75 observation wells in this model, but the initial head is mainly based on the observation wells because many of the boreholes were developed in the 1980s and the water level has already changed greatly, which introduces another source of uncertainty.
(5)
Infiltration of irrigation is based on the average value of water-use quota of the Jilin province. This rate is not accurate because different crops need different quantities of water; therefore, future studies should investigate land types and crop species.

5. Conclusions

A groundwater flow model was developed using GMS to help understand a complex groundwater system in in Jilin urban area of Jilin province, China. Based on the geological and hydrogeological investigations, the aquifer system here was divided into two aquifers that mainly composed of silt, loam, sand and gravel, respectively. Both aquifers are commonly unconfined, but are confined at those places overlain by the loam.
The elevation of land surface was inferred from the DEM data and the 1:50,000 topographic map. The initial water levels were interpolated by Kriging method based on the water level measurements. The water stage was interpolated by using the observation data at several hydrometric stations and the coordinate system in GMS, and then it was combined with the observation wells to get groundwater level accuracy where it crosses the river.
The trial-and-error method was used in calibration of the model. In this method, expert judgment plays a more important role than automatic procedures where calibration is restricted to the calibration zones with a limited amount of variables [19]. Sensitivity analysis was used to explain the role of calibration parameters in the groundwater response, and the result showed that recharge was the most sensitive factor.
Based on the supply and demand analysis of water resources, the established model would finally provide a scientific basis to use the groundwater resources sustainably in JUA. The groundwater flow model can be used as the basis for a water quality model and the water flow and quality prediction model of JUA. This is the first step to studying the JUA; however, further detailed investigations are needed to accurately model JUA and provide a basis for groundwater management in Jilin city.

Acknowledgments

The authors acknowledge the support of The National Natural Science Funds (41572216), The Water Resources Project of Jilin Province (0773-1441GNJL00390) and The Natural Science Funds of Jilin Province (20140101164JC). They also thank the reviewers for helpful comments.

Author Contributions

Shuwei Qiu and Xiujuan Liang conceived the manuscript; Changlai Xiao and He Huang analyzed the data; Zhang Fang and Fengchao Lv collected data; Shuwei Qiu wrote the paper.

Conflicts of Interest

The authors declare no conflict of interest.

References

  1. Zhu, L.Y.; Ma, B.L.; Zhang, L.; Zhang, L. The study of distribution and fate of nitrobenzene in a water/sediment microcosm. Chemosphere 2007, 69, 1579–1585. [Google Scholar] [CrossRef] [PubMed]
  2. Wang, A.M.; Hu, C.; Qu, J.H.; Yang, M.; Liu, H.J.; Ru, J.; Qi, R.; Sun, J.F. Phototransformation of nitrobenzene in the Songhua River: Kinetics and photoproduct analysis. J. Environ. Sci. China 2008, 20, 787–795. [Google Scholar] [CrossRef]
  3. Li, J.; Li, Y.L. On the sudden environmental pollution incident emergency response role of the expert grup. Inner Mong. Environ. Prot. 2011, 23, 6–7. (In Chinese) [Google Scholar]
  4. Martin, P.J.; Frind, E.O. Modeling a complex multi-aquifer system: The Waterloo Moraine. Groundwater 1998, 83, 679–690. [Google Scholar] [CrossRef]
  5. Carrera-Hernandez, J.J.; Gaskin, S.J. The groundwater modeling tool for GRASS (GMTG): Open source groundwater flow modeling. Comput. Geosci. UK 2006, 32, 339–351. [Google Scholar] [CrossRef]
  6. Lachaal, F.; Mlayah, A.; Bedir, M.; Tarhouni, J.; Leduc, C. Implementation of a 3-D groundwater flow model in a semi-arid region using MODFLOW and GIS tools: The Ze’ramdine–Be’ni Hassen Miocene aquifer system (east-central Tunisia). Comput. Geosci. UK 2012, 48, 187–198. [Google Scholar] [CrossRef]
  7. Lubczynski, M.W.; Gurwin, J. Integration of various data sources for transient groundwater modeling with spatio-temporally variable fluxes—Sardon study case, Spain. J. Hydrol. 2005, 306, 71–96. [Google Scholar] [CrossRef]
  8. Dawoud, M.A.; Darwish, M.M.; El-Kady, M.M. GIS-based groundwater management model for Western Nile Delta. Water Resour. Manag. 2005, 19, 585–604. [Google Scholar] [CrossRef]
  9. Sedki, A.; Ouazar, D. Swarm intelligence for groundwater management optimization. J. Hydroinform. 2011, 13, 520–532. [Google Scholar] [CrossRef]
  10. McDonald, M.G.; Harbaugh, A.W. A modular three-dimensional finite-difference groundwater flow model. In Techniques of Water-Resources Investigations of the United States Geological Survey; Book 6, Chapter A1; United States Government Printing Office, Washington USGS: Reston, VA, USA, 1988; p. 586. [Google Scholar]
  11. Harbaugh, A.W.; Banta, E.R.; Hill, M.C.; McDonald, M.G. MODFLOW-2000, the US Geological Survey Modular Groundwater Model—User Guide to Modularization Concepts and the Ground-Water Flow Process, US Geological Survey Open-File, Report 00–92; US Department of Interior: Reston, VA, USA, 2000; p. 121.
  12. ESI. Guide to Using Groundwater Vistas; Environmental Simulations: Herndon, VA, USA, 2001. [Google Scholar]
  13. Li, S.G.; Liu, Q. Interactive Ground Water (IGW). Environ. Modell. Softw. 2006, 21, 417–418. [Google Scholar] [CrossRef]
  14. Reeves, M.; Cranwell, R.M. User’s Manual for the Sandia Waste-Isolation Flow and Transport Model (SWIFT); Release 4.81. SAND 81–2516 and, NUREG/CR-2324; Sandia National laboratories: Albuquerque, NM, USA, 1981. [Google Scholar]
  15. Rodriguez, L.B.; Cello, P.A.; Vionnet, C.A. Modeling stream-aquifer interactions in a shallow aquifer, Choele Choel Island, Patagonia, Argentina. Hydrogeol. J. 2006, 14, 591–602. [Google Scholar] [CrossRef]
  16. Kallioras, A.; Pliakas, F.; Diamantis, I. Simulation of groundwater flow in a sedimentary aquifer system subjected to overexploitation. Water Air Soil Pollut. 2010, 211, 177–201. [Google Scholar] [CrossRef]
  17. Marcus, A. From 3D geomodeling systems towards 3D geoscience information systems: Data model, query functionality and data management. Comput. Geosci. UK 2006, 32, 222–229. [Google Scholar]
  18. Kim, N.W.; Chung, I.M.; Won, Y.S.; Arnold, J.G. Development and application of the integrated SWAT–MODFLOW model. J. Hydrol. 2008, 356, 1–16. [Google Scholar] [CrossRef]
  19. Gurwin, J.; Lubczynski, M. Modeling of complex multi-aquifer systems for groundwater resources evaluation—Swidnica study case (Poland). Hydrogeol. J. 2005, 13, 627–639. [Google Scholar] [CrossRef]
  20. Yousafzai, A.; Eckstein, Y.; Dahl, P. Numerical simulation of groundwater flow in the Peshawar intermontane basin, northwest Himalayas. Hydrogeol. J. 2008, 16, 1395–1409. [Google Scholar] [CrossRef]
  21. Shao, J.L.; Li, L.; Cui, Y.L.; Zhang, Z.J. Groundwater Flow Simulation and its Application in Groundwater Resource Evaluation in the North China Plain, China. Acta Geol. Sin-Engl. 2013, 87, 243–253. [Google Scholar]
  22. Froukh, L.J. Groundwater Modelling in Aquifers with highly Karstic and Heterogeneous Characteristics (KHC) in Palestine. Water Resour. Manag. 2002, 16, 369–379. [Google Scholar] [CrossRef]
  23. Gogu, R.C.; Carabin, G.; Hallet, V.; Peters, V.; Dassargues, A. GIS-based hydrogeological databases and groundwater modelling. J. Hydrol. 2001, 9, 555–569. [Google Scholar] [CrossRef]
  24. Hinaman, K.C. Use of a geographic information system to assemble input-data sets for a finitedifference model of ground-water flow. J. Am. Water Resour. Assoc. 1993, 29, 401–405. [Google Scholar] [CrossRef]
  25. Kolm, K.E. Conceptualization and characterization of ground-water systems using Geographic Information Systems. Eng. Geol. 1996, 42, 111–118. [Google Scholar]
  26. Wang, S.Q.; Shao, J.L.; Song, X.F.; Zhang, Y.B.; Huo, Z.B.; Zhou, X.Y. Application of MODFLOW and geographic information system to groundwater flow simulation in North China Plain, China. Environ. Geol. 2008, 55, 1449–1462. [Google Scholar] [CrossRef]
  27. Zhang, N.; Liang, X.J.; Xiao, C.L.; Liu, J.F.; Yin, J.J. Groundwater quality risk prediction of contingency groundwater source in Jilin city. Water Saving Irrig. 2012, 6, 41–48. [Google Scholar]
  28. Wang, L.; Xiao, C.L.; Liang, X.J. MIKE BASIN Model in Water Resources Allocation in Jilin City. China Rural Water Hydropower 2014, 1, 128–131. (In Chinese) [Google Scholar]
  29. Fogg, G.E. Groundwater flow and sand body inter connectedness in a thick, multiple-aquifer system. Water Resoup Res. 1986, 22, 679–694. [Google Scholar] [CrossRef]
  30. Xu, X.; Huang, G.H.; Qu, Z.Y.; Pereira, L.S. Using MODFLOW and GIS to Assess Changes in Groundwater Dynamics in Response to Water Saving Measures in Irrigation Districts of the Upper Yellow River Basin. Water Resour. Manag. 2011, 25, 2035–2059. [Google Scholar] [CrossRef]
  31. Chenini, I.; ben Mammou, A. Groundwater recharge study in arid region: An approach using GIS techniques and numerical modeling. Comput. Geosci. UK 2011, 36, 801–817. [Google Scholar] [CrossRef]
  32. Yao, Y.Y.; Zheng, C.M.; Liu, J.; Cao, G.L.; Xiao, H.L.; Li, H.T.; Li, W.P. Conceptual and numerical models for groundwater flow in an arid inland river basin. Hydrol. Process. 2015, 29, 1480–1492. [Google Scholar] [CrossRef]
  33. USGS. SRTM Topographic Data. 2007. Available online: http://srtm.usgs.gov/ (accessed on 12 December 2007). [Google Scholar]
  34. Chebud, Y.A.; Melesse, A.M. Numerical modeling of the groundwater flow system of the Gumera sub-basin in lake Tana basin, Ethiopia. Hydrol. Process. 2009, 23, 3694–3704. [Google Scholar] [CrossRef]
  35. Xu, X.; Huang, G.H.; Qu, Z.Y. Integrating MODFLOW and GIS technologies for assessing impacts of irrigation management and groundwater use in the Hetao Irrigation District, Yellow River basin. Sci. China Ser. E 2009, 52, 3257–3263. [Google Scholar] [CrossRef]
  36. Sanchez-Vila, X.; Meier, P.M.; Carrera, J. Pumping tests in heterogeneous aquifers: An analytical study of what can be obtained from their interpretation using Jacob’s method. Water Resoup. Res. 1999, 35, 943–952. [Google Scholar] [CrossRef]
  37. Water Resources Department of Jilin. Jilin Province Local Standard of Water Quota; DB22/T 389-2010; Water Resources Department of Jilin: Changchun, China, 2010. [Google Scholar]
  38. Dong, Y.H.; Li, G.M.; Xu, H.Z. An areal recharge and discharge simulating method for MODFLOW. Comput. Geosci. UK 2012, 42, 203–220. [Google Scholar] [CrossRef]
  39. Brigham Young University, Environmental Modeling Research Laboratory. Groundwater Modeling System; The Department of Defense: Arlington County, VA, USA, 2000.
  40. Gedeon, M.; Wemaere, I.; Marivoet, J. Regional groundwater model of north-east Belgium. J. Hydrol. 2007, 335, 133–139. [Google Scholar] [CrossRef]
  41. Qi, B.; Wang, Y.L.; Liu, H.J. Phreatic aquifer parameters determination based on the dynamic observation data. Water Resour. Hydropower Northeast China 2002, 20, 32–34. (In Chinese) [Google Scholar]
  42. Shi, G.Q. The water enrichment characteristics of quaternary gravel layer and the problems of precipitation projects in city proper of Jilin City. Urban Geotechn. Investig. Survey. 2010, 5, 167–168. [Google Scholar]