Environmental pH, O2 and Capsular Effects on the Geochemical Composition of Statoliths of Embryonic Squid Doryteuthis opalescens

Abstract
:1. Introduction
2. Materials and Methods
2.1. Collection of Squid Embryos and Seawater Data
2.2. System Overview and Experimental Treatments

| Treatment (Tank) | Temp (°C) | Alkalinity (µmol·kg−1) | pHT (in-situ) Total Scale | ΩAragonite | [O2] (µmol·kg−1) |
|---|---|---|---|---|---|
| Experiment 1 | |||||
| High pHOx (1) | 11.3 ± 0.4 | 2215.5 ± 4.8 | 7.938 ± 0.053 | 1.62 ± 0.17 | 241.3 ± 12.3 |
| High pHOx (2) | 11.1 ± 0.4 | 2214.2 ± 6.6 | 7.916 ± 0.062 | 1.54 ± 0.21 | 242.6 ± 13.1 |
| Low pHOx (1) | 11.4 ± 0.8 | 2214.8 ± 6.3 | 7.578 ± 0.067 | 0.76 ± 0.12 | 82.1 ± 15.8 |
| Low pHOx (2) | 11.2 ± 0.9 | 2215.4 ± 5.8 | 7.567 ± 0.065 | 0.74 ± 0.12 | 78.6 ± 21.5 |
| Treatment Effect (df = 1, N = 36) | χ2 = 0.02, p = 0.876 | χ2 = 0.01, p = 0.921 | χ2 = 109.35 p < 0.0001 | χ2 = 109.35 p < 0.0001 | χ2 = 90.76, p < 0.0001 |
| Experiment 2 | |||||
| Low [O2] (1) | 11.2 ± 0.5 | 2239.1 ± 5.5 | 7.923 ± 0.035 | 1.58 ± 0.10 | 86.4 ± 8.3 |
| Low [O2] (2) | 11.6 ± 0.5 | 2241.8 ± 4.5 | 7.908 ± 0.072 | 1.57 ± 0.21 | 83.0 ± 12.9 |
| Low pH (1) | 11.3 ± 0.5 | 2241.1 ± 5.8 | 7.559 ± 0.029 | 0.73 ± 0.04 | 241.1 ± 9.1 |
| Low pH (2) | 11.6 ± 0.6 | 2244.2 ± 7.1 | 7.552 ± 0.026 | 0.73 ± 0.04 | 241.7 ± 7.6 |
| Treatment Effect (df = 1, N = 32) | χ2 = 0.05, p = 0.819 | χ2 = 3.14, p = 0.077 | χ2 = 93.74, p < 0.0001 | χ2 = 93.74, p < 0.0001 | χ2 = 72.74, p < 0.0001 |
2.3. Extraction and Mounting of Statoliths for Elemental Analyses
2.4. LA-ICP-MS Instrument Settings and Methods for Elemental Analyses of Statoliths
2.5. Statistical Analyses of Seawater and Statolith Elemental Composition
3. Results and Discussion
3.1. Elemental Variations among Treatment Groups
| Element:Ca | Experiment 1 | Experiment 2 |
|---|---|---|
| B:Ca | F3, 4 = 6.14, p < 0.0001 | F6, 10 = 17.43, p < 0.0001 |
| Mg:Ca | F3, 14 = 20.15, p < 0.0001 | F6, 25 = 45.07, p < 0.0001 |
| Sr:Ca | F3, 14 = 13.27, p < 0.0001 | F6, 25 = 41.74, p < 0.0001 |
| Ba:Ca | F3, 14 = 2.82, p = 0.0026 | F6, 25 = 51.12, p < 0.0001 |
| Pb:Ca | F3, 14 = 31.05, p < 0.0001 | F6, 25 = 39.92, p < 0.0001 |
| U:Ca | F3, 13 = 2.65, p = 0.0060 | F6, 25 = 103.28, p < 0.0001 |
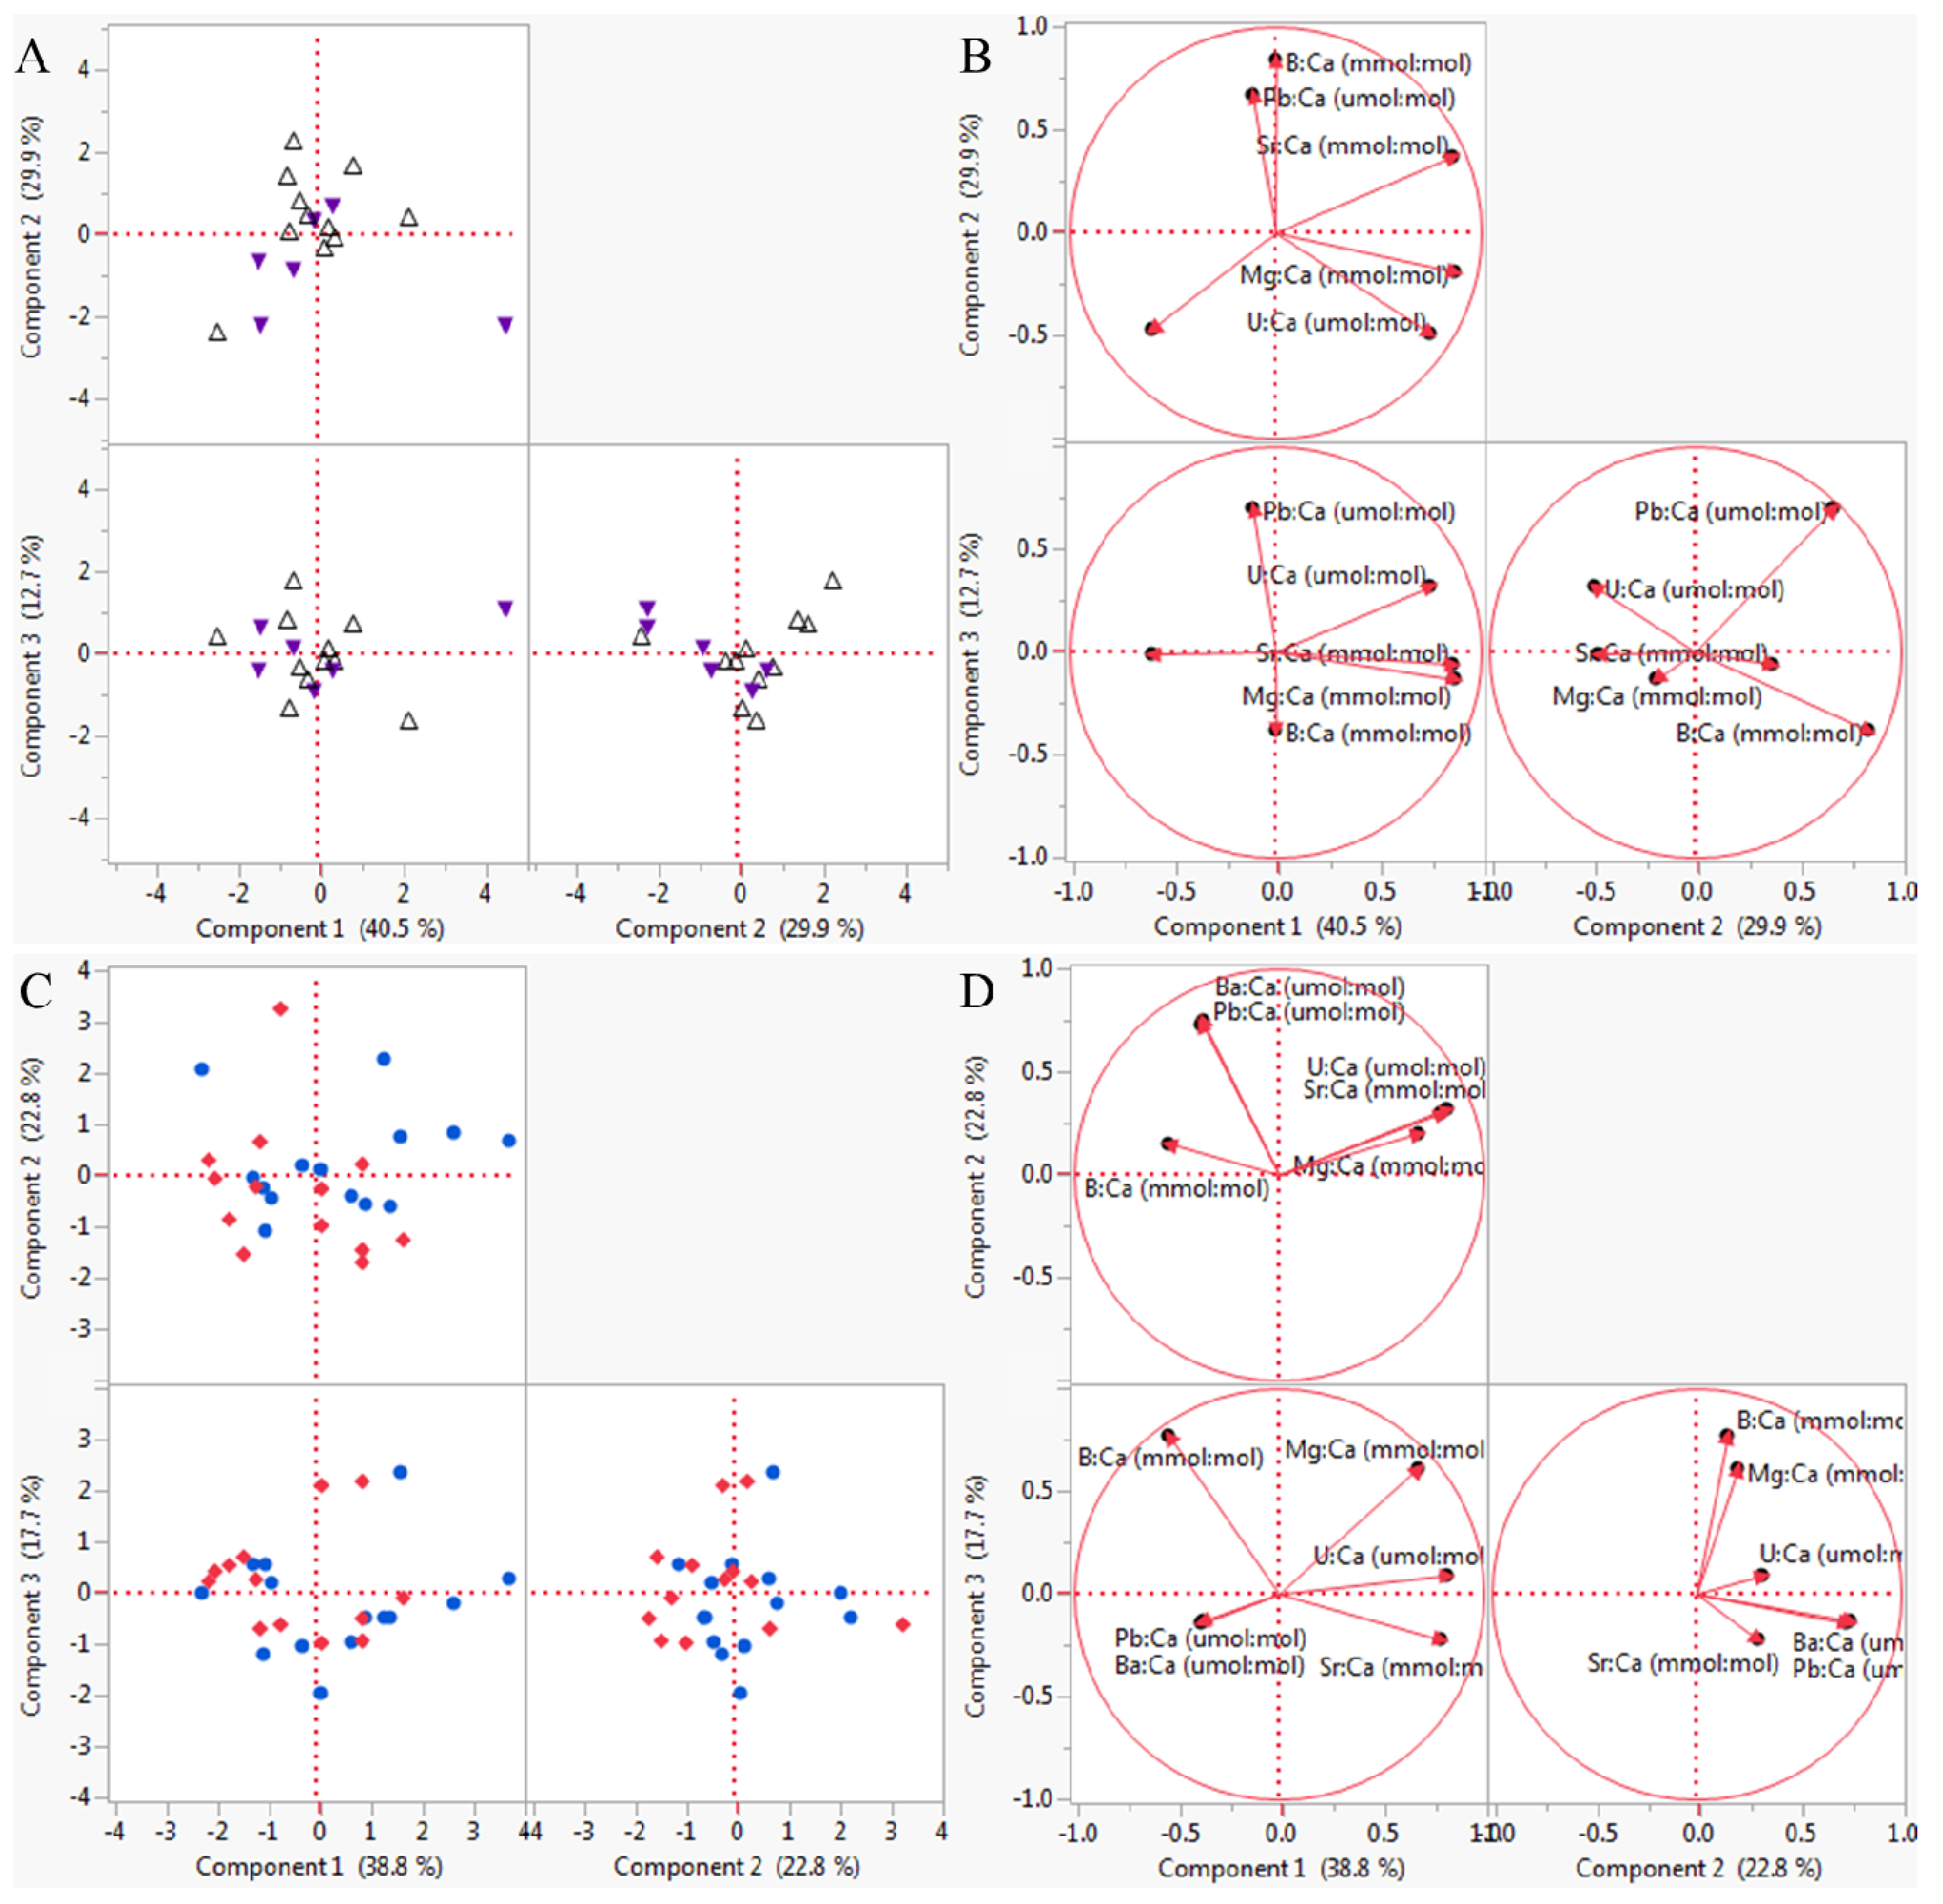
3.2. Multivariate Analyses
| Groups | R Statistic | p-Value |
|---|---|---|
| High pHOx | 0.890 | 0.010 |
| Low pHOx | 1.000 | 0.333 |
| Low [O2] | 0.920 | 0.010 |
| Low pH | 0.892 | 0.010 |
| Experiment 1 Element | PC 1 (2.43, 40.5%) | PC 2 (1.79, 30.0%) | PC 3 (0.76, 12.7%) | PC 4 (0.64, 10.7%) | PC 5 (0.20, 3.3%) |
|---|---|---|---|---|---|
| B:Ca (mmol:mol) | 0.00280 | 0.62922 | -0.43943 | 0.38658 | 0.47883 |
| Mg:Ca (mmol:mol) | 0.55641 | −0.14115 | 0.51101 | 0.40241 | −0.47422 |
| Sr:Ca (mmol:mol) | 0.55046 | 0.27674 | 0.18102 | 0.05333 | −0.18725 |
| Ba:Ca (µmol:mol) | −0.38689 | −0.35043 | 0.37102 | 0.78068 | −0.04598 |
| Pb:Ca (µmol:mol) | −0.06976 | 0.50151 | 0.80384 | 0.24169 | −0.15971 |
| U:Ca (µmol:mol) | 0.48254 | −0.36505 | 0.36425 | 0.13378 | 0.69485 |
| Experiment 2 Element | PC 1 (2.33, 38.8%) | PC 2 (1.37, 22.7%) | PC 3 (1.06, 17.7%) | PC 4 (0.57, 9.6%) | PC 5 (0.37, 6.2%) |
| B:Ca (mmol:mol) | −0.35216 | 0.13043 | 0.74688 | 0.08813 | 0.21714 |
| Mg:Ca (mmol:mol) | 0.44385 | 0.17315 | 0.59349 | −0.07149 | 0.06847 |
| Sr:Ca (mmol:mol) | 0.52043 | 0.25779 | −0.21675 | 0.15301 | 0.71352 |
| Ba:Ca (µmol:mol) | −0.24548 | 0.64466 | −0.12698 | 0.66566 | −0.15275 |
| Pb:Ca (µmol:mol) | −0.24588 | 0.62852 | −0.13803 | −0.71931 | 0.08053 |
| U:Ca (µmol:mol) | 0.53611 | 0.27552 | 0.08822 | −0.05656 | −0.63972 |
3.3. Statoliths as an Indicator of Environmental Response
4. Conclusions
Acknowledgments
Author Contributions
Appendix
| Treatment (Tank) | B (ppm) | Mg (ppm) | Ca (ppm) | Sr (ppm) | Ba (ppb) | U (ppb) |
|---|---|---|---|---|---|---|
| Experiment 1 | ||||||
| Low pHOx (1) | 4.45 ± 0.005 | 1092 ± 11.6 | 351.0 ± 3.40 | 5.64 ± 0.055 | 4.41 ± 0.120 | 1.98 ± 0.410 |
| Low pHOx (2) | 4.45 ± 0.005 | 1100 ± 14.8 | 353.2 ± 4.39 | 5.70 ± 0.084 | 4.51 ± 0.129 | 2.03 ± 0.408 |
| High pHOx (1) | 4.45 ± 0.003 | 1113 ± 12.6 | 357.7 ± 4.16 | 5.76 ± 0.064 | 4.65 ± 0.062 | 2.12 ± 0.428 |
| High pHOx (2) | 4.44 ± 0.014 | 1118 ± 14.7 | 358.5 ± 5.00 | 5.78 ± 0.074 | 4.51 ± 0.153 | 2.03 ± 0.404 |
| Treatment Effect | F1,4 = 1.588, p = 0.222 | F1,4 = 2.039, p = 0.169 | F1,4 = 1.969, p = 0.176 | F1,4 = 2.077, p = 0.165 | F1,4 = 0.957, p = 0.340 | F1,4 = 0.030, p = 0.864 |
| Experiment 2 | ||||||
| Low [O2] (1) | 4.48 ± 0.004 | 1100 ± 14.9 | 355.6 ± 4.99 | 5.69 ± 0.077 | 4.34 ± 0.115 | 2.11 ± 0.190 |
| Low [O2] (2) | 4.48 ± 0.004 | 1115 ± 15.1 | 358.6 ± 6.28 | 5.76 ± 0.089 | 4.51 ± 0.168 | 2.20 ± 0.176 |
| Low pH (1) | 4.48 ± 0.003 | 1131 ± 17.8 | 365.4 ± 6.10 | 5.87 ± 0.097 | 4.41 ± 0.067 | 2.08 ± 0.247 |
| Low pH (2) | 4.48 ± 0.004 | 1108 ± 31.7 | 359.2 ± 10.45 | 5.72 ± 0.163 | 4.34 ± 0.083 | 1.85 ± 0.122 |
| Treatment Effect | F1,4 = 0.038, p = 0.847 | F1,4 = 0.336, p = 0.571 | F1,4 = 0.513, p = 0.484 | F1,4 = 0.607, p = 0.447 | F1,4 = 0.189, p = 0.669 | F1,4 = 1.016, p = 0.329 |
Conflicts of Interest
References
- Nam, S.; Kim, H.J.; Send, U. Amplification of hypoxic and acidic events by La Niña conditions on the continental shelf off California. Geophys. Res. Lett. 2011, 38. [Google Scholar] [CrossRef]
- Send, U.; Nam, S. Relaxation from upwelling: The effect on dissolved oxygen on the contintental shelf. J. Geophys. Res. Oceans 2012, 117. [Google Scholar] [CrossRef]
- Frieder, C.A.; Nam, S.H.; Martz, T.R.; Levin, L.A. High temporal and spatial variability of dissolved oxygen and pH in a nearshore California kelp forest. Biogeosciences 2012, 9, 3917–3930. [Google Scholar]
- Booth, J.A.T.; McPhee-Shaw, E.E.; Chua, P.; Kingsley, E.; Denny, M.; Phillips, R.; Bograd, S.J.; Zeidberg, L.D.; Gilly, W. Natural intrusions of hypoxic, low pH water into nearshore marine environments on the California coast. Cont. Shelf Res. 2012, 45, 108–115. [Google Scholar] [CrossRef]
- Gilly, W.F.; Beman, J.M.; Litvin, S.Y.; Robison, B.H. Oceanographic and biological effects of shoaling of the oxygen minimum zone. Annu. Rev. Mar. Sci. 2013, 5, 393–420. [Google Scholar] [CrossRef]
- Booth, J.A.T.; Woodson, C.B.; Sutula, M.; Micheli, F.; Weisberg, S.B.; Bograd, S.J.; Steele, A.; Schoen, J.; Crowder, L.B. Patterns and potential drivers of declining oxygen content along the southern California coast. Limnol. Oceanogr. 2014, 59. in press. [Google Scholar]
- Bograd, S.J.; Buil, M.P.; DiLirenzo, E.; Castro, C.G.; Schroeder, I.D.; Goericke, R.; Anderson, C.R.; Benitez-Nelson, C.; Whitney, F.A. Changes in source waters to the Southern California Bight. Deep Sea Res. II 2014. [Google Scholar] [CrossRef]
- Pörtner, H.O.; Langenbuch, M.; Michaelidis, B. Synergistic effects of temperature extremes, hypoxia, and increases in CO2 on marine animals: From Earth history to global change. J. Geophys. Res. Oceans 2005, 110. [Google Scholar] [CrossRef]
- Doney, S.C.; Balch, W.M.; Fabry, V.J.; Feely, R.A. Ocean acidification: A critical emerging problem for the ocean sciences. Oceanography 2009, 22, 16–25. [Google Scholar]
- Doney, S.C.; Fabry, V.J.; Feely, R.A.; Kleypas, J.A. Ocean acidification: The other CO2 problem. Ann. Rev. Mar. Sci. 2009, 1, 169–192. [Google Scholar] [CrossRef]
- Gruber, N.; Hauri, C.; Lachkar, Z.; Loher, D.; Frolicher, T.L.; Plattner, G. Rapid progression of ocean acidification in the California Current System. Science 2012, 337, 220–223. [Google Scholar] [CrossRef]
- Munday, P.L.; Dixson, D.L.; McCormick, M.I.; Meekan, M.; Ferrari, M.C.O.; Chivers, D.P. Replenishment of fish populations is threatened by ocean acidification. PNAS 2010, 107, 12930–12934. [Google Scholar]
- Munday, P.L.; Hernaman, V.; Dixson, D.L.; Thorrold, S.R. Effect of ocean acidification on otolith development in larvae of a tropical marine fish. Biogeosciences 2011, 8, 1631–1641. [Google Scholar] [CrossRef]
- Munday, P.L.; Pratchett, M.S.; Dixson, D.L.; Donelson, J.M.; Endo, G.G.K.; Reynolds, A.D.; Knuckey, R. Elevated CO2 affects the behavior of an ecologically and economically important reef fish. Mar. Biol. 2013, 160, 2137–2144. [Google Scholar] [CrossRef]
- Hamilton, T.J.; Holcombe, A.; Tresguerres, M. CO2-induced ocean acidification increases anxiety in rockfish via alteration of GABAA receptor functioning. Proc. R. Soc. B 2014, 281, 20132509. [Google Scholar]
- Melzner, F.; Gutowska, M.A.; Langenbuch, M.; Dupont, S.; Lucassen, M.; Thorndyke, M.C.; Bleich, M.; Pörtner, H.O. Physiological basis for high CO2 tolerance in marine ectothermic animals: Pre-adaptation through lifestyle and ontogeny? Biogeosciences 2009, 6, 2313–2331. [Google Scholar] [CrossRef]
- Hu, M.Y.; Tseng, Y.; Stumpp, M.; Gutowska, M.A.; Kiko, R.; Lucassen, M.; Melzner, F. Elevated seawater pCO2 differentially affects brachial acid-base transporters over the course of development in the cephalopod Sepia officinalis. Am. J. Physiol. Regul. Integr. Comp. Physiol. 2011, 300, R1100–R1114. [Google Scholar] [CrossRef]
- Hu, M.Y.; Tseng, Y.; Lin, L.; Chen, P.; Charmantier-Daures, M.; Hwang, P.; Melzner, F. New insights into ion regulation of cephalopod molluscs: A role of epidermal ionocytes in acid-base regulation during embryogenesis. Am. J. Physiol. Regul. Integr. Comp. Physiol. 2011, 301, R1700–R1709. [Google Scholar] [CrossRef]
- Hu, M.Y.; Lee, J.; Lin, L.; Shih, T.; Stumpp, M.; Lee, M.; Hwang, P.; Tseng, Y. Development in a naturally acidified environment: Na+/H+-exchanger 3-based proton secretion leads to CO2 tolerance in cephalopod embryos. Front. Zool. 2013, 10, 1–16. [Google Scholar] [CrossRef]
- Strathmann, R.R.; Chaffee, C. Constraints on egg masses. II. Effect of spacing, size, and number of eggs on ventilation of masses of embryos in jelly, adherent groups, or thin-walled capsules. J. Exp. Mar. Biol. Ecol. 1984, 84, 85–93. [Google Scholar] [CrossRef]
- Zeidberg, L.D.; Isaac, G.; Widmer, C.L.; Neumeister, H.; Gilly, W.F. Egg capsule hatch rate and incubation duration of the California market squid, Doryteuthis (=Loligo) opalescens: Insights from laboratory manipulations. Mar. Ecol. 2011, 32, 468–479. [Google Scholar] [CrossRef]
- Giorgi, A.E.; Congleton, J.L. Effects of current velocity on development and survival of lingcod, Ophiodon elongatus, embryos. Environ. Biol. Fishes 1984, 10, 15–27. [Google Scholar] [CrossRef]
- Messieh, S.N.; Rosenthal, H. Mass mortality of herring eggs on spawning beds on and near Fisherman’s Bank, Gulf of St. Lawrence. Can. Aquat. Living Resour. 1989, 2, 1–8. [Google Scholar] [CrossRef]
- Bograd, S.J.; Castro, C.G.; DiLorenzo, E.; Palacios, D.M.; Bailey, H.; Gilly, W.; Chavez, F.P. Oxygen declines and the shoaling of the hypoxic boundary in the California Current. Geophys. Res. Lett. 2008, 35. [Google Scholar] [CrossRef]
- Checkley, D.M.; Barth, J.A. Patterns and processes in the California Current System. Prog. Oceanogr. 2009, 83, 49–64. [Google Scholar] [CrossRef]
- Pauly, D. Gasping fish and panting squids: Oxygen, temperature and the growth of water-breathing animals. In Excellence in Ecology; Kline, O., Ed.; International Ecology Institute: Oldendorf/Luhe, Germany, 2010. [Google Scholar]
- Vojkovich, M. The California fishery for market squid (Loligo opalescens). CalCOFI Rep. 1998, 39, 55–60. [Google Scholar]
- Reiss, C.S.; Maxwell, M.R.; Hunter, J.R. Investigating environmental effects on population dynamics of Loligo opalescens in the Southern California Bight. CalCOFI Rep. 2004, 45, 87–97. [Google Scholar]
- Koslow, J.A.; Allen, C. The influence of the ocean environment on the abundance of market squid, Doryteuthis (Loligo) opalescens, paralarvae in the Southern California Bight. CalCOFI Rep. 2011, 52, 205–213. [Google Scholar]
- Warner, R.R.; Hamilton, S.L.; Sheehy, M.S.; Zeidberg, L.D.; Brady, B.C.; Caselle, J.E. Geographic variation in natal and early larval trace-elemental signatures in the statoliths of the market squid Doryteuthis (formerly Loligo) opalescens. Mar. Ecol. Prog. Ser. 2009, 379, 109–121. [Google Scholar] [CrossRef]
- Dorval, E.; Crone, P.R.; McDaniel, J.D. Variability of egg escapement, fishing mortality and spawning population in the market squid fishery in the California Current Ecosystem. Mar. Freshw. Res. 2013, 64, 80–90. [Google Scholar] [CrossRef]
- Zeidberg, L.D.; Butler, J.L.; Ramon, D.; Cossio, A.; Stierhoff, K.L.; Henry, A. Estimation of spawning habitats of market squid (Doryteuthis opalescens) from field surveys of eggs off central and southern California. Mar. Ecol. 2011, 33, 326–336. [Google Scholar]
- Arkhipkin, A.I. Statoliths as “black boxes” (life recorders) in squid. Mar. Freshw. Res. 2005, 56, 573–583. [Google Scholar] [CrossRef]
- Thorrold, S.R.; Zacherl, D.C.; Levin, L.A. Population connectivity and larval dispersal using geochemical signatures in calcified structures. Oceanography 2007, 20, 80–89. [Google Scholar] [CrossRef]
- Radtke, R.L. Chemical and structural characteristics of statoliths from the short-finned squid Illex illecebrosus. Mar. Biol. 1983, 76, 47–54. [Google Scholar] [CrossRef]
- Arkhipkin, A.I.; Bizikov, V.A. Role of the statolith in functioning of the acceleration receptor system in squids and sepioids. J. Zool. Lond. 2000, 250, 31–55. [Google Scholar] [CrossRef]
- Fields, W.G. The structure, development, food relations, reproduction, and life history of the squid, Loligo opalescens, Berry. CA Fish. Bull. 1965, 131, 1–105. [Google Scholar]
- Bettencourt, V.; Guerra, A. Growth increments and biomineralization process in cephalopod statoliths. J. Exp. Mar. Biol. Ecol. 2000, 248, 191–205. [Google Scholar] [CrossRef]
- Clarke, M.R. The cephalopod statolith—An introduction to its form. J. Mar. Biol. Ass. U.K. 1978, 58, 701–712. [Google Scholar] [CrossRef]
- Villanueva, R.; Moltschaniwskyj, N.A.; Bozzano, A. Abiotic influences on embryo growth: Statoliths as experimental tools in the squid early life history. Rev. Fish. Biol. Fish. 2007, 17, 101–110. [Google Scholar]
- Morris, C.C. Statocyst fluid composition and its effects on calcium carbonate precipitation in the squid Alloteuthis subulata (Lamarck, 1798): Towards a model for biomineralization. Bull. Mar. Sci. 1991, 49, 379–388. [Google Scholar]
- Cronin, E.R.; Seymour, R.S. Respiration of the eggs of the giant cuttlefish Sepia apama. Mar. Biol. 2000, 136, 863–870. [Google Scholar] [CrossRef]
- Gutowska, M.A.; Melzner, F. Abiotic conditions in cephalopod (Sepia officinalis) eggs: Embryonic development at low pH and high pCO2. Mar. Biol. 2009, 156, 515–519. [Google Scholar] [CrossRef]
- Strobel, A.; Hu, M.Y.A.; Gutowska, M.A.; Lieb, B.; Lucassen, M.; Melzner, F.; Pörtner, H.O.; Mark, F.C. Influence of temperature, hypercapnia, and development on the relative expression of different hemocyanin isoforms in the common cuttlefish Sepia officinalis. J. Exp. Zool. A Ecol. Genet. Physiol. 2012, 317, 511–523. [Google Scholar] [CrossRef]
- Rosa, R.; Pimentel, M.S.; Boavida-Portugal, J.; Teixeira, T.; Trubenbach, K.; Diniz, M. Ocean warming enhances malformations, premature hatching, metabolic suppression, and oxidative stress in the early life stages of a keystone squid. PLOS ONE 2012, 7, e38282. [Google Scholar]
- Rosa, R.; Trubenbach, K.; Pimentel, M.S.; Boavida-Portugal, J.; Faleiro, F.; Baptista, M.; Dionisio, G.; Calado, R.; Pörtner, H.O.; Repolho, T. Differential impact of ocean acidification on winter and summer progeny of a coastal squid (Loligo vulgaris). J. Exp. Biol. 2014, 217, 518–525. [Google Scholar] [CrossRef]
- Dorey, N.; Melzner, F.; Martin, S.; Oberhansli, F.; Teyssie, J.; Bustamante, P.; Gattuso, J.; Lacoue-Labarthe, T. Ocean acidification and temperature rise: Effects on calcification during early development of the cuttlefish Sepia officinalis. Mar. Biol. 2013, 160, 2007–2022. [Google Scholar] [CrossRef]
- Arkhipkin, A.I.; Campana, S.E.; FitzGerald, J.; Thorrold, S.R. Spatial and temporal variation in elemental signatures of statoliths from the Patagonian longfin squid (Loligo gahi). Can. J. Fish. Aquat. Sci. 2004, 61, 1212–1224. [Google Scholar] [CrossRef]
- Lacoue-Labarthe, T.; Reveillac, E.; Oberhansli, F.; Teyssie, J.L.; Jeffree, R.; Gattuso, J.P. Effects of ocean acidification on trace element accumulation in the early-life stages of squid Loligo vulgaris. Aquat. Toxicol. 2011, 105, 166–176. [Google Scholar] [CrossRef]
- Lacoue-Labarthe, T.; Villanueva, R.; Rouleau, C.; Oberhansli, F.; Teyssie, J.; Jeffree, R.; Bustamante, P. Radioisotopes demonstrate the contrasting bioaccumulation capacities of heavy metals in embryonic stages of cephalopod species. PLOS ONE 2011, 6, e27653. [Google Scholar]
- Villanueva, R. Differential increment-deposition rate in embryonic statoliths of the loliginid squid Loligo vulgaris. Mar. Biol. 2000, 137, 161–168. [Google Scholar] [CrossRef]
- Kaplan, M.B.; Mooney, T.A.; McCorkle, D.C.; Cohen, A.L. Adverse effects of ocean acidification on early development of squid (Doryteuthis pealeii). PLoS ONE 2013, 8, e63714. [Google Scholar]
- Steer, M.A.; Moltschaniwskyj, N.A.; Gowland, F.C. Temporal variability in embryonic development and mortality in the southern calamary Sepioteuthis australis: A field assessment. Mar. Ecol. Prog. Ser. 2002, 243, 143–150. [Google Scholar] [CrossRef]
- O’Dor, R.K.; Wells, M.J. Energy and nutrient flow. In Cephalopod Life Cycles. Academic Press: London, UK, 1987. [Google Scholar]
- Strathmann, R.R.; Strathmann, M.F. Oxygen supply and limits on aggregation of embryos. J. Mar. Biol. Ass. U.K. 1995, 75, 413–428. [Google Scholar] [CrossRef]
- Cohen, C.S.; Strathmann, R.R. Embryos at the edge of tolerance: Effects of environment and structure of egg masses on supply of oxygen to embryos. Biol. Bull. 1996, 190, 8–15. [Google Scholar] [CrossRef]
- Gutwoska, M.A.; Pörtner, H.O.; Melzner, F. Growth and calcification in the cephalopod Sepia officianlis under elevated seawater pCO2. Mar. Ecol. Prog. Ser. 2008, 373, 303–309. [Google Scholar] [CrossRef]
- Gutowska, M.A.; Melzner, F.; Langenbuch, M.; Bock, C.; Claireaux, G.; Pörtner, H.O. Acid-base regulatory ability of the cephalopod (Sepia officinalis) in response to environmental hypercapnia. J. Comp. Physiol. B. 2010, 180, 323–335. [Google Scholar] [CrossRef]
- Hanlon, R.T.; Bidwell, J.P.; Tait, R. Strontium is required for statolith development and thus normal swimming behaviour of hatchling cephalopods. J. Exp. Biol. 1989, 141, 187–195. [Google Scholar]
- Spivack, A.J.; You, C.; Smith, H.J. Foraminiferal boron isotope ratios as a proxy for surface ocean pH over the past 21 Myr. Nature 1993, 363, 149–151. [Google Scholar] [CrossRef]
- Raitzsch, M.; Kuhnert, H.; Hathorne, E.C.; Groeneveld, J.; Bickert, T. U/Ca in benthic foraminifers: A proxy for the deep-sea carbonate saturation. Geochem. Geophys. Geosyst. 2011, 12, Q06019. [Google Scholar]
- Keul, N.; Langer, G.; Nehrke, G.; Jan de Nooijer, L.; Nehrke, G.; Reichart, G.; Bijma, J. Incorporation of uranium in benthic formaniferal calcite reflects seawater carbonate ion concentration. Geochem. Geophys. Geosyst. 2013, 14, 102–111. [Google Scholar] [CrossRef]
- Inoue, M.; Suwa, R.; Suzuki, A.; Sakai, K.; Kawhata, H. Effects of seawater pH on growth and skeletal U/Ca ratios of Acropora digitifera coral polyps. Geophys. Res. Lett. 2011, 38. [Google Scholar] [CrossRef]
- Frieder, C.A.; Gonzalez, J.P.; Levin, L.A. Uranium in larval shells as a barometer of molluscan ocean acidification exposure. Environ. Sci. Technol. 2014, 48, 6401–6408. [Google Scholar] [CrossRef]
- Mayol, E.; Ruiz-Halpern, S.; Duarte, C.M.; Castilla, J.C.; Pelegri, J.L. Coupled CO2 and O2-driven compromises to marine life in summer along the Chilean sector of the Humboldt Current System. Biogeosciences 2012, 9, 1183–1194. [Google Scholar] [CrossRef]
- Melzner, F.T.; Thomsen, J.; Koeve, W.; Oschlies, A.; Gutowska, M.A.; Bange, H.W.; Hansen, H.P.; Körtzinger, A. Future ocean acidification will be amplified by hypoxia in coastal habitats. Mar. Biol. 2013, 160, 1875–1888. [Google Scholar] [CrossRef]
- Bockmon, E.E.; Frieder, C.A.; Navarro, M.O.; White-Kershek, L.A.; Dickson, A.G. Technical note: Controlled experimental aquarium system for multi-stressor investigation of carbonate chemistry, oxygen saturation, and temperature. Biogeosciences 2013, 10, 5967–5975. [Google Scholar] [CrossRef]
- Arnold, J.M. Normal embryonic stages of the squid Loligo pealii (Lesueur). Biol. Bull. 1965, 128, 24–32. [Google Scholar] [CrossRef]
- Segawa, S.; Yang, W.T.; Marthy, H.J.; Hanlon, R.T. Illustrated embyonic stages of the eastern Atlantic squid, Loligo forbesi. Veliger 1988, 30, 230–243. [Google Scholar]
- Foote, K.G.; Hanlon, R.T.; Iampietro, P.J.; Kvitek, R.G. Acoustic detection and quantification of benthic egg beds of the squid Loligo opalescens in Monterey Bay, California. J. Acoust. Soc. Am. 2006, 119, 844–856. [Google Scholar] [CrossRef]
- Yatsu, A.; Mochioka, N.; Morishita, K.; Toh, H. Strontium/Calcium ratios in statoliths of the neon flying squid, Ommastrephes bartrami (Cephalopoda), in the North Pacific Ocean. Mar. Biol. 1998, 131, 275–282. [Google Scholar] [CrossRef]
- Villanueva, R.; Arkhipkin, A.; Jereb, P.; Lefkaditou, E.; Lipinski, M.R.; Perales-Raya, C.; Riba, J.; Rocha, F. Embryonic life of the loliginid squid Loligo vulgaris: Comparison between statoliths of Atlantic and Mediterranean populations. Mar. Ecol. Prog. Ser. 2003, 253, 197–208. [Google Scholar] [CrossRef]
- Lloyd, D.C.; Zacherl, D.C.; Walker, S.; Paradis, G.; Sheehy, M.; Warner, R.R. Egg source, temperature and culture seawater affect elemental signatures in Kelletia kelletii larval statoliths. Mar. Ecol. Prog. Ser. 2008, 353, 115–130. [Google Scholar] [CrossRef]
- Lee, K.; Kim, T.; Byrne, R.H.; Millero, F.J.; Feely, R.A.; Lui, Y. The universal ratio of boron to chlorinity for the North Pacific and North Atlantic oceans. Geochim. Cosmochim. Acta 2010, 74, 1801–1811. [Google Scholar] [CrossRef]
- Zacherl, D.C.; Paradis, G.; Lea, D. Barium and strontium uptake into larval protoconchs and statoliths of the marine neogastropod Kelletia kelletii. Geochim. Comoschim. Acta 2003, 67, 4091–4099. [Google Scholar] [CrossRef]
- Campana, S.E. Chemistry and composition of fish otoliths: Pathways, mechanisms and applications. Mar. Ecol. Prog. Ser. 1999, 188, 263–297. [Google Scholar] [CrossRef]
- Gutowska, M.A.; Melzner, F.; Pörtner, H.O.; Meier, S. Cuttlebone calcification increases during exposure to elevated seawater pCO2 in the cephalopod Sepia officinalis. Mar. Biol. 2010, 157, 1653–1663. [Google Scholar] [CrossRef]
- Rosenthal, Y.; Field, M.P.; Sherrell, R.M. Precise determination of element/Calcium ratios in calcareous samples using sector field inductively coupled plasma mass spectrometry. Anal. Chem. 1999, 71, 3248–3253. [Google Scholar] [CrossRef]
- Swearer, S.E.; Forrester, G.E.; Steele, M.A.; Brooks, A.J.; Lea, D.W. Spatio-temporal and interspecific variation in otolith trace-elemental signatures in a temperate estuarine fish assemblage. Estuar. Coast. Shelf Sci. 2003, 56, 1111–1123. [Google Scholar] [CrossRef]
- Bennington, C.C.; Thayne, W.V. Use and misuse of mixed model analysis of variance in ecological studies. Ecology 1994, 75, 717–722. [Google Scholar] [CrossRef]
- Payan, P.; Kossmann, H.; Watrin, A.; Mayer-Gostan, N.; Boeuf, G. Ionic composition of endolymph in teleosts: Origin and importance of endolymph alkalinity. J. Exp.Biol. 1997, 200, 1905–1912. [Google Scholar]
- Shiao, J.; Lin, L.; Horng, J.; Hwang, P.; Kaneko, T. How can teleostean inner ear hair cells maintain the proper association with the accreting otolith? J. Comp. Neurol. 2005, 488, 331–341. [Google Scholar] [CrossRef]
- Lacoue-Labarthe, T.; Warnau, M.; Oberhansli, F.; Teyssie, J.; Jeffree, R.; Bustamante, P. First experiments on the maternal transfer of metals in the cuttlefish Sepia officinalis. Mar. Pollut. Bull. 2008, 57, 826–831. [Google Scholar] [CrossRef]
- Thorrold, S.R.; Jones, G.P.; Planes, S.; Hare, J.A. Transgenerational marking of embryonic otoliths in marine fishes using barium stable isotopes. Can. J. Fish. Aquat. Sci. 2006, 63, 1193–1197. [Google Scholar] [CrossRef]
- Russell, A.D.; Hönisch, B.; Spero, H.J.; Lea, D.W. Effects of seawater carbonate ion concentration and temperature on shell U, Mg, and Sr in cultured planktonic foraminifera. Geochim. Cosmochim. Acta 2004, 68, 4347–4361. [Google Scholar] [CrossRef]
- Redfield, A.C.; Goodkind, R. The significance of the Bohr effect in the respiration and asphysixiation of the squid, Loligo pealei. J. Exp. Biol. 1929, 6, 340–349. [Google Scholar]
- Bath, G.E.; Thorrold, S.R.; Jones, C.M.; Campana, S.E.; McLaren, J.W.; Lam, J.W.H. Strontium and barium uptake in aragonitic otoliths of marine fish. Geochim. Cosmochim. Acta 2000, 64, 1705–1714. [Google Scholar] [CrossRef]
- Liu, B.; Chen, X.; Chen, Y.; Tian, S. Geographic variation in statolith trace elements of the Humboldt squid, Dosidicus gigas, in high seas of Eastern Pacific Ocean. Mar. Biol. 2013, 160, 2853–2862. [Google Scholar] [CrossRef]
- De Leersnyder, M.; Lemaire, J. Sur la composition minerale du liquid periembryonnaire de L’oeuf de Sepia officinalis L. J. Cah. Biol. Mar. 1972, 8, 429–431. [Google Scholar]
- Zumholz, K.; Klugel, A.; Hansteen, T.; Piatkowski, U. Statolith microchemistry traces the environmental history of the boreoatlantic armhook squid, Gonatus. fabricii. Mar. Ecol. Prog. Ser. 2007, 333, 195–204. [Google Scholar] [CrossRef]
- Arbuckle, N.S.M.; Wormuth, J.H. Trace elemental patterns in Humboldt squid statoliths from three geographic regions. Hydrobiologia 2014, 725, 115–123. [Google Scholar] [CrossRef]
© 2014 by the authors; licensee MDPI, Basel, Switzerland. This article is an open access article distributed under the terms and conditions of the Creative Commons Attribution license (http://creativecommons.org/licenses/by/3.0/).
Share and Cite
Navarro, M.O.; Bockmon, E.E.; Frieder, C.A.; Gonzalez, J.P.; Levin, L.A. Environmental pH, O2 and Capsular Effects on the Geochemical Composition of Statoliths of Embryonic Squid Doryteuthis opalescens. Water 2014, 6, 2233-2254. https://doi.org/10.3390/w6082233
Navarro MO, Bockmon EE, Frieder CA, Gonzalez JP, Levin LA. Environmental pH, O2 and Capsular Effects on the Geochemical Composition of Statoliths of Embryonic Squid Doryteuthis opalescens. Water. 2014; 6(8):2233-2254. https://doi.org/10.3390/w6082233
Chicago/Turabian StyleNavarro, Michael O., Emily E. Bockmon, Christina A. Frieder, Jennifer P. Gonzalez, and Lisa A. Levin. 2014. "Environmental pH, O2 and Capsular Effects on the Geochemical Composition of Statoliths of Embryonic Squid Doryteuthis opalescens" Water 6, no. 8: 2233-2254. https://doi.org/10.3390/w6082233
APA StyleNavarro, M. O., Bockmon, E. E., Frieder, C. A., Gonzalez, J. P., & Levin, L. A. (2014). Environmental pH, O2 and Capsular Effects on the Geochemical Composition of Statoliths of Embryonic Squid Doryteuthis opalescens. Water, 6(8), 2233-2254. https://doi.org/10.3390/w6082233