Abstract
Segmented mesocosms (n = 3) packed with sand, sandy loam or clay loam soil were used to determine the effect of soil texture and depth on transport of two septic tank effluent (STE)-borne microbial pathogen surrogates—green fluorescent protein-labeled E. coli (GFPE) and MS-2 coliphage—in soil treatment units. HYDRUS 2D/3D software was used to model the transport of these microbes from the infiltrative surface. Mesocosms were spiked with GFPE and MS-2 coliphage at 105 cfu/mL STE and 105–106 pfu/mL STE, respectively. In all soils, removal rates were >99.99% at 25 cm. The transport simulation compared (1) optimization; and (2) trial-and-error modeling approaches. Only slight differences between the transport parameters were observed between these approaches. Treating both the die-off rates and attachment/detachment rates as variables resulted in an overall better model fit, particularly for the tailing phase of the experiments. Independent of the fitting procedure, attachment rates computed by the model were higher in sandy and sandy loam soils than clay, which was attributed to unsaturated flow conditions at lower water content in the coarser-textured soils. Early breakthrough of the bacteria and virus indicated the presence of preferential flow in the system in the structured clay loam soil, resulting in faster movement of water and microbes through the soil relative to a conservative tracer (bromide).
1. Introduction
Septic tank effluent (STE) contains pathogenic microorganisms, such as enteric viruses and bacteria, which can cause waterborne diseases and pose a public health risk if not properly treated. Onsite wastewater treatment systems (OWTS) are commonly used in suburban and rural areas in the United States and elsewhere. A conventional OWTS consists of a septic tank and associated soil treatment unit (STU), or drainfield, where attenuation and/or removal of microbial contaminants can take place through interactions with the soil, preventing their transport to groundwater. Nevertheless, contamination of groundwater below the STU is a concern, especially in areas with shallow groundwater tables.
In order to protect drinking water, the separation distance between the infiltrative surface of the STU and fluctuating water table has to be determined on a site-by-site basis, and seasonal variations in separation distance have to be considered to avoid microbial contamination. The US EPA [1] recommends a minimum separation distance of 45 cm, regardless of soil chemical and physical characteristics. However, separation distance requirements in the USA vary widely by state, region and sensitivity of receiving waters to contaminant load. Furthermore, differences in soil properties (e.g., texture, structure, pH) are known to affect STU performance, which may lead to differences in removal of viruses and bacteria [1,2,3].
A number of studies have investigated the removal efficiency of bacteria in STUs and the processes involved. Crites [4] suggested that bacterial removal or inactivation in STUs is associated with predation by bactrivorous organisms and exposure to sunlight. Mechanical filtration, adsorption, and flow rate also have a significant effect on removal of pathogenic bacteria [2,5,6]. All of these processes are influenced by soil texture and structure. Fine textured and poorly structured soils are expected to remove bacteria mainly through mechanical filtration because of the smaller pore sizes and lower hydraulic conductivity of those soils. Together with a larger surface area, this results in higher rates of bacteria adsorption [2]. In contrast, coarse and well-structured soils have larger pores and lower porosity values, which allow for better aeration that promotes microbial predation and attenuation [7].
Viruses are thought to be removed in STUs through adsorption to soil particles rather than by mechanical filtration [8,9]. Viruses have a smaller diameter compared to soil pores, which prevents them from being trapped in the pore space. Adsorption of viruses is a function of the physical and chemical properties of the soil, particularly pH, organic matter content, and water content [10,11,12,13].
Mature OWTS systems develop a biological growth layer of low permeability at the infiltrative surface of the STU, known as a biomat. Typically, the biomat extends up to 2 cm below the water-soil interface [14,15]. It may enhance the inactivation of microbes through mechanical filtration, because partial clogging of smaller soil pores results in reduced infiltration rates and the development of unsaturated flow conditions in the underlying soil profile [14,15]. Unsaturated flow conditions result in longer contact times between microbes and soil particles, which improves the pathogen removal efficiency of the soil treatment unit [15,16].
The retention of microorganisms in soil can be affected by preferential flow, which may be associated with pathways created by plant roots and earthworms, the presence of interaggregate spaces [17,18], and differences in hydraulic conductivity within the soil strata [19]. Preferential flow increases the travel velocity of the aqueous phase, allowing for faster and deeper movement of microbes into the soil profile [20,21,22].
The complex nature of pathogen removal and inactivation in the STU presents a difficult problem with respect to predicting OWTS effectiveness. Contaminant transport models can be used to predict the microbial transport in soils and to help elucidate the factors that control microbial fate as STE moves through the soil profile.
Several models have been developed to simulate virus and bacteria transport in soil. The commercially-available HYDRUS software package is widely used to simulate microbial transport and fate processes, including the transport of viruses, bacteria, and colloids based on either attachment/detachment theory or filtration theory in variably saturated porous media [22,23,24,25,26]. The model supports an interactive graphics-based user interface, and the computational program numerically solves the Richards equation for variably saturated water flow, as well as the advection-dispersion equations for both heat and solute transport. There are HYDRUS versions available with one-, two- and three-dimensional transport modeling capabilities.
The use and calibration of sophisticated transport models, like HYDRUS 2D/3D, permits investigation of the role of microbial inactivation, removal, and transport processes in homogeneous/heterogeneous soil media by quantifying parameters, such as die-off rates in water and soil or attachment/detachment rates [23]. The calibrated transport parameters can be used to calculate microbial removal as a function of distance between the infiltrative surface and the water table, thus permitting comparison among different soils. HYDRUS is a valuable and accepted tool for drinking water protection and water resources management purposes. Because of its many capabilities and multi-dimensional functionality, HYDRUS 2D/3D was chosen for modeling our test data.
The objectives of our research project were to: (1) determine the extent to which removal of two microbial pathogen surrogates—a coliphage virus and a tracer bacterium—is affected by soil texture and depth; (2) measure the survival of the coliphage virus and tracer bacterium in sterile and non-sterile unsaturated soil and STE; and (3) model microbial transport and estimate transport parameters. The results were intended to define and evaluate the potential risk of microbial contamination of groundwater resulting from soil-based treatment of STE. In this paper, we focus on the modeling of microbial transport and how different approaches to modeling—numerical optimization versus visual assessment—best describe experimental data.
2. Material and Methods
Replicate (n = 3) segmented mesocosms were constructed to investigate the removal of microbial pathogen surrogates. The mesocosms consisted of straight-sided polypropylene Nalgene jars (10.5 cm height, 6.5 cm diameter) connected to each other with plastic tubing (Figure 1). Sample ports between jars allowed for collecting drainage water directly below the infiltrative surface (4 cm), and at succeeding 10.5 cm depths intervals (14.5 cm, 25 cm, 35.5 cm), hereafter referred to as 4 cm, 14 cm, 25 cm, and 35 cm. The mesocosms were packed with (1) a sandy, B and C horizon soil from Kingston, Rhode Island, USA; (2) a sandy loam soil from Golden, Colorado, USA; or (3) a structured clay loam soil from Griffin, Georgia, USA. These soils are typical of STUs in their respective areas. Select physical and chemical properties of the septic tank influent and for the test soils are shown in Table 1 and Table 2, respectively. The remaining space in the top, 4 cm mesocosm was packed with gravel to simulate a layer of rock that is typically placed at the bottom of conventional OWTS leachfield trench. After initial packing, the mesocosms were saturated by pumping three pore volumes of clean water upward from the bottom of the mesocosms. Afterwards, the water was allowed to drain freely. The mesocosms were maintained in the dark at room temperature (19–21 °C).
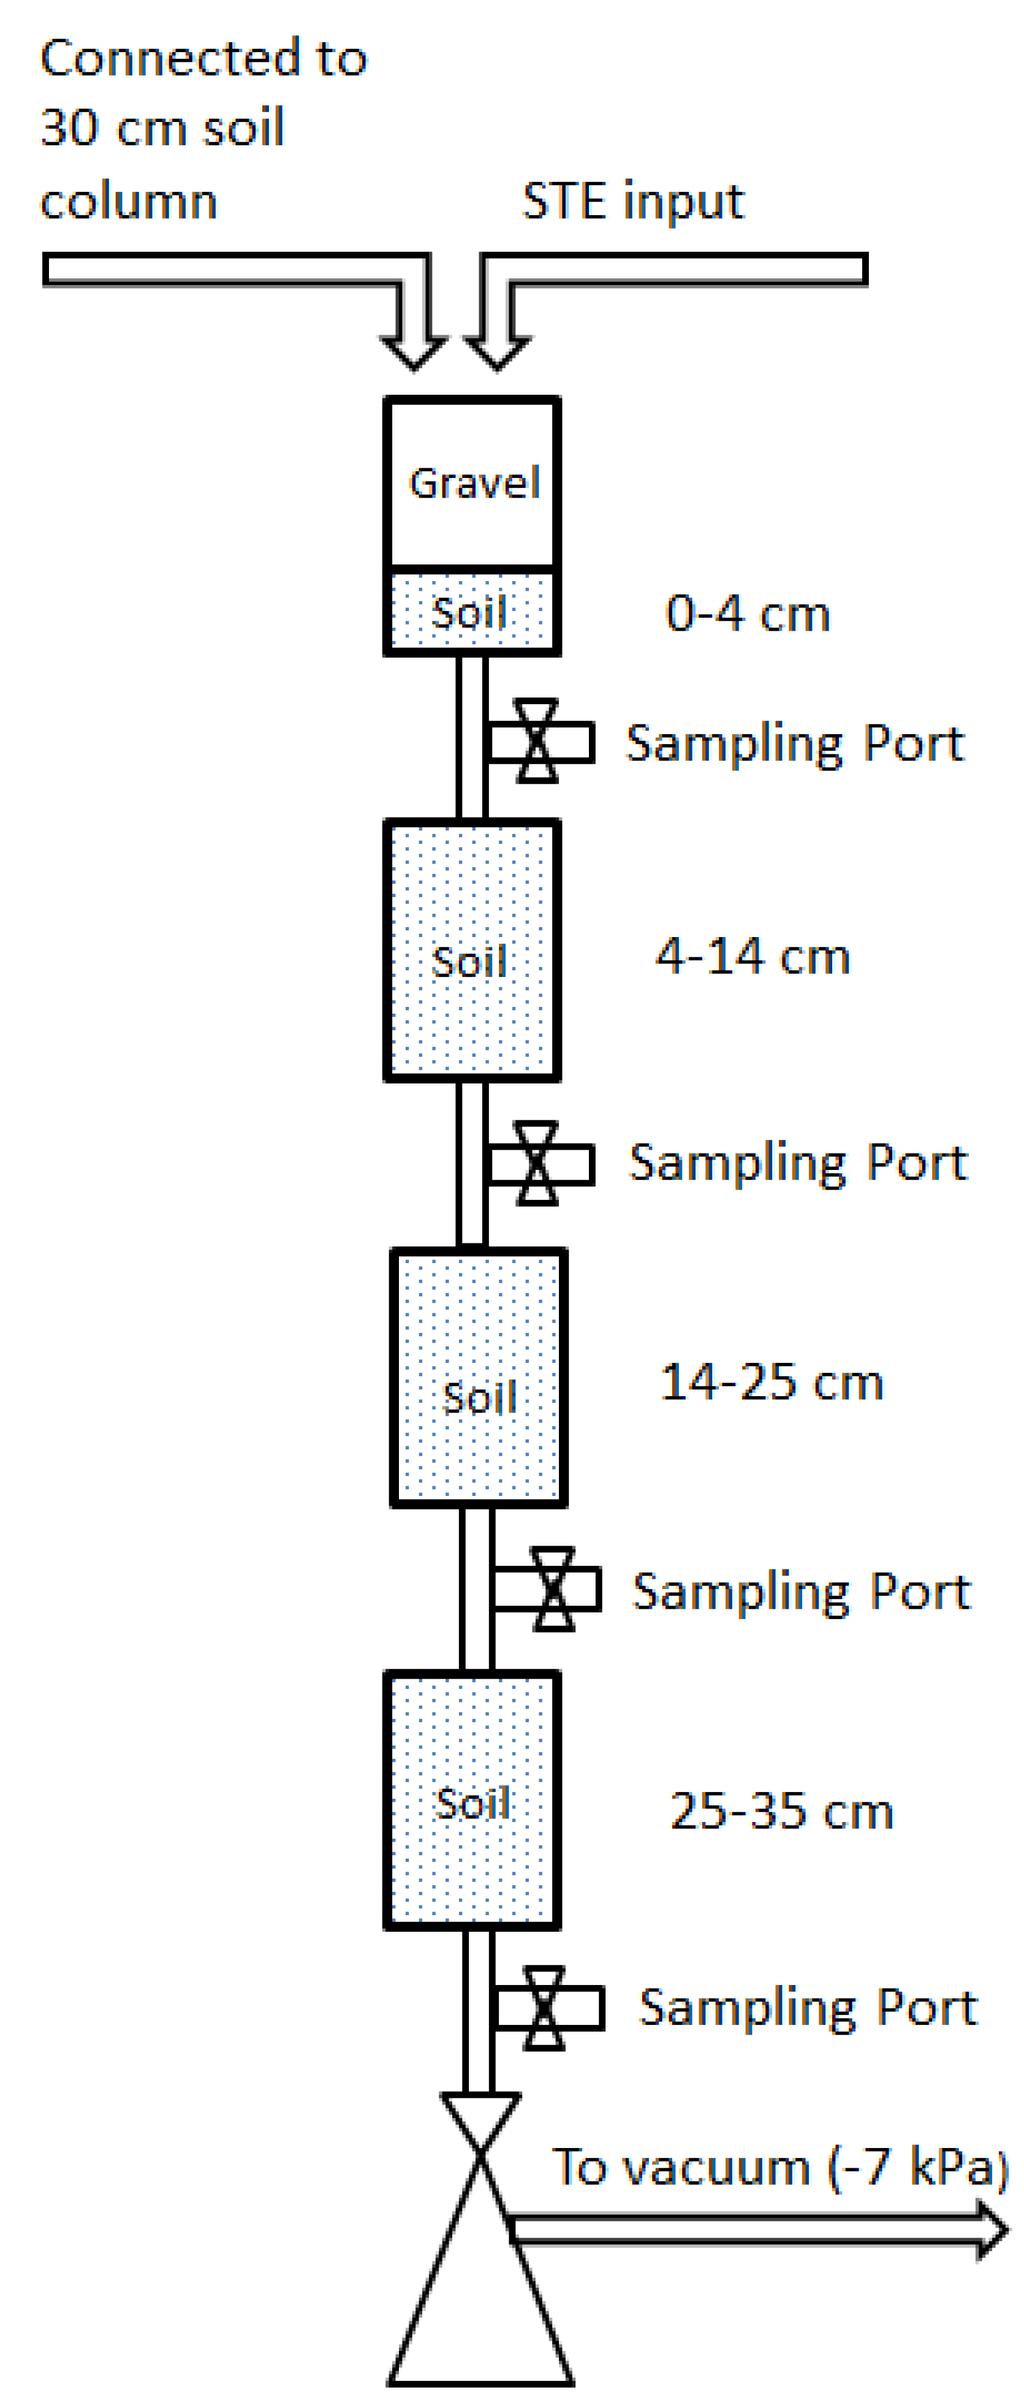
Figure 1.
Schematic of experimental setup. Drawing is not to scale.
Septic tank effluent was obtained every 7–10 days from an OWTS serving a group home managed by the Rhode Island Department of Mental Health, Rehabilitation and Hospitals in southern Rhode Island, and stored in the dark at room temperature. Select chemical and microbiological properties of the STE are provided in Table 2. STE was applied to the infiltrative surface of the mesocosms every 12 h at a rate of 2.4 cm/day (0.6 gal./sq.ft./day) using a programmable peristaltic pump (IsmaTec, IDEX Health and Science GmBH, Wertheim, Germany). To mimic the soil atmosphere of a full-scale operating STU trench at the infiltrative surface, the headspace of the top mesocosm (4 cm) was vented to a 30-cm column of soil. Vacuum pressure of −7 kPa was used to approximate the capillary suction from underlying unsaturated soil. Water samples were collected either 3 h to 5 h after dosing (sandy and sandy loam soils) or during dosing (clay loam soil). The samples were withdrawn from the sample ports below the mesocosms using UV-sterilized glass vials and a mild vacuum, with 1–3 mL of water collected from each mesocosm per sampling event.

Table 1.
Chemical and microbial properties of septic tank effluent .
| Parameter | BOD5 (mg/L) | pH | Dissolved O2 (mg/L) | Fecal coliforms (cfu/mL) | Coli-phages (pfu/mL) | Total P (mg/L) | Total N (mg/L) |
|---|---|---|---|---|---|---|---|
| Average | 224 | 6.82 | 0 | 2.93 × 10³ | 0 | 6 | 30 |
| Max | 383 | 7.20 | 0 | 8.70 × 10³ | 2 | 8 | 52 |
| Min | 45 | 6.43 | 0 | 1.00 × 10² | 0 | 2 | 0 |
| n | 35 | 36 | 23 | 32 | 32 | 33 | 33 |
Table 2.
Soil properties prior to septic tank effluent addition (initial), and after biomat formation.
| Textural class | Depth (cm) | pH | Total C (g/kg soil) | Total N (g/kg soil) | Water content (g/g soil) |
|---|---|---|---|---|---|
| Sand | Initial | 3.2 | 3.6 | 0.3 | - |
| 4 | 6.8 | 3.5 | 0.3 | 0.15 | |
| 14 | 5.9 | 3.3 | 0.3 | 0.09 | |
| 25 | 5.9 | 2.5 | 0.1 | 0.09 | |
| 35 | 8.0 | 2.7 | 0.2 | 0.04 | |
| Sandy loam | Initial | 6.0 | 12.9 | 1.1 | - |
| 4 | 6.7 | 9.3 | 1.0 | 0.23 | |
| 14 | 6.7 | 9.9 | 0.9 | 0.21 | |
| 25 | 7.0 | 10.2 | 0.9 | 0.21 | |
| 35 | 7.1 | 10.7 | 1.0 | 0.14 | |
| Clay loam | Initial | 4.2–4.6 | 2.7–4.8 | 0.3–0.6 | - |
| 4 | 6.0 | 5.4 | 1.0 | 0.32 | |
| 14 | 6.1 | 4.7 | 0.9 | 0.32 | |
| 25 | 5.7 | 2.7 | 0.8 | 0.30 | |
| 35 | 5.4 | 2.6 | 0.8 | 0.27 |
STE was analyzed for dissolved oxygen immediately after collection using the azide modification of the Winkler titration method [27]. The pH was determined using a combination pH electrode and a Model UB-10 pH meter (Denver Instruments, Denver, CO, USA). STE was analyzed for fecal coliform bacteria using the membrane filtration method [27], and for bacteriophage capable of growing on E. coli (K12) using the plaque-forming assay of Adams [28]. Five-day biochemical oxygen demand (BOD5) was determined following standard procedures [27]. Total P and total N were measured in STE using the persulfate digestion method [27], followed by colorimetric analysis [29,30].
2.1. Bromide Tracer
Bromide (Br-) is a conservative tracer that permits measuring the breakthrough time of the aqueous solution and relates it to the (retarded) transport of either the bacterial or viral tracers. Tracer tests were conducted by spiking the STE influent with KBr (~20 mg Br−/L). Bromide concentrations were measured using the method of Lepore and Barak [31]. The bromide tracer test data were analyzed with the public domain model CXTFIT to determine the dispersivity (λ) value of each test material [32]. The data were then used for calibration of the transport model.
2.2. E. coli Tracer
A novel strain of E. coli (BTF 132) (Biomérieux, Hazelwood, MO, USA) was used as a bacterial tracer. The strain has a gene for the production of green fluorescent protein (GFP) inserted into the chromosome. Because the gene is chromosomal and not easily lost, this GFP-labeled E. coli strain is ideal for use as a bacterial tracer [33]. Bacterial colonies formed on agar plates glow green under UV light; therefore, it is possible to differentiate between the bacteria that were added to the mesocosms and native fecal coliform bacteria, which do not fluoresce.
For each bacterial addition experiment, GFP E. coli were grown overnight at 37 °C in lysogeny broth (LB) and then diluted in phosphate-buffered saline (PBS) solution to ~5 × 10⁶ cfu/mL. Approximately 10 mL of the diluted GFP E. coli culture was added to each mesocosm over a 37-h period, coincident with the STE dosings (a total of four, 2.5-mL doses). GFP E. coli were enumerated using a membrane filtration method with visualization under UV light [27].
2.3. Virus Tracer
The bacteriophage MS-2 was used as a tracer. MS-2 is a single-stranded RNA coliphage with a 25-nm diameter and an isoelectric point of 3.9 [13]. E. coli strain K12 was used as the host for the bacteriophage. MS-2 bacteriophage was obtained from the Colorado School of Mines (Golden, CO). For each virus addition experiment, MS-2 was diluted in PBS to ~5 × 10⁶ pfu/mL and added as described above for the E. coli tracer experiment. The bacteriophage in the collected samples were enumerated using the plaque-forming assay of Adams [28] on LB agar plates, which were incubated for ~4 h at 37 °C, followed by incubation at room temperature overnight before counting plaques in the host lawn.
2.4. Survival in Soil and STE
Experiments were conducted to determine the survival of the microbial pathogen surrogates in soil and STE. For soil, 2 g (air-dry weight) of soil from each of the three soil types were placed in plastic scintillation vials, in triplicate. Prior to use, the soil was either air-dried or sterilized (121 °C for 60 min on 5 consecutive days). GFP E. coli or MS-2 bacteriophage suspension was added to the soil to final concentration of ~2.4 × 10⁵ cfu (pfu)/g soil. Three replicate vials were sacrificed periodically to enumerate the pathogen surrogates. Microorganisms were extracted with 20 mL of sterile PBS (for E. coli) [34] or sterile 1.5% beef extract, pH 8.7 (for MS-2) [13] added to each vial, after which the vials were placed on a reciprocal shaker for 10 min. GFP E. coli and MS-2 bacteriophage were enumerated as described above.
To determine survival in STE, four 250-mL polypropylene bottles containing 100 mL of effluent were amended with: (1) ~4.8 × 10² cfu GFP E. coli/mL; (2) ~5.2 × 10⁶ cfu GFP E. coli/mL; (3) ~2.3 × 10² pfu MS-2 coliphage/mL; or (4) ~4.4 × 10⁶ pfu MS-2 coliphage/mL. The bottles containing the amended STE were then incubated at room temperature, in the dark. Samples were analyzed for E. coli and MS-2 as described above. Initial concentrations were determined by identical dilutions using PBS in place of STE followed by immediate enumeration. This experiment was repeated three times.
2.5. Soil Properties
Sand, sandy loam, and clay loam soils were analyzed prior to the start of the experiment and after STE dosing for 27, 31 and 44, weeks, respectively. After 44 weeks, all mesocosms had developed a biomat layer that extended over the entire thickness of the soil (4 cm) at the infiltration surface. The total carbon and nitrogen content of the soil was determined using a Carlo Erba EA1108 CHN analyzer (Lakewood, NJ, USA). The soil pH was determined using a 1:5 soil/water ratio with a combination pH electrode and a Model UB-10 pH meter (Denver Instruments). Particle size analysis was conducted using the pipette method [35]. The water content was determined gravimetrically.
2.6. Bacteria and Virus Transport Modeling
HYDRUS 2D/3D was used to simulate the transport of microbes in the segmented mesocosms at different depths. The model simulates virus and bacteria transport and fate processes based on a modified form of the advection-dispersion equation [23] (Equation (1)):
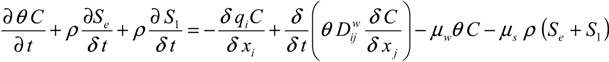 where C and S are the (virus, bacteria) solution concentration [NcL−3] and the solid phase (virus, bacteria) concentration [NcM−1], respectively. Subscripts e and 1 represent equilibrium and kinetic sorption sites. Nc is a number of microbial particles, and μw and μs represent inactivation and degradation processes (die-off) in the liquid and solid phases, respectively. Dwij is the dispersion coefficient for the liquid phase [L2T−1], θ is the volumetric water content [L3L−3], ρ is the bulk density of porous medium [ML−3], and q is the specific discharge [L3T−1]. Mass transfer between the aqueous and solid phases can be described as in (Equation (2)):
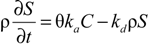 where ka is the first-order attachment coefficient [T−1] and kd the first-order detachment coefficient [T−1]. According to Simunek [23], the attachment and detachment coefficients are strongly dependent upon the water content, with attachment significantly increasing as the water content decreases. Linear adsorption kinetics were assumed. The chemical non-equilibrium model was used, with 50% of all sorption sites assumed to sorb instantaneously and the other 50% are governed by kinetic sorption.
A 2D columnar hydraulic model domain was developed (Figure 2) with observation nodes at 4 cm, 14 cm and 25 cm. The model geometry closely resembled the experimental set-up of the E. coli and MS-2 coliphage column experiments, that is, the model boundary on top of the flow domain was open to the atmosphere. The pulsed injections of microbial and conservative tracer (bromide) occurred into an initially unsaturated columnar environment. The bottom boundary was set at a fixed negative pressure head −7 kPa to simulate drainage into the unsaturated zone beneath. No-flux boundaries define the system along the column side boundaries. The flow and transport through the soil was modeled either with or without a 4-cm thick biomat layer. The properties of the porous materials were obtained from the HYDRUS soil catalog [36]. Based on literature data, the diameter was set at 1.1 μm for E. coli and 0.025 μm for the MS-2 coliphage [37].
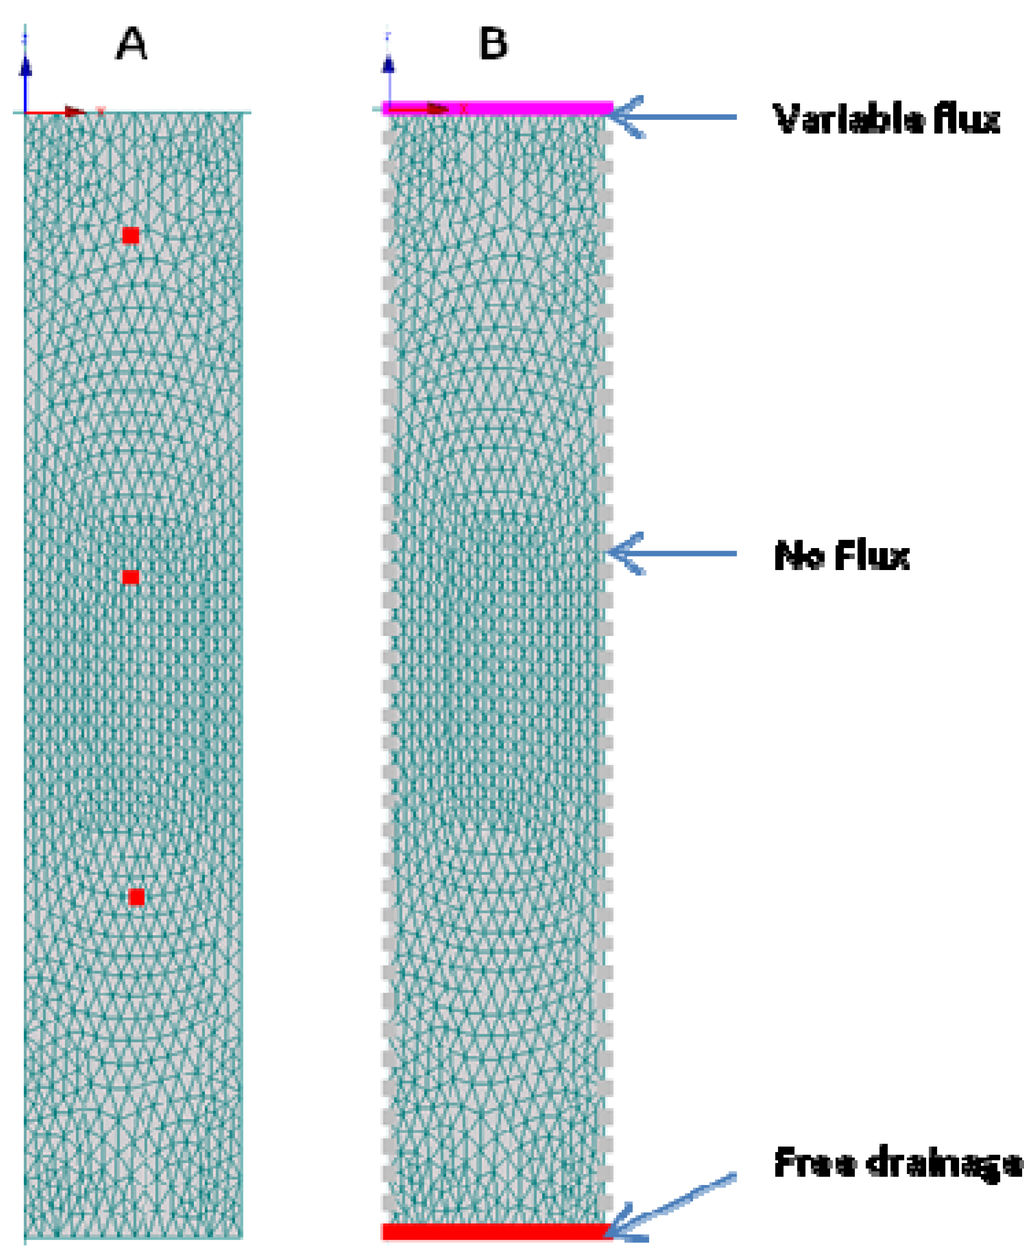
Figure 2.
Hydraulic model domain with (A) observation nodes at 4 cm, 14 cm and 25 cm depths; (B) boundary conditions.
3. Results
The bromide tracer test data and CXTFIT 2.1code were used to determine the column system dispersivity (λ) for all three soils. Model fits were good with R2 values ranging from 0.97 to 0.99. The dispersivity value calculated by CXTFIT 2.1 was approximately 0.289 cm, which is typical for these types of experiments, and is consistent with the range of values (0.06 to 0.816 cm) reported by others [38,39,40,41,42,43]. Next, the hydraulics of the HYDRUS model domain was calibrated using the conservative tracer breakthrough curves (BTC). The tracer test results were fitted for each of the three soil column depth intervals (0–4 cm, 4–10.5 cm, and 10.5–25 cm). The data obtained at the 35 cm sample port was not fitted because E. coli and MS-2 phage concentrations were always below detection limit at that depth. The model results were plotted against the observed data (Figure 3).
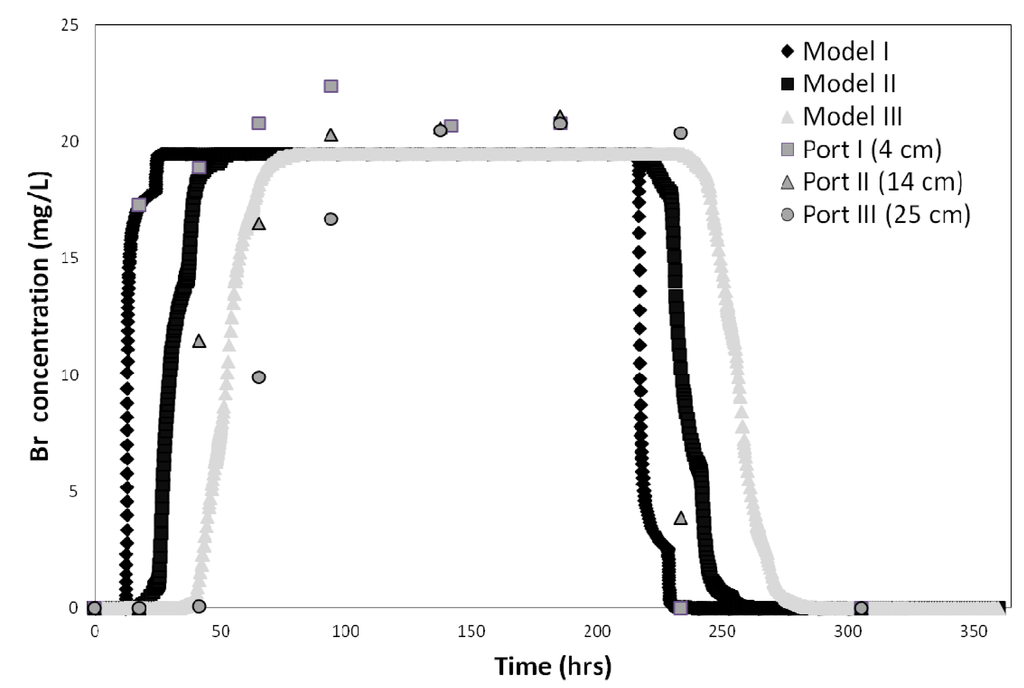
Figure 3.
Bromide tracer test results and best fit obtained for the three soil column depth intervals (0–4 cm, 4–14 cm, and 14–25 cm) in sandy soil.
The experimental bacterial transport data were fitted to HYDRUS utilizing the model’s attachment/detachment module. The data were fitted in two steps: (1) inverse solution, keeping constant the STE and soil die-off rates values (Table 3 and Table 4), to determine the optimized attachment/detachment rates; and (2) a trial-and-error process in which die-off and attachment/detachments rates were modified simultaneously until an acceptable graphical fit was achieved. During the trial-and-error process, the emphasis was on achieving the best fit of the tailing end of experimental data. The best-fit simulations of the bacteria and virus test data from mesocosms are shown in Figure 4 and Figure 5.
Table 3.
Modeled green fluorescent protein (GFP) E. coli and MS-2 phage peak concentrations for sandy, sandy loam, and clay loam soil using optimization or trial-and-error approaches. Values in parentheses are percent removal rates. The microbial tracers (C0 = initial concentration) were applied together with STE at a hydraulic loading rate of 2.4 cm/day every 12 h over 37 h. BD: below detection limit.
| Micro-organism | Soil type | C0 (cfu/mL) | Simulation type | Peak concentration (cfu/mL) | ||
|---|---|---|---|---|---|---|
| 4 cm | 14 cm | 25 cm | ||||
| E. coli | Sandy | 1.0 × 10⁵ | Trial/Error | 5.42 × 10⁴ (45.80) | 8.76 × 10² (99.12) | 1.35 × 10 (99.99) |
| Optimized | 5.46 × 10⁴ (45.40) | 9.32 × 10² (99.07) | 1.53 × 10 (99.98) | |||
| Sandy loam | 5.9 × 10⁶ | Trial/Error | 2.45 × 10⁶ (58.47) | 5.30 × 10⁴ (99.10) | 1.46 × 10³ (99.98) | |
| Optimized | 2.60 × 10⁶ (55.93) | 7.64 × 10⁴ (98.71) | 2.74 × 10³ (99.95) | |||
| Clay loam | 5.9 × 10⁶ | Trial/Error | 1.02 × 10⁶ (82.71) | 8.08 × 10² (99.99) | BD (100) | |
| Optimized | 9.36 × 10⁵ (84.14) | 4.62 × 10² (99.99) | BD (100) | |||
| MS-2 Phage | Sandy | 1.0 × 10⁵ | Trial/Error | 1.85 × 10³ (98.15) | BD (100) | BD (100) |
| Optimized | 2.38 × 10⁴ (76.20) | BD (100) | BD (100) | |||
| Sandy loam | 5.9 × 10⁶ | Trial/Error | BD | BD | BD | |
| Optimized | BD | BD | BD | |||
| Clay loam | 5.9 × 10⁶ | Trial/Error | BD | BD | BD | |
| Optimized | BD | BD | BD | |||
Table 4.
Measured GFP E. coli die-off rates in soil and septic tank effluent.
| Medium | Die-off rate (h−1) | |
|---|---|---|
| Measured | R2 | |
| Sand | 0.0617 | 0.791 |
| Sandy loam | 0.0298 | 0.965 |
| Clay loam | 0.2476 | 0.965 |
| Septic tank effluent | 0.0824 | 0.891 |
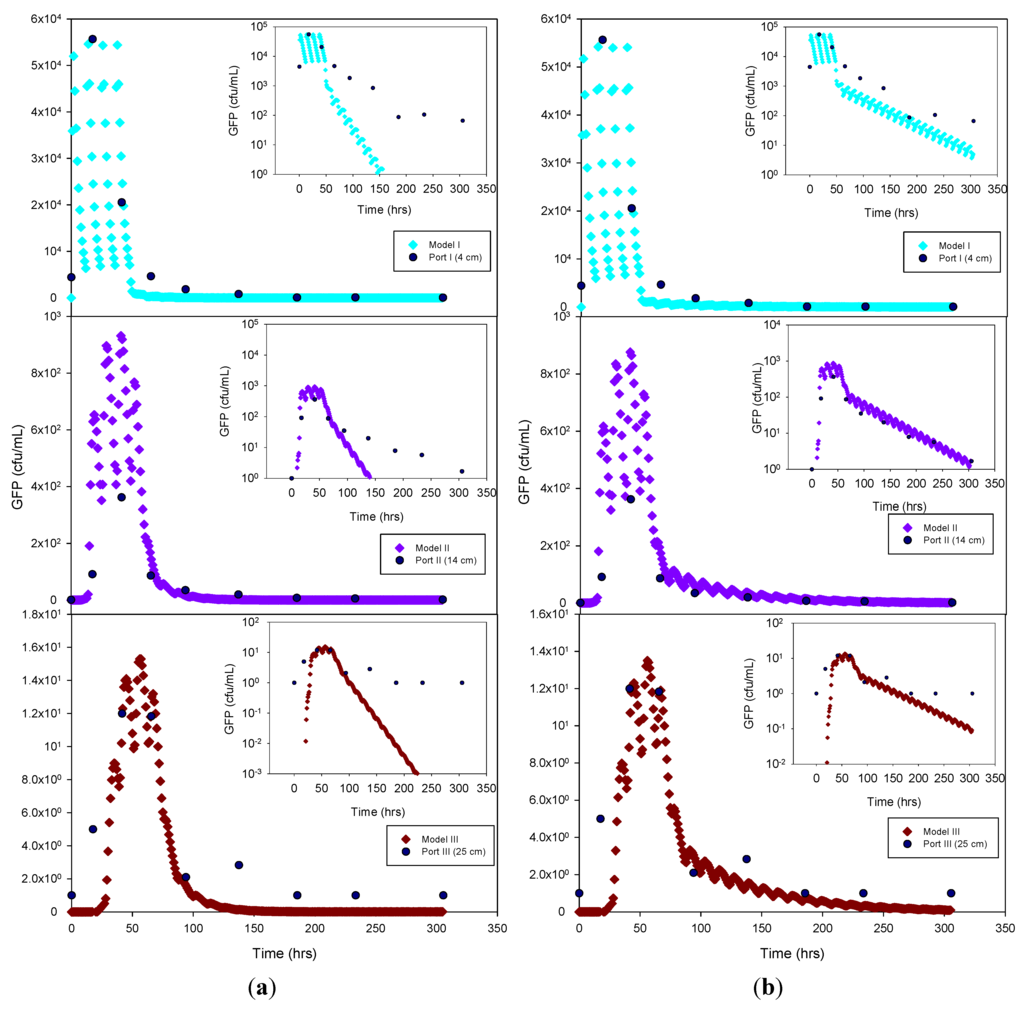
Figure 4.
Experimental GFP E. coli data and HYDRUS optimization (a) and trial-and-error; (b) simulation for the sandy soil at 4 cm, 14 cm and 25 cm depth. The log-normal inserts emphasize the tailing phase.
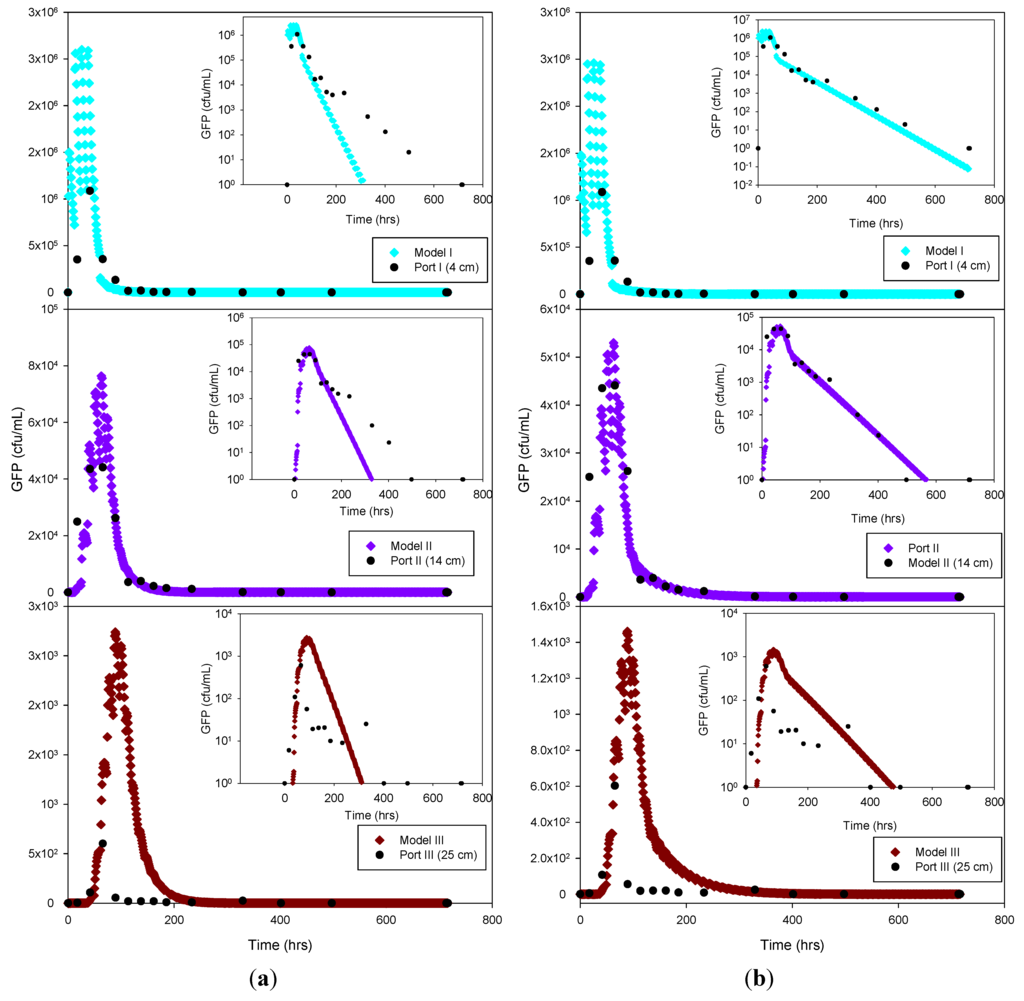
Figure 5.
Experimental GFP E. coli data and HYDRUS optimization (a) and trial-and-error; (b) simulation for the sandy loam soil at 4 cm, 14 cm and 25 cm depth. The log-normal inserts emphasize the tailing phase.
The experimental data and the model results were plotted both as normal-normal and log-normal graphs to emphasize the two principal phases of these experiments, i.e., the early, high concentration breakthrough, and the subsequent tailing phase characterized by low microbe concentrations. GFP E. coli concentration was generally underestimated by the optimization simulation, while a fairly good fit was achieved by the trial-and-error procedure, particularly for the tailing phase. The normal-normal and log-normal plots of the modeled E. coli concentrations captured the oscillations caused by periodic dosing of the column system with STE. The measured bacteria data do not show these oscillations because the effluent sampling frequency was not sufficiently high to capture these changes. Initial and peak concentrations simulated at each sampling port and soil type tested are shown in Table 3. As expected, the highest concentrations of bacteria and virus were measured at the beginning of the experiment. This breakthrough period is captured well by the model, as shown in the normal-normal graphs (Figure 4 and Figure 5). No breakthrough was observed at depths greater than 14 cm for any of the MS-2 coliphage mesocosm experiments, except for the sandy soil. No differences were observed between the peak concentrations generated by the optimized model and the trial-and-error approach. At 4 cm, for all soils, simulated peak concentrations (by trial-and-error and optimization) show removal rates ranging from 45% to 84% for bacteria. At 25 cm, for all soils, more than 99% of the added bacteria were removed. E. coli removal was greatest in the clay loam (100%) and lowest in the sandy loam (99.95%). In the case of MS-2 phage, removal was even higher, resulting in a reduction of 98.15% at 4 cm, and near-detection limit concentrations at 14 cm. Examination of the experimental data for the structured clay loam suggests that early breakthrough of the bacteria tracer occurred beneath the second (14 cm) sampling port (Figure 6). Overall, simulated removal in all three soil types was consistent with the experimental data at all depths. MS-2 phage experimental data were not fitted for sandy loam and clay loam soils because all values recorded at 4 cm and 14 cm were below detection limit. Only the few detects in sandy soil experiment were simulated (Figure 7) and showing MS-2 phage concentration <1 has only theoretical meaning, Although, the simulation results demonstrate that the model was able to adequately capture the experimental results.
This suggests that the early breakthrough of E. coli is not linked to (bio)chemical transport phenomena, but rather must be caused by preferential flow conditions expected in a structured soil. Independent of the cause, the HYDRUS model could not adequately capture the early breakthrough in the clay loam soil.
GFP E. coli and virus transport parameters obtained from the model through optimization and trial-and-error approaches are shown in Table 5. The goodness-of-fit (R2) of the model was 0.83 or greater for the bacteria simulations, and 0.76 for the virus data. The nature of the graphical best-fit procedure precluded calculation of R2 values for the trial-and-error simulations. The liquid (SinkL) and solid (SinkS) phase GFP E. coli die-off rates in the optimization and trial-and-error simulations were generally within a factor of three of each other, except for SinkS for the clay loam soil, which varied by about an order of magnitude. Overall, the trial-and-error die-off rates tended to be lower than the measured values used in the optimization procedure. Lower trial-and-error die-off rates appeared to have been compensated for by attachment rates that were approximately 2 to 3 times greater than those obtained by optimization. In the case of the sandy soil attachment rate, the results from both estimation methods resulted in identical outcomes. By contrast, detachment rates were 37 to 74 times lower than attachment rates for trial-and-error and 1.3 to 37 times lower for the optimized simulation. The optimized detachment rate in clay loam soil indicates quasi-irreversible (1 × 10⁻⁷ h−1) detachment of GFP E. coli. Overall, the combination of lower die-off rates and greater attachment rates resulted in a better capture of the tailing phase when using the trial-and-error procedure (log-log inserts in Figure 5 through Figure 7).
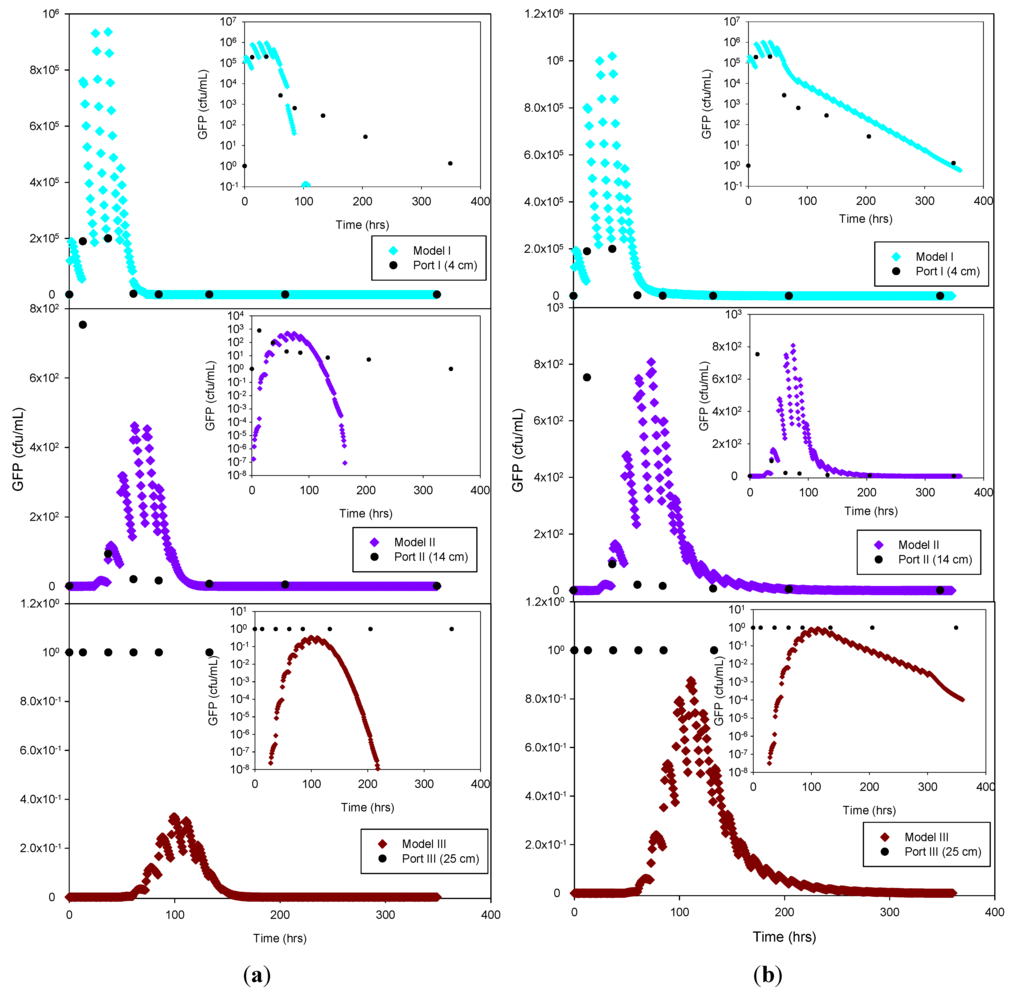
Figure 6.
Experimental GFP E. coli data and HYDRUS optimization (a) and trial-and-error (b) simulation for the clay loam soil at 4 cm, 14 cm and 25 cm depth. The log-normal inserts emphasize the tailing phase.
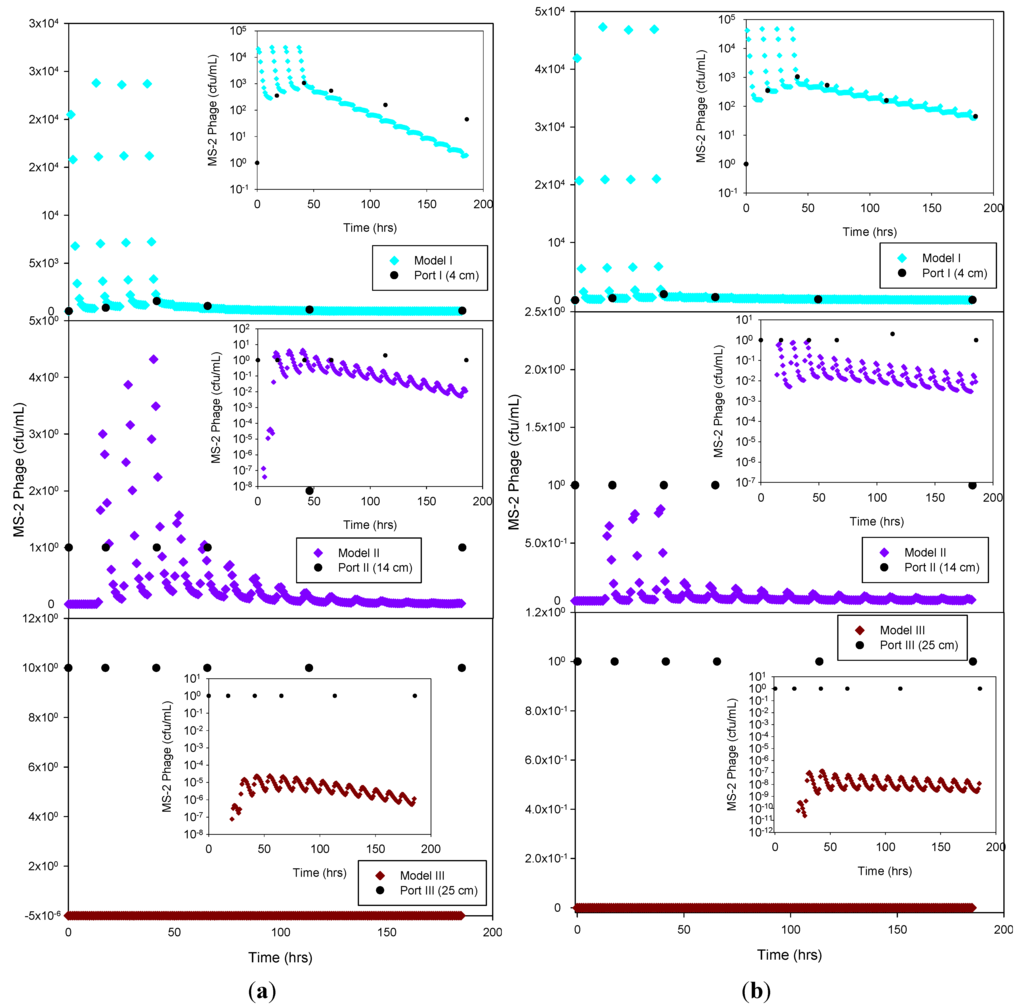
Figure 7.
Experimental MS-2 phage data and HYDRUS optimization (a) and trial-and-error; (b) simulation for the sandy soil at 4 cm, 14 cm and 25 cm depth. The log-normal inserts emphasize the tailing phase.
Only the sandy soil experiment produced sufficient breakthrough data to attempt a simulation of the virus data. The liquid phase die-off rate was about half of the solid phase die-off rate for the optimization procedure (R2 = 0.76), but more than an order of magnitude greater for the trial-and-error simulation. On the other hand, the trial-and-error and optimization virus attachment and detachment rates were very similar to each other. Overall, the results indicate that virus attachment rates were more than an order of magnitude higher than those for bacteria, while bacteria and virus detachment rates were similar.
Table 5.
E. coli and virus transport parameters derived from HYDRUS 2D/3D [23]. Non-detects of virus tracer in sandy loam and clay soils prevented modeling of these experiments.
| Micro-organism | Soil type | Simulation type | Transport parameters | R2 | |||
|---|---|---|---|---|---|---|---|
| SinkL (h−1) | SinkS (h−1) | Attach (h−1) | Detach (h−1) | ||||
| E. coli | Sand | Optimization | 0.0824 | 0.062 | 0.163 | 0.0044 | 0.91 |
| Trial/Error | 0.085 | 0.019 | 0.163 | 0.0023 | |||
| Sandy loam | Optimization | 0.0824 | 0.0298 | 0.026 | 0.0199 | 0.83 | |
| Trial/Error | 0.0298 | 0.020 | 0.085 | 0.0023 | |||
| Clay loam | Optimization | 0.0824 | 0.2476 | 0.078 | 0.0000001 | 0.99 | |
| Trial/Error | 0.020 | 0.036 | 0.133 | 0.0018 | |||
| MS-2 Phage | Sand | Optimization | 0.0271 | 0.0425 | 1.00 | 0.0064 | 0.76 |
| Trial/Error | 0.750 | 0.017 | 0.82 | 0.0040 | |||
Notes: SinkL, aqueous phase die-off rate (STE); SinkS, solid phase die-off rate; Attach, attachment rate; Detach, detachment rate.
4. Discussion
The bacteria die-off rates measured for the three soil types were different (Table 5), which provides evidence for the effect of local environmental soil conditions on bacteria die-off rates [44]. Chao and Feng [45] studied the survival of E. coli HB101 strains added to a silt loam soil at 30 °C, resulting in die-off rates ranging from 0.04 d−1 to 0.20 d−1 (0.0017 h−1 to 0.0083 h−1). Powelson and Mills [46] reported E. coli die-off rates of 0.0259 h−1 and 0.0693 h−1 in sand columns under saturated and unsaturated conditions, respectively. E. coli isolated from STE collected from an OWTS near Lake Okareka, New Zealand, were investigated to elucidate microbial attenuation and transport through pumice sand aquifers [47]. The results of that study showed soil-attached E. coli die-off rates ranged from 2.59 h−1 to 4.47 h−1. These studies suggest that solid phase bacteria die-off rates have to be determined under environmental conditions representative of the location where the OWTS system will be built.
The measured die-off rates reported here for all three soil types may be different from in situ rates where the soils were collected (Colorado, Georgia, Rhode Island). It is also likely that the liquid phase die-off rates differ among locations because of differences in the chemical, physical and biological properties of wastewater. For the trial-and-error simulations, both the solid and liquid phase die-off rates were treated as variables, whereas they were fixed to the measured values during the optimization procedure (Table 5). The attachment/detachment rates were fitting variables in both procedures. Based on the assumption of location-specific solid and liquid phase die-off rates, treating these rates as variables may be considered for the optimization procedure. A better fit could be obtained by treating the die-off rates as variables, particularly during the tailing phase of each experiment. Further research is needed to confirm this approach.
Average attachment rates, derived from either optimization or trial-and-error procedures, were highest for the sandy soil (0.163 h−1 for E. coli, 0.91 h−1 for MS-2). This result was unexpected because higher attachment rates are typically reported for fine-grained clay materials, rather than sandy soils. In general, the intrinsic lower surface area of coarser soils should result in less adsorption of microbes compared to finer textured soils [10,48,49]. In addition, the smaller pores that are prevalent in fine-grained soils are more effective for mechanical filtration (straining) of microbes than those in coarser porous soils. Conversely, unsaturated soils tend to retain more microbes than saturated soils. That is, with decreasing water content, higher retention of bacteria and viruses in the soil has been observed [24,38,50,51]. Because the air-water interface increases at decreasing water content, the removal and retention of microbes in fine-grained soil, such as the clay loam, should be, at a given water content, greater than in granular soils [24,38,52]. In our study, the water content of the sand and sandy loam soils at the end of the experiment was lower (0.15 and 0.23 g/g, respectively), compared to the clay loam soil (0.32 g/g; Table 2). Therefore, the higher air-water interface in the coarser soils could explain the higher attachment rates, since more water-free surface area is available to interact with the microorganisms. Measurements of the air-water interface area at different saturations in various soil materials would be necessary to confirm this proposition.
The effects of soil texture on microbial removal are expected to be different for bacteria and viruses. In our experiments, MS-2 phages were removed much more effectively than bacteria, sandy loam and clay loam soils removed phages more extensively than sandy soil did. Two main mechanisms have been considered for pathogen removal in soil: (i) mechanical filtration; and (ii) adsorption. For instance, Powelson et al. [13] investigated the fate and transport of a Salmonella phage in structured soils and found a reduction in virus concentration of about 60% to 90% in clay, clay loam and silt loam soils. In a review of the literature, Amador et al. [53] concluded that, although coarser textured soils tend to remove fewer bacterial pathogens than finer textured soils, the depth of treatment is important in order to obtain acceptable removal rates (close to 100%). The authors suggest that, because preferential pathways are more common in fine-grained, structured soils, these pathways facilitate the transport of microbes to greater depths relative to unstructured fine textured soils. In addition, they suggest that the soil texture and depth of soil treatment are not well-correlated variables in virus removal, which is consistent with the hypothesis that virus removal occurs by adsorption processes rather than mechanical filtration. Virus removal by adsorption processes is in agreement with our results, where the model computed higher attachment rates for viruses than bacteria in sandy soil.
On average, the detachment rate for both bacteria and viruses in all soils was 1.6% of the attachment rate (Table 5). The lowest detachment rate values were observed in the structured clay soil, which suggest that bacteria and virus attachment in those soils is practically irreversible. Under those conditions, detachment can be considered negligible. This is consistent with previous studies, which concluded that the attachment of microbes to soil particles is an irreversible process [24,54,55,56].
5. Conclusions
Modeling results showed only small differences between attenuation parameters (microbial attachment and detachment rates) obtained by optimization and trial-and-error simulation processes, i.e., results were generally within a factor of three of each other. The microbe detachment rates were about two orders of magnitude lower than the corresponding attachment rates. Low or negligible detachment rates suggest quasi-irreversible adsorption of microbes to soil. GFP E. coli concentrations were generally underestimated by the optimization simulation, whereas a better fit was achieved by the trial-and-error procedure, particularly for the tailing phase of each experiment. In case of the liquid and solid phase GFP E. coli die-off rates, the results of the optimization and trial-and-error simulations were generally within a factor of three of each other. Overall, the combination of lower die-off rates and higher attachment rates resulted in a better description of the tailing phase when using the trial-and-error procedure.
In general, the fit obtained in the optimization process should improve when the concentration of bacteria or virus is measured more frequently. In addition, the results of the E. coli and MS-2 phage die-off rate experiments support the findings of Foppen and Schijven [44] that these measurements should be ideally collected under in situ conditions of the sample location, rather than under standard laboratory conditions. This change in procedure would contribute to a better understanding of the effects of the local conditions on the soils and the resulting degradation/attenuation of those microbes.
The experimental data for the structured clay loam suggests that early breakthrough of the bacteria occurred. Although the presence of preferential flow pathways in the mesocosms likely influenced the results, it is not possible to simulate those conditions with existing models. To better simulate the preferential flow effect on transport and fate of pathogenic contaminants in the soil, it is necessary to evaluate the in situ spatial distribution of soil hydraulic properties. In the interim, a dual permeability model may be used to diversify the different flow patterns that might occur in the soil profile [43,57,58]. Numerical modeling limitations were also evident when simulating the transport of microbes because the model neglects processes that intervene in the attenuation of microorganism in the field (e.g., straining, size exclusion).
Acknowlegments
This study was funded by a grant from the Water Environment Research Foundation (DEC1R06), by a U.S. Department of Agriculture (USDA) Multistate Project (NE 1045) and by funds from the Rhode Island Agricultural Experiment Station. We thank John McCray from the Colorado School of Mines (Golden, CO, USA) for MS-2 coliphage and sandy loam soil, and David Radcliffe from the University of Georgia (Athens, GA, USA) for clay soil.
Author Contributions
Janet A. Atoyan, Thomas Boving and José Amador designed the experiment and Janet Atoyan conducted the experimental work. The optimization modeling and literature review was conducted by Ivan Morales. The trial-and-error simulation was conducted by Thomas Boving. The paper was prepared under the direction, review and guidance of Jose Amador and Thomas Boving.
Conflicts of Interest
The authors declare no conflict of interest.
References
- US Environmental Protection Agency. Onsite Wastewater Treatment Systems Manual; US Environmental Protection Agency: Washington, DC, USA, 2002; pp. 1–367. [Google Scholar]
- Canter, L.W.; Knox, R.C. Septic Tank System Effects on Ground Water Quality; Lewis Publishers, Inc.: Chelsea, MI, USA, 1985. [Google Scholar]
- Gerba, C.P.; Goyal, S.M. Pathogen Removal from Wastewater During Groundwater Recharge. In Artifical Recharge of Groundwater; Butterworth Publishers: Waltham, MA, USA, 1985. [Google Scholar]
- Crites, R.W. Micropollutant Removal in Rapid. In filtration. In Artificial Recharge of Groundwater; Butterworth Publishers: Waltham, MA, USA, 1985. [Google Scholar]
- Sobsey, M.D.; Shields, P.A. Survival and Transport of Viruses in Soils. In Human Viruses in Sediments, Sludges, and Soils; CRC Press: Boca Raton, FL, USA, 1987; pp. 155–177. [Google Scholar]
- Ausland, G.; Stevik, T.K.; Hanssen, J.F.; Køhler, J.C.; Jenssen, P.D. Intermittent Filtration of Wastewater—Removal of Fecal Coliforms and Fecal Streptococci. Water Res. 2002, 36, 3507–3516. [Google Scholar] [CrossRef]
- Potts, D.; Gorres, J.; Nicosia, E.; Amador, J. Effects of Aeration on Water Quality from Septic System Leachfields. J. Environ. Qual. 2004, 33, 1828–1838. [Google Scholar] [CrossRef]
- Goyal, S.; Gerba, C. Comparative Adsorption of Human Enteroviruses, Simian Rotavirus, and Selected Bacteriophages to Soils. Appl. Environ. Microbiol. 1979, 32, 241–247. [Google Scholar]
- Dowd, S.E.; Pillai, S.D.; Wang, S.; Corapcioglu, M.Y. Delineating the Specific Influence of Virus Isoelectric Point and Size on Virus Adsorption and Transport through Sandy Soils. Appl. Environ. Microbiol. 1998, 64, 405–410. [Google Scholar]
- Sobsey, M.D.; Dean, C.H.; Knuckles, M.E.; Wagner, R.A. Interactions and Survival of Enteric Viruses in Soil Materials. Appl. Environ. Microbiol. 1980, 40, 92–101. [Google Scholar]
- Lance, J.C.; Gerba, C.P. Virus Movement in Soil During Saturated and Unsaturated Flow. Appl. Environ. Microbiol. 1984, 47, 335–337. [Google Scholar]
- Powelson, D.K.; Gerba, C.P. Virus Removal from Sewage Effluents during Saturated and Unsaturated Flow through Soil Columns. Water Res. 1994, 28, 2175–2181. [Google Scholar] [CrossRef]
- Powelson, D.K.; Simpson, J.R. Virus Transport and Survival in Saturated and Unsaturated Flow through Soil Columns. J. Environ. Qual. 1990, 19, 396–401. [Google Scholar] [CrossRef]
- Kristiansen, R. Sand Filter Trenches for Purification of Septic Tank Effluent: I. The Clogging Mechanism and Soil Physical Environment. J. Environ. Qual. 1981, 10, 353–357. [Google Scholar] [CrossRef]
- Beal, C.D.; Gardner, E.A.; Kirchhof, G.; Menzies, N.W. Long-Term Flow Rates and Biomat Zone Hydrology in Soil Columns Receiving Septic Tank Effluent. Water Res. 2006, 40, 2327–2338. [Google Scholar] [CrossRef]
- Beach, D.N.H.; McCray, J.E.; Lowe, K.S.; Siegrist, R.L. Temporal Changes in Hydraulic Conductivity of Sand Porous Media Biofilters During Wastewater Infiltration Due to Biomat Formation. J. Hydrol. 2005, 311, 230–243. [Google Scholar] [CrossRef]
- Unc, A.A.; Goss, M.J. Movement of Faecal Bacteria through the Vadose Zone. Water Air Soil Pollut. 2003, 149, 327–337. [Google Scholar] [CrossRef]
- Cey, E.E.; Rudolph, D.L.; Passmore, J. Influence of Macroporosity on Preferential Solute and Colloid Transport in Unsaturated Field Soils. J. Contam. Hydrol. 2009, 107, 45–57. [Google Scholar] [CrossRef]
- Harvey, R.W.; Kinner, N.E.; MacDonald, D.; Metge, E.W.; Bunn, A. Role of Physical Heterogeneity in the Interpretation of Small Scale Laboratory and Field Observations of Bacteria, Microbial-Sized Microsphere, and Bromide Transport through Aquifer Sediments. Water Resour. Res. 1993, 29, 2713–2721. [Google Scholar] [CrossRef]
- Pivetz, B.E.; Steenhuis, T.S. Soil Matrix and Macropore Biodegradation of 2,4D. J. Environ. Qual. 1995, 24, 564–570. [Google Scholar] [CrossRef]
- Pivetz, B.E.; Steenhuis, T.S.; Kelsey, J.W.; Alexander, M. A Procedure to Calculate Biodegradation during Preferential Flow through Heterogeneous Soil Columns. Soil Sci. Soc. Am. J. 1996, 60, 381–388. [Google Scholar] [CrossRef]
- Jiang, S.; Liping, P.; Buchan, G.D.; Simůnek, J.; Noonan, M.J.; Close, M.E. Modeling Water Flow and Bacterial Transport in Undisturbed Lysimeters Under Irrigations of Dairy Shed Effluent and Water Using HYDRUS-1D. Water Res. 2010, 44, 1050–1061. [Google Scholar] [CrossRef]
- Šimůnek, J.; van Genuchten, M.T.; Sejna, M. The HYDRUS Software Package for Simulating the Two-and Three-Dimensional Movement of Water, Heat, and Multiple Solutes in Variably-Saturated Media; Technical Manual, PC Progress: Prague, Czech Republic, 2006. [Google Scholar]
- Pang, L.; Šimůnek, J. Evaluation of Bacteria-Facilitated Cadmium Transport in Gravel Columns Using the HYDRUS Colloid-Facilitated Solute Transport Model. Water Resour. Res. 2006, 42. [Google Scholar] [CrossRef]
- Gargiulo, G.; Bradford, S.A.; Simunek, J.; Ustohal, P.; Vereecken, H.; Klumpp, E. Bacteria Transport and Deposition Under Unsaturated Flow Conditions: The Role of Water Content and Bacteria Surface Hydrophobicity. Vadose Zone J. 2008, 7, 406–419. [Google Scholar] [CrossRef]
- Zhang, H.; Nordin, N.A.; Olson, M.S. Evaluating the Effects of Variable Water Chemistry on Bacterial Transport during Infiltration. J. Contam. Hydrol. 2013, 150, 54–64. [Google Scholar] [CrossRef]
- American Public Health Association (APHA). Standard Methods for the Examination of Water and Wastewater 20th Edition; Public Health: Washington, DC, USA, 1999. [Google Scholar]
- Adams, M.H. Bacteriophages; Interscience Publishers: New York, NY, USA, 1959; p. 592. [Google Scholar]
- Schoenau, J.; Karamanos, R. Sodium Bicarbonate-Extractable P, K, and N. In Soil Sampling and Methods of Analysis; Carter, M.R., Ed.; CRC Press: Boca Raton, FL, 1993; pp. 51–58. [Google Scholar]
- Doane, T.; Horwath, W.R. Spectrophotometric Determination of Nitrate with a Single Reagent. Anal. Lett. 2003, 36, 2713–2722. [Google Scholar] [CrossRef]
- Lepore, B.; Barak, P. A Colorimetric Microwell Method for Determining Bromide Concentrations. Soil Sci. Soc. Am. J. 2009, 73, 1130–1136. [Google Scholar] [CrossRef]
- Toride, N.; Leij, F.J.; van Genuchten, M.T. The CXTFIT Code for Estimating Transport Parameters from Laboratory or Field Tracer Experiments; Research Report NO. 137; U.S. Department of Agriculture: Riverside, CA, USA, 1995; pp. 1–138. [Google Scholar]
- Pinheiro, L.B.; Gibbs, M.D.; Vesey, G.; Smith, J.J.; Bergquist, P.L. Fluorescent Reference Strains of Bacteria by Chromosomal Integration of a Modified Green Fluorescent Protein Gene. Appl. Microbiol. Biotechnol. 2008, 77, 1287–1295. [Google Scholar] [CrossRef]
- Turco, R.F. Detection and Enumeration of Coliform Bacteria in Soil. In Methods of Soil Analysis: Microbial and Biochemical Properties; Soil Science Society of America: Madison, WI, USA, 1994; pp. 145–159. [Google Scholar]
- Burt, R. Soil Survey Laboratory Methods Manual; Soil Laboratory Investigations Report No. 42; US Department of Agriculture: Washington, DC, USA, 2004; p. 735. [Google Scholar]
- Van Genuchten, M.T. A Closed-Form Equation for Predicting the Hydraulic Conductivity of Unsaturated Soils. Soil Sci. Soc. Am. J. 1980, 44, 892–898. [Google Scholar] [CrossRef]
- Prescott, L.M.; Klein, D.A.; Harley, J.P. Microbiology; Wm. C. Brown Publisher: Dubuque, IA, USA, 1996. [Google Scholar]
- Torkzaban, S.; Hassanizadeh, S.M.; de Bruin, H.A.M.; Schijven, J.F.; de Roda Husman, A.M. Virus Transport in Saturated and Unsaturated Sand Columns. Vadose Zone J. 2006, 5, 877–885. [Google Scholar] [CrossRef]
- Zhao, L.; Ju, X.; Li, B.; Hu, K.; Wang, H.; Wei, Y. Simulation of Bromide and Nitrate Leaching Under Heavy Rainfall and High-Intensity Irrigation Rates in North China Plain. Agric. Water Manag. 2010, 97, 1646–1654. [Google Scholar] [CrossRef]
- Zhang, Q.; Hassanizadeh, S.M.; Raoof, A.; Genuchten, M.V.; Roels, S.M. Modeling Virus Transport and Remobilization during Transient Partially Saturated Flow. Vadose Zone J. 2012, 11. [Google Scholar] [CrossRef]
- Safadoust, A.; Mosaddeghi, M.R.; Heydari, A.; Gharabaghi, B.; Mahboubi, A.A.; Voroney, P.; Unc, A. Effect of Regenerated Soil Structure on Unsaturated Transport of Escherichia Coli and Bromide. J. Hydrol. 2012, 430–431, 80–90. [Google Scholar]
- Feighery, J.; Mailloux, B.J.; Ferguson, A.S.; Ahmed, K.M.; Geen, A.; Culligan, P.J. Transport of E. Coli in Aquifer Sediments of Bangladesh: Implications for Widespread Microbial Contamination of Groundwater. Water Resour. Res. 2013, 49, 3897–3911. [Google Scholar] [CrossRef]
- Wang, Y.; Bradford, S.A.; Šimůnek, J. Transport and Fate of Microorganisms in Soils with Preferential Flow under Different Solution Chemistry Conditions. Water Resour. Res. 2013, 49, 2424–2436. [Google Scholar] [CrossRef]
- Foppen, J.W.A.; Schijven, J.F. Evaluation of Data from the Literature on the Transport and Survival of Escherichia Coli and Thermotolerant Coliforms in Aquifers under Saturated Conditions. Water Res. 2006, 40, 401–426. [Google Scholar]
- Chao, W.L.; Feng, R.L. Survival of Genetically Engineered Escherichia Coli in Natural Soil and River Water. J. Appl. Bacteriol. 1990, 68, 319–325. [Google Scholar] [CrossRef]
- Powelson, D.K.; Mills, A.L. Transport of Escherichia Coli in Sand Columns with Constant and Changing Water Contents. J. Environ. Qual. 2001, 30, 238–245. [Google Scholar] [CrossRef]
- Pang, L.; Close, M.; Goltz, M.; Sinton, L.; Davies, H.; Hall, C.; Stanton, G. Estimation of Septic Tank Setback Distances Based on Transport of E. Coli and F-RNA Phages. Environ. Int. 2004, 29, 907–921. [Google Scholar] [CrossRef]
- Moore, S.K.; Garvin, R.T.; James, E. Nucleotide Sequence of the argF Regulatory Region of Escherichia Coli K-12. Gene 1981, 116, 119–132. [Google Scholar] [CrossRef]
- Pang, L.; McLeod, M.; Aislabie, J.; Šimůnek, J.; Close, M.; Hector, R. Modeling Transport of Microbes in Ten Undisturbed Soils under Effluent Irrigation. Vadose Zone J. 2008, 7, 97–111. [Google Scholar] [CrossRef]
- Jin, Y.; Chu, Y.; Li, Y. Virus Removal and Transport in Saturated and Unsaturated Sand Columns. J. Contam. Hydrol. 2000, 43, 111–128. [Google Scholar] [CrossRef]
- Han, J.; Jin, Y.; Wilson, C.S. Virus Retention and Transport in Chemically Heterogeneous Porous Media under Saturated and Unsaturated Flow Conditions. Environ. Sci. Technol. 2006, 40, 1547–1555. [Google Scholar] [CrossRef]
- Chu, Y.; Jin, Y.; Baumann, T.; Yates, M. Effect of Soil Properties on Saturated and Unsaturated Virus Transport through Columns. J. Environ. Qual. 2003, 32, 2017–2025. [Google Scholar] [CrossRef]
- Amador, J.A.; Atoyan, J.A.; Boving, T.; Kalen, D.; Loomis, G. Microorganisms. In Development of Quantitative Tools to Determine the Expected Performance of Unit processes in Wastewater Soil Treatment Units: Literature Review; IWA Publishing: London, UK, 2009. [Google Scholar]
- Yao, K.; Habibian, M.T.; O’Melia, C.R. Water and Waste Water Filtration: Concepts and Applications. Environ. Sci. Technol. 1971, 5, 1105–1112. [Google Scholar] [CrossRef]
- Rajagopalan, R.; Tien, C. Trajectory Analysis of Deep-Bed Filtration with the Sphere-in-Cell Porous Media Model. AIChE J. 1976, 22, 523–533. [Google Scholar] [CrossRef]
- Pieper, P.J.; Ryan, N.; Harvey, R.W.; Amy, G.L.; Illangasekare, T.H.; Metge, D.W. Transport and Recovery of Bacteriophage PRD1 in a Sand and Gravel Aquifer: Effect of Sewage-Derived Organic Matter. Environ. Sci. Technol. 1997, 31, 1163–1170. [Google Scholar] [CrossRef]
- Jarvis, N.J. A Review of Non-Equilibrium Water Flow and Solute Transport in Soil Macropores: Principles, Controlling Factors and Consequences for Water Quality. Eur. J. Soil Sci. 2007, 58, 523–546. [Google Scholar]
- Šejna, M.; van Genuchten, M.T.; Šimůnek, J. Development and Applications of the HYDRUS and STANMOD Software Packages and Related Codes. Vadose Zone J. 2008, 7, 587–600. [Google Scholar] [CrossRef]
© 2014 by the authors; licensee MDPI, Basel, Switzerland. This article is an open access article distributed under the terms and conditions of the Creative Commons Attribution license (http://creativecommons.org/licenses/by/3.0/).