Abstract
This study assesses the impact of hydroelectric dams on the discharge and total suspended solids (TSS) concentration in the Huong River basin in Vietnam. The analysis is based on hydrologic and sediment transport simulations by the Soil and Water Assessment Tool (SWAT) model driven by the Tropical Rainfall Measuring Mission (TRMM) 3B42V6 rainfall data, from January 2003 through December 2010. An upstream sub-basin not affected by the hydroelectric dams was used for model calibration. The calibration results indicate good agreement between simulated and observed daily data (0.67 Nash-Sutcliffe efficiency, 0.82 Pearson correlation coefficient). The calibrated model for discharge and TSS simulation is then applied on another major sub-basin and then the whole Huong River basin. The simulation results indicate that dam operation in 2010 decreased downstream discharge during the rainy season by about 35% and augmented it during the dry season by about 226%. The downstream TSS concentration has decreased due to the dam operation but the total sediment loading increased during the dry season and decreased during the rainy season. On average, the dam construction and operation affected the pattern of discharge more than that of the sediment loading. Results indicate that SWAT, driven by remotely sensed inputs, can reasonably simulate discharge and water quality in ungauged or poorly gauged river basins and can be very useful for water resources assessment and climate change impact studies in such basins.
1. Introduction
Along with the development of other types of energy, use of hydroelectricity has been growing dramatically throughout the developing world because of rapid industrialization. The benefits of hydroelectricity, compared to other energy sources, have been demonstrated in the literature and in practice [1,2]. With a relatively low cost of planning and development and flexibility of construction, hydroelectricity is considered to be one of the most effective sources of renewable energies [3,4]. However, numerous concerns have been raised about the development of hydroelectricity, namely that building dams would interrupt natural flow, remove vegetation cover, degrade river, stream, or related ecosystems, and modify natural water resource parameters and degrade water quality downstream [5,6]. Operations of hydroelectric dams would cause significant and frequent variation in river stage and change the dynamics of their hyporheic zones and riparian aquifers as well [7]. Concerns were also raised about relocating local residents, assigning new jobs, and stabilizing the lives of affected people resulting from dam construction [5].
The impact of dams on river water quantity and quality has been examined in many studies, with different levels of impact being recognized in different areas [4,8,9]. However, in general, dam construction usually contributes to rivers running dry, river channel erosion, alters sedimentation, and increases pollutant discharge into the river system [10,11,12]. Specifically for river flow, the impact of a dam can be better identified at seasonal time scales, rather than annual time scales because the water storage and release operations of the dam could produce an average river discharge over the year that is similar to its natural flow, with seasonal disturbance being masked [13]. In addition, the patterns of controlled water release of dams are different; some dams release water only during a season, others may just release water a few times per year or even do not release any water at all in extreme conditions. Dams can possibly increase or decrease river discharge or even maintain it the same [11]. Dams are also considered as effective sediment traps, especially hydroelectric dams, due to their structure and operation [11]. As for sediment transport and deposition, an upstream dam could impact the seasonal sediment concentration, sediment grain size, or the deposits on a riverbed during a flood event [14,15]. Petts [12] explains that information from the last century indicate river channel erosion happens immediately below dams and after dam closures resulting in riverbed degradation. As a natural cycle, sediments accumulate in a reach or river during the low flow season and these accumulated sediments will be transported again by the river when the flow increases and then transferred to downstream areas of the river system. For that reason, the presence of a dam and its operation could interrupt or accelerate the sediment transport and modify the sediment component in river [14].
The South East Asian region has relatively dense and sloping flow systems that offer high potential for hydroelectricity [16]. Regardless of the negative impacts on the natural environment, more and more hydropower dams have been built in the main rivers, such as Mekong River, Salween River, Irrawaddy River, and Red River, to satisfy the socioeconomic development requirements of the nations within the basins. Smaller rivers are also in the same situation of having their natural flows cut off. Most countries in the region have been tapping into and exploiting any available energy resources.
This study focuses on a river basin in central Vietnam, the Huong River basin, which is the location of three different hydroelectric projects. Huong River is the major fresh water resource for all production and development activities in the area and has played a significant role in the lives of local residents. Some previous studies have qualitatively indicated the degradation of water quality downstream of Huong River as a result of hydroelectric dams, but unfortunately quantitative evaluations have not been carried out to acquire the necessary evidence [17]. For that reason, flow discharge and total suspended solids (TSS) are selected for model simulation in this study, with the aim of illustrating the impact of hydroelectric activity on discharge and TSS with specific quantitative numbers. The study results will potentially increase the awareness of local people in general and the local government in particular of the impacts of hydroelectric projects.
2. Simulation Methodology
2.1. Study Area
The Huong River basin is located in Thua Thien Hue Province in central Vietnam. It has an area of 2830 km2 representing 56% of the total area of the Province. Huong River has three major tributaries that originate in the southern and western mountainous areas: Ta Trach River and Huu Trach River, which unite and form the main flow of Huong River, and Bo River, which merges into Huong River downstream (Figure 1). The elevation of the Huong River basin ranges widely between 0 and about 1800 m above the mean sea level. Streams in the basin have relatively steep slopes, especially in the upstream areas. There are mainly two seasons in the region; the rainy season starts in September and ends in December and the dry season starts in January and ends in August, with June and July being especially hot and dry. The average annual rainfall in the Huong River basin is always over 2600 mm and fluctuates between 2700 and 2900 mm; in some years, annual rainfall has exceeded 3500 mm [18].
Due to the terrain characteristics and the profusion of water resources, especially in the rainy season, hydroelectricity has been developed in the region in response to the growing energy demand. Three major hydroelectric projects are located on the three main tributaries of Huong River (Figure 1): Huong Dien hydroelectric dam on Bo River (in use from the end of 2010), Binh Dien hydroelectric dam (in use from the end of 2009) on Huu Trach River, and Ta Trach hydroelectric dam (still under construction) on Ta Trach River. Since the study period considered in this paper runs from 2003 to 2010, only Binh Dien dam is taken into account and its impact on the discharge and TSS of Huong River is examined assuming that Huong Dien dam and Ta Trach dam had zero impact on river flow during the 2003–2010 simulation period.
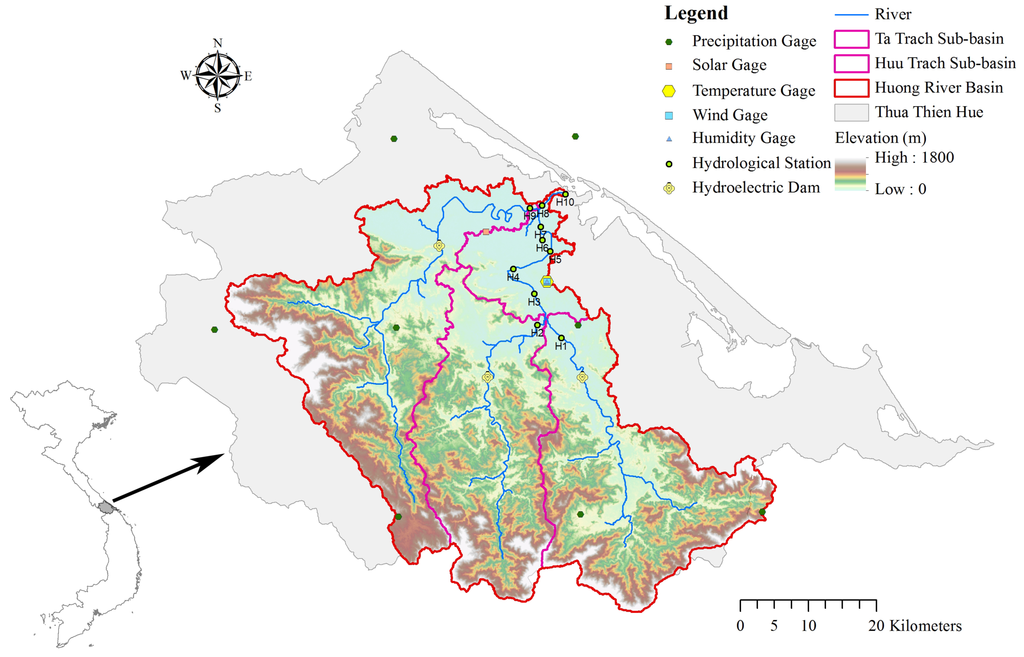
Figure 1.
The Huong River basin, central Vietnam.
2.2. The SWAT Model
The hydrologic and water quality model used in this study was the SWAT (Soil and Water Assessment Tool) model, which was developed by Arnold et al. [19] and has since become popular worldwide. Recently, many studies have applied SWAT to simulate hydrologic and geo-hydrologic processes in watersheds of different sizes not only in the US but also in other regions of different climatic and geologic characteristics [20,21,22,23]. In SWAT, discharge and sediment yield as well as some agriculture-related water quality parameters are typically simulated on a daily time scale for each Hydrologic Response Unit (HRU). The concept of HRU is defined as a unique combination of land use, soil, and slope [24]. The hydrology and sedimentation components of the model can be described as follows [19]:
The hydrologic simulation in SWAT is based on the water balance Equation:
where SW is the soil water content minus the 15-bar water content; t is time (days); R is daily precipitation (mm); Q is daily runoff (mm); ET is daily evapotranspiration (mm); P is daily percolation (mm); and QR is daily return flow (mm)
Detailed explanations for each parameter of the water balance equation are fully described in Arnold et al. [19].
Sediment yield in SWAT is calculated using the MUSLE (Modified Universal Soil Loss Equation) for sub-basins H1, H2, and H10 [19,25,26].
where Y is sediment yield (t); V is the surface runoff column (m3); qp is the peak flow rate (m3/s); K is the soil erodibility factor; C is the crop management factor; PE is the erosion control practice factor; and LS is the slope length and steepness factor.
with ξ = 0.6[1 − exp(−35.835 S)] [27],
with CVM = 1.463 ln(CVA) + 0.1034 [27], where CV is the soil cover above ground biomass and residue (kg/ha); CVM is the minimum value of C; and CVA is the average annual value of C.
More information on the estimations of each MUSLE parameter is available in Arnold et al. [19]. The theoretical and practical documentation of the SWAT model are also available on the Internet [28].
2.3. Input Data
2.3.1. Geographic Data
The SWAT model requires a myriad of static and dynamic input data, such as the digital elevation model (DEM), inlets, outlets, point sources, and reservoirs within the basin for watershed delineation and watershed characterization; land use, soil, and slope for the creation of HRUs; and rainfall, temperature, humidity, solar radiation, and wind speed for weather data inputs.
The ASTER (Advanced Spaceborne Thermal Emission and Reflection Radiometer) Global Digital Elevation Model V002 product was used with a spatial resolution of 30 m × 30 m. The basin and sub-basins were delineated automatically from the DEM in the SWAT model. The slopes were computed from the DEM and their values range between 0% and 89.4%. Considering an equal distribution in area, the slopes were classified into three groups: 0%–15%, 15%–35%, and 35%–99.99% in SWAT.
Land use maps at the scale of 1:100,000 published in 2005, land use properties, soil maps at the scale of 1:120,000 published in 2005 and soil properties were obtained from the Department of Resources and Environment of Thua Thien Hue Province [18]. These data were re-processed and classified according to the requirements of the SWAT model (Figure 2). The dominant land use of the Huong River basin is evergreen forest (FRSE), which occupies 79.15% of the area. The rest of the basin is covered by residential land (URBN, 4.96%), rice fields (RICE, 4.12%), agricultural land (AGRR—row crops, 3.20%), deciduous forest (FRSD, 2.76%), pasture (PAST, 2.50%), and water (WATR, 1.45%) also in addition to range (RNGE—grasses), low density residential (URLD), mixed forest (FRST ), and industrial (UIDU) land uses, which cover less than 1% of the area each.
Soil data were re-classified into seven groups (Figure 2). Ferralic Acrisols are the dominant soil group and cover 85.53% of the area of the basin. The remaining groups include Dystric Fluvisols, Plinthic Acrisols, Xanthic Ferralsols, Leptosols, Luvic Arenosols, and Dystric Gleysols, which occupy 6.70%, 4.25%, 1.83%, 1.10%, 0.36%, and 0.23% of the area, respectively. The sand, silt, clay and rock proportions of each soil group as well as their soil parameters were determined based on Food and Agriculture Organization of the United Nations (FAO) digital soil map of the world in 2003 (Table 1).
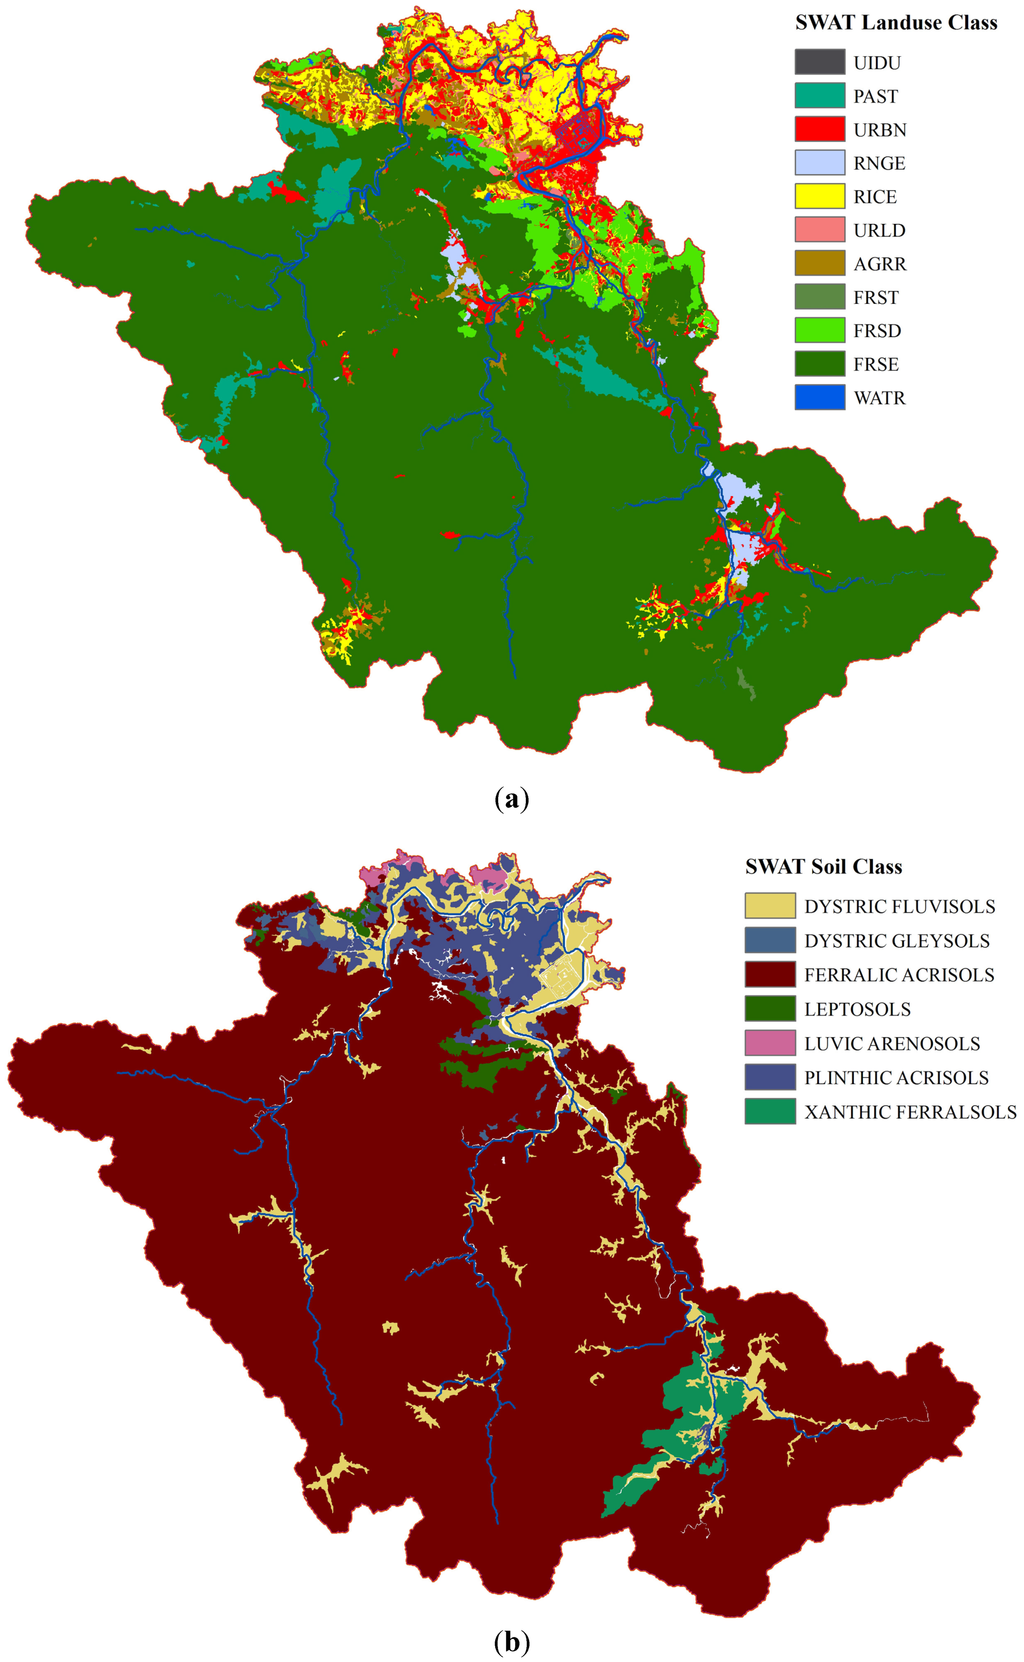
Figure 2.
Land use (a) and soil (b) classes in the Huong River basin.

Table 1.
Soil components and parameters in Huong River Basin.
| Components and Parameters | Soil Name | |||||||
|---|---|---|---|---|---|---|---|---|
| Dystric Fluvisols | Dystric Gleysols | Ferralic Acrisols | Leptosols | Luvic Arenosols | Plinthic Acrisols | Xanthic Ferralsols | ||
| Hydrologic Group | C | C | B | B | A | C | D | |
| Water Capacity (mm H2O/mm Soil) | 0.16 | 0.18 | 0.14 | 0.12 | 0.07 | 0.14 | 0.14 | |
| Hydraulic Conductivity (mm/h) | 16.0 | 0.9 | 13.0 | 27.0 | 400.0 | 28.0 | 14.0 | |
| Top Soil Layer | % Clay | 25.0 | 58.5 | 22.5 | 24.0 | 5.0 | 27.0 | 38.2 |
| % Silt | 36.48 | 25.65 | 14.81 | 15.02 | 1.48 | 16.16 | 7.8 | |
| % Sand | 37.04 | 15.85 | 58.69 | 56.98 | 93.52 | 55.46 | 51.2 | |
| % Rock | 1.48 | 0.0 | 4.0 | 4.0 | 0.0 | 1.38 | 2.8 | |
| Sub Soil Layer | % Clay | 28.4 | 48.2 | 33.6 | 26.0 | 5.5 | 36.34 | 45.0 |
| % Silt | 36.7 | 18.0 | 11.9 | 16.0 | 2.9 | 16.64 | 5.9 | |
| % Sand | 33.4 | 33.8 | 51.5 | 55.0 | 91.6 | 45.64 | 46.4 | |
| % Rock | 1.5 | 0.0 | 3.0 | 3.0 | 0.0 | 1.38 | 2.7 | |
2.3.2. Meteorological Data
The rainfall product used in this study is the Tropical Rainfall Measuring Mission (TRMM) 3B42V6 satellite rainfall. The TRMM product has been widely used and was considered the best rainfall data source for stream flow modeling in some studies [29]. Curtis et al. [30] recommended using TRMM product to produce real-time stream flow for basins around the world that do not have ground observation. The TRMM 3B42V6 data in this study were collected for the period of 2003–2010 and can be downloaded from the U. S. National Aeronautics and Space Administration (NASA) Mirador Website [31]. This TRMM product has a temporal resolution of three hours and a spatial resolution of 0.25° × 0.25°. The TRMM rainfall system quantitatively measures rainfall around the Globe from space using a combination of active (Precipitation Radar) and passive (TRMM Microwave Imager and Visible and Infrared Radiometer System) sensors [32]. The TRMM rainfall product is developed in three stages and the product is also bias adjusted using rain gauge data. In the first and the second stages, microwave and infrared rainfall measures are calibrated and combined and in the third stage, the calibrated microwave and infrared rainfall products are merged to produce the TRMM product [33]. A set of points 0.25° apart from each other was built for SWAT rainfall input to give the best description of the distribution of rainfall in the basin before extracting the cell values of the TRMM grid files for these points (see Precipitation Gauges in Figure 1). Daily rainfall values were then calculated from the three hourly values, considering the difference between Greenwich Mean Time (GMT) and local time. Rainfall for the basin was interpolated using Thiessen polygons to obtain values from each data point.
In general, rainfall in the rainy season, from September to December, contributes the majority to annual rainfall of the area. During this period, highest rainfall occurs in the southeastern mountainous area of the Ta Trach sub-basin. Figure 3 and Figure 4 show the TRMM estimated precipitation for the wet and dry seasons after smoothing using the inverse distance weighted interpolation method. The average rainfall in the rainy season is above 1300 mm throughout the basin with the western and northeastern parts receiving relatively lower precipitation (Figure 3). The southeastern part of the study is the wettest. Despite the fact that the dry season is twice as long as the rainy season, its average rainfall is relatively low and mostly distributed upstream of the tributaries of the Huong River (Figure 4). The basin-average dry season precipitation is about half of the wet season precipitation. The southwestern part of the study is wettest during the dry season.
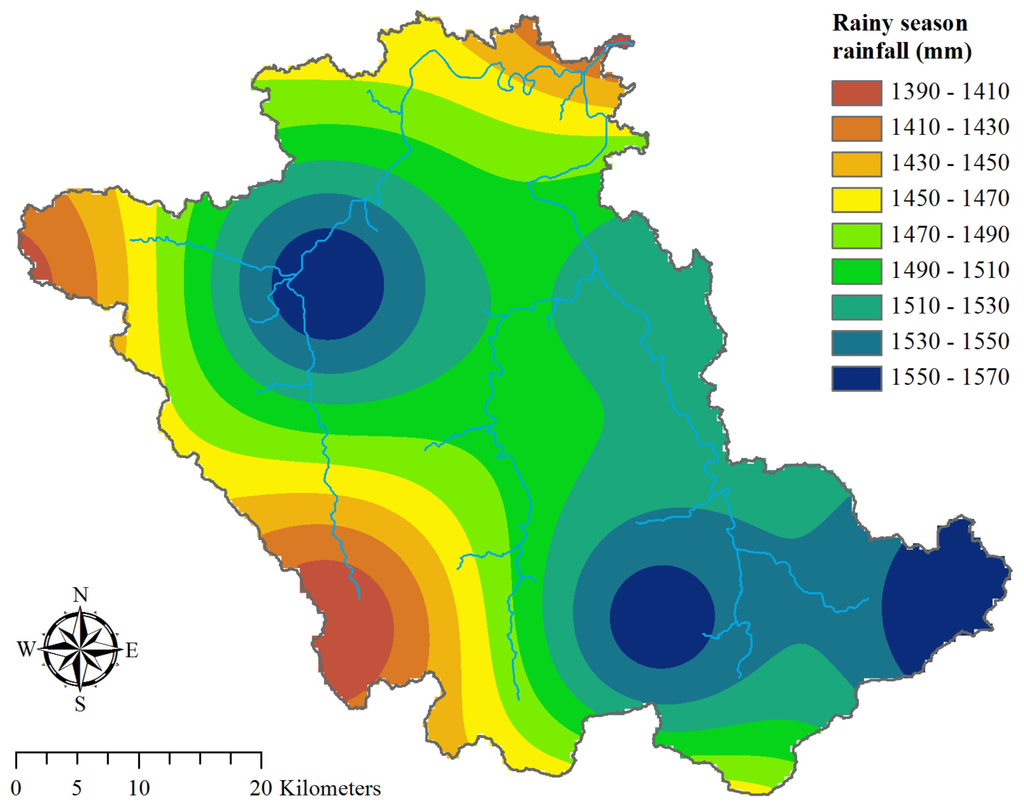
Figure 3.
Average rainfall in the rainy season for the period of 2003–2010.
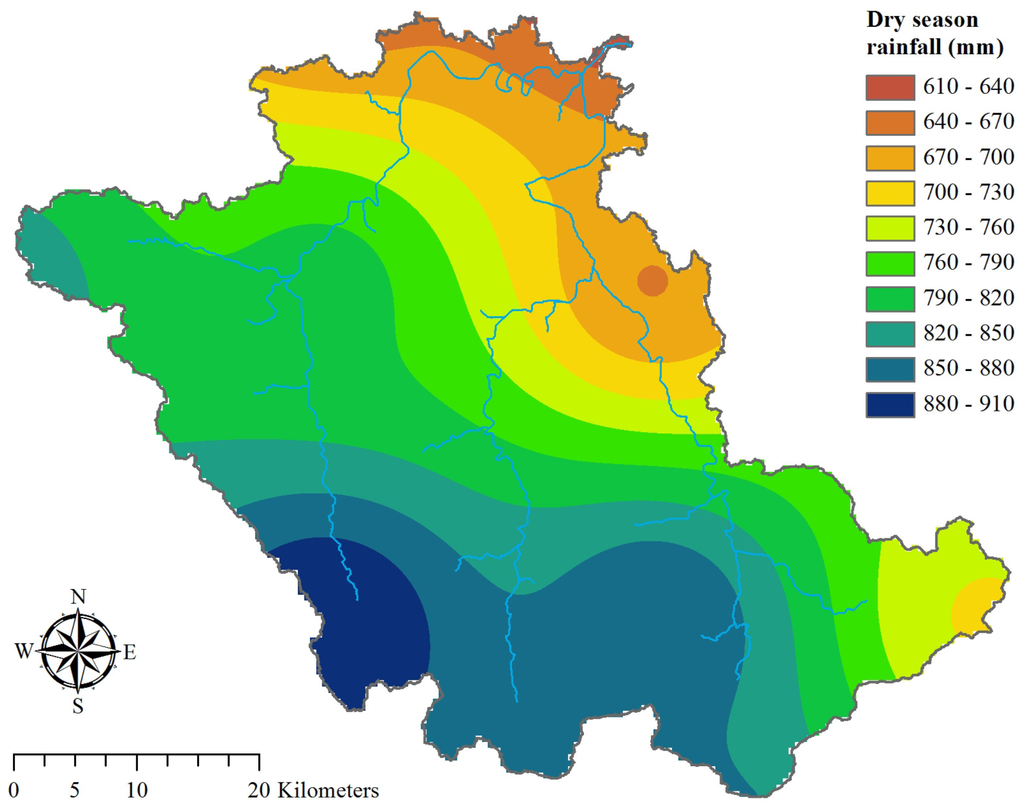
Figure 4.
Average rainfall in the dry season for the period of 2003–2010.
The temperature, humidity, and wind speed data were obtained for the 2003–2010 period from the National Climatic Data Center (NCDC) of the National Oceanic and Atmospheric Administration (NOAA) of the US Department of Commerce [34] for one station in Hue city (Figure 1). These data have a temporal resolution of three hours and were measured at Greenwich Mean Time (GMT), so daily values were also calculated considering the difference between GMT and local time.
Solar radiation data are satellite-based data and were obtained from the Atmospheric Science Data Center sponsored by NASA [35]. These data have a temporal resolution of one day and low spatial resolution of 1° × 1°. For that reason, only data from one cell whose boundaries are 17° north, 16° south, 107° west, and 108° east (center 16.5° latitude, 107.5° longitude) are selected for the Huong River basin. The location of this center is shown as the Solar Gauge in Figure 1.
2.4. Discharge and TSS Data
Field measurements of flow discharge and TSS of the Huong River and its tributaries have been taken periodically by the Institute of Resources, Environment, and Biotechnology of Hue University, Vietnam (IREB-Hue) (approximately monthly). Data collected each time are on a variable date depending on weather conditions and the availability of employees; it could be a day at the beginning, middle or end of the month. TSS data are available from 2003 to 2010 (except for 2005) and flow discharge data are only available from 2007 to 2010. There are 10 hydrological stations in the basin: three at the outlets of each tributary of Huong River (site H1, H2 and H9), six along Huong River from the confluence of Ta Trach River and Huu Trach River to the confluence of Huong River and Bo River (site H3, H4, H5, H6, H7 and H8), and one at the outlet of Huong River (site H10) before it pours into the lagoon (Figure 1). These monthly data are available in the annual reports of IREB-Hue.
Discharge of the Huong River and its tributaries is not directly measured at stream gauges as usual; they are calculated from measured flow velocities by multiplying them with the equivalent cross-sectional surface areas. Flow velocities are measured manually at the depth of 1.5 m below the water surface at specific locations defined by their co-ordinates. The equipment used to measure flow velocities is the Global Digital Water Flow Probe [36]. At each river cross-section, there are five to seven flow velocity measurements depending on the width of the river and the values are then averaged for that cross-section. Cross-sectional geometries and areas are built and calculated based on multiple depth measurements between the two riversides. These depths of the riverbed are measured by the Cole-Parmer Portable Water Depth Sounder Gauge [36]. At the same locations where flow velocities are measured, water samples are collected and then analyzed in the laboratory to determine TSS concentration at each location. The water samples are collected at a depth of 0.5 m below the water surface following International Organization for Standardization (ISO) 5667–6:2005 standard for sampling of rivers and streams. Subsequent analysis of the samples in the laboratory follows ISO 11923:1997 standard for determination of suspended solids by filtration through glass-fiber filters. The filter is typically set up in a funnel that is connected to a Millipore vacuum pump. The filter is then dried in a Memmert ULM400 lab oven at 100–105 °C for 4–6 h. The mass of suspended solid particles is determined by calculating the difference in weight of the glass-fiber filter before filtering and after drying. The discharge and TSS values at the outlets of Ta Trach and Huu Trach tributaries as well as at the outlet of Huong River were compiled for the SWAT analysis.
2.5. SWAT Model Simulations
To evaluate the impacts of the hydroelectric dams on the natural flow regime of Huong River, the SWAT model was used to simulate daily stream discharge over two of its sub-basins and the entire basin before and after the operations of the dams. A similar approach has been used successfully for the Wenyu River catchment in China [10] and the Han River basin in Korea [37]. By using the inlet flow of a dam as its outlet flow for simulation, it can be considered as the natural flow without the presence of the dam. Any difference between simulated and observed flow values would demonstrate the impact of the dam on natural flow. The impacts of a dam on natural flow could then be assessed based on observed data and simulated data with the assumption that no dam existed in the area. Data from the period before the dam was built and operated might be used to calibrate the model before simulating the flow for the period after construction of the dam. So, these specific approaches allow the impacts of hydroelectric dams on Huong River to be evaluated using the SWAT model in this study.
2.6. Model Calibration
Due to the fact that observed discharge data of the Huong River basin are only available from January 2007 to December 2010 at all hydrological stations, data for this period only were used in the discharge calibration process at the outlet of Ta Trach tributary (site H1), where the hydroelectric dam has zero impact. The calibrated model parameters of the Ta Trach sub-basin will be applied to simulate the discharge of the Huu Trach sub-basin (at site H2) and the Huong River basin (at site H10) (Figure 1). The reason for selecting Ta Trach sub-basin for model calibration before simulating the discharge of Huu Trach tributary under no-dam-impact condition is that Ta Trach sub-basin and Huu Trach sub-basin have the similarity of land use and soil characteristics as well as slope and basin scale. The difference between simulated and observed discharge from January 2010 to December 2010 in these two areas is analyzed to identify any impact of Binh Dien hydroelectric dam on modification of the flow rate.
The ArcSWAT for ArcGIS 10 interface for SWAT 2009 is used in this study to set up the model and simulate discharge and sediment yield at the outlet of the Huong River basin. Calibration is performed manually with ArcSWAT by adjusting the value of one model parameter at a time to attain better agreement between simulated and observed values. Several model parameters that are sensitive for discharge simulation in SWAT determined from previous studies were the focus of calibration. Veith et al. [38] suggest that CH_N2 (Manning’s N value for stream channels), CN2 (SCS curve number), SOL_K (soil hydraulic conductivity) and SOL_AWC (available water capacity of the soil) are the most significant SWAT model parameters that affect discharge simulation outputs. They also note that the effects of ALPHA_BF (base flow alpha factor), ESCO (soil evaporation compensation factor) and GW_REVAP (groundwater “revap” coefficient) on model simulation can be considerable.
The model performance is evaluated through two standard statistical measures: the Nash-Sutcliffe Efficiency (NSE) and the Pearson product–moment correlation coefficient (r). These measures are defined as follow:
where and are the observed and simulated discharge at day t, respectively. and are the average observed and simulated discharge, respectively. N is the total number of record.
The NSE expresses the predictive capability of the model and takes values that are smaller than or equal to one. Larger values of NSE that are closer to one indicate the model’s ability of reproducing observed data. Pearson’s r is a popular statistical measure that is used to evaluate the degree of linear correlation between the simulated and observed variable.
The discharge calibration process starts with the adjustment of CH_N2 parameter. The NSE and R are calculated for every simulation and the value of adjusted model parameter that generates higher NSE and R than previous simulation is saved. The calibration process continues by adjusting CN2, SOL_K, SOL_AWC, ALPHA_BF, ESCO and GW_REVAP, respectively, and follows the same procedure. The calibration process indicates that Huong River discharge is most sensitive to CH_N2 (Manning’s N value for stream channels), CN2 (SCS curve number), and SOL_K (soil hydraulic conductivity) and moderately sensitive to SOL_AWC (available water capacity of the soil) and ALPHA_BF (base flow alpha factor), while it has low sensitivity to the parameters ESCO (soil evaporation compensation factor) and GW_REVAP (groundwater “revap” coefficient).
The calibrations results on the Ta Trach sub-basin (H1) for the 2007–2010 period are shown in Figure 5. Due to the frequency of observed discharge, the comparison of simulated and observed discharge had to be performed at daily time scale but with just one data point for each month. The discharge hydrographs are show in logarithmic scale because of the large differences between high and low flows (more than two orders of magnitudes). As can be seen from Figure 5, simulated discharge follows the trend of observed discharge. The base flows during the dry seasons are relatively well simulated. However, the peak flows in the rainy seasons of 2007 and 2008 are underestimated while reasonably estimated in 2009 and 2010. Comparison of simulated and observed data points results in a Nash-Sutcliffe efficiency of 0.67 and a Pearson correlation coefficient of 0.82 (Table 2). Both rainfall input and discharge measurement have problems. TRMM rainfall products suffer from the very coarse resolution and cannot adequately capture extreme rainfall values. Discharge measurements were performed manually from a boat and have high potential of errors and bias. Nonetheless, the results are satisfactory compared to published SWAT simulations of daily discharge.
Similar to the discharge calibration process, TSS simulations are also calibrated over the Ta Trach sub-basin before the calibrated model is used to simulate the TSS of the Huu Trach sub-basin and the Huong River basin. Due to the availability of observed data, this calibration period for TSS is longer. The TSS calibration also focuses on suggested model parameters and it shows that PRF (peak rate adjustment factor for sediment routing), USLE_P (USLE support practice factor), SPEXP (exponent parameter for calculating the channel sediment routing), and SLOPE (average slope steepness) are the main parameters that affect the sediment transport in the basin. TSS is calibrated for the period between January 2003 and December 2010.
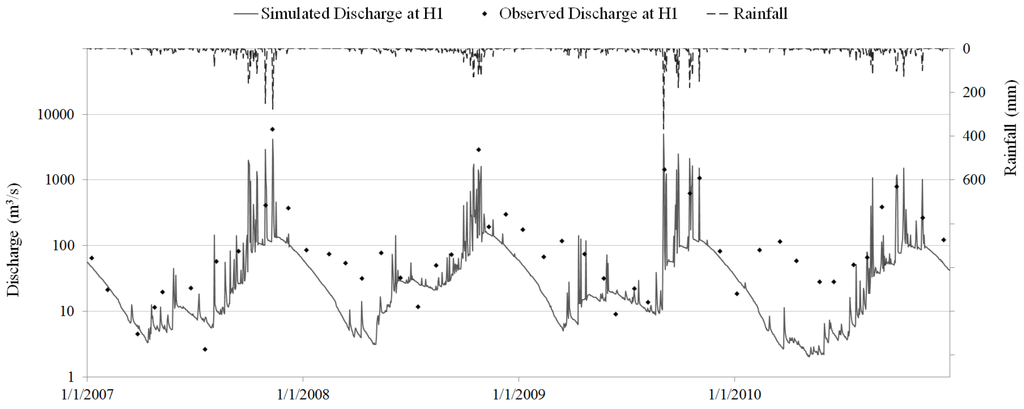
Figure 5.
River discharge calibration at H1.

Table 2.
Performance evaluation statistics of discharge simulation.
| Station | Discharge Simulation | |
|---|---|---|
| NSE (≤1) | r (0–1) | |
| H1 (Calibration) | 0.67 | 0.82 |
| H2 (Validation) | 0.54 | 0.74 |
| H10 (Validation) | 0.57 | 0.77 |
In general, TSS is reasonably estimated; the peaks of simulated TSS follow the trend of observed TSS at corresponding times (Figure 6). Fitting the simulated values with the lower observed values will cause significant differences between the simulated and observed peak values and vice versa. The Nash-Sutcliffe efficiency and Pearson correlation coefficient of simulated and observed TSS at H1 are 0.46 and 0.71, respectively (Table 3). As expected, the TSS simulations were not as good as the discharge simulations because the latter have their own sources of error in addition to the error propagated from the discharge simulations. The TSS measurements are not error-free since they are based on samples taken from a boat. SWAT model, as it includes the effects of flow, land use, soil, slope and other natural characteristics on TSS concentration, was able to reasonably estimate sediment transport in the Ta Trach sub-basin.
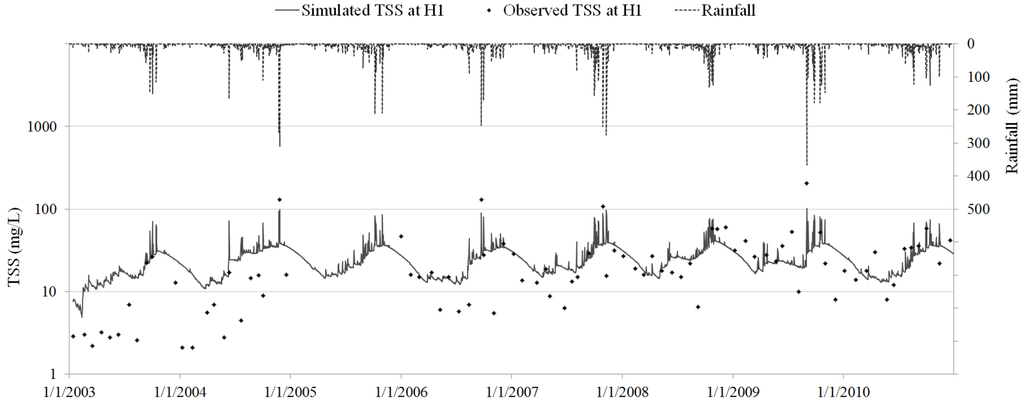
Figure 6.
TSS calibration at H1.

Table 3.
Performance evaluation statistics of TSS simulation.
| Station | TSS Simulation | |
|---|---|---|
| NSE (≤1) | R (0–1) | |
| H1 (Calibration) | 0.46 | 0.71 |
| H2 (Validation) | 0.36 | 0.62 |
| H10 (Validation) | 0.41 | 0.64 |
Table 4 lists the values of the calibrated model parameters for discharge and TSS simulations. The values fall within their acceptable ranges in SWAT and represent fairly the characteristics of the Huong River basin’s components, such as river roughness, surface runoff, hydraulic conductivity of soils and riverbed, steepness, etc. The SCS curve number (CN) value which is a function of land use, soil permeability and antecedent soil moisture ranges from a lowest values of 42 to a highest of 97; the lower CN values were for the areas where forest dominate or the areas of sandy soil, the higher CN values were for urban and water and wetland areas. The hydraulic conductivity of each soil group slightly changed from its original value after calibration; for example Dystric Gleysols at wetland areas had the lowest calibrated hydraulic conductivity of 0.318 mm/h, Luvic Arenosols with mostly sand at the coastal areas had the highest calibrated hydraulic conductivity of 690 mm/h. Sediment calibration is affected by the runoff parameters listed above but is most sensitive to the peak rate adjustment factor (PRF). The rivers in this study are in unprotected condition with the river banks covered mostly by wild grasses downstream and shrubs upstream. Sediment simulation does not take into account the anthropogenic impact from sand and gravel mining around the confluence of Huu Trach and Ta Trach tributaries that was described by IUCN [39].

Table 4.
Model parameters used to calibrate discharge at H1.
| Calibration | Calibrated Model Parameters | Calibrated Values | |
|---|---|---|---|
| Parameters | Definitions (Unit) | ||
| Discharge | CH_N2 | Manning’s N value for stream channels | 0.035 |
| CN2 | SCS curve number | 42.00–97.00 | |
| SOL_K | Soil hydraulic conductivity (mm/h) | 0.318–690.0 | |
| SOL_AWC | Available water capacity of the soil (mm/mm) | 0.075–0.315 | |
| ALPHA_BF | Base flow alpha factor (days) | 0.25 | |
| GW_REVAP | Groundwater “revap” coefficient | 0.02 | |
| ESCO | Soil evaporation compensation factor | 1.0 | |
| Total Suspended Solids | PRF | Peak rate adjustment factor for sediment routing | 0.65 |
| USLE_P | USLE support practice factor | 0.35 | |
| SPEXP | Exponent parameter for calculating the channel sediment routing | 1.6 | |
| SLOPE | Average slope steepness (m/m) | 0.027–0.573 | |
3. Results and Discussion
3.1. Discharge Simulations
SWAT was validated over the Huu Trach sub-basin (H2) and the Huong River basin (H10). Discharge simulation at H2 (Figure 7) during the rainy season of 2007 has the same problem of underestimation as at H1. Examining the TRMM precipitation for this period which agrees with the simulated discharge indicates that the apparent underestimation is most probably a result of errors in either precipitation estimates or observed flow and is not caused by SWAT errors. In general, observed discharges of Huu Trach sub-basin and Huong River basin are reasonably estimated by SWAT; the trends of simulated discharges match observed ones (Figure 7 and Figure 8). Simulated and observed discharge comparisons at H2 and H10 from January 2007 to December 2009 (pre-dam period) have Nash-Sutcliffe efficiencies of 0.54 and 0.57 and Pearson correlation coefficients of 0.74 and 0.77, respectively (Table 2). A closer look at the comparison indicates that discharge at H2 and H10 was simulated reasonably well during the period of 2007–2009, except the deviation in 2007 rainy season at H2.
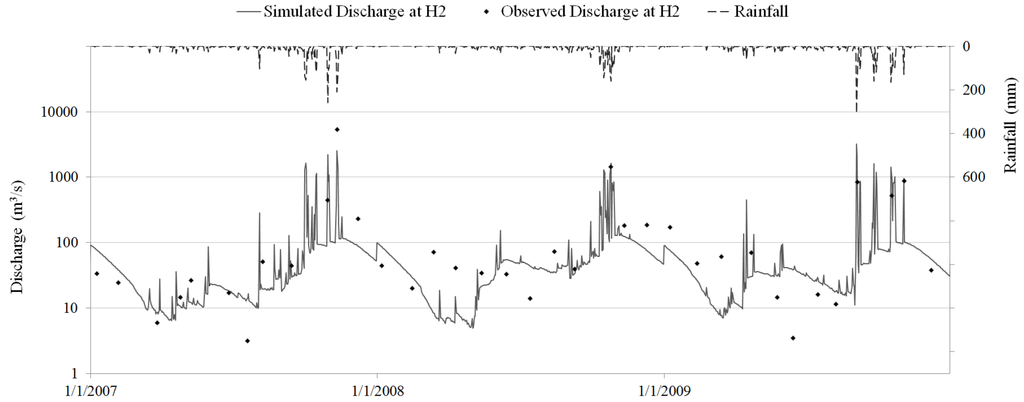
Figure 7.
River discharge validation at H2.
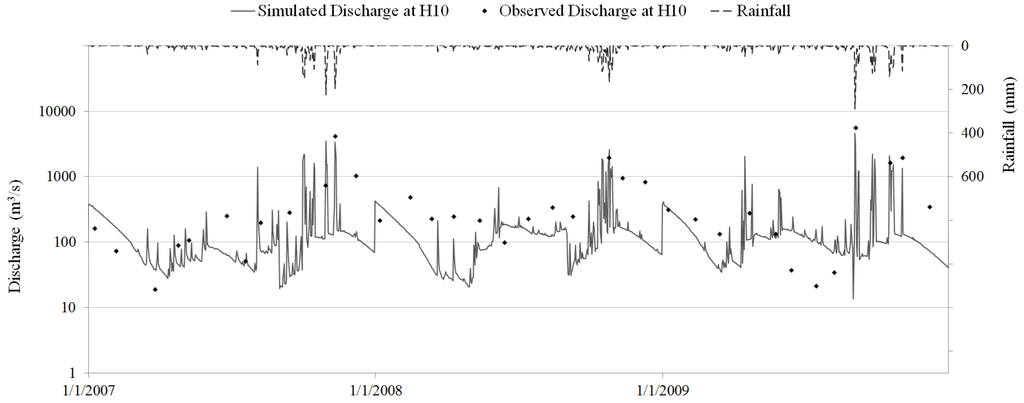
Figure 8.
River discharge validation at H10.
3.2. Dam Impact on River Discharge
The dam impact in regulating the river discharge is investigated by running SWAT simulations without considering the dam and comparing the results to actual discharge at H2 and H10. As can be seen from the hydrographs (Figure 9), the observed discharge during the rainy season of 2010 is much lower than the simulated discharge (logarithmic scale is used), which is a consequence of the operation of Binh Dien hydroelectric dam. The unusually high values of discharge in the 2010 dry season are also a clear proof of the impact of Binh Dien hydroelectric dam operation. The dam releases water in the dry summer to keep producing power and also to prevent intrusion of ocean water while it stores water in the fall and winter for conservation and flood control.
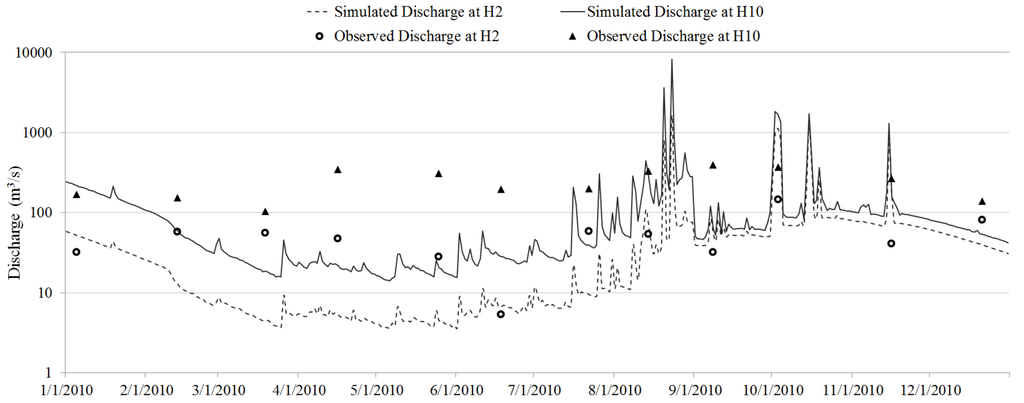
Figure 9.
Simulated and observed discharge at H2 and H10 in 2010.
The percentage change in river discharge on each observation date in 2010 is also calculated using the simulated discharge (no dam effect) as a reference. During the dry season, releases from the dam greatly increased the inflow on average by 226% and 90% at H2 and H10, respectively (Table 5). Conversely, in the rainy season, storage at the dam decreased the river discharge potentially 35% and 14% on average at H2 and H10, respectively. Admittedly, these quantities are affected by the accuracy of model inputs and discharge measurement and SWAT simulation errors. However, the numbers indicate significant impact of hydroelectric dam on changing the natural discharge of the Huong River basin.

Table 5.
Changes in discharge and sediment load in 2010.
| Change in 2010 | Discharge | Sediment Load | ||
|---|---|---|---|---|
| H2 | H10 | H2 | H10 | |
| Dry season | 226% | 90% | 158% | 51% |
| Rainy season | −35% | −14% | −55% | −28% |
3.3. TSS Simulations
The SWAT simulations of TSS concentration for Huu Trach sub-basin at H2 generally underestimate the observed peak values (Figure 10) for the 2003–2009 period—before the dam construction. TSS of this tributary is very difficult to estimate even with the period before dam operation. Observed data indicate random variation over time. There is a large area on Huu Trach River near H2 where local people exploit sand and gravel for construction projects which is probably the major reason of the unusual variability in the observations [39]. TSS estimation for Huong River basin at H10 was better (Figure 11). H10 is located far enough downstream from the sand and gravel mining area on Huu Trach River to have any visible impact on its TSS concentration. The Nash-Sutcliffe efficiencies at H2 and H10 are 0.36 and 0.41, respectively (Table 3). The Pearson correlation coefficients are 0.62 and 0.64 for H2 and H10, respectively. Given the low reliability of TSS measurements and that fact that SWAT discharge errors propagate through TSS simulations, the validation results can be considered satisfactory.
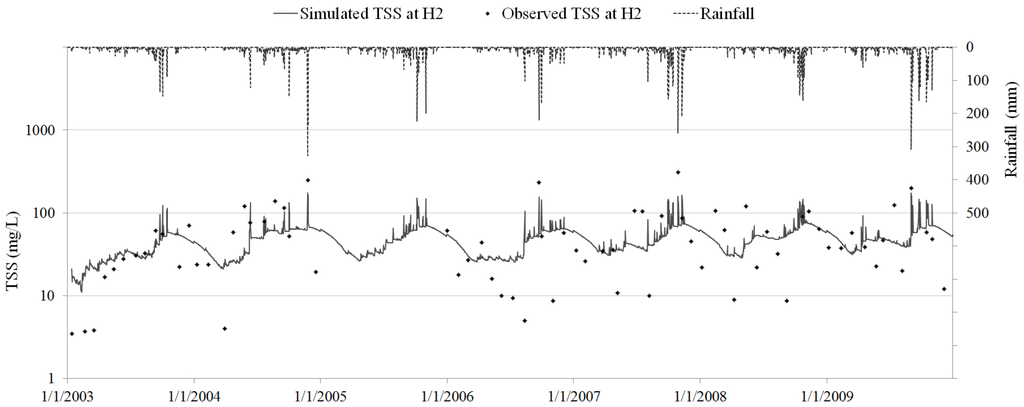
Figure 10.
TSS validation at H2.
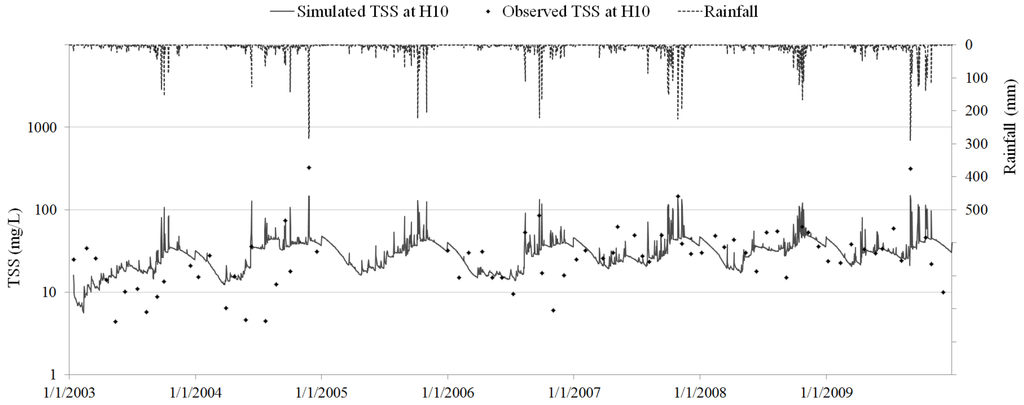
Figure 11.
TSS validation at H10.
The sediment rating curve method is also used to simulate TSS and is compared with MUSLE model’s simulation. The rating curves are generated for each location, H1, H2 and H10. Rating curves represent power functions that applied to calculate simulated TSS from simulated discharge. For H1, the rating curve was generated for the period from January 2007 to December 2010. For H2 and H10, they were generated for the period from January 2007 to December 2009. The TSS simulation was not significantly improved by using the sediment rating curves. However, the approach is still valuable for verifying the performance of MUSLE model within SWAT.
3.4. Dam Impact on TSS Concentration and Sediment Loading
In general, dam operation lowered the TSS concentration within the basin (Figure 12). In 2010, when the dam was operated, TSS at H2 decreased by 12% in average during the dry season. It decreased in the rainy season by 35% in average, almost three times as much as during the dry season. This indicates that dam storage result in sediment deposition in the lake reduction TSS concentration below the dam. At H10, the decrease of TSS is much smaller in the rainy season, at 9% on average. There is no large effect on TSS concentration in the rainy season. The dam impact on total sediment loading (discharge × TSS) is much larger (Table 5). At H2, the sediment loading increased by 158% during the dry season and increased by 55% during the rainy season while increasing by 51% during the dry season and decreasing by 28% during the rainy season at H10.
Probably, sand and gravel mining near H2 might be major contributors to define observed TSS. Unfortunately, the MUSLE model in SWAT is not able to capture these anthropogenic impacts in its simulation. For that reason, it is difficult to conclude changes in TSS mentioned above are completely the consequences of only Binh Dien hydroelectric dam operation in 2010. However, assuming that sand and gravel mining had maintained at the same level throughout the study period, one can conclude that the presence of Binh Dien hydroelectric dam has big impacts on TSS and sediment loading.
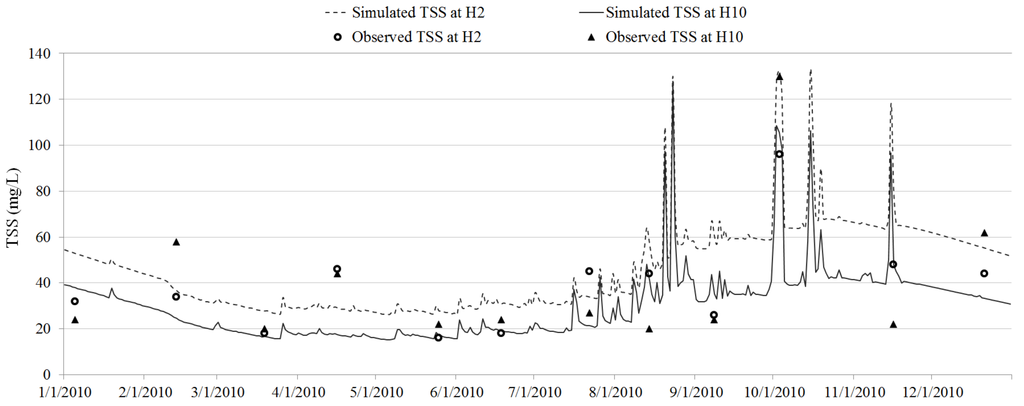
Figure 12.
Simulated and observed TSS at H2 and H10 in 2010.
4. Summary and Conclusions
This study adopted a modeling approach to study the impacts of dams on discharge and water quality parameters. The approach was implemented in the Huong River basin in Vietnam. The SWAT hydrologic model, driven by satellite rainfall, was set up for this 2830 km2 basin and was run to simulate flow discharge and TSS concentrations at the outlets of two major tributaries, Ta Trach and Huu Trach, and also at the outlet of the Huong basin. Given the uncertainty of the satellite rainfall products that were used as input and the sparse stream discharge and TSS measurements used for model calibration, the model simulations matched the observations reasonably well at the daily time scale. Daily discharge and TSS concentrations of the Huong River basin were simulated adequately by the SWAT during model validation. This is encouraging given that SWAT was initially designed for monthly simulations.
Results indicate that satellite precipitation products can potentially be useful in hydrologic and water quality simulations at daily or monthly time scales over poorly gauged basins, such as the Huong River basin. Better results can be expected if satellite data is complemented with other remote sensing data, such as meteorological observations. Based on SWAT performance in the literature, it is expected that simulations at the monthly time scale will be much more accurate. The results suggest that SWAT, driven by remotely sensed precipitation, can potentially support modeling for hydrological and water applications in the near real-time, daily time scale. As satellite products are continuously improving, SWAT applications, such as flood forecast guidance and daily reservoir inflow predictions, seem to be quite feasible. The results also indicate that the MUSLE model within SWAT produces TSS results comparable to those estimated using rating curves based on observed discharge and TSS.
The study investigated how dam construction and operation alter downstream flow characteristics, such as discharge patterns and sediment transport in the Huong River basin. The simulation results indicate discharge at H2 and H10 during the rainy season was lowered by 35% and 14% on average, respectively. Discharge was augmented by 226% and 90% at H2 and H10, respectively, due to dam releases in the dry season. The changes in sediment load are not proportional to discharge due to the reservoir storage effect, i.e., less increase in sediment load during the dry season and more reduction during the rainy season. However, TSS concentration decreased for both seasons. On average, the dam impact on discharge is higher than on sediment loading. The construction and operation of the Binh Dien hydroelectric dam may minimize flood damages to electrical power, and augment discharge during the dry season. However, the dam can also have negative consequences for natural ecology, degrade downstream water quality, and reduce the silt delivered to agricultural fields.
The modeling approach adopted and the data sources used can be employed to study the impacts of the other dams that were built or to be built after the Binh Dien dam. The approach can also be applied in other ungauged or poorly gauged river basins for water resources assessment studies, analysis of the impact of water management on water quantity and quality, and prediction on climate change impacts on water resources. Information from SWAT studies in similar gauged basins can be used to improve representations of the space–time variability of hydrological processes and thereby reducing uncertainty of predictions in ungauged catchments. These comparative studies can be used for direct regionalization of discharge and flow characteristics and regionalization of model parameters.
Acknowledgments
Support of the Research Center at the College of Arts, King Saud University to the second author is cordially acknowledged.
Author Contributions
This paper presents part of Tuan Le Ph.D. study research. Tuan Le’s Ph.D. study was advised by Hatim O. Sharif who guided his research and contributed significantly to preparing the manuscript for publication. Farhan Al-Juaidi designed the erosion portion of the study and Hatim O. Sharif designed the hydrologic modeling portion with input from Tuan Le who downloaded the remote sensing products and prepared and performed the SWAT simulations. Tuan conducted post-analysis of the model outputs and prepared the first draft. Farhan Al-Juaidi and Hatim O. Sharif reviewed and revised the erosion and hydrologic modeling portions of the manuscript. Farhan Al-Juaidi and Hatim O. Sharif did the final overall proof reading of the manuscript.
Conflicts of Interest
The authors declare no conflicts of interest.
References
- Bartle, A. Hydropower potential and development activities. Energy Policy 2002, 30, 1231–1239. [Google Scholar] [CrossRef]
- Jacobson, M.Z. Review of solutions to global warming, air pollution, and energy security. Energy Environ. Sci. 2009, 2, 148–173. [Google Scholar] [CrossRef]
- Egré, D.; Milewski, J.C. The diversity of hydropower projects. Energy Policy 2002, 30, 1225–1230. [Google Scholar] [CrossRef]
- Sternberg, R. Hydropower’s future, the environment, and global electricity systems. Renew. Sustain. Energy Rev. 2010, 14, 713–723. [Google Scholar] [CrossRef]
- Rosenberg, D.M.; Bodaly, R.A.; Usher, P.J. Environmental and social impacts of large scale hydroelectricity development: Who is listening? Glob. Environ. Chang. Hum. Policy Dimens. 1995, 5, 127–148. [Google Scholar] [CrossRef]
- Abbasi, S.A.; Abbasi, N. The likely adverse environmental impacts of renewable energy sources. Appl. Energy 2000, 65, 121–144. [Google Scholar] [CrossRef]
- Sawyer, A.H.; Cardenas, M.B.; Bomar, A.; Mackey, M. Impact of dam operations on hyporheic exchange in the riparian zone of a regulated river. Hydrol. Process. 2009, 23, 2129–2137. [Google Scholar] [CrossRef]
- Rasanen, T.A.; Koponen, J.; Lauri, H.; Kummu, M. Downstream hydrological impacts of hydropower development in the upper Mekong Basin. Water Resour. Manag. 2012, 26, 3495–3513. [Google Scholar] [CrossRef]
- Le, T.B. River Basin Scale Hydrologic Modeling for Prediction of Water Availability; University of Texas at San Antonio: San Antonio, TX, USA, 2014; p. 125. [Google Scholar]
- Zhang, Y.; Xia, J.; Chen, J.; Zhang, M. Water quantity and quality optimization modeling of dams operation based on SWAT in Wenyu River Catchment, China. Environ. Monit. Assess. 2011, 173, 409–430. [Google Scholar] [CrossRef] [PubMed]
- Williams, G.P.; Wolman, M.G. Downstream Effects of Dams on Alluvial RIVERS; Geological Survey Professional Paper 1286; Unite States Government Printing Office: Washington, DC, USA, 1984; p. 83. [Google Scholar]
- Petts, G.E. Complex response of river channel morphology subsequent to reservoir construction. Prog. Phys. Geogr. 1979, 3, 329–362. [Google Scholar] [CrossRef]
- Kileshye, O.J.; Mazvimavi, D.; Love, D.; Mul, M.L. Effects of selected dams on river flows of Insiza River, Zimbabwe. Phys. Chem. Earth 2006, 31, 870–875. [Google Scholar] [CrossRef]
- Topping, D.J.; Rubin, D.M.; Vierra, L.E. Colorado River sediment transport 1. Natural sediment supply limitation and the influence of Glen Canyon Dam. Water Resour. Res. 2000, 36, 515–542. [Google Scholar] [CrossRef]
- Dang, T.H.; Coynel, A.; Orange, D.; Blanc, G.; Etcheber, H.; Le, L.A. Long-term monitoring (1960–2008) of the river-sediment transport in the Red River Watershed (Vietnam): Temporal variability and dam-reservoir impact. Sci. Total Environ. 2010, 408, 4654–4664. [Google Scholar] [CrossRef] [PubMed]
- Mekong River Commission (MRC). Overview of the Hydrology of the Mekong Basin; Mekong River Commission: Vientiane, Lao PDR, 2005. [Google Scholar]
- Nguyen, H.Đ.; Nguyen, G.B. The participation of community in Huong and Bo watershed in building and operating hydropower dams in Thua Thien Hue province. Vietnam Natl. Univ. Han. J. Sci. 2011, 27, 101–112. [Google Scholar]
- Thua Thien Hue Provincial People Committee (TTH-PPC). Thua Thien Hue Geography Book. Available online: http://www3.thuathienhue.gov.vn/GeographyBook/Default.aspx (accessed on 22 January 2013).
- Arnold, J.G.; Srinivasan, R.; Muttiah, R.S.; Williams, J.R. Large area hydrologic modeling and assessment—Part I: Model development. J. Am. Water Resour. Assoc. 1998, 34, 73–89. [Google Scholar] [CrossRef]
- Chaplot, V.; Saleh, A.; Jaynes, D.B.; Arnold, J. Predicting water, sediment and NO3-N loads under scenarios of land-use and management practices in a flat watershed. Water Air Soil Pollut. 2004, 154, 271–293. [Google Scholar] [CrossRef]
- Abbaspour, K.C.; Yang, J.; Maximov, I.; Siber, R.; Bogner, K.; Mieleitner, J.; Zobrist, J.; Srinivasan, R. Modelling hydrology and water quality in the pre-alpine/alpine Thur watershed using SWAT. J. Hydrol. 2007, 333, 413–430. [Google Scholar] [CrossRef]
- Rostamian, R.; Jaleh, A.; Afyuni, M.; Mousavi, S.F.; Heidarpour, M.; Jalalian, A.; Abbaspour, K.C. Application of a SWAT model for estimating runoff and sediment in two mountainous basins in central Iran. Hydrol. Sci. J. 2008, 53, 977–988. [Google Scholar] [CrossRef]
- Khoi, D.N.; Suetsugi, T. Unvertainty in climate change impacts on streamflow in Be River Catchment, Vietnam. Water and Environ. J. 2012, 26, 530–539. [Google Scholar] [CrossRef]
- Arnold, J.G.; Kiniry, J.R.; Srinivasan, R.; Williams, J.R.; Haney, E.B.; Neitsch, S.L. Soil and Water Assessment Tool Input/Output File Documentation Version 2009; Texas Water Resources Institute Technical Report No. 365; Texas A&M University System: College Station, TX, USA, May 2010. [Google Scholar]
- Williams, J.R.; Berndt, H.D. Sediment yield prediction based on watershed hydrology. Trans. ASAE 1977, 20, 1100–1104. [Google Scholar] [CrossRef]
- Zhang, Y.; Degroote, J.; Wolter, C.; Sugumaran, R. Integration of modified universal soil loss equation (MUSLE) into a GIS framework to assess soil erosion risk. Land Degrad. Dev. 2009, 20, 84–91. [Google Scholar] [CrossRef]
- Wischmeier, W.H.; Smith, D.D. Predicting Rainfall Erosion Losses: A Guide to Conservation Planning; Agriculture Handbook No. 537; United States Department of Agriculture: Washington, DC, USA, December 1978.
- SWAT Soil & Water Assessment Tool Website. Available online: http://swatmodel.tamu.edu/ (accessed on 7 October 2014).
- Collischonn, B.; Collischonn, W.; Tucci, C.E.M. Daily hydrologic modeling in the Amazon basin using TRMM rainfall estimates. J. Hydrol. 2008, 360, 207–216. [Google Scholar] [CrossRef]
- Curtis, S.; Crawford, T.W.; Lecce, S.A. A comparison of TRMM to other basin-scale estimates of rainfall during the 1999 Hurricane Floyd flood. Nat. Hazards 2007, 43, 187–198. [Google Scholar] [CrossRef]
- National Aeronautics and Space Administration (NASA) Mirador Website. Available online: http://mirador.gsfc.nasa.gov/ (accessed on 18 February 2013).
- Kummerow, C.; Barnes, W.; Kozu, T.; Shiue, J.; Simpson, J. The Tropical Rainfall Measuring Mission (TRMM) sensor package. J. Atmos. Ocean. Technol. 1998, 15, 809–817. [Google Scholar] [CrossRef]
- Huffman, G.J.; Adler, R.F.; Bolvin, D.T.; Gu, G.J.; Nelkin, E.J.; Bowman, K.P.; Hong, Y.; Stocker, E.F.; Wolff, D.B. The TRMM multisatellite precipitation analysis (TMPA): Quasi-global, multiyear, combined-sensor precipitation estimates at fine scales. J. Hydrometeorol. 2007, 8, 38–55. [Google Scholar] [CrossRef]
- National Climatic Data Center (NCDC) National Oceanic Atmospheric Administration (NOAA) Website. Available online: http://www.ncdc.noaa.gov/cdo-web/ (accessed on 15 April 2013).
- NASA Atmospheric Science Data Center Website. Available online: http://eosweb.larc.nasa.gov/sse/ (accessed on 15 April 2013).
- Institute of Resources, Environment, and Biotechnology of Hue University, Vietnam (IREB-Hue). Annual Reports on Water Quality Monitoring Results of Huong River; IREB-Hue: Hue, Vietnam, 2003–2010. [Google Scholar]
- Kim, N.W.; Lee, J.E.; Kim, J.T. Assessment of flow regulation effects by dams in the Han River, Korea, on the downstream flow regimes using SWAT. J. Water Resour. Plan. Manag. 2012, 138, 24–35. [Google Scholar] [CrossRef]
- Veith, T.L.; van Liew, M.W.; Bosch, D.D.; Arnold, J.G. Parameter sensitivity and uncertainty in SWAT: A comparison across five USDA-ARS watersheds. Am. Soc. Agric. Biol. Eng. 2009, 53, 1477–1486. [Google Scholar]
- International Union for Conservation of Nature and Natural Resources in Vietnam (IUCN Vietnam). Environmental Flows: Rapid Environmental Flow Assessment for the Huong River Basin, Central Vietnam; IUCN Vietnam: Hanoi, Vietnam, 2005; p. 82. [Google Scholar]
© 2014 by the authors; licensee MDPI, Basel, Switzerland. This article is an open access article distributed under the terms and conditions of the Creative Commons Attribution license (http://creativecommons.org/licenses/by/4.0/).