Article

Saltwater Intrusion in Coastal Aquifers: A Primary Case Study along the Adriatic Coast Investigated within a Probabilistic Framework

Dipartimento di Ingegneria Civile, Chimica, Ambientale e dei Materiali (DICAM), Università di Bologna, Viale Risorgimento 2, Bologna 40136, Italy
*
Author to whom correspondence should be addressed.
Water 2013, 5(4), 1830-1847; https://doi.org/10.3390/w5041830
Submission received: 20 August 2013 / Revised: 20 October 2013 / Accepted: 11 November 2013 / Published: 19 November 2013

Abstract

:
Environmentally sensitive areas along coastlines may be adversely affected by saltwater intrusion (SI), a condition which can be worsened by extensive groundwater extraction. Given the uncertainty of problem parameters, the risk of contamination of the vegetation capture zone needs to be cast in a probabilistic framework. In order to exemplify real situations existing along the Adriatic coast of Emilia-Romagna, a case study involving a pinewood strip and a well field drawing freshwater from an unconfined coastal aquifer was examined. On the basis of a widely adopted sharp interface formulation, key hydrogeological problem parameters were modeled as random variables, and a global sensitivity analysis was carried out to determine their influence on the position of the interface. This analysis utilized an efficient model reduction technique based on Polynomial Chaos Expansion. The risk that saltwater intrusion affects coastal vegetation was then evaluated via a two-step procedure by computing the probability that (i) the leading edge of the saltwater wedge reaches the sensitive area in the horizontal plane, and (ii) the freshwater/saltwater interface reaches the capture zone. The influence of the design parameters of the well field on the overall probability of contamination was investigated, revealing the primary role of the pumping discharge in the examined configuration.

Graphical Abstract

1. Introduction

Contamination of freshwater bodies caused by saltwater intrusion (SI) is a global issue, affecting water quality, vegetation, and soil conditions along coastal lines. Deterioration of this freshwater resource threatens the sustainability of the water supply of coastal communities and their economic development [1,2]. Freshwater stored in coastal aquifers is particularly vulnerable to degradation due to (i) its close proximity to seawater, and (ii) the significant water demand associated with coastal areas whereby groundwater is often the main source of drinking water [3]. Continual degradation of groundwater quality in coastal aquifers has become an increasing concern in heavily urbanized regions across the world. In many countries, including Cyprus, Mexico, Oman, and Israel, hundreds of wells along the coastline have had to be shut down because of SI [4]; in California, saltwater from the Pacific Ocean has seeped into the Los Angeles Basin coastal aquifer, replacing freshwater [5]. Extensive research is currently being carried out worldwide in order to understand the mechanisms of SI and develop strategies to control the process. For example, costly technological solutions, such as desalination, barriers or injection wells have been implemented to deal with the reduction in freshwater availability [6].
Over the last several decades SI has become a crucial issue in Italy as denoted by many studies conducted on different coastal areas [7,8]. SI represents an even more serious threat along the coast of Emilia-Romagna (Figure 1), as it is combined with a strong anthropogenic subsidence, only partially limited in recent years. Though the subsidence in this area has a natural component, with an average of 0.5 mm/year [9], it is exacerbated by gas extraction [10], drainage to reclaim farmland, and groundwater over-exploitation, limited only since the late 1980s [11,12]. The presence of vegetation and complex ecosystems in such areas (i.e., lagoons, marshes, and pine forests), also increases potential adverse impacts from an ecological point of view: understanding the mechanisms whereby these sensitive environments/ecosystems can be affected by SI represents a critical research challenge, as evidenced by recent literature findings [13]. During the past twenty years, the coastal pine forest of Ravenna, along the Adriatic coast, has been affected by a progressive lowering in vegetation density, uprooting of tall plants, drying of pine plants, and changes in the richness of plant species. These impacts have been attributed to groundwater salinity, shallow water tables, drought, and air pollution [14,15]. The trend in groundwater salinization underneath the coastal pine forest is a process that is progressing in time, as recent studies have demonstrated [16].
In recent years, numerical approaches have been increasingly adopted to represent the detailed and complex processes involved in SI [3]. The characterization of the mixing zone as well as the evolution of intrusion temporally represent some applications in which the adoption of numerical models is relevant [17,18]. Similarly, analytical formulations can provide a prompt insight into relevant physical processes involved and, for this reason, a significant number of studies have been conducted in this realm [19,20,21,22]. In particular, the theory developed by Strack [23], based on the sharp interface approximation, has been widely adopted to predict the extension of SI in steady-state flow under the Dupuit-Forchheimer assumption [3,20,24,25]. Several models describing situations of potential engineering interest have been developed and serve as a suitable reference to be re-examined from a risk analysis (RA) point of view [26,27].
A rigorous application of RA in environmental problems has been promoted by several environmental agencies and institutions [28,29]. In the context of climate change, taking into account the uncertainty affecting hydrological parameters is even more important to make accurate predictions. In general, uncertainties are linked to (i) the incomplete knowledge of system dynamics (epistemic uncertainty), and (ii) the randomness which is inherent to natural phenomena (aleatory uncertainty) [30,31]. This uncertainty, propagating towards the state variables of interest through a selected analytical or numerical model, has to be properly considered in a probabilistic framework.
In this work we expand upon this approach by providing a general methodology applicable to different contexts and model complexities. In particular, using examples and characteristics of the coastal aquifers found in the area of Ravenna in Emilia-Romagna, we propose a basic scheme representing the key features of steady-state SI in a probabilistic framework. First, an analytical model based on the theory of Strack [25] whereby groundwater withdrawal from a well within a phreatic aquifer is considered. Subsequently, the effects of well pumping on SI and coastal vegetation are investigated where the problem parameters exhibit associated uncertainty. This problem is addressed utilizing model reduction techniques [32,33], which provide an alternative to onerous and time consuming traditional simulation methods (e.g., Monte Carlo simulations). This methodology may be easily applied to complex case studies, assisting in the definition of proper management solutions for coastal aquifers. Regarding this point, in the exemplificative application presented here, we derive the dependence of the risk for the vegetation on the parameters characterizing the well field, quantifying the primary role of the pumping discharge.
Figure 1. Map of the Adriatic coast around Ravenna [34].
Water 05 01830 g001

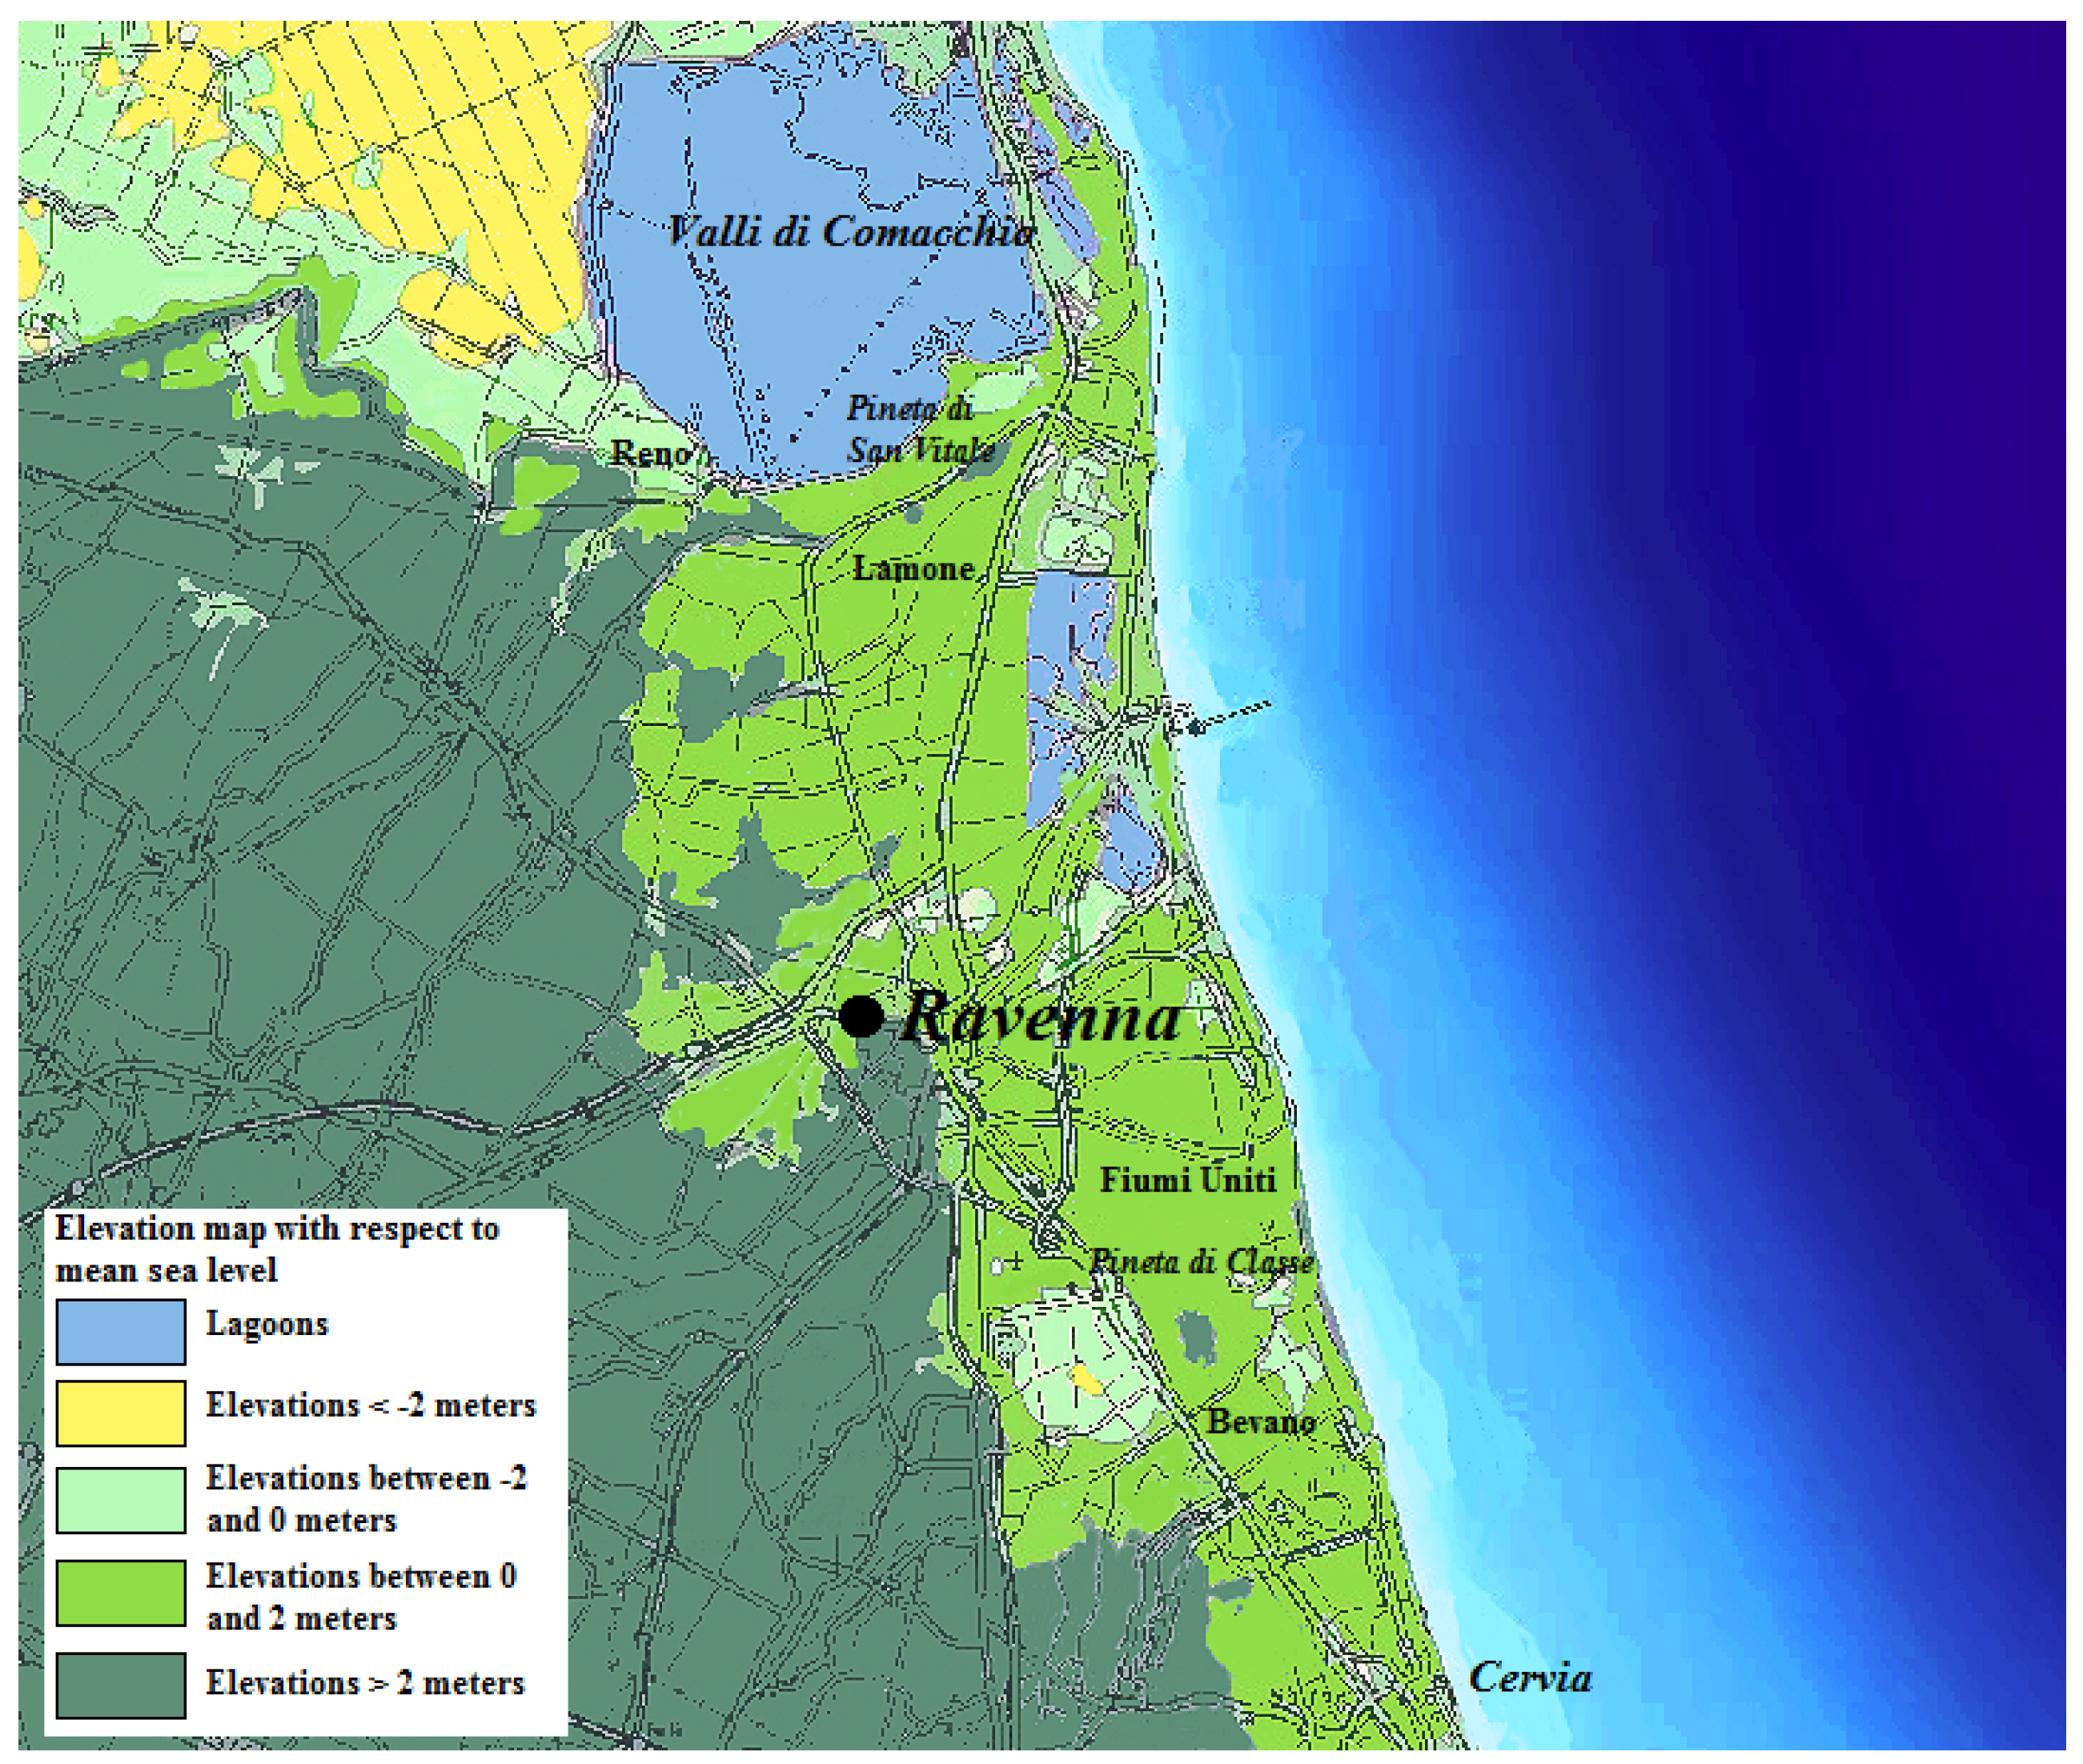
2. Characterization of the Area of Interest

The Adriatic Sea is a shallow basin whose depth rises southwards and is characterized by a modest tidal excursion. The Adriatic coastline south of the Po River was originally part of its delta and alluvial plain. The province of Ravenna, bounded to the north by the Comacchio Valleys and to the south by the city of Cervia, is characterized by a high population, about 350,000 inhabitants whose density more than triples during the summer. In this area, many unpermitted and poorly-constructed wells have been drilled by bathing establishments and farms, resulting in environmental damage [35]. Anthropogenic activities have altered the original ecosystem and now the once sandy coastline is characterized by river and canal mouths, lagoons, pine forests (e.g., San Vitale and Classe), heavily urbanized areas (e.g., the cities of Marina Romea and Cervia), industrial facilities, and reclaimed agricultural lands [36]. The entire coast is threatened by SI in the phreatic aquifer and seawater encroachment inland along the rivers (e.g., Reno, Lamone, Fiumi Uniti, and Bevano rivers), natural and anthropogenic land subsidence, direct contamination from water bodies open to the sea, destruction of coastal dunes with consequent reduction of their barrier effect, insufficient aquifer recharge and sea level rise. In particular, over the last few decades the land surface has dropped to 4 m below mean sea level in some areas [36]. This in turn has modified the rivers and regular groundwater flow regimes. These inland areas require protection from river flooding and marine intrusion with dikes and levees [36]. A partially artificial drainage network was built in the coastal area to lower the phreatic level and keep the agricultural land dry. Unfortunately, this management process is complex and the presence of these modified drainage networks has not been able to mitigate SI and keep the pine forests healthy [36].
The coastal phreatic aquifer of Ravenna, the focus of this study, is primarily located within the littoral sands, and locally in the shallow marine wedge deposits. The groundwater basin is unconfined in the east, but 3–4 km from the coast it becomes overlain and confined by the most recent alluvial fine-grained continental deposits. The basin thickness varies from a maximum of 30 m in the area of San Vitale Forest to a minimum of about 15 m in the vicinity of Cervia [36]. From east to west, the major sedimentary units consist of: (i) a wedge of fine-grained (fine sand to silty clays) sediments representative of a shallow marine environment; (ii) littoral sands representative of the foreshore, deep-shore, and the sand dune environments adjacent and inland of the beach. The westernmost portion of the study area is characterized by the presence of clay back-shore lagoon deposits [37,38]. Some continental-type alluvial deposits (clay and silt) overlay the littoral sands and lagoon deposits in the west. Based on geologic data from slug tests and grain size analyses [36,39], the hydraulic conductivity of the aquifer is relatively high near the San Vitale Forest (1.1–24.8 m/day) and Cervia (11–21 m/day), and is generally lower in the Classe Forest area (0.2–7.7 m/day). Along the entire coast, the hydraulic head measured in wells was almost always above mean sea level, with values ranging from 0.5 to 4 m in winter and from −0.5 to 3.5 m in summer [36]. It was observed that water salinity (groundwater at the water table) varied seasonally. For instance, salinity values were higher (22–44 g/L) during the summer periods (e.g., near Comacchio Valleys) compared to winter months where values generally ranged between 3 and 22 g/L. Moreover, encroachment of sea water along rivers and canals, combined with subsidence and drainage from agricultural lands, contributes to enhance the salinization process [36].
Along the coast of Ravenna, pine forests are situated mostly on sandy dunes and were planted in the last century by farmers to protect their land from sea-salt spray. Plant ecologists have reported that the distribution of plant species in the coastal area varies depending on elevation, soil salinity, water salinity, and the duration of various stress periods by which the vegetation is affected [40]. Based on soil and water salinity, plants along the coast can be divided into categories including very tolerant to salt (halophyte plants), tolerant/fairly, and tolerant/not tolerant to water/soil/sea-spray salinity [41]. Increases in salinity within a coastal habitat will have direct and indirect effects on vegetation [15]. In the study area of interest, new sand is added to the beaches every few years from dredging the offshore Adriatic Sea in order to counteract the continuous erosion along the coast. The pine forests (i.e., 50–150 m from the coast) and the adjacent farmlands are drained in winter to keep the groundwater level low. However, this increases the extent of SI in the phreatic aquifer, which is further enhanced by the transpiration of the pine trees [14]. Natural pine seedling germination does not occur and new small pine trees are planted each year to replace dead plants. The most dramatic decrease in the diversity of plant species occurs where water salinity exceeds the 3 g/L threshold, above which most trees species become stressed, with the exception of a few, i.e., Pinus pinaster (William Aiton, 1789) and Pinus pinea (Carl von Linné, 1753) [15].

3. Materials and Methods

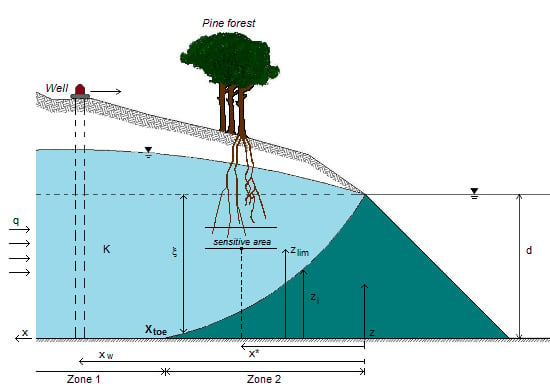
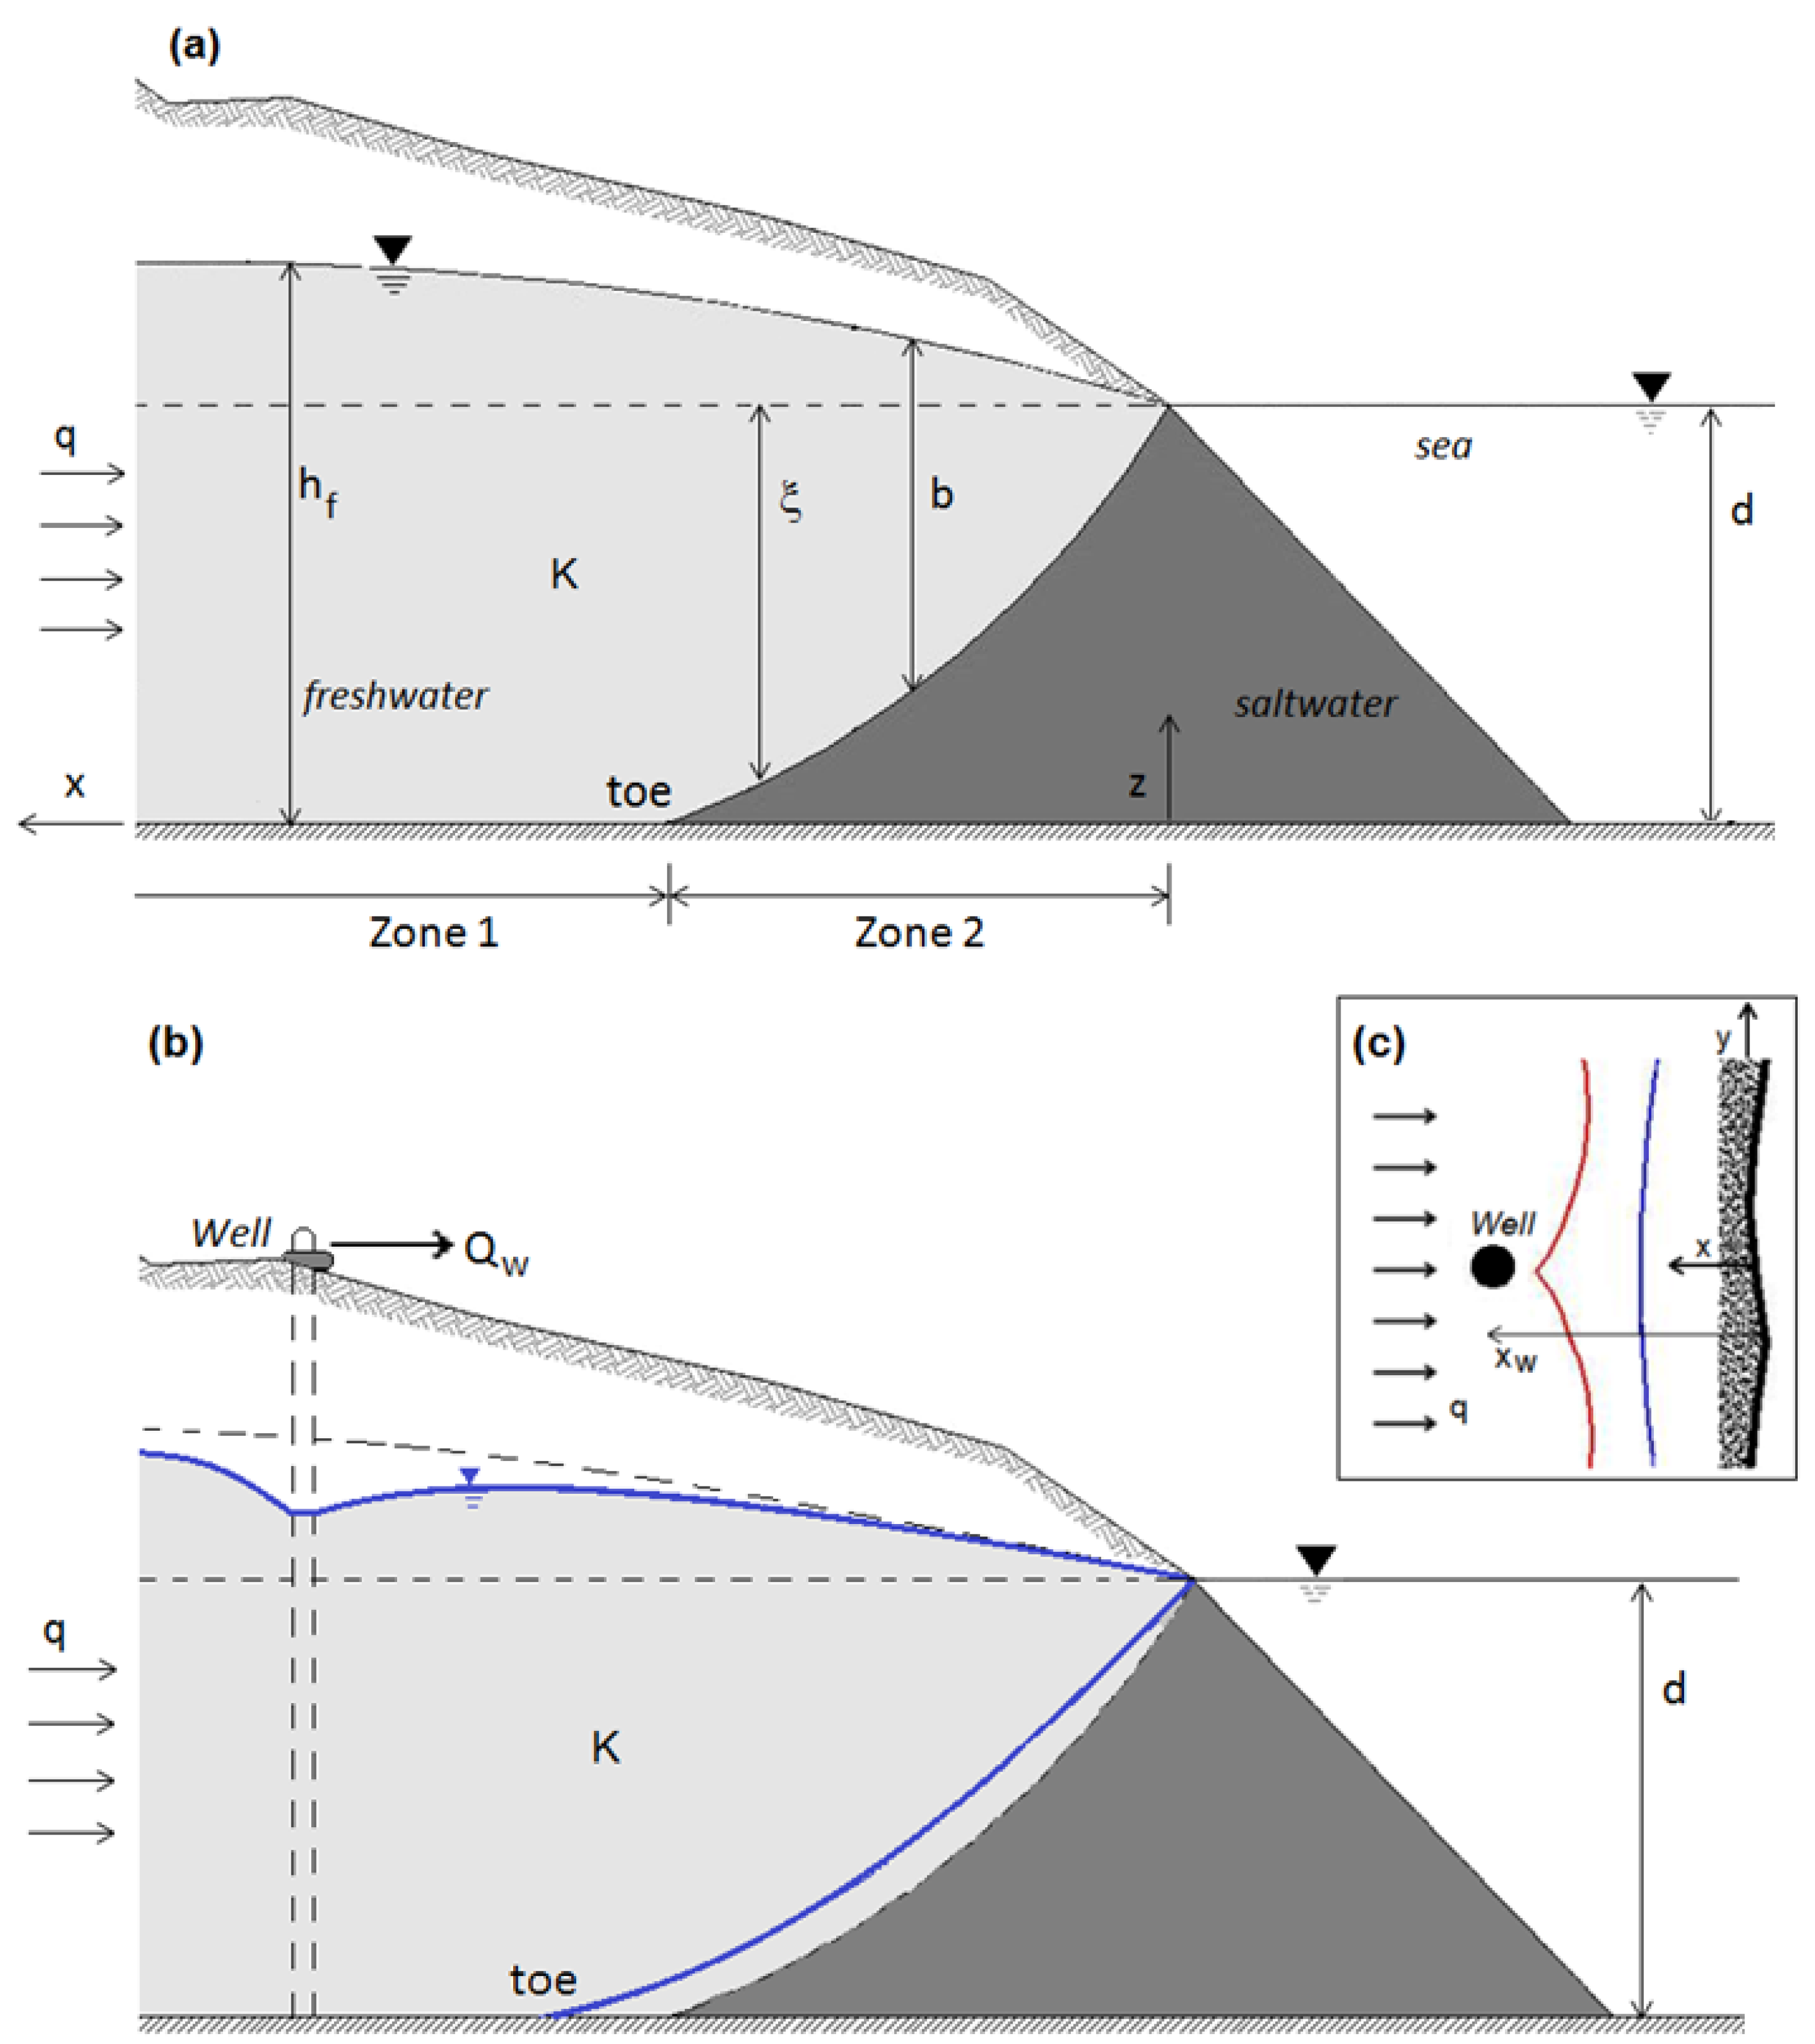
3.1. Theoretical Framework

In this study, the theory developed by Strack [23] was used to predict the extension of SI into a coastal phreatic aquifer for the case of steady state flow under the Dupuit-Forchheimer assumption [20,22,24,25]. The sharp interface approximation and the homogeneity assumption allow for the derivation of a closed form solution that describes the main processes involved in SI. Consider a semi-infinite domain bounded by a straight coastline (Figure 2a), and divided into two zones, with freshwater in zone 1 and freshwater and saltwater in zone 2. The aquifer thickness b [L] is:
b = hf     zone 1
b = hfd + ξ zone 2
where d [L] is the mean sea level (MSL) with respect to the bottom of the aquifer, ξ [L] the interface depth with respect to the MSL, hf [L] the hydraulic head and q [L2T−1] the uniform discharge to the sea per unit width of aquifer [42]. In zone 2, the Ghyben-Herzberg assumption hfd = ((γsγf)/γf) ξ is imposed to express the relationship between hydraulic head and interface depth (with respect to MSL).
Following the approach of Strack for an unconfined aquifer [23], the potential ϕ [L2] is defined as:
Water 05 01830 i001
Water 05 01830 i002
these functions and their first derivatives are continuous across the multiple-zone aquifer and satisfy the Laplace equation, Water 05 01830 i016, in the x-z plane. At the interface, substituting in Equations (3) or (4) the condition ξ = d, hence hf = (γs/γf) ξ, the potential is obtained as:
Water 05 01830 i003
Now consider then the presence of a pumping/recharging well with discharge Qw [L3T−1], located at a distance xw from the coast (Figure 2b,c). The solution of the problem, in terms of potential, can be found by resorting to the superposition principle and the method of images as [23]:
Water 05 01830 i004
where K [LT−1] represents the hydraulic conductivity of the aquifer. The location of the leading edge, or “toe”, of the saltwater wedge can be computed from Equations (5) and (6) as:
Water 05 01830 i005
Finally, combining expressions (3) and (4) with (6) allows for the determination of the elevation of the hydraulic head above the MSL:
Water 05 01830 i006
Water 05 01830 i007
utilizing the Ghyben-Herzberg assumption, the interface depth is ξ = (γf/(γs − γf ))(hfd) for zone 2, and ξ = d for zone 1, whereby no saltwater is present.
For multiple pumping wells, Equation (6) can be extended to:
Water 05 01830 i008
where (xi, yi) are the coordinates and Qi is the pumping rate of well i, which can be taken as positive or negative to represent pumping and recharging mode, respectively. With these assumptions, Equations (8) and (9) become for zone 1 and 2, respectively:
Water 05 01830 i009
Water 05 01830 i010
Figure 2 represents the effects on the freshwater-saltwater interface due to the presence of one or more wells. While under natural undisturbed conditions the interface maintains a state of equilibrium (Figure 2a), water extraction lowers the water table with respect to its initial position (Figure 2b, blue solid line) allowing the interface to move inland. As the pumping rate increases, the interface advances towards the well until an unstable critical situation is reached (Figure 2c, red solid line). Any further increase in the pumping rate causes a jump of the toe position landward of the well, which thereby becomes contaminated by saltwater.
Figure 2. (a) Reference unconfined aquifer with saltwater wedge; (b) Effect of a pumping well on saltwater wedge; (c) SI fronts near the pumping well (blue and red lines), in the x-y plane, for two different values of pumping rate.
Water 05 01830 g002

3.2. Problem Formulation

In order to evaluate the effects of SI on coastal vegetation due to both natural and anthropogenic causes, a simplified conceptualization representing specific areas of the Emilia-Romagna coast was configured (Figure 3). An ‘environmentally sensitive area’ representing a pinewood forest (an infinitely long strip) was located at a minimum distance x* = 50 m from the coastline. The lower limit of the plants capture zone (the volume of soil affected by water uptake by roots) is defined such that the sensitive zone surrounding the plant is not impacted by the intruding saltwater and any adverse effects on the plants are prevented. The extension of this zone depends on both the length of roots and the width of the transpiration zone; its minimum elevation from the bottom of the aquifer is set to zlim = 12 m in the present case. A well field established for agricultural purposes was located inland of the pinewood, as depicted in Figure 3. The well field was comprised of three wells, each located in the middle of an area of dimensions b·e, distant a from the coast; between every pumping area there are non-overlapping zones of width equal to c, to reduce mutual interactions among the wells. The total discharge Q was equally divided among the wells. Values assumed for the design parameters of the well field are summarized in Table 1.
Following a probabilistic approach, we model the hydrogeological parameters K, q and d, as independent random variables. Based on previous studies [42], all parameters were assumed to follow a normal distribution, characterized by the average values and the coefficients of variation reported in Table 2. Note that the coefficient of variation of d was selected according to the prediction of annual sea level rise [12] and subsidence for the area of interest.
Once the uncertain parameters are defined, the extension xtoe of SI in the x-y plane is evaluated through Equations (5) and (10). The computed values of xtoe are affected by the uncertainty propagated from the input parameters through the selected model equations. Since the domain considered is symmetric, the maximum value of xtoe occurs along the middle, at y = ycrit. The extent of intrusion can be determined in the x-z plane corresponding to ycrit, by computing the elevation of the interface zi with respect to the bottom of the aquifer via Equation (12). This is also a random variable. The risk for the vegetation, here considered as the probability that the saltwater interface reaches the sensitive zone below the plants roots, is then derived following two steps. First, the probability that plant roots occur in the zone impacted by SI (i.e., zone 2 in Figure 4) is computed as:
Water 05 01830 i011
where Water 05 01830 i017 
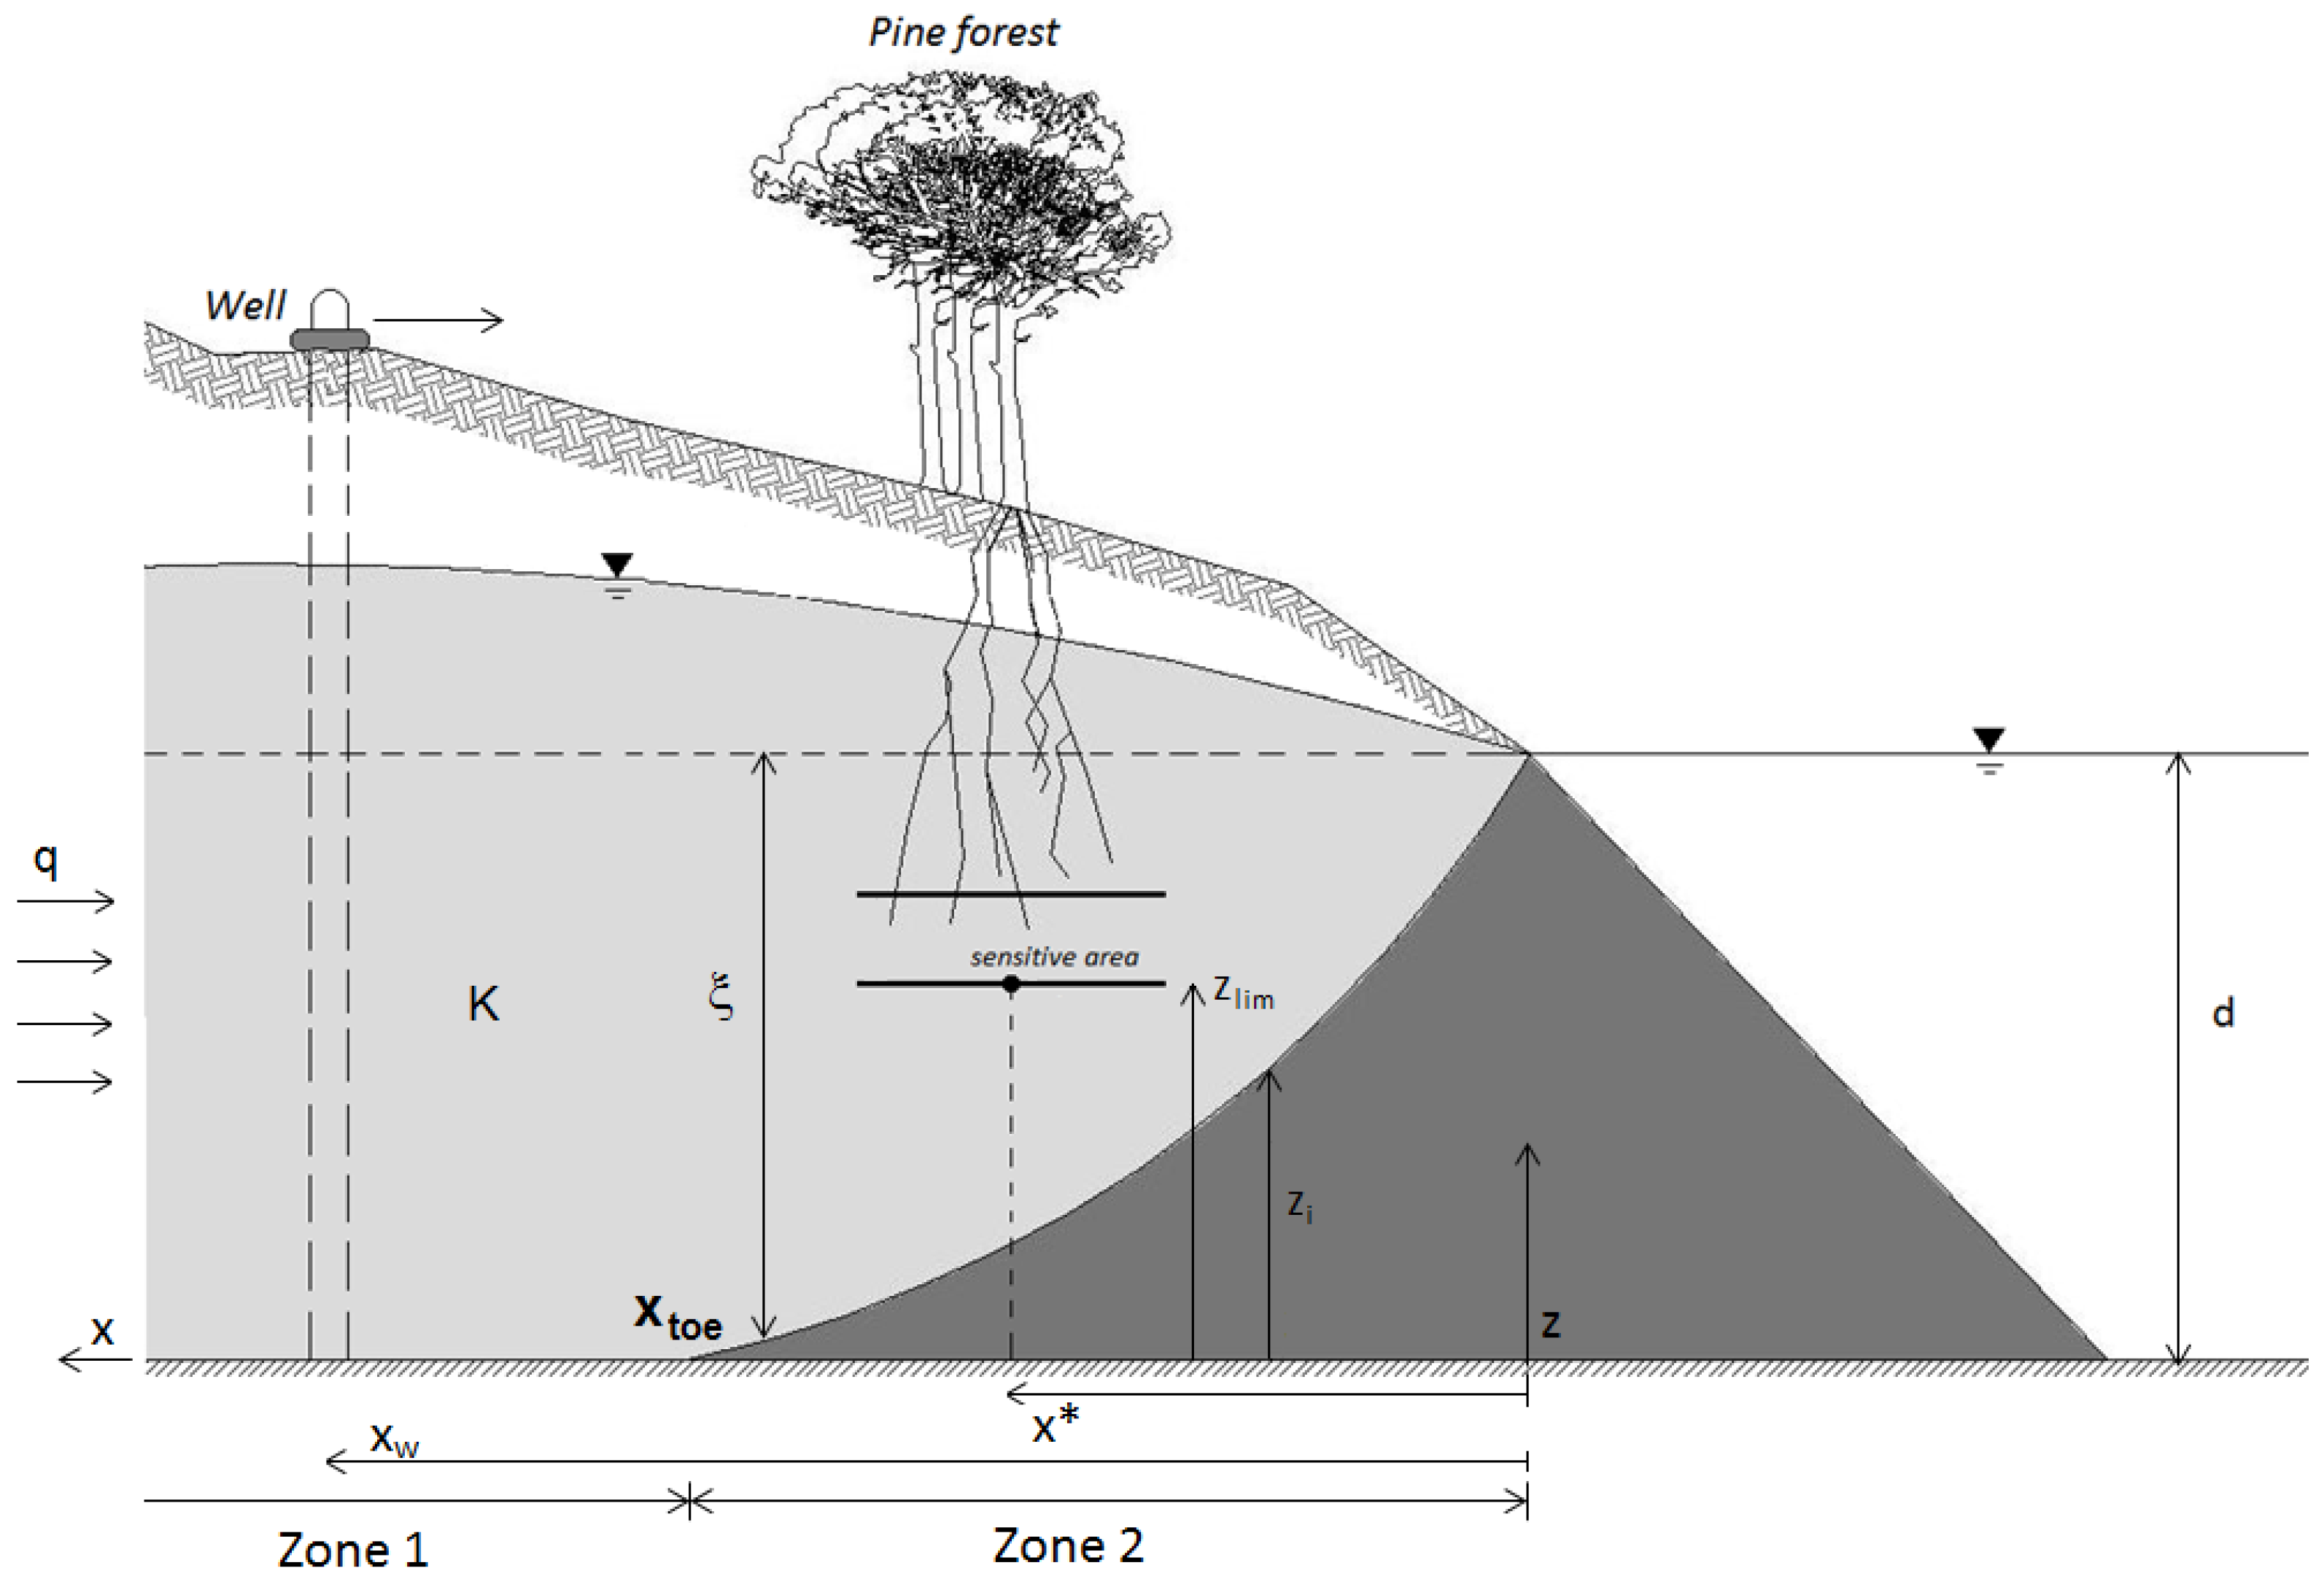
is the cumulative distribution function of the random variables xtoe. According to the data results P1 ≈ 1, i.e., the vegetation falls into zone 2 almost certainly within the selected case study. Secondly, the probability that the saltwater interface reaches the sensitive zone below the plants roots is evaluated in correspondence of the maximum intrusion, i.e., y = ycrit. This probability is conditional on the previous one as follows:
Water 05 01830 i012
In this selected case study, as P1 ≈ 1, Equation (14) reduces to Water 05 01830 i018, where Water 05 01830 i019 is the cumulative distribution function of the random variable zi. Consequently, in the following section the simplified formulation for the computation of the risk, i.e., R = P2, was considered.
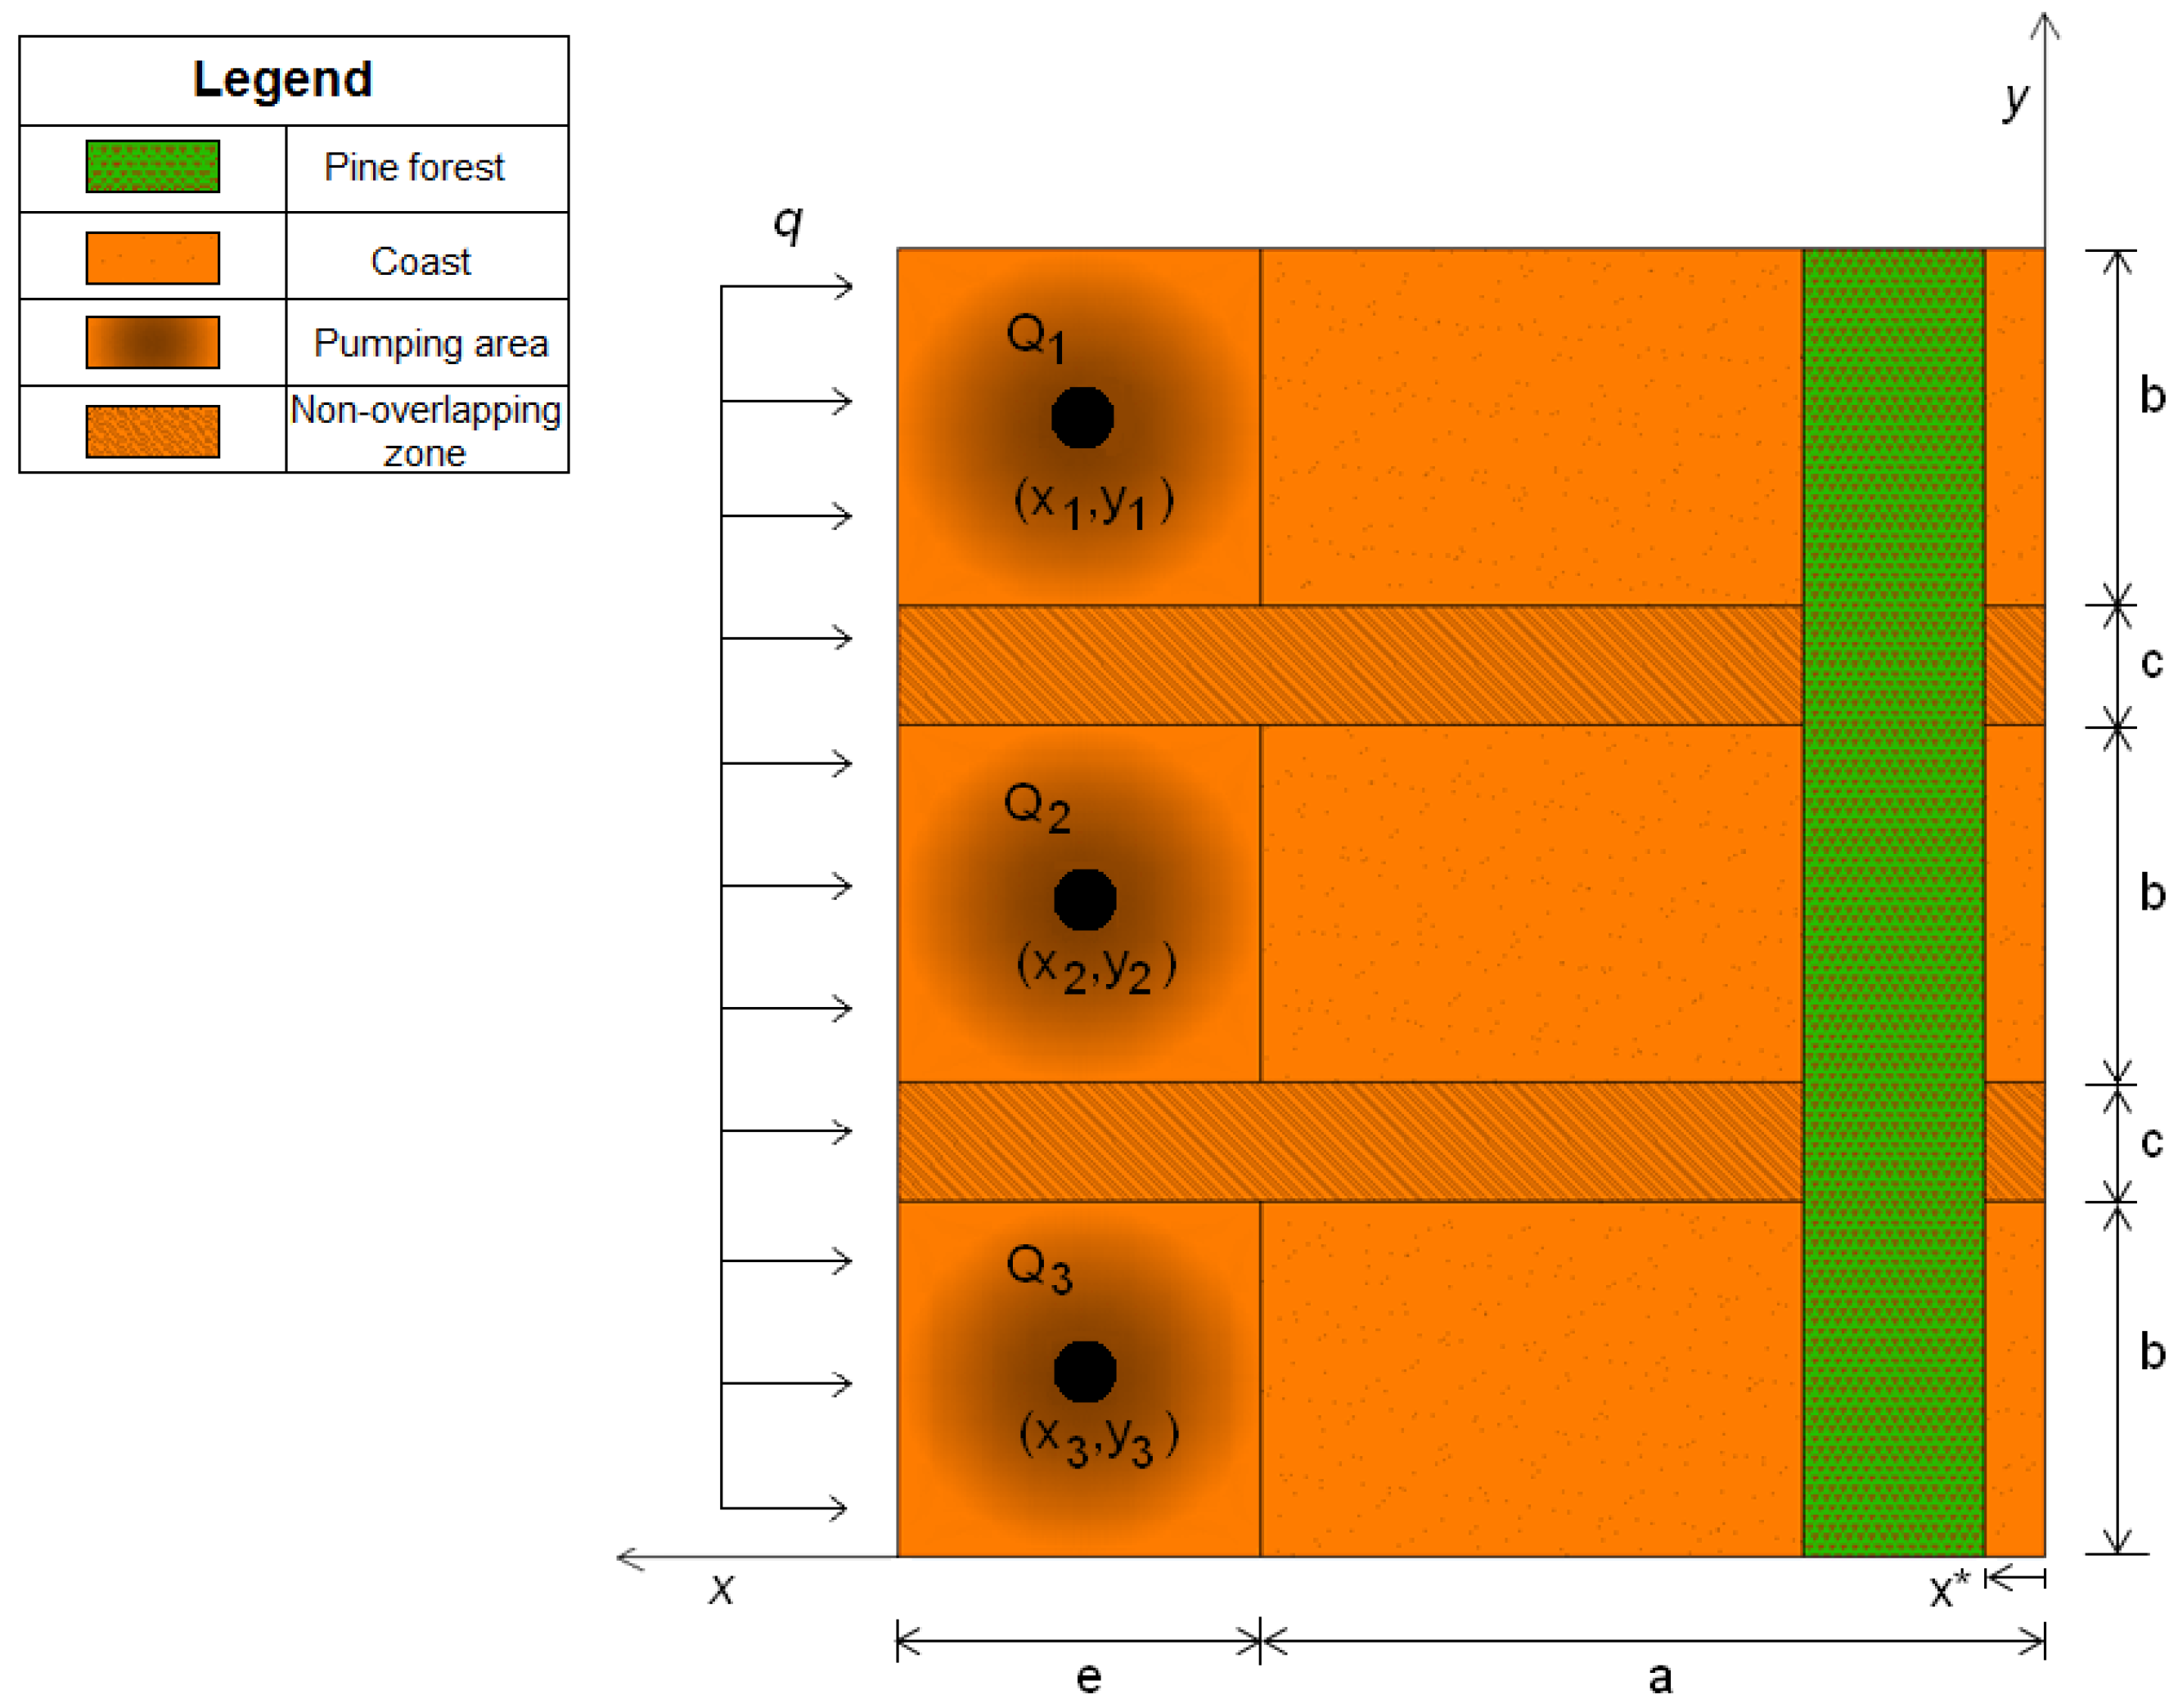
The proposed methodology is suitable to predict the risk to which coastal vegetation is subjected, considering the uncertainty of the parameters involved. For this purpose, the evaluation of the mean position of the toe (considering the schematic scenario described above) and its variance, applying global sensitivity analysis [32], must be conducted in order to evaluate the influence (sensitivity) of each uncertain parameter. Subsequently, the risk affecting the vegetation is computed for different scenarios defined through the parameters that characterize the well field and modifying their values with respect to those reported in Table 1. In particular, variations in (i) the overall pumping discharge, Q; (ii) the distance of wells from the coast, a; and (iii) the width of non-overlapping zones, c, were considered.
Table 1. Design parameters of the well field represented in Figure 3.
ParametersValues
a (m)650
b (m)300
c (m)100
e (m)300
x1 (m)800
y1 (m)950
x2 (m)800
y2 (m)550
x3 (m)800
y3 (m)150
Q1, Q2 Q3 (m3/day)200
Q (m3/day)600
Figure 3. Well field and location of pine forest in x-y plane.
Water 05 01830 g003
Table 2. Main characteristic parameters of the model.
ParametersDistribution
K (m/day)N (μK = 40; cvK = 0.1)
q (m2/day)N (μq = 0.9; cvq = 0.1)
d (m)N (μd = 20; cvd = 0.001)
Figure 4. Simplified conceptualization of the problem, in x-z plane, for y = ycrit.
Water 05 01830 g004

3.3. Model Reduction Approach for Risk Analysis

In order to perform the stochastic analysis described above, time intensive simulation methods based on the Monte Carlo (MC) approach are typically applied. For this analysis, a different, more efficient strategy was implemented that relied on model reduction via Polynomial Chaos Expansion (PCE) [43]. The basic idea of model reduction methods consists in modifying the form of the selected model without introducing any simplifying assumptions in the description of the physical processes involved. For the PCE approach, a surrogate model was derived in a simple polynomial form depending only on the uncertain input parameters. The computation of the PCE approximation requires a very limited number of MC simulations performed on the original model.
Let the model response of interest, y, belong to the Hilbert space of second-order random variables. Under this assumption, y can be approximated through the PCE technique [43,44] as follows:
Water 05 01830 i013
The resulting formulation constitutes a metamodel, Water 05 01830 i020, of y. This metamodel is a simple polynomial function which is expressed in terms of a set of independent random variables, collected in vector ζ. Here, Water 05 01830 i021, is the number of terms of the expansion, and q is the maximum degree considered; aj represent unknown deterministic coefficients, while Ψj denote the suitable multivariate polynomial basis in the Hilbert space containing the response.
A non-intrusive regression-based approach can be employed to calculate the coefficients aj [32]. As mentioned above, this method requires a number N of simulations performed on the original model proportional to P.
Once the PCE is available, simple analytical post-processing allows derivation of (i) the first two moments of the approximated response, and (ii) the global sensitivity indices of Sobol, that represent dimensionless ratios among the partial variance of the response, due to a generic subset of uncertain model parameters, and the total variance of the response [32]. Specifically the mean of the model response coincides with the coefficient of the zero-order term, a0 in the Equation (15), and the total variance of the response and the generic Sobol index are given, respectively, by:
Water 05 01830 i014
Water 05 01830 i015
for the computation of Water 05 01830 i022 see e.g., [45].
Furthermore, the PCE metamodel represents a suitable basis to perform Monte Carlo simulations, allowing for a more efficient means to perform risk analysis or to solve inverse problems with reduced computational time/cost. This methodology has demonstrated excellent promise for use in many other applications related to flow and transport processes in porous media (e.g., [46,47]).

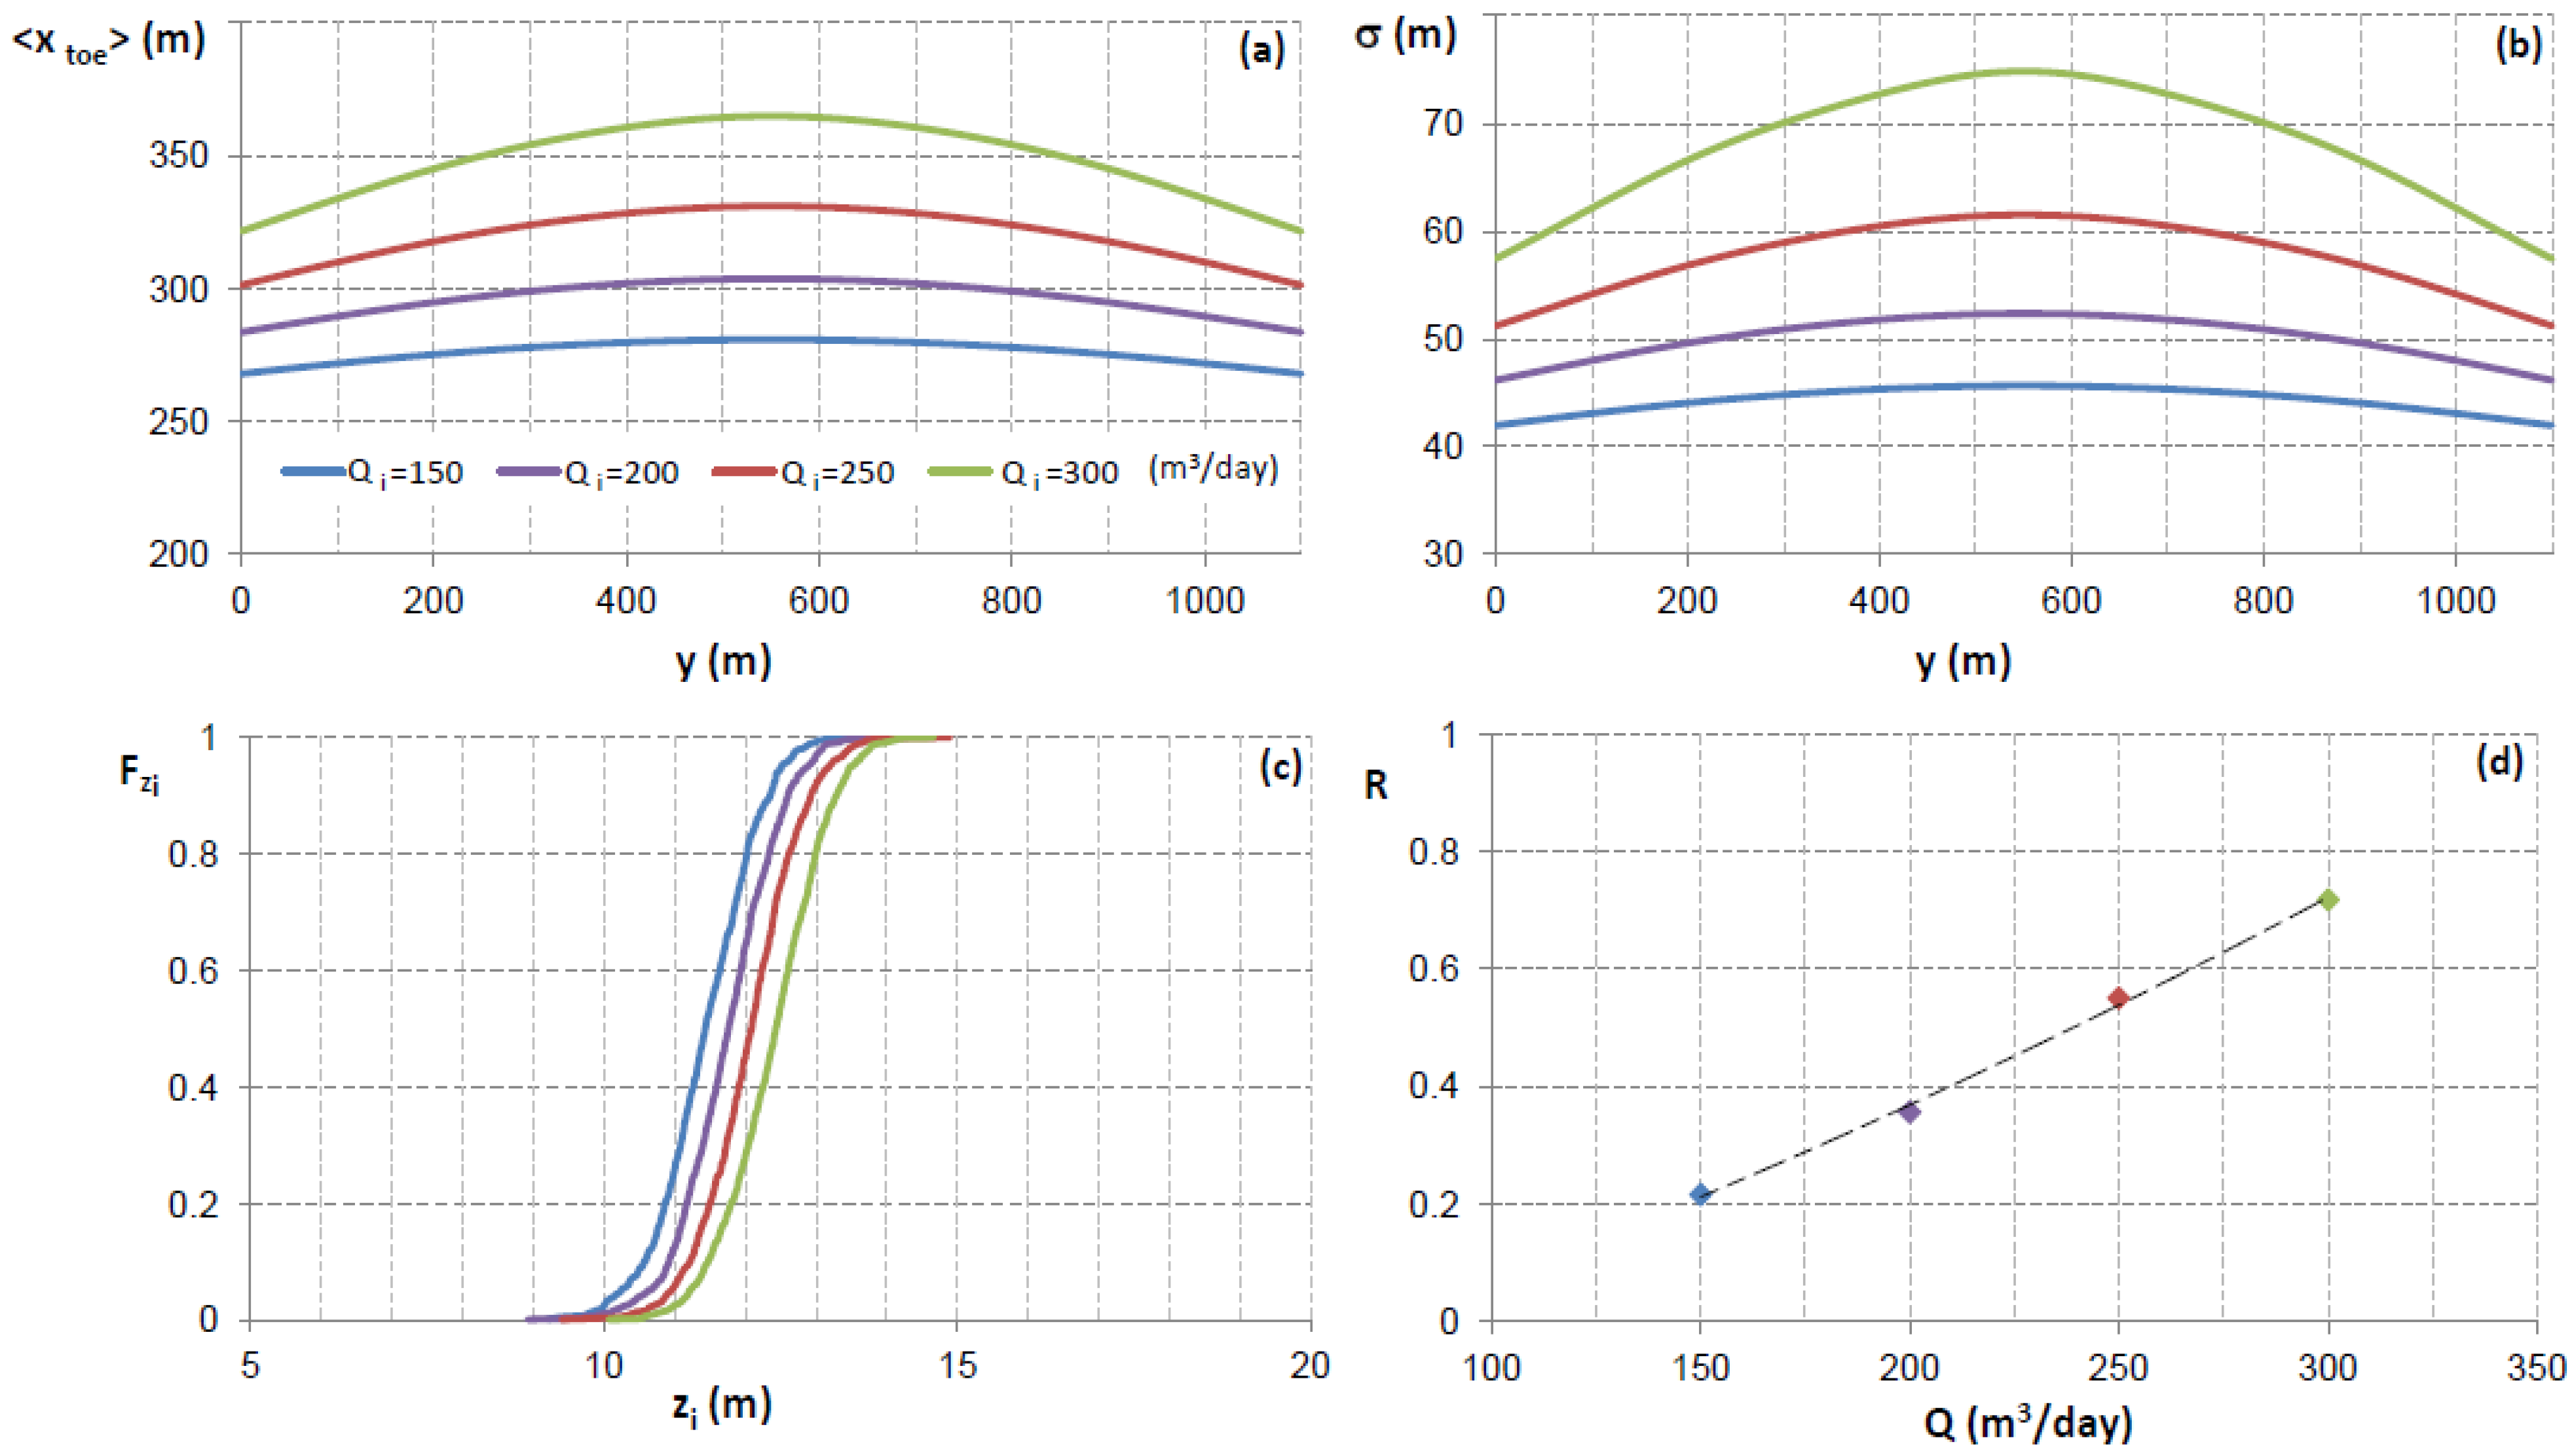
4. Results and Discussion

Applying the methodology outlined in Section 3.2, the extension of SI was first evaluated by using the values (parameters) collected in Table 1 to represent the well field. The uncertainty in the hydrogeological parameters was modeled using probability distributions as reported in Table 2. Under this framework, the first two moments associated with xtoe and the global sensitivity indices were evaluated as described in Section 3.3.
The mean value of xtoe as a function of y is depicted in Figure 5a, showing the intervals of width ±σ and ±2σ surrounding it. The maximum value for the mean of xtoe (i.e., the leading edge of the intrusion) is reached at ycrit = 3b/2 + c, since the domain is symmetric. The maximum intrusion extent was equal to 303.6 m for the selected case study; this value is consistent with those typically observed for the area of Ravenna, and with results reported in numerical studies of the effects of subsidence on SI [35]. The uncertainty in the hydrogeological parameters resulted in a standard deviation of xtoe with a maximum of ~50 m (i.e., more than the 15% of the correspondent mean value).
The standard deviation σ of xtoe is illustrated in Figure 5b as a function of y, showing the individual contributions due to each random parameter value (K, q and d) in order to investigate how these different values influence SI. The results indicate that the primary influence on SI was due to the variability in q, whereby, in contrast, the mean sea level, d, was relatively inconsequential. However, the impact of d was shown to produce significant effects on SI in a long-term period of time due to climatic changes and the combined increase in natural/anthropogenic subsidence. As expected, the effect of domain heterogeneity, exemplified through the variability of K, was also significant. These results highlight the importance of proper site characterization in order to obtain accurate predictions for SI. Other studies (e.g., [22]) have relied on the theory presented by Strack [23], whereby a sensitivity-based approach was adopted in order to define vulnerability indicators for SI. However, these global sensitivity analysis models do not account for the simultaneous variability of all the parameters of interest when evaluating effects on SI.
Figure 5. (a) Mean interface location xtoe (solid line) ±σ and ±2σ (dashed line), versus y; (b) Standard deviation σ of xtoe, and partial contribution of each individual parameter, i.e., σq, σK and σd.
Water 05 01830 g005
This study also evaluated he influence on SI on the risk for vegetation health due to variations of the deterministic parameters Q (overall pumping discharge), a (distance of the well field from the coast), and c (width of non-overlapping zones).
The mean and the standard deviation of xtoe versus y for different values of total pumping rate Q are depicted in Figure 6a and Figure 6b respectively. In particular, it is shown that the mean of xtoe reaches its maximum at y = ycrit, ranging between 280 and 365 m. This revealed a relatively high degree of variability for different values of Qi; specifically, the largest extent of SI was reached for the maximum pumping rate considered (i.e., Qi = Q/3 = 300 m3/day) (Figure 6a). The standard deviation σ of xtoe followed the same trend (Figure 6b), whereby values ranged between 45.7 and 74.8 m, primarily as a function of the variability of domain properties, q and K, as described above.
A similar analysis is illustrated in Figure 7a,b, with the exception that different values of a were considered to evaluate effects on SI. As previously noted, the results of this study revealed that the distance of the well field from the coast, within the range considered, seemed to be inconsequential, as the two moments of xtoe did not exhibit significant changes in the extent of SI. In particular, the maximum value of the mean of xtoe ranged between 294 and 308 m (i.e., trend increasing with a) (Figure 7a), and the associated standard deviation varied between 49.7 and 54 m (Figure 7b).
Finally, the influence of c (the width of the non-overlapping zones among the wells) on the first two moments of xtoe is depicted in Figure 8a,b. By varying the width of the non-overlapping zones, the size of the entire domain is modified. For example, maximum values of mean xtoe and standard deviations were obtained for smaller values of c, whereby ycrit = 3b/2 + c tended to decrease. For c = 50 m, ycrit = 500 m, with a mean value of xtoe equal to 307 m and an associated standard deviation of 53.6 m; for a value of c = 200 m, ycrit becomes 660 m, whereby the mean value of xtoe was reduced to 297 m with a standard deviation of 50.2 m.
For this analysis the design parameters of the well field demonstrated that SI was extremely sensitive to the pumping discharge Q, in contrast to the other parameters considered (i.e., a and c) which seem to have only a minimal influence on the optimization of groundwater extraction and effect on SI.
Figure 6. (a) Mean value of xtoe; (b) Standard deviation σ of xtoe; (c) Cumulative distribution function Water 05 01830 i019 of the surface elevation zi computed in Water 05 01830 i023(Figure 4); and (d) Computed risk [see Equation (14)] resulting from different values of single pumping discharge Qi.
Water 05 01830 g006
Figure 7. (ad) As Figure 6 but for different values of distance from the coast a.
Water 05 01830 g007
Figure 8. (ad) As Figure 6 but for different values of width of non-overlapping zones c.
Water 05 01830 g008
In order to complete the analysis, the effects of the variability in the parameters characterizing the well field on the risk of contamination were evaluated. The results obtained increasing Qi are presented in Figure 6c. It can be observed that the cumulative distribution functions of the interface elevation computed in Water 05 01830 i023, Water 05 01830 i024, tend to decrease with higher values of Qi and consequently the risk increases quasi-linearly (Figure 6d). When considering the value of Water 05 01830 i023 = 12 m as a fixed variable herein, Water 05 01830 i024 ranged from 0.78 to 0.28, as Qi varied between 150 and 300 m3/day. In Figure 7c, obtained for different values of a, a different trend is revealed, whereby Water 05 01830 i024 increases and risk decreases, as expected for higher values of a (Figure 7d). In this case, Water 05 01830 i024 increases from 0.60 to 0.71 while varying a between 600–750 m. Finally, in the last simulation whereby different values of c were utilized, a similar trend to the one described above was observed, albeit less pronounced (Figure 8c,d). For example, a value of Water 05 01830 i023 = 12 m, produced a narrow range of values of Water 05 01830 i024 from 0.61 to 0.67 when varying c between 50 and 200 m.
Overall, when comparing all of the different simulation results obtained for the risk of SI (Figure 6d, Figure 7d, Figure 8d), the increase in Q seems to produce the most detrimental effects in terms of extent of SI and risk to the preservation of vegetation health in coastal areas. For example, with values of zlim = 12 m, the results show that risk ranged between 0.2 and 0.7 when varying parameter Q (Figure 6d), while values of risk lower than 0.4 resulted when parameters a and c were varied (Figure 7d and Figure 8d).
It should be noted that the parameters of the well field can also be modeled as random variables and investigated via a global sensitivity analysis to appropriately understand their influence on the risk of contamination. This could be particularly useful for problems that require optimization solutions [e.g., 20]. Although the analyses herein primarily focused on a risk assessment for vegetation in coastal areas influenced by SI, this study also revealed that both the pumping rate and domain heterogeneity (i.e., permeability distribution) significantly influenced the extent of SI, consistent with findings reported by other studies [20,48].

5. Conclusions

This study presents a computationally efficient technique to evaluate risk to ecosystems (i.e., vegetation health) along coastal regions that are impacted by saltwater intrusion processes. The methods used were applied to the coastline of Emilia-Romagna, Italy, a region that has been and continues to be impacted by saltwater intrusion. A stochastic approach to the problem was adopted to represent the random nature of the hydrogeological parameters. Computational efficiency was further increased by incorporating model reduction techniques via Polynomial Chaos Expansion theory for modeling saltwater intrusion effects and associated risk analyses.
A simplified analytical formulation was adopted to allow for the evaluation of the probability that the vegetation capture zone overlaps with the intruding saltwater wedge. Anthropogenic influence on the risk to vegetation due to saltwater intrusion was modeled through the presence of a well field, specifically accounted for through adjustment of (i) the pumping discharge; (ii) the wells distance from the coast; and (iii) the mutual distance between wells. For the simplified scenario representative of the Ravenna coast, the comprehensive results of the modeling analyses revealed the parameters most responsible for influencing the extent of saltwater intrusion. For example, increases in the overall pumping discharge of the well field produced the most significant increase in the probability that saltwater intrusion reaches the vegetation capture zone.
The computational methodology used herein can be applied to more complex systems whereby a closed-form solution is not available and would require more time-consuming numerical approaches (i.e., to resolve the shape and size of the intruding saltwater wedge). In such cases, the model reduction technique adopted for these analyses allowed for both excellent representation of the physical system and an increase of computational efficiency. Moreover, the current approach can assist in the development of appropriate management strategies for coastal aquifers. These techniques allow the parameters describing the anthropogenic influences to be considered as random variables, which provide an improved means of discriminating the parameters most responsible for saltwater intrusion and for solving optimization problems that require a specific set of environmental constraints.

Acknowledgments

Marco Marcaccio and Andrea Chahoud of ARPA Emilia-Romagna are gratefully acknowledged for helpful discussions.

Conflicts of Interest

The authors declare no conflict of interest.

References

  1. Cassardo, C.; Jones, J.A.J. Managing water in a changing world. Water 2011, 3, 618–628. [Google Scholar] [CrossRef]
  2. Gain, A.K.; Giupponi, C.; Renaud, F.G. Climate change adaptation and vulnerability assessment of water resources systems in developing countries: A generalized framework and a feasibility study in Bangladesh. Water 2012, 4, 345–366. [Google Scholar] [CrossRef] [Green Version]
  3. Werner, A.D.; Bakker, M.; Post, V.E.A.; Vandenbohede, A.; Lu, C.; Ataie-Ashtiani, B.; Simmons, C.T.; Barry, D.A. Seawater intrusion processes, investigation and management: Recent advances and future challenges. Adv. Water Resour. 2013, 51, 3–26. [Google Scholar] [CrossRef]
  4. Bolster, D.T.; Tartakovsky, D.M.; Dentz, M. Analytical models of contaminant transport in coastal aquifers. Adv. Water Resour. 2007, 30, 1962–1972. [Google Scholar] [CrossRef]
  5. Edwards, B.D.; Evans, K.R. Saltwater intrusion in Los Angeles area coastal aquifers—The marine connection; USGS Fact Sheet 030–02. Available online: http://pubs.usgs.gov/fs/2002/fs030-02/ (accessed on 6 June 2013).
  6. Bray, B.; Tsai, F.T.C.; Sim, Y.; Yeh, W.W.G. Model development and calibration of a saltwater intrusion model in southern California. J. Am. Water Resour. Assoc. 2007, 43, 1329–1343. [Google Scholar] [CrossRef]
  7. Capaccioni, B.; Didero, M.; Paletta, C.; Didero, L. Saline intrusion and refreshening in a multilayer coastal aquifer in the Catania Plain (Sicily, southern Italy): Dynamics of degradation processes according to the hydrochemical characteristics of groundwater. J. Hydrol. 2005, 307, 1–16. [Google Scholar] [CrossRef]
  8. De Luca, A.; Preziosi, E.; Giuliano, G.; Mastroianni, D.; Falconi, F. First evaluation of the saltwater intrusion in the Tiber delta area (Rome, central Italy). In Proceedings of 18th Salt Water Intrusion Meeting, Cartagena, Spain, 31 May–3 June 2004; p. 34.
  9. Carbognin, L.; Tosi, L.; Teatini, P. Analysis of actual land subsidence in Venice and its hinterland (Italy). In Land Subsidence; Barends, F.B.J., Brouwer, F.J.J., Schröder, F.H., Eds.; Balkema: Rotterdam, The Netherlands, 1995; pp. 129–137. [Google Scholar]
  10. Bau, D.; Gambolati, G.; Teatini, P. Residual land settlement near abandoned gas fields raises concern over Northern Adriatic coastland. Eos Trans. Am. Geophys. Union 2000, 81, 245–249. [Google Scholar]
  11. Teatini, P.; Ferronato, M.; Gambolati, G.; Gonella, M. Groundwater pumping and land subsidence in the Emilia-Romagna coastland, Italy: Modeling the past occurence and the future trend. Water Resour. Res. 2006, 42, 1–19. [Google Scholar]
  12. Preti, M.; De Nigris, N.; Morelli, M.; Monti, M.; Bonsignore, F.; Aguzzi, M. Stato del litorale emiliano-romagnolo all’anno 2007 e piano decennale di gestione; Agenzia regionale per la prevenzione e l’ambiente (ARPA): Emilia-Romagna, Italy, 2009; p. 270. [Google Scholar]
  13. Manfreda, S.; Caylor, K.K. On the vulnerability of water limited ecosystems to climate change. Water 2013, 5, 819–833. [Google Scholar] [CrossRef]
  14. Antonellini, M.; Mollema, P.N. Impact of groundwater salinity on vegetation species richness in the coastal pine forests and wetlands of Ravenna, Italy. Ecol. Eng. 2010, 36, 1201–1211. [Google Scholar] [CrossRef]
  15. Giambastiani, B.M.S.; Mollema, P.N.; Antonellini, M. Groundwater management in the Northern Adriatic Coast (Ravenna, Italy): New strategies to protect the coastal aquifer from saltwater intrusion. In Groundwater. Modeling, Management, and Contamination; König, L.F., Weiss, J.L., Eds.; Nova Science Publishers: New York, NY, USA, 2009; pp. 203–230. [Google Scholar]
  16. Marconi, V.; Dinelli, E.; Antonellini, M.; Capaccioni, B.; Balugani, E.; Gabbianelli, G. Hydrogeochemical characterization of the phreatic system of the coastal wetland located between Fiumi Uniti and Bevano rivers in the southern Po plain (Northern Italy). In Proceedings of European Geosciences Union General Assembly, Vienna, Austria, 19–24 April 2009; p. 9771.
  17. Henry, H.R. Salt intrusion into fresh-water aquifers. J. Geophys. Res. 1959, 64, 1911–1919. [Google Scholar] [CrossRef]
  18. Servan-Camas, B.; Tsai, F.T.-C. Two-relaxation-time lattice Boltzmann method for the anisotropic dispersive Henry problem. Water Resour. Res. 2010, 46. [Google Scholar] [CrossRef]
  19. Cheng, A.H.-D.; Halhal, D.; Naji, A.; Ouazar, D. Pumping optimization in saltwater-intruded coastal aquifers. Water Resour. Res. 2000, 36, 2155–2165. [Google Scholar] [CrossRef]
  20. Mantoglou, A. Pumping management of coastal aquifers using analytical models of saltwater intrusion. Water Resour. Res. 2003, 39. [Google Scholar] [CrossRef]
  21. Mantoglou, A.; Papantoniou, M. Optimal design of pumping networks in coastal aquifers using sharp interface models. J. Hydrol. 2008, 361, 52–63. [Google Scholar] [CrossRef]
  22. Werner, A.D.; Ward, J.D.; Morgan, L.K.; Simmons, C.T.; Robinson, N.I.; Teubner, M.D. Vulnerability indicators of sea water intrusion. Ground Water 2012, 50, 48–58. [Google Scholar] [CrossRef]
  23. Strack, O.D.L. A single-potential solution for regional interface problems in coastal aquifers. Water Resour. Res. 1976, 12, 1165–1174. [Google Scholar] [CrossRef]
  24. Naji, A.; Cheng, A.H.-D.; Ouazar, D. Analytical stochastic solutions of saltwater/freshwater interface in coastal aquifers. Stoch. Hydrol. Hydraul. 1998, 12, 413–430. [Google Scholar] [CrossRef]
  25. Lu, C.; Chen, Y.; Luo, J. Boundary condition effects on maximum groundwater withdrawal in coastal aquifers. Ground Water 2012, 50, 386–393. [Google Scholar] [CrossRef]
  26. De Barros, F.P.J.; Bolster, D.; Sanchez-Vila, X.; Nowak, W. A divide and conquer approach to cope with uncertainty, human health risk, and decision making in contaminant hydrology. Water Resour. Res. 2011, 47. [Google Scholar] [CrossRef]
  27. Tartakovsky, D.M. Assessment and management of risk in subsurface hydrology: A review and perspective. Adv. Water Resour. 2012, 51, 247–260. [Google Scholar] [CrossRef]
  28. US National Research Council. Review of Recommendations for Probabilistic Seismic Hazard Analysis: Guidance on Uncertainty and Use of Experts; National Academy Press: Washington, DC, USA, 1997; p. 84. [Google Scholar]
  29. European Communities (EC). Common Implementation Strategy for the Water Framework Directive (2000/60/EC); Guidance Document No. 11; Planning Processes, Working Group 2.9.; Office for the Official Publications of the European Communities: Luxembourg, 2003. [Google Scholar]
  30. Tartakovsky, D.M. Probabilistic risk analysis in subsurface hydrology. Geophys. Res. Lett. 2007, 34. [Google Scholar] [CrossRef]
  31. Rubin, Y. Applied Stochastic Hydrogeology, 1st ed.; Oxford University Press: New York, NY, USA, 2003; p. 416. [Google Scholar]
  32. Sudret, B. Global sensitivity analysis using polynomial chaos expansions. Reliab. Eng. Syst. Safety 2008, 93, 964–979. [Google Scholar] [CrossRef]
  33. Villa-Vialaneix, N.; Follador, M.; Ratto, M.; Leip, A. A comparison of eight metamodeling techniques for the simulation of N2O fluxes and N leaching from corn crops. Environ. Model. Softw. 2012, 34, 51–66. [Google Scholar] [CrossRef] [Green Version]
  34. E-R Ambiente Home Page. Available online: http://ambiente.regione.emilia-romagna.it/geologia/cartografia/webgis-banchedati (accessed on 3 October 2013).
  35. Giambastiani, B.M.S.; Antonellini, M.; Oude Essink, G.H.P.; Stuurman, R.J. Saltwater intrusion in the unconfined coastal aquifer of Ravenna (Italy): A numerical model. J. Hydrol. 2007, 340, 91–104. [Google Scholar] [CrossRef]
  36. Antonellini, M.; Mollema, P.; Giambastiani, B.; Bishop, K.; Caruso, L.; Minchio, A.; Pellegrini, L.; Sabia, M.; Ulazzi, E.; Gabbianelli, G. Saltwater intrusion in the coastal aquifer of the southern Po Plain, Italy. Hydrogeol. J. 2008, 16, 1541–1556. [Google Scholar] [CrossRef]
  37. Bondesan, M.; Favero, V.; Viñals, M.J. New evidence on the evolution of the Po-delta coastal plain during the Holocene. Quat. Int. 1995, 29–30, 105–110. [Google Scholar] [CrossRef]
  38. Amorosi, A.; Centineo, M.C.; Dinelli, E.; Lucchini, F.; Tateo, F. Geochemical and mineralogical variations as indicators of provenance changes in late Quaternary deposits of SE Po Plain. Sediment. Geol. 2002, 151, 273–292. [Google Scholar] [CrossRef]
  39. Ulazzi, E.; Antonellini, A.; Gabbianelli, G. Coastal phreatic aquifer characterization of the Cervia Area. In Stratigraphy and Sedimentology of Aquifers; Vallone, R., Ed.; APAT: Parma, Italy, 2007. [Google Scholar]
  40. Maas, E.V. Salt tolerance of plants. In Handbook of Plant Science in Agriculture; CRC Press: Boca Raton, FL, USA, 1984; pp. 57–75. [Google Scholar]
  41. Hutchinson, I. Salinity Tolerances of Plants of Estuarine Wetlands and Associated Uplands; Washington State Department of Ecology Report; Washington State Shorelands and Coastal Zone Management Program, Wetlands Section: Washington, DC, USA, 1991. [Google Scholar]
  42. Cheng, A.H.-D.; Ouazar, D. Analytical solutions. In Seawater Intrusion in Coastal Aquifers—Concepts, Methods and Practices, 1st ed.; Bear, J., Cheng, A.H.-D., Sorek, S., Ouazar, D., Herrera, I., Eds.; Springer: Dordrecht, the Netherlands, 1999; Volume 14, pp. 163–191. [Google Scholar]
  43. Wiener, N. The homogeneous chaos. Am. J. Math. 1938, 60, 897–936. [Google Scholar] [CrossRef]
  44. Ghanem, R.G.; Spanos, P.D. Stochastic Finite Elements: A Spectral Approach; Springer: Berlin, Germany, 1991. [Google Scholar]
  45. Abramowitz, M.; Stegun, I.A. Handbook of Mathematical Functions; Dover Publications: New York, NY, USA, 1970. [Google Scholar]
  46. Ciriello, V.; Di Federico, V.; Riva, M.; Cadini, F.; De Sanctis, J.; Zio, E.; Guadagnini, A. Polynomial chaos expansion for global sensitivity analysis applied to a model of radionuclide migration in a randomly heterogeneous aquifer. Stoch. Environ. Res. Risk Assess. 2013, 27, 945–954. [Google Scholar] [CrossRef] [Green Version]
  47. Ciriello, V.; Di Federico, V. Analysis of a benchmark solution for non-Newtonian radial displacement in porous media. Int. J. Non Linear Mech. 2013, 52, 46–57. [Google Scholar] [CrossRef]
  48. Park, C.H.; Aral, M.M. Multi-objective optimization of pumping rates and well placement in coastal aquifers. J. Hydrol. 2004, 290, 80–99. [Google Scholar] [CrossRef]

