Article

Profitability of Nitrification Inhibitors for Abatement of Nitrate Leaching on a Representative Dairy Farm in the Waikato Region of New Zealand

1
Centre for Environmental Economics and Policy, School of Agricultural and Resource Economics, University of Western Australia, 35 Stirling Highway, Crawley, Western Australia 6009, Australia
2
AgResearch, Ruakura Research Centre, East Street, Private Bag 3123, Hamilton, New Zealand
*
Author to whom correspondence should be addressed.
Water 2011, 3(4), 1031-1049; https://doi.org/10.3390/w3041031
Submission received: 11 August 2011 / Revised: 21 October 2011 / Accepted: 1 November 2011 / Published: 11 November 2011
(This article belongs to the Special Issue Water Policy)

Abstract

:
Direct policies for the management of nonpoint source pollution are difficult to apply given asymmetric information, spatial and temporal variability, and uncertainty. There is increasing awareness that these limitations may be overcome where profitable mitigation practices are broadly adopted by polluters. Nitrification inhibitors (chemicals applied to paddocks that retard the nitrification process in soils) are a rare example of a mitigation practice that reduces pollutant loads and potentially increases farm profit through promoting pasture production. This study investigates their capacity to achieve both goals to inform policy makers and producers of their potential for simultaneously improving farm profit and water quality. With an assumed 10 percent increase in pasture production in response to nitrification inhibitor application, nitrification inhibitors are a profitable innovation because greater pasture production supports higher stocking rates. Nonetheless, their overall impact on farm profit is low, even when the cost of inhibitors or their impact on subsequent pasture production is substantially altered. However, inhibitors are found to be a critical mitigation practice for farmers posed with decreasing leaching loads to satisfy regulatory requirements. These findings suggest that, despite their shortcomings for nonpoint pollution regulation, direct policies appear to be the only way to motivate producers to account for their impact on environmental values given the current lack of profitable mitigations.

1. Introduction

Nitrate leaching from intensive agricultural production is a key pollutant of waterways and can impair anthropogenic use through promoting eutrophication and endangering human health [1]. Water bodies throughout Europe are at significant risk of ongoing pollution because of intensive dairy production. Around 40 percent of surface waters [2] and 85 percent of groundwater aquifers exceed target thresholds for nitrates in Europe [3]. Moreover, dairy production throughout the USA is a key source of nitrate enrichment of waterways (e.g., [4]). Degradation of water quality because of high nutrient emissions from intensive dairy production is also widespread throughout New Zealand [5]. Nitrate loads within the Waikato River—the main waterway within New Zealand’s primary dairy farming region—must decrease by 50 percent if they are to satisfy recommended standards for contact recreation [6].
A broad range of policy instruments have been proposed for regulation of agricultural nonpoint source pollution (NSP). Possible strategies are legislated decreases in production intensity, incentive payments, taxation of polluting activities, tenders, offsets, and tradable permit systems. However, each of these has key limitations in the context of NSP control. This arises since typically (a) quantity and concentration of pollutants cannot be monitored by source, (b) multiple firms are responsible for degradation, (c) intensity of abatement and pollution varies spatially and temporally, and (d) producers possess more information than regulatory bodies regarding mitigation and pollution. For example, there are few instances where tradable permit systems have been successfully applied for water quality regulation worldwide [7], despite being studied for over 40 years. The limitations of direct policies for NSP control can be overcome through the development of mitigation technologies that are more profitable than polluting practices [8]. This is evident in Australian salinity management, where profitable perennial plants are the best means to prevent widespread degradation [9]. Indeed, “the real challenge is to find or develop innovations that are not only good for the environment, but also economically superior to the practices they are supposed to replace” ([10], p. 1421).
Economic analysis is important in the analysis of agricultural stewardship options since mitigation often incurs costs on private agents. Large hydrological models can inform how the spatial location of mitigation techniques can influence pollutant loads in a watershed [11,12]. However, such studies do not consider the key economic drivers of the adoption of mitigation activities for agricultural emissions among economic agents, particularly profitability [9]. Farm-level economic analysis is thus critical in the evaluation of alternative abatement activities. Partial budgeting can be used to establish the value of different strategies [13]. However, farm-level models provide a more robust framework for evaluation, given their greater capacity to represent important linkages between each mitigation and the entire farming system [14]. The value of this approach is evident in the broad scale farm-level modelling that demonstrated that the use of perennial pastures for dryland salinity mitigation throughout Western Australia was only profitable under a set of restrictive circumstances [15,16]. However, the private economic gains associated with environmental stewardship options may not be sufficient where agents are unaware of them [17]. This highlights the importance of education where positive private net benefits are associated with the use of a given mitigation strategy [8].
Dicyanimide (DCD)—hereafter referred to as a nitrification inhibitor—inhibits the conversion of ammonium to nitrate by retarding the activity of Nitrosomonas europaea bacteria during the process of nitrification. This technology has received much recent attention throughout New Zealand since it reduces nitrate leaching, hence improving water quality and increasing pasture production as nitrogen is retained for longer in agricultural soils. Experimental evidence highlights that inhibitors can reduce nitrate leaching by up to 75 percent [18,19]; however, on-farm levels of mitigation are more likely 5–30 percent [5,20]. Pasture production is also enhanced, by more than 20 percent in some experimental studies (e.g., [19,21]).
However, no study has yet provided an in-depth analysis of their profitability at the whole-farm level. This is a critical deficiency since a systematic evaluation is important to inform policy makers and producers of their potential for simultaneously improving farm profit and water quality.
This study focuses on the evaluation of nitrification inhibitors under a wide range of conditions to identify whether they are sufficiently profitable to overcome the need for direct regulation of nitrate leaching arising from dairy farms throughout New Zealand. A system-level analysis is conducted using a complex, non-linear programming (NLP) model that describes a typical dairy farm in the Waikato region, New Zealand’s primary area for dairy production. This model allows the integration of diverse information from a broad range of disciplines and its consideration in a single transparent and coherent framework. The optimisation model contains 13,605 constraints. 13,603 constraints are linear. Only two equations are nonlinear. These involve the multiplication of endogenous variables in the computation of the overall nitrate leaching rate for the farm and the degree to which it is scaled according to the extent that discrete mitigation strategies—such as the use of feed pads or delayed effluent application—are used.
The paper is organised as follows. Section 2 provides a short technical description of nitrate leaching and nitrification inhibitors. Section 3 describes the farm-level model, based on the farm model introduced in [22]. Section 4 presents the results and discussion, while Section 5 concludes.

2. Background

Nitrogen (N) supply for the traditional pasture-based dairy farming system used in New Zealand was based on fixation of atmospheric nitrogen by legumes, particularly white clover (Trifolium repens L.). However, there has been substantial intensification of New Zealand dairy farms over the last decade given inflated output prices and land prices. Indeed, mean land prices increased by more than 250 percent over this period [23]. Intensification has involved greater use of supplementary feeds, particularly maize silage, and N fertiliser. For example, mean use of N fertiliser increased by 300 percent in the Waikato region between 1997–2007 [24], reflecting the inherent constraints to increasing milk production within an all-pasture system. However, this agricultural intensification has also had a detrimental impact on water quality.
The primary source of nitrate leaching in intensive dairy production is animal excreta, particularly urine, highlighting the importance of stocking rate in determining nitrate loads [18,21]. Grazing animals recover only a small proportion of ingested N, with 60–90 percent of it lost through excretion. Urine patches consequently contain around 1,000 kg N ha−1 and extend across 20–30 percent of grazed area under standard management [18]. The urea in cow urine is rapidly hydrolysed to ammonium, which is then oxidised to form nitrate that is only weakly held in agricultural soils. The large amounts of nitrate present within urine patches are highly prone to leaching, particularly during winter when drainage is high and plant uptake is low. In contrast, N fertiliser application mainly contributes to leaching by increasing pasture production and hence stocking rate, as direct leaching is reduced by widespread use of split applications and low total rates [1].
Nitrification inhibitors have been used worldwide since 1962, particularly to increase the efficacy of N fertiliser. However, they are relatively new to New Zealand dairy production given the historically low use of nitrogen fertilisation and the historical absence of strict regulations pertaining to agricultural intensity. Nitrification inhibitors are typically applied as a fine particle suspension, with best results achieved if pastures are treated immediately after grazing, as this ensures that recent urine deposits are affected and the pasture is low enough for the applied chemical to reach the soil surface [21]. Autumn (April–June) and early spring (July–August) applications are recommended to minimise leaching losses from urine deposited in winter [19,25]. These two applications are necessary because the inhibitors break down over time, particularly in warm temperatures, such as those commonly experienced in the North Island of New Zealand.
New Zealand research highlights the fact that nitrification inhibitors can achieve large reductions in nitrate leaching. For example, mean reductions of 17 percent [26], 24 percent [27], 59 percent [18,28], 68 percent [19], 75 percent [25], and 25–88 percent [21] have been achieved in experimental work. Accordingly, 30–39 percent increases in the uptake of macronutrient cations (ammonium, calcium, magnesium, and potassium) by pastures have been reported [21], while [25] highlighted that calcium leaching declined by 38–56 percent. This has promoted pasture growth in various experimental trials, with mean pasture production increasing by 15 percent [27], 25 percent [21], 33 percent [19], 34 percent [26], and 36 percent [18]. However, these have been conducted using plot trials for which a realistic grazing system context has not been represented. Thus, they are not used to inform model assumptions. MacDonald et al. [29] reported from an on-farm trial that inhibitor application did not affect either pasture production or rate of nitrate leaching. However, its findings were inconclusive, based on perceived limitations with the experimental technique applied. Only [27] was conducted for allophanic soils in the Waikato region of the North Island, which is the soil type on which the farm-level model is based on in this analysis. Allophanic soils are widely used for intensive dairy production in the Waikato and Taranaki regions, given their ability to withstand compaction and strong response to fertiliser application and pasture improvement ([30]). Nevertheless, it is problematic to use information from [27] for guiding model parameterisation, as the trial did not represent commercial farming conditions.

3. Model

This section describes the IDEAL (Integrated Dairy Enterprise Analysis Tool) model used to examine the value of nitrification inhibitors and the sources of the model coefficients.

3.1. Farm Model

The value of nitrification inhibitors is investigated using an optimisation framework because such innovations can impact many facets of a farming system, understanding of such changes is currently limited, and simulation can fail to identify valuable management plans. To improve the clarity of exposition, lower case letters typically represent coefficients in the model description, while upper case letters typically denote decision variables.
The static model represents a single year consisting of 26 fortnightly periods ( i = [ 1 , 2 , ... , 26 ] ), beginning on 1 July. The first time period follows the last time period in a cyclical fashion, such that time occurs in a continuous and repeatable fashion. The description of the grazing strategy is complicated because New Zealand dairy herds are typically rotated between individual fields to improve pasture growth and utilisation. Excess pasture growth can be stored as winter fodder through silage production.
The farm consists of a hectares. This is segregated into two areas, that which is treated with DCD and that which is not. The optimal relative size of these two areas is determined in the model. The area of pasture grazed at time t that has not been grazed during period i and has received no DCD application is defined A i , t G . Similarly, A i , t S M denotes the area harvested for silage production (i.e. ensiled) at time t that has not been grazed since period i on areas without DCD. Additionally, A i , t X represents the area of pasture grazed at time t that was ensiled in period i on this untreated portion of farm. In contrast, A i , t G N I , A i , t S M N I , and A i , t X N I respectively represent their equivalents on land that has been treated with DCD application. These activities collectively describe the rotational land-use system.
Total land use at time t is therefore defined:
a = i = 1 26 ( A i , t G + A i , t S M + A i , t X + A i , t G N I + A i , t S M N I + A i , t X N I ) + i t # ( A i , t # G + A i , t # S M + A i , t # X + A i , t # G N I + A i , t # S M N I + A i , t # X N I ) i t , t > i , t # > t + i t # ( A i , t # G + A i , t # S M + A i , t # X + A i , t # G N I + A i , t # S M N I + A i , t # X N I ) i t , i > t , t # > t .
The first term on the right hand side (RHS) describes land use at time t. The second and third terms describe land from which stock is excluded at time t ( i t ) and thus is rested for future use.
The area on which nitrification inhibitors is applied (NI) is a key decision variable in the model and provides an upper bound to the grazing and ensilement activities used on this land. This is described through:
N I = i = 1 26 ( A i , t G N I + A i , t S M N I + A i , t X N I ) + i t # ( A A i , t # G N I + A i , t # S M N I + A i , t # X N I ) i t , t > i , t # > t + i t # ( A A i , t # G N I + A i , t # S M N I + A i , t # X N I ) i t , i > t , t # > t .
Pasture is subject to minimum ( m t ) and maximum ( n t ) biomass levels before it is grazed or ensiled, set in accordance with standard practice. Additionally, grazing or ensilement ceases at a residual biomass ( r t ). These are agronomic limits defined to ensure adequate rates of regrowth and cow intake.
Total feed production in period t ( P t j ) for j = {G, SM, X} is represented as:
P t j = i = 1 26 A i , t j ( r i j + g = i + 1 t b g r t j )
where b g is pasture biomass growth in period g. In comparison, total feed production in period t ( P t j ) for j = {G-NI, SM-NI, X-NI} is represented as:
P t j = i = 1 26 A i , t j ( r i j + g = i + 1 t b g N I r t j )
where b g N I is pasture biomass growth with DCD application. Pasture growth is defined over individual growth periods since pasture response varies according to the time of year.
The feasibility of production activities defined in Equation 3 is constrained by:
A i , t j m t j A i , t j ( r i j + g = i + 1 t b g ) A i , t j n t j
Similarly, Equation 4 is limited by:
A i , t j m t j A i , t j ( r i j + g = i + 1 t b g N I ) A i , t j n t j
Pasture supply may be promoted using N fertiliser. This is described through:
P t N = i = 1 26 N i f i , t
where P t N is the pasture biomass (t ha−1) produced through N fertilisation in period t, N i is the amount of N fertiliser (t ha−1) applied during period i, and f i , t is the yield response (t DM) in time t following application of one tonne of N fertiliser in period i.
The cow herd consists of individuals that vary by calving date, lactation length, genetic status, and productivity level. Calving begins on 1 July, 15 July, and 1 August. There are five possible lactation lengths: 180, 210, 240, 270, and 300 days. There are two herd classifications: cull or standard. Cull herds can be milked for any of the five lactation lengths, with all cows culled at the end of lactation. In contrast, standard herds can only be milked for 240, 270, and 300 days. There are nine general productivity levels representing genetic diversity in milk production. There are thus 216 possible attribute configurations for each individual cow. Temporal demand for energy depends on the characteristics of the herd. Milk production increases with productivity level and lactation length for a given initial calving date.
Feed supply is represented as a pool of metabolisable energy to be allocated among cows. Energy may be obtained from grazed pasture, grass silage, maize silage, and palm kernel extract. Grass silage is produced on-farm, but maize silage and palm kernel extract are purchased.
The demand and supply of energy is calculated for each fortnightly period through the equation:
h = 1 216 D h E h , t ( P t G + P t X + P t G N I + P t X N I + P t N ) u P q t P + ( P t S F + P t S F N I ) u S q t S + F t u F q F + K t u K q K
where D h represents the number of cows with attribute combination h, E h , t represents the energy requirement (MJ of ME per fortnightly period) of a cow with attribute combination h at time t, u represents the proportion of the feed that is consumed by livestock (e.g., u P represents pasture utilisation), q t is the energy content of each feed at time t specified in MJ of ME per tonne of DM, P t S F ( P t S F N I ) is the total amount of silage fed to cows on the area without (with) DCD application, P t S M P t S F , P t S M N I P t S F N I , F t is the amount of maize silage (t DM) fed to cows at time t, and K t is the amount of palm kernel extract (t DM) fed to cows at time t.
The feed intake constraints of cows is represented by:
h = 1 216 D h V t P ( P t G + P t X + P t G N I + P t X N I + P t N ) u P + ( P t S F + P t S F N I ) u S V S + F t u F V S + K t u K V K
where V t P is the maximum per cow intake of pasture dry matter at time t (t DM cow−1), V S is the substitution rate of pasture to forage supplements (grass and maize silage), and V K is the substitution rate of pasture to grain.
Total nitrate leaching is defined:
N = ( 1 M ) [ χ + ϕ t = 1 26 N t + η h = 1 216 D h + τ h = 1 216 D h z h υ t = 1 26 F t ]
where M is the proportion of nitrate leaching decreased through additional mitigation strategies (see Equation 11), χ is a constant term, z h is annual milk production (t cow−1) of a cow in herd h, and { ϕ , η , τ , υ } are slope coefficients describing the correlation between nitrate leaching and N fertiliser application, cow number, milk production, and maize silage feeding, respectively. The term in square brackets calculates the nitrate leaching arising from relevant decision variables within the model. This is modified through the use of additional mitigations, described through:
M = E 1 h = 1 216 D h e 1 + E 2 h = 1 216 D h e 2 + E 3 h = 1 216 D h e 3 + h = 1 216 P h h = 1 216 D h e 4 + N I a e 5
where e ϑ for ϑ = [ 1 , 2 , ... , 5 ] is the proportional decrease in nitrate leaching achieved with mitigation ϑ , E 1 is the extent to which low-rate effluent application is used, E 2 is the extent to which dairy shed innovations are used to reduce effluent volumes, E 3 is the extent to which deferred effluent application is used, P h is the number of cows in herd h maintained on a self-feeding pad for 10 weeks (70 days) from 21 April to 31 June, and NI is the number of hectares over which the nitrification inhibitor is used. The extent of the first four mitigations is computed per-cow for ease of computation. Cows on the feed pad may only be fed supplementary feed (i.e., concentrates, grass silage, and maize silage). Equation 10 and Equation 11 allow nitrate loads on the representative farm to be lowered through reducing N fertiliser application, stocking rate, or per-cow milk production or through the use of low N feed, low-rate effluent application, dairy shed innovations, deferred effluent application, a feed pad, and nitrification inhibitors.
The objective function is:
max π = p m i l k h = 1 216 D h z h + p c u l l h = 1 135 D h + p c a l f ( h = 1 216 D h ψ h = 1 135 D h ω ) c D h = 1 216 D h c S i = 1 26 P i S M c V i = 1 26 V i c K i = 1 26 K i c F i = 1 26 N i c F C a ,
where p m i l k is the price received for milk solids (MS) ($ t−1), p c u l l is the price received for one cull cow ($ cow−1), there are 135 cull herds, p c a l f is the price received for one calf ($ calf−1), ψ is the calving rate, ω is the replacement rate, c D is the variable cost associated with a single cow ($ cow−1), c S is the cost of conserving grass silage ($ per t DM), c V is the cost of maize silage ($ per t DM), c K is the cost of palm kernel extract ($ per t DM), c F is the cost of N fertiliser ($ t−1), and c F C is the fixed cost of production ($ ha−1).

3.2. Parameter Values

The model represents a standard farm with allophanic soils in the Waikato region in the 2008/09 milking season. Allophanic soils are appropriate given that they are the predominant dairy farming soil in the region and also experience significant rates of nitrification. The farm is assumed to be 109 ha in size, in line with the typical farm reported by [31]. All monetary values reported throughout the paper are stated in New Zealand dollars.
N fertiliser responses and minimum, maximum, and residual pasture masses are taken from [32]. Feed energy, substitution, and utilisation rates are taken from [22] and [33]. Average pasture production is taken from [34].
Predicting the impact of inhibitors on nutrient leaching and pasture growth is complex, as it depends on both climatic and soil factors. This study utilises realistic estimates based on expert opinion of likely responses achieved on typical farms. Increases in pasture production associated with the use of nitrification inhibitors are provided by [35]. It is assumed that nitrification inhibitors increase pasture growth by 10 percent overall, with two-thirds of this increase experienced over July–December and one-third occurring over January–June. There is substantial debate surrounding the impact of nitrification inhibitor application on the rate of additional pasture production ([21]). Thus, an extensive sensitivity analysis pertaining to this characteristic of this technology is presented in Section 4.5. It is demonstrated that the magnitude of this factor has little to no bearing on the key findings of this study. The efficacy of inhibitors for reducing nitrate leaching (15 percent reduction) is taken from the midpoint of the range computed for the representative farm in the BMP toolbox [20].
Energy demand for each cow attribute combination as a function of grazing, milk production, and pregnancy is computed using a simulation model constructed using information from [33].
Leachate burdens are calculated for numerous combinations of maize silage use, milk production, N fertiliser use, and stocking rate using the OVERSEER model [36]. The metamodel for Equation 10 is generated through linear regression of this data using SHAZAM econometric software [37]. The efficacy of the alternative mitigations described in Equation 11 is taken as the midpoint from those ranges computed for the representative farm in the BMP toolbox [20].
The OVERSEER model [36] is the leading software used to identify the implications of alternative management strategies for nitrate leaching loads in New Zealand farming systems. It calculates the level of nitrate leached for a given farm based on the computation of an N balance that quantifies all N inputs and outputs. Key factors in the N balance for a farm are the stocking rate, animal type, level of supplementary feeding, level of N fertiliser application, clover incidence, annual rainfall level, the adoption of mitigation practices, and soil group. The processes represented in the model are based on annual averages. Thus, variability in leaching response across a series of years is not considered. This approach is common in hydrological models (e.g., [12,38]) because it simplifies use and parameterisation of the model. Extensive validation has occurred (e.g., [39,40]). For example, Whistler et al. [36] reported that OVERSEER had a 99 percent accuracy rate when predicting N leaching loads from a sample of dairy farms.
The milk price for 2008/09 ($5140 t−1 MS) is taken from [23]. Production costs are drawn from [41,42,43,44]. The costs of the mitigations described in Equation 11 are taken from [20,41,44]. The standard cost of nitrification inhibitors is $160 ha−1 [44].
The IDEAL model consists of 13,605 equations and 8,656 decision variables. It is solved using NLP in the CONOPT3 solver in the Generalised Algebraic Modelling System (GAMS) [45]. NLP is a useful technique for farm-level modelling given its capacity to incorporate multiple nonlinearities, its rapid solution time (e.g., the base model solves within 8 seconds), and economic interpretation.
Model verification is an important part of model development. Optimisation models, such as IDEAL, are difficult to validate [46]. Nevertheless, the IDEAL model applied in the paper has undergone rigourous verification:
  • The structure of the model is based on that of an optimisation model that was subject to peer review in [32].
  • The input values and model structure applied in this study have been validated through peer review [22,47].
  • The capacity of the model to report useful results compared with expected output has been investigated using near-optimal solution space analysis [47,48].
  • The ability of the model to report results that are consistent with real-world observations is presented in Section 4.1.

4. Results and Discussion

4.1. Base Output

Standard output of the model provides a meaningful description of a representative Waikato dairy farm (Table 1; “without inhibitors” column). The farm has a stocking rate of 3.03 cows ha−1, with each cow producing an average output of 311 kg MS; both of these variables are within 1 percent of a typical farm in this region [23]. The leaching load is 37 kg N ha−1, a typical load for a farm with this level of production [41]. Farm profit is $1,705 ha−1, which is just 4 percent below mean annual real profit ($1,778 ha−1) calculated for the period 1998–2007 in an annual survey of the New Zealand dairy industry [43]. A direct comparison to the studied milking season cannot be made as the survey results for this year have yet to be published. A mean rate of 166 kg ha−1 of N fertiliser is applied, equivalent to the average rate applied by Waikato dairy farmers in 2007 [24]. The total amount of feed consumed is 17.76 t DM ha−1, incorporating 16.18 t DM ha−1 of grazed pasture, 1.44 t DM ha−1 of grass silage, and 0.139 t DM ha−1 of maize silage. Cows are milked for 270 days and consume 54,749 MJ cow−1 yr−1, on average. These magnitudes are broadly representative of a typical farm within the region; thus, this model is an appropriate framework in which to evaluate nitrification inhibitors.
Table 1. Impact on nitrification inhibitors on key output at the standard milk price ($5,140 t MS−1).
VariableWithout inhibitorsWith inhibitorsDifference (%)
N inhibitor application (ha)-97-
Farm profit ($ ha−1)17051744+2.3
Stocking rate (cows ha−1)3.033.19+5.3
Milk production (kg MS cow−1)3113110
Milk production (kg MS ha−1)942992+5.3
N fertiliser application (kg ha−1)166165−0.6
N leaching (kg N ha−1)3734−8.8
Total feed (t DM ha−1)17.7618.66+5.1
Total grazed pasture (t DM ha−1)16.1816.89+4.4
Total grass silage (t DM ha−1)1.441.63+13.2
Total maize silage (t DM ha−1)0.1390.156+12.2
Total energy per cow (MJ cow−1)54,74954,518−0.4
Lactation length (days)2702700

4.2. Value of Nitrification Inhibitors under Standard Assumptions

Model output identifies that the optimal proportion of the farm on which nitrification inhibitors are applied is around 89 percent (97 ha) at the standard parameter values (Table 1). This increases profit by 2.3 percent since stocking rate increases by 5.3 percent given greater pasture production. Higher levels of pasture growth promote increases in the intake of grazed pasture (4.4 percent) and grass silage (13.2 percent). In addition, the high stocking rate motivates a significant increase in the importation of supplement (12.2 percent). Nitrate leaching decreases by around 9 percent, highlighting that the mitigation effect of the inhibitor outweighs the impact of increases in stocking rate on nitrate emissions. The use of inhibitors has a marginal negative impact on the use of N fertiliser.

4.3. Impact of Milk Price on Nitrification Inhibitor Use

The milk price is a key determinant of the intensity of dairy production throughout New Zealand. Thus, a broad set of milk prices forecast to contain future values is evaluated. A low milk price ($4,140 t MS−1) reduces the benefit associated with a potential increase in stocking rate on the representative farm. Thus, stocking rate, milk production, and N fertiliser application decrease by 1, 2, and 20 percent, respectively (Table 2), as the lower milk price does not justify incurring the cost of nitrification inhibitors. In contrast, a high milk price ($6,140 t MS−1) motivates using nitrification inhibitors on around 92 percent of the farm, increasing farm profit by 3 percent by supporting increases in stocking rate of 5 percent. As in the standard solution of model (Table 1), N fertiliser application changes little, while the use of nitrification inhibitors decreases leaching overall, despite supporting greater amounts of livestock.
Table 2. Impact of nitrification inhibitors on key model output at the low ($4,140 t MS−1) and high milk price ($6,140 t MS−1).
VariableLow milk priceHigh milk price
Without and with inhibitorsWithout inhibitorsWith inhibitors
N inhibitor application (ha)--100
Farm profit ($ ha−1)6562,7632,850
Stocking rate (cows ha−1)2.993.083.24
Milk production (kg MS cow−1)306314314
N fertiliser application (kg ha−1)133190188
N leaching (kg N ha−1)353935
Total feed (t DM ha−1)17.5318.0418.97
Total grazed pasture (t DM ha−1)15.8616.417.15
Total grass silage (t DM ha−1)1.441.51.66
Total maize silage (t DM ha−1)0.2210.1360.152
Total energy per cow (MJ cow−1)54,64254,57354,573
Lactation length (days)270270270

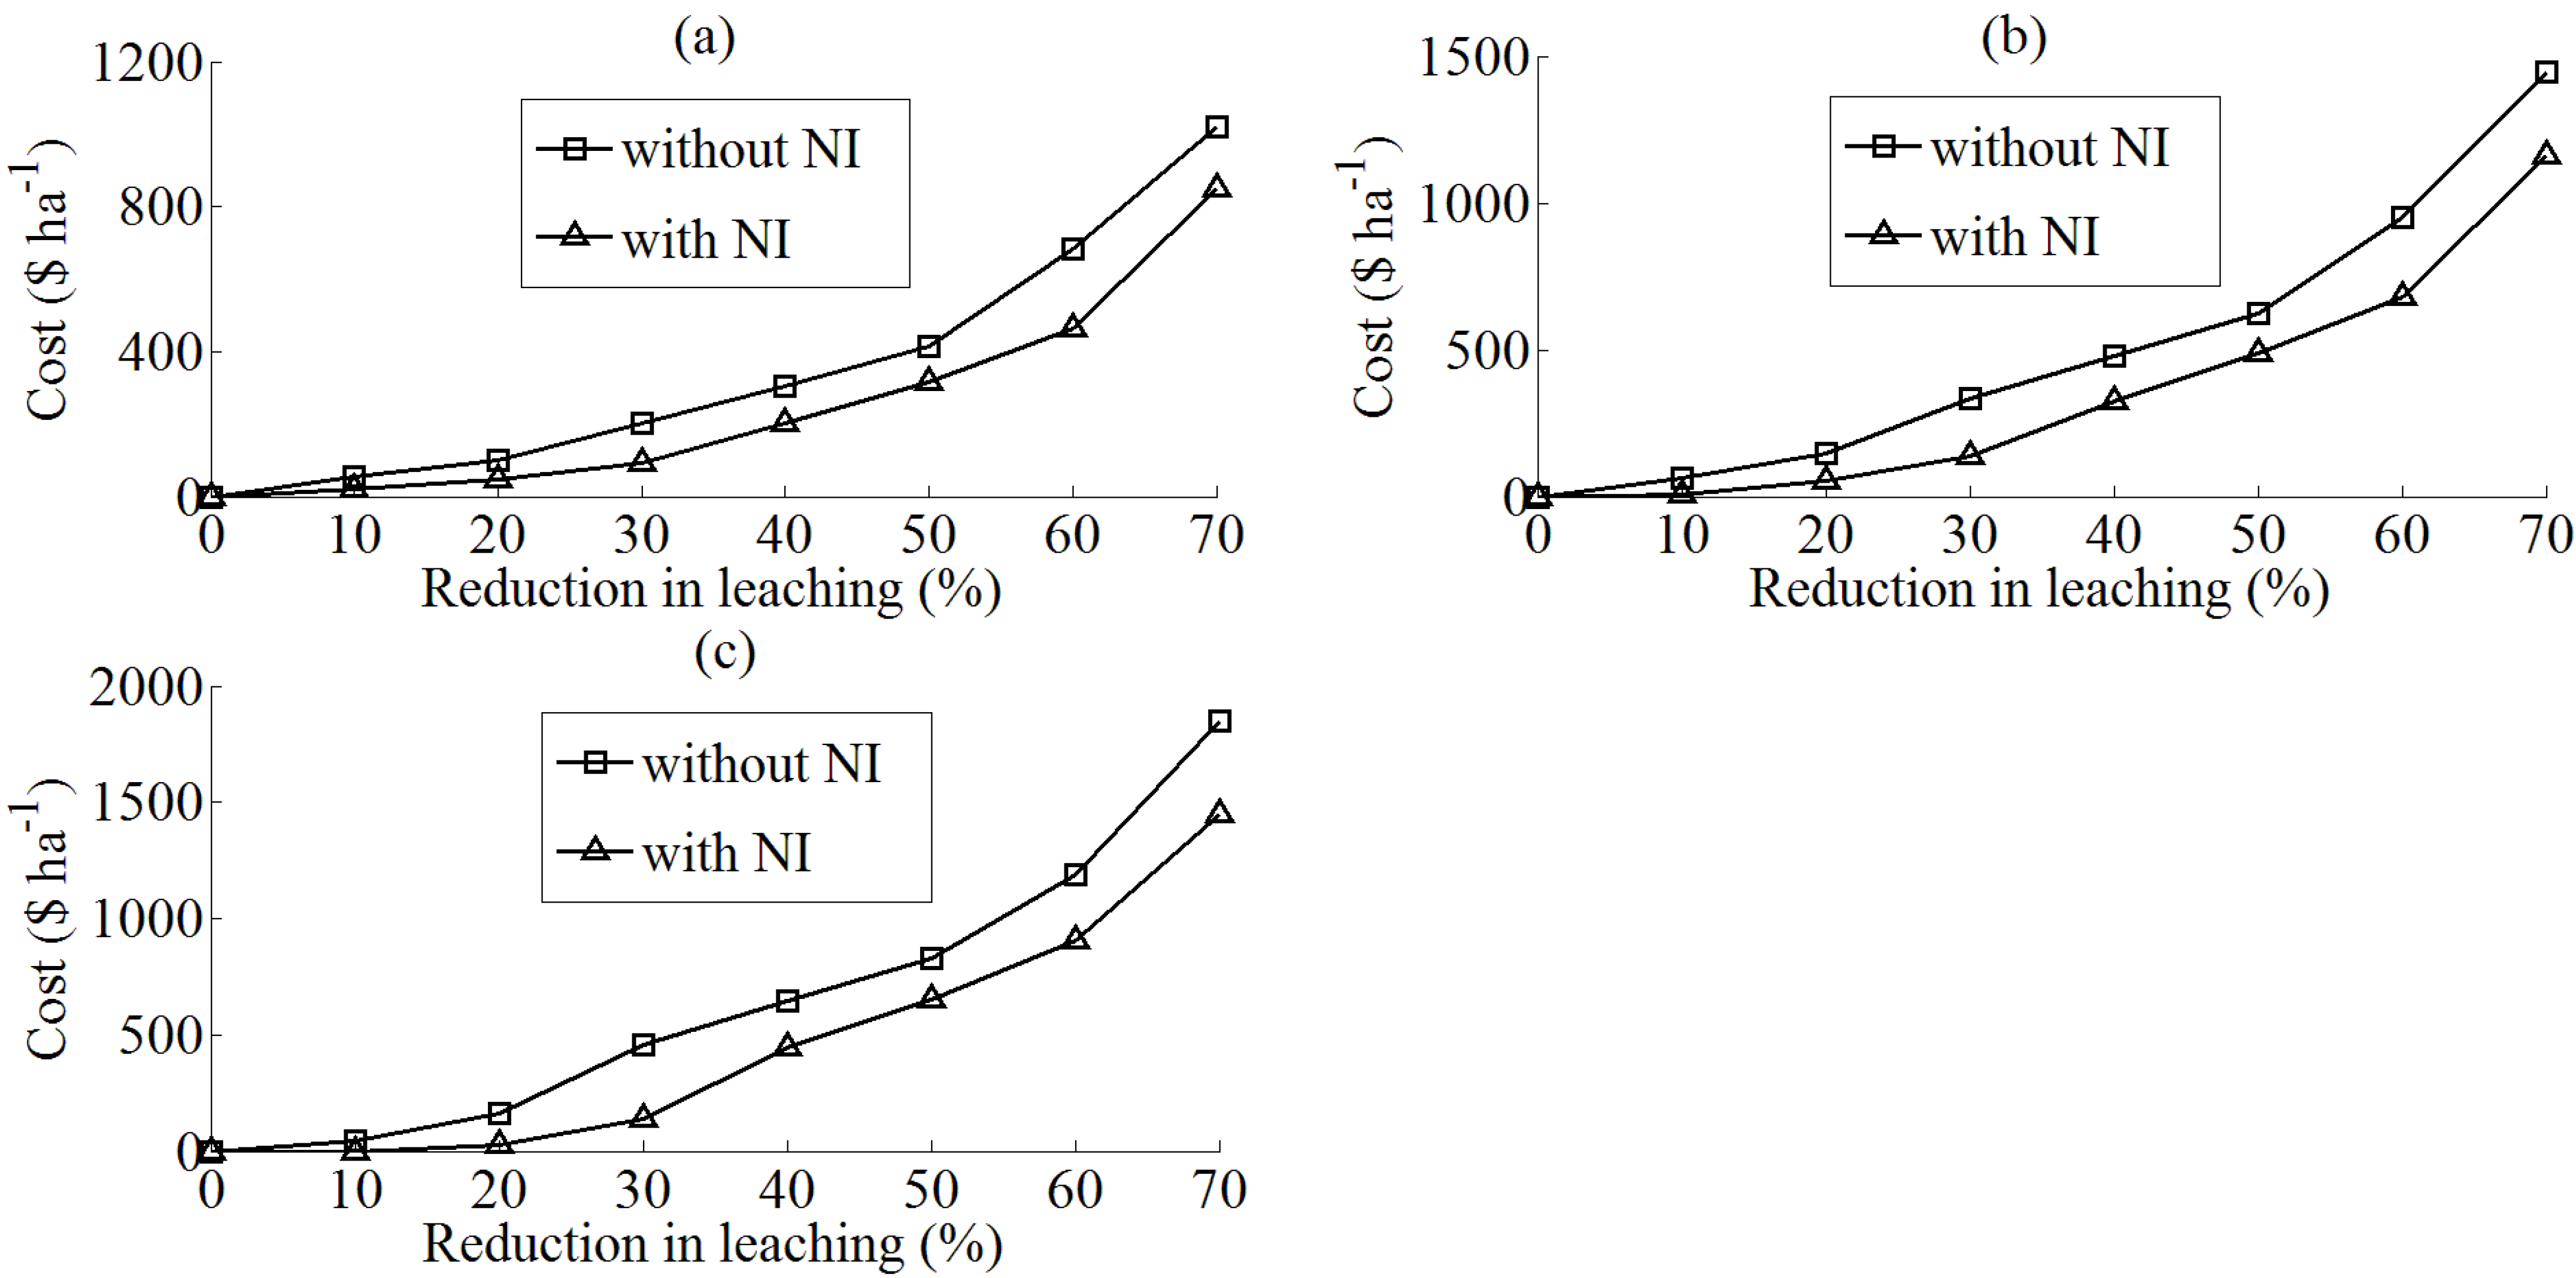
4.4. Impacts of Nitrification Inhibitors on Leaching Loads

A key motivation for the use of nitrification inhibitors throughout New Zealand is their value for reducing nitrate leaching. A 30 percent reduction in nitrate leaching in the catchment of the Waikato River is required for water to be suitable for irrigation, while a 50 percent reduction is required to satisfy contact recreation benchmarks [6]. Moreover, a 30 percent reduction is required in the model to achieve emissions of 26 kg N ha−1, a threshold at which it is proposed that no further degradation in the Waikato River will occur [41].
Abatement costs incurred to achieve the 30 and 50 percent goal are substantial in the absence of nitrification inhibitors, representing 20 and 37 percent of income, respectively (Table 3). Moreover, they increase sharply as more stringent goals are considered. In contrast, the availability of nitrification inhibitors reduces abatement costs markedly, with reductions in income of 8 and 28 percent to achieve the 30 and 50 percent goals, respectively (Table 4). This demonstrates that nitrification inhibitors are valuable mitigation practices, particularly if the goal of requiring no further degradation in the Waikato River is the key objective of policy.
The primary costs of stringent policies to reduce nitrate leaching accrue to reductions in livestock intensity and N fertiliser application. The suite of mitigation practices available to producers permits them to offset significant reductions in these key variables at less-stringent bounds. This is demonstrated in Table 3 and Table 4, where the rate of change in N fertiliser use and stocking rate increases as required reductions in nitrate leaching become more prohibitive. Nitrification inhibitors are particularly valuable because they offset such costly reductions. For example, stocking rate and N fertiliser application decrease by 6 and 35 percent, respectively, to achieve the 30 percent leaching reduction when nitrification inhibitors are not available (Table 3). However, they are reduced by only 0.6 and 17 percent, respectively, to achieve this goal when inhibitors are used (Table 4).
Table 3. Impact of regulated decreases in nitrate leaching on key model output without use of nitrification inhibitors at the standard milk price ($5,140 t MS−1).
Decrease in nitrate leaching (%)Abatement cost ($) aStocking rate (cows ha−1)Milk production (kg MS cow−1)Maize silage (kg ha−1)N fertiliser (kg ha−1)
003.03311139166
10643.01309175152
201462.99306215135
303352.86305223108
404792.7309154103
506242.5331475100
609502.22316085
701,4441.78316068
a This is the difference between farm profit with no nitrate leaching and that achieved subject to the regulated decrease in nitrate leaching. Both are calculated with nitrification inhibitors unavailable.
Table 4. Impact of regulated decreases in nitrate leaching on key model output with use of nitrification inhibitors at the standard milk price ($5,140 t MS−1).
Decrease in nitrate leaching (%)Abatement cost ($) aStocking rate (cows ha−1)Milk production (kg MS cow−1)Maize silage (kg ha−1)N fertiliser (kg ha−1)Nitri. inhibitor (ha)
003.1931115616597
1093.1931016116397
20563.19309182153109
301373.17307222137109
403252.99308184119109
504862.83312114111109
606822.6431546102109
701,1622.2316085109
a This is the difference between farm profit with no nitrate leaching and that achieved subject to the regulated decrease in nitrate leaching. Both are calculated with the use of nitrification inhibitors.
Nonetheless, this benefit of nitrification inhibitors is inherently exhaustible given their limited efficacy (15 percent reduction under standard management and this is further eroded by stocking rate increases). Abatement costs with nitrification inhibitors are below those incurred when these technologies are not used across all simulated reductions in nitrate leaching and milk prices (Figure 1). However, all curves are convex, with cost increasing sharply at more stringent leaching reductions (Figure 1). This demonstrates the limited efficacy of all mitigation practices, including nitrification inhibitors, and the increasing need to decrease stocking rate, and hence total milk production, to satisfy nitrate leaching targets as they become more restrictive. Figure 1 also intuitively shows that abatement cost increases monotonically with the milk price, as the value of foregone production is inflated.
Figure 1. Abatement cost with and without the use of nitrification inhibitors at the (a) low ($4,140 t MS−1); (b) standard ($5,140 t MS−1); and (c) high milk prices ($6,140 t MS−1).
Water 03 01031 g001

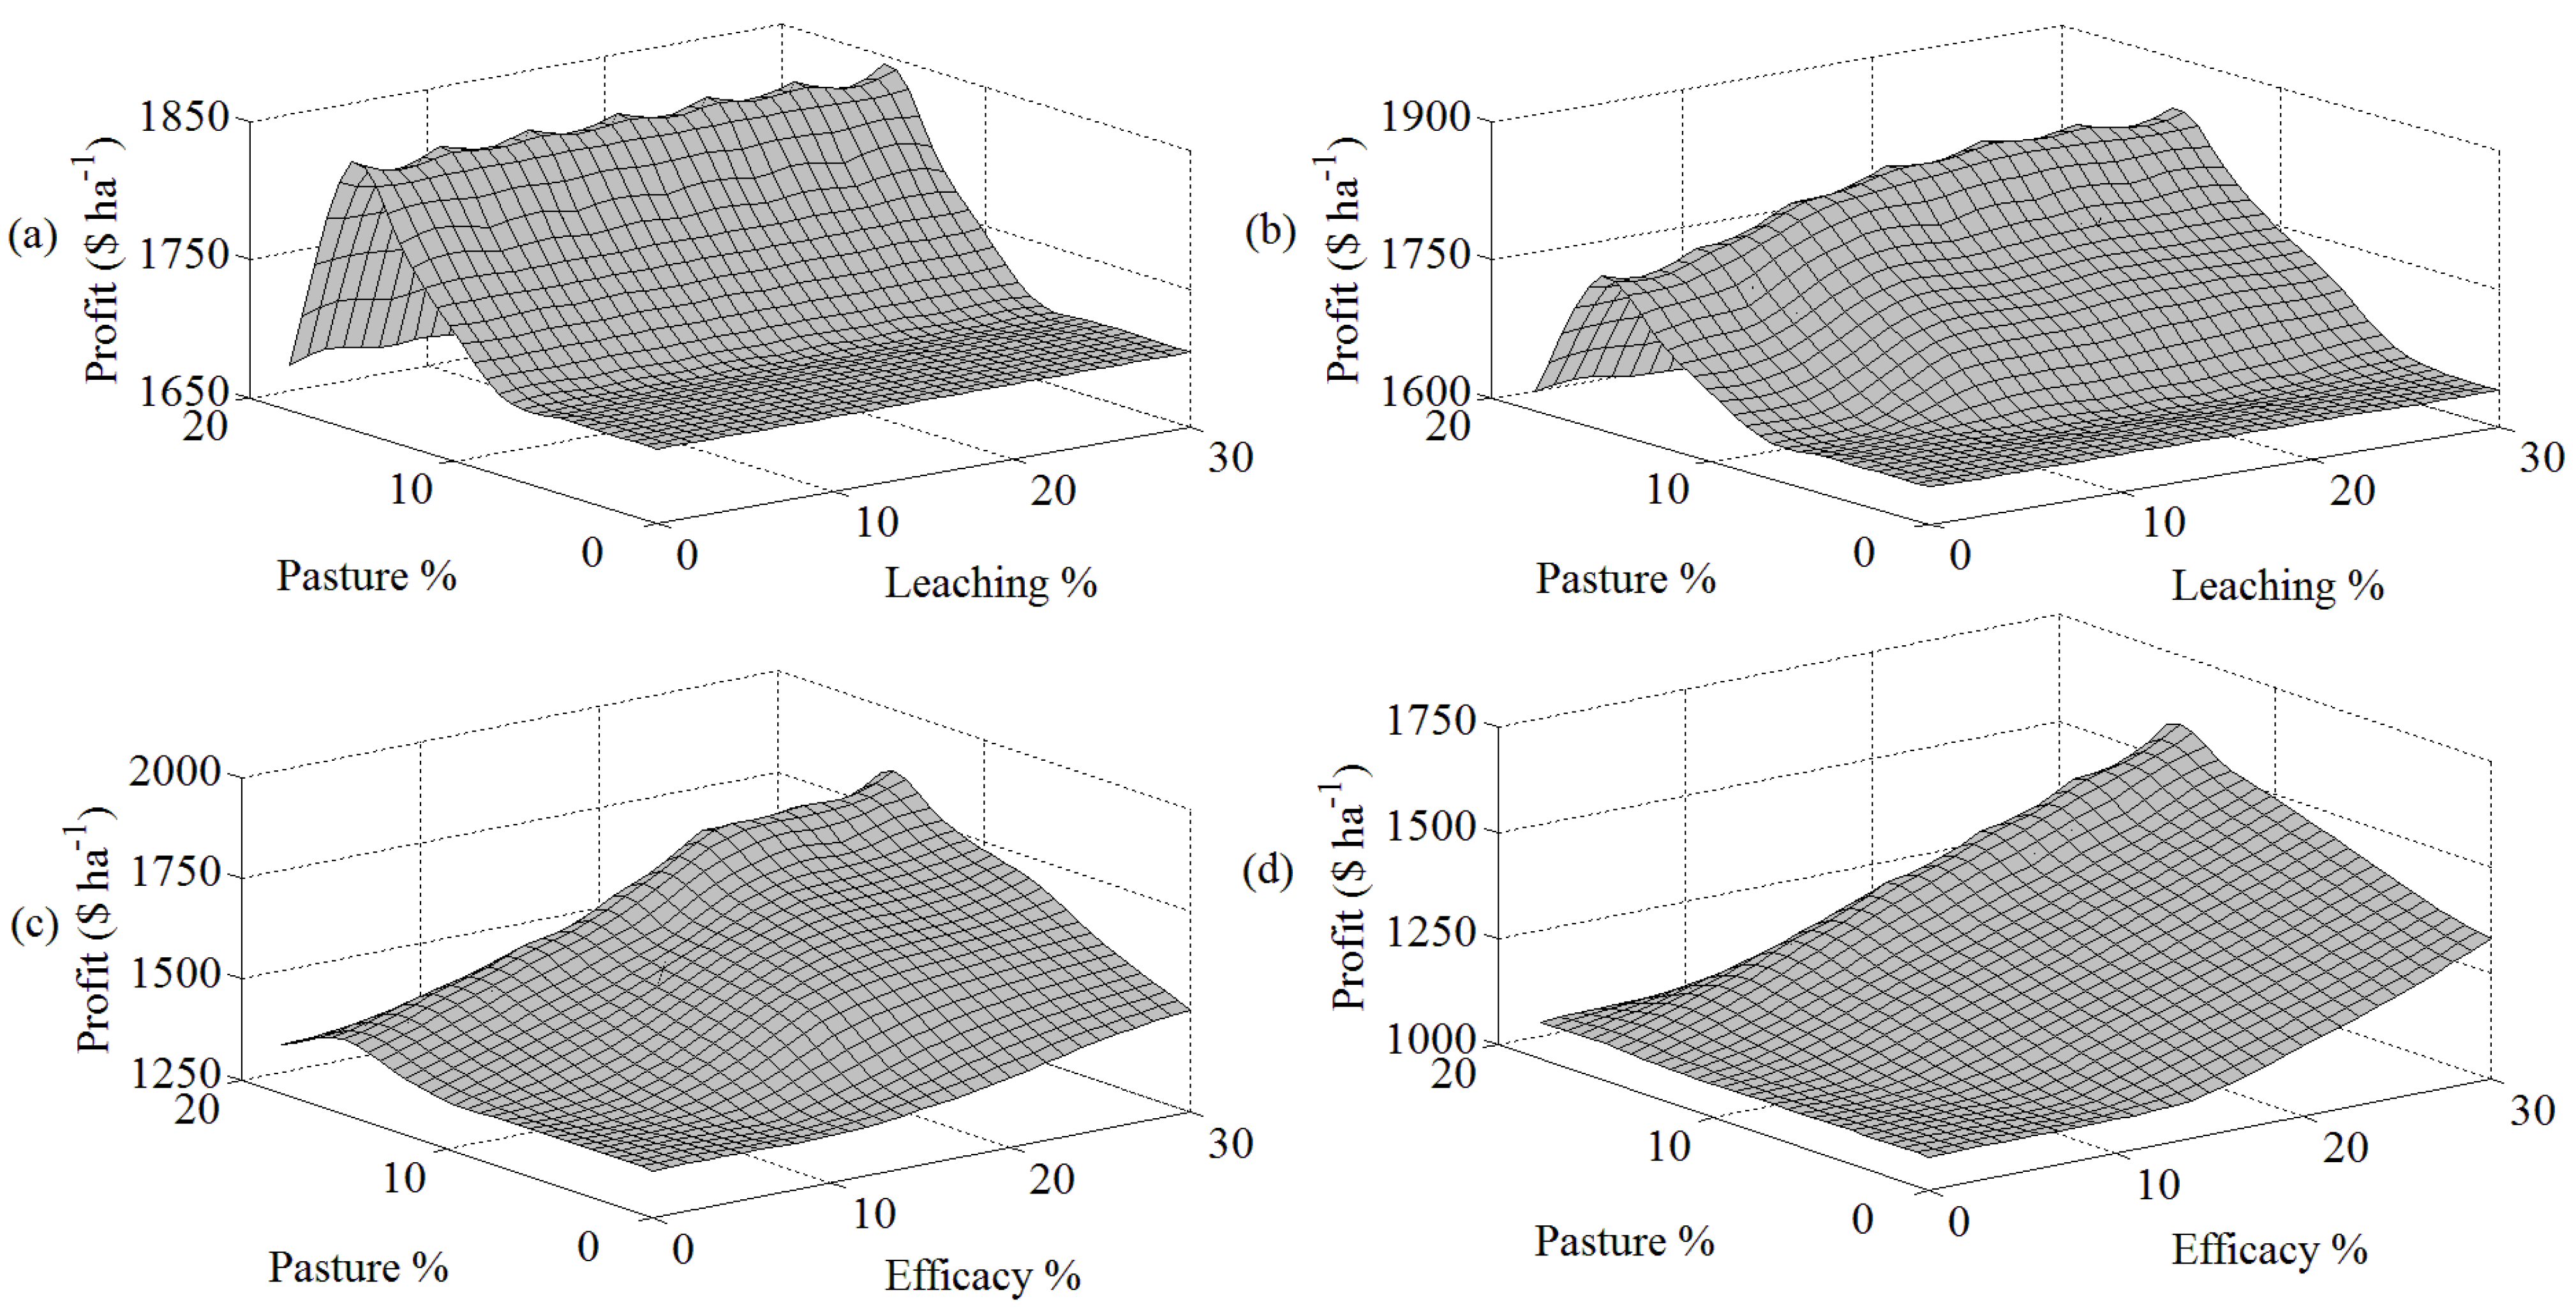
4.5. Use of Nitrification Inhibitors under Different Model Assumptions

Previous discussion highlights that nitrification inhibitors are a profitable innovation in the model. However, the scale of net benefits is slight overall, with profit in the base model increasing by only 2.3 percent with the use of nitrification inhibitors. Farm profit is also reasonably inelastic to substantial changes in pasture production and the cost of nitrification inhibitors, especially at the standard and high milk price (Table 5). Increasing pasture production by 5 percent increases base profit by 9, 6, and 4 percent at the low, standard, and high milk prices, respectively. Moreover, reducing the cost of nitrification inhibitors by 37.5 percent increases base profit by 7, 3, and 6 percent at the low, standard, and high milk prices, respectively. Indeed, it is likely in many cases that such benefits will be eroded through the impacts of climate and market uncertainty.
There is ongoing debate around the efficacy of nitrification inhibitors for reducing nitrate leaching and promoting pasture production [21,29]. Farm profit increases little until the pasture response is greater than 10 percent in the absence of regulation (Figure 2(a)). This highlights that inhibitors are only slightly profitable in the range of pasture production expected in the North Island, as recent research questions the capacity of inhibitors to alter pasture production to any significant degree in this environment [29]. Nevertheless, the promotion of farm profit due to the ability of inhibitors to reduce nitrate leaching is increasing in the level of regulation imposed (Figure 2b–d). This reflects the enhanced marginal benefit associated with increased pasture responses when mitigation is required.
Table 5. Key model output when milk price, inhibitor price, and the overall increase in pasture production associated with inhibitor use are adjusted to test model sensitivity. Shaded row presents model output from the base model.
Parameter valuesKey model output
Milk price ($ t MS−1)Cost of inhibitor ($ ha−1)Increase in pasture (%)Farm profit ($ ha−1)Stocking rate (cows ha−1)Inhibitor use (ha)N leaching (kg N ha−1)
414010006562.99035
414010056562.99035
4140100107023.1710932
4140100157773.2610932
414016006562.99035
414016056562.99035
4140160106562.99035
4140160157173.2610932
414022006562.99035
414022056562.99035
4140220106562.99035
4140220156643.218133
5140100017053.03037
5140100517113.119733
51401001018013.2010933
51401001519043.2910934
5140160017053.03037
5140160517053.03037
51401601017443.199734
51401601518443.2910934
5140220017053.03037
5140220517053.03037
51402201017053.0510937
51402201517843.2910934
6140100027643.08039
6140100527903.1710034
61401001028903.2310934
61401001530273.3210935
6140160027643.08039
6140160527643.08039
61401601028503.2410035
61401601529673.3210935
6140220027643.08039
6140220527643.08039
61402201027993.249635
61402201529073.3210935
Figure 2. Farm profit as a function of the impact of nitrification inhibitors on increasing pasture production (Pasture %) and decreasing nitrate leaching loads (Leaching %) for (a) 0, (b) 10, (c) 30, and (d) 50 percent regulated decreases in leaching.
Water 03 01031 g002

5. Conclusions

Experimental studies have demonstrated that nitrification inhibitors could greatly impact New Zealand dairy production by reducing nitrate leaching by up to 75 percent [21,25]. This study considers their capacity to deliver improved environmental outcomes without the implementation of direct policies through their adoption being promoted solely by their on-farm profitability.
Model output highlights that the consideration of the benefits likely to be experienced on-farm dampens the attractiveness of nitrification inhibitors to producers. At an assumed rate of pasture response of 10 percent, nitrification inhibitors are profitable in most modelled scenarios because inhibitors increase pasture production, which promotes stocking rate and hence milk production. Moreover, their use is robust to substantial changes in milk price and inhibitor cost, with it remaining profitable to employ nitrification inhibitors over the majority of a farm if milk prices fall or their cost increases substantially (over 35 percent).
However, their relative advantage is very slight. For example, profit increases by only 2.3 percent in the model with the use of inhibitors when the additional pasture production gained from their use is 10 percent, but is unaffected if the pasture production response is less than this. Thus, at best, in the absence of regulation, this technology has very low profitability and, at worst, the technology is of no benefit at all. There is substantial debate surrounding the impacts of nitrification inhibitors on pasture production on New Zealand dairy farms. However, this analysis indicates that the profitability of inhibitors is extremely marginal on a representative Waikato dairy farm, regardless of broad changes in this key aspect of their use.
Nitrification inhibitors reduce nitrate leaching, despite their use promoting stocking rates. These technologies are a valuable mitigation strategy since they offset the need to impose costly reductions in stocking rate and nitrogen fertiliser application. For example, the cost of achieving a 30 percent reduction in nitrate leaching, commensurate with achieving no further degradation of the Waikato River, reduces income by 20 percent without inhibitors, but only by 8 percent with this technology. Nevertheless, model output indicates that they are only a key component of a mitigation strategy, especially at low levels of regulation, rather than being able to deliver substantial environmental improvement without recourse to policy instruments.
This application highlights a number of key points regarding the profitability of nitrification inhibitors. However, it has a number of evident limitations. First, a lack of relevant trial data limits the capacity to use conclusive information regarding the effectiveness of inhibitors for reducing nitrate leaching and increasing pasture production in the study region. Second, estimates of expected responses used in the study are based on expert opinion given the lack of relevant data. Third, nitrification inhibitors are assumed to be applied according to industry recommendations. Fourth, no annual variability in pasture production or nitrate leaching is represented. Last, producers can formulate decisions with perfect information regarding expected prices, pasture production, and cow intake and energy demand across the management year. These assumptions may appear to provide an optimistic view of the capacity of inhibitors to increase profit on a New Zealand dairy farm. However, model output demonstrates that this technology is not profitable in itself, even under these circumstances.
Overall, this analysis highlights that nitrification inhibitors are not sufficiently profitable to allow the satisfaction of environmental goals in the absence of regulation. Nonetheless, further work that investigates their profitability across different regions and using better information regarding their efficacy for increasing pasture production and reducing nitrate leaching, when available, is warranted before conclusive statements can be made.

References

  1. Monaghan, R.M.; Hedley, M.J.; Di, H.J.; McDowell, R.W.; Cameron, K.C.; Ledgard, S.F. Nutrient management in New Zealand pastures—Recent developments and future issues. New Zeal. J. Agr. Res. 2007, 50, 181–201. [Google Scholar] [CrossRef]
  2. European Commission. Report on the Implementation of Council Directive 91/676/EEC; European Commission: Brussels, Belgium, 2010. [Google Scholar]
  3. Centre for European Agricultural Studies (CEAS). Environmental Impact of Dairy Production in the European Union; CEAS: Wye, England, 2000. [Google Scholar]
  4. Almasri, M.N.; Kaluarachchi, J.J. Implications of on-ground nitrogen loading and soil transformations on groundwater quality management. J. Am. Water Resour. Assoc. 2004, 40, 165–186. [Google Scholar] [CrossRef]
  5. Monaghan, R.M.; de Klein, C.A.M.; Muirhead, R.W. Prioritisation of farm scale remediation efforts for reducing losses of nutrients and faecal inhibitor organisms to waterways: A case study of New Zealand dairy farming. J. Environ. Manag. 2007, 87, 609–622. [Google Scholar] [CrossRef]
  6. Vant, W.; Petch, T. Nitrogen and Phosphorous in Our Freshwaters: Effects and Targets; Environment Waikato: Hamilton, New Zealand, 2006.
  7. Morgan, C.; Wolverton, A. Water quality trading in the United States: Trading programs and one-time offset agreements. Water Policy 2008, 10, 73–93. [Google Scholar] [CrossRef]
  8. Pannell, D.J. Public benefits, private benefits, and policy intervention for land-use change for environmental benefits. Land Econ. 2008, 84, 225–240. [Google Scholar]
  9. Ridley, A.; Pannell, D.J. The role of plants and plant-based R&D in managing dryland salinity in Australia. Aust. J. Exp. Agr. 2005, 45, 1341–1355. [Google Scholar] [CrossRef]
  10. Pannell, D.J.; Marshall, G.R.; Barr, N.; Curtis, A.; Vanclay, F.; Wilkinson, R. Understanding and promoting adoption of conservation practices by rural landholders. Aust. J. Exp. Agr. 2006, 46, 1407–1424. [Google Scholar] [CrossRef]
  11. Rabotyagov, S.S.; Jha, M.K.; Campbell, T. Impact of crop rotation on optimal selection of conservation practices for water quality protection. J. Soil Water Conserv. 2009, 65, 369–380. [Google Scholar] [CrossRef]
  12. Vigiak, O.; Newham, L.T.H.; Whitford, J.; Roberts, A.M.; Rattray, D.; Melland, A.R. Integrated farming systems and landscape processes to assess management impacts on suspended sediment loads. Environ. Model. Softw. 2011, 26, 144–162. [Google Scholar] [CrossRef]
  13. Kennedy, A.M.; Wilson, P.N. Reduced tillage systems as economical dust mitigation strategies. J. Soil Water Conserv. 2009, 64, 61–69. [Google Scholar] [CrossRef]
  14. Weersink, A.; Jeffrey, S.; Pannell, D.J. Farm-level modelling for bigger issues. Rev. Agr. Econ. 2002, 24, 123–140. [Google Scholar] [CrossRef]
  15. Bathgate, A.; Pannell, D.J. Economics of deep-rooted perennials in Southern Australia. Agr. Water Manag. 2002, 53, 117–132. [Google Scholar] [CrossRef]
  16. John, M.; Pannell, D.J.; Kingwell, R.S. Climate change and the economics of farm management in the face of land degradation: Dryland salinity in Western Australia. Can. J. Agr. Econ. 2005, 53, 443–459. [Google Scholar] [CrossRef]
  17. McConnell, K.E. An economic model of soil conservation. Am. J. Agr. Econ. 1983, 65, 83–89. [Google Scholar] [CrossRef]
  18. Di, H.J.; Cameron, K.C. The use of a nitrification inhibitor, dicyanamide (DCD), to reduce nitrate leaching from cow urine patches in a grazed dairy pasture under irrigation. Soil Use Manag. 2002, 18, 395–403. [Google Scholar] [CrossRef]
  19. Di, H.J.; Cameron, K.C. Reducing environmental impact of agriculture by using a fine particle suspension nitrification inhibitor to decrease nitrate leaching from grazed pastures. Agr. Ecosyst. Environ. 2005, 109, 202–212. [Google Scholar] [CrossRef]
  20. Monaghan, R.M. The BMP toolbox—Selecting the right best management practice for mitigating farming impacts on water quality. In Nutrient Management in a Rapidly Changing World; Currie, L.D., Yates, L.J., Eds.; Massey University: Palmerston North, New Zealand, 2009; pp. 328–334. [Google Scholar]
  21. Moir, J.; Cameron, K.C.; Di, H.J. Effects of the nitrification inhibitor dicyanamide on soil mineral N, pasture yield, nutrient uptake and pasture quality in a grazed pasture system. Soil Use Manag. 2007, 23, 111–120. [Google Scholar] [CrossRef]
  22. Doole, G.J. Indirect instruments for nonpoint pollution control with multiple, dissimilar agents. J. Agr. Econ. 2010, 61, 680–696. [Google Scholar] [CrossRef]
  23. Livestock Improvement Corporation (LIC). 2008/09 Dairy Statistics; Livestock Improvement Corporation: Hamilton, New Zealand, 2009. [Google Scholar]
  24. Environment Waikato (EW). The Condition of Rural Water and Soil in the Waikato Region: Risks and Opportunities; EW: Hamilton, New Zealand, 2008.
  25. Di, H.J.; Cameron, K.C. Treating grazed pasture soil with a nitrification inhibitor, eco-NTM, to decrease nitrate leaching in a deep sandy soil under spray irrigation—A lysimeter study. New Zeal. J. Agr. Res. 2004, 47, 351–361. [Google Scholar] [CrossRef]
  26. Meneer, J.C.; Sprosen, M.S.; Ledgard, S.F. Effect of timing and formulation of dicyandiamide (DCD) application on nitrate leaching and pasture production in a bay of plenty pastoral soil. New Zeal. J. Agr. Res. 2008, 51, 377–385. [Google Scholar] [CrossRef]
  27. Sprosen, M.S.; Ledgard, S.F.; Lindsey, S.B. Effect of rate and form of dicyandiamide application on nitrate leaching and pasture production from a volcanic ash soil in the Waikato. New Zeal. J. Agr. Res. 2009, 52, 47–55. [Google Scholar] [CrossRef]
  28. Di, H.J.; Cameron, K.C.; Shen, J.P.; He, J.Z.; Winefield, C.S. A lysimeter study of nitrate leaching from grazed grassland as affected by a nitrification inhibitor, dicyanamide, and relationships with ammonia oxidising bacteria and archaea. Soil Use Manag. 2010, 25, 454–461. [Google Scholar] [CrossRef]
  29. MacDonald, K.A.; Williams, Y.; Dobson-Hill, B. Effectiveness of a nitrification inhibitor (DCn) on a coastal Taranaki dairy farm. Proc. New Zeal. Grassland Assoc. 2010, 72, 147–152. [Google Scholar]
  30. Molloy, L. Soils in the New Zealand Landscape: The Living Mantle; New Zealand Society of Soil Science: Palmerston North, New Zealand, 1988. [Google Scholar]
  31. Ministry of Agriculture and Forestry (MAF). Pastoral Sector Overview; Ministry of Agriculture and Forestry: Wellington, New Zealand, 2009.
  32. McCall, D.G.; Clark, D.A.; Stachurski, L.J.; Penno, J.W.; Bryant, A.M.; Ridler, B.J. Optimised dairy grazing systems in the Northeast United States and New Zealand. I. Model description and evaluation. J. Dairy Sci. 1999, 82, 1795–1807. [Google Scholar] [CrossRef] [PubMed]
  33. Dexcel. Feed Information Sheet; Dexcel: Hamilton, New Zealand, 2008. [Google Scholar]
  34. Dexcel. Average Pasture Growth Data for New Zealand Dairy Farms; Dexcel: Hamilton, New Zealand, 2008. [Google Scholar]
  35. Moir, J.; Lincoln University: Lincoln, New Zealand. 2010. Personal communication.
  36. Wheeler, D.M.; Ledgard, S.F.; Monaghan, R.M.; McDowell, R.W.; de Klein, C.A.M. OVERSEER Nutrient Budget Model—What it is, what it does. In Implementing Sustainable Nutrient Management Strategies in Agriculture; Currie, L.D., Hanly, J.A., Eds.; Massey University: Palmerston North, New Zealand, 2006; pp. 231–236. [Google Scholar]
  37. Whistler, D.; White, K.J.; Wong, S.D.; Bates, D. SHAZAM Version 10 User’s Manual; Northwest Econometrics: Gibsons, FL, USA, 2004. [Google Scholar]
  38. Newham, L.T.H.; Letcher, R.A.; Jakeman, A.J.; Kobayashi, T. A framework for integrated hydrologic, sediment, and nutrient export modelling for catchment-scale management. Environ. Model. Softw. 2004, 19, 1029–1038. [Google Scholar] [CrossRef]
  39. Thomas, S.M.; Ledgard, S.F.; Francis, G.S. Improving estimates of nitrate leaching for quantifying New Zealand’s indirect nitrous oxide emissions. Nutr. Cycl. Agroecosys. 2005, 73, 213–226. [Google Scholar] [CrossRef]
  40. Wheeler, D.M.; van der Weerden, T.; Shepherd, M.A. Description of a cut and carry model within OVERSEER® nutrient budgets. In Farming’s Future—Minimising Footprints and Maximising Margins; Currie, L.D., Lindsay, C.L., Eds.; Massey University: Palmerston North, New Zealand, 2010; pp. 203–211. [Google Scholar]
  41. AgFirst Waikato. Upper Waikato Nutrient Efficiency Study; AgFirst Waikato: Hamilton, New Zealand, 2009. [Google Scholar]
  42. Financial Budget Manual 2008; Chaston, T. (Ed.) Lincoln University: Christchurch, New Zealand, 2008.
  43. DairyNZ. DairyNZ Economic Survey 2007–08; DairyNZ: Hamilton, New Zealand, 2009. [Google Scholar]
  44. Longhurst, R.D.; Smeaton, D.C. Improved Nutrient Efficiency through Integrated Catchment Management in Little Waipa and Waipapa; AgResearch: Hamilton, New Zealand, 2008. [Google Scholar]
  45. Brooke, A.; Kendrick, D.; Meeraus, A.; Raman, R. GAMS—A User’s Guide; GAMS Development Corporation: Washington, DC, USA, 2008. [Google Scholar]
  46. McCarl, B.A.; Apland, J.D. Validation of linear programming models. South. J. Agr. Econ. 1986, 68, 155–164. [Google Scholar]
  47. Doole, G.J.; Ramilan, T.; Pannell, D.J. Framework for evaluating management interventions for water quality improvement across multiple agents. Environ. Model. Softw. 2011, 26, 860–872. [Google Scholar] [CrossRef]
  48. Makowski, D.; Hendrix, E.M.T.; van Ittersum, M.K.; Rossing, W.A.H. A framework to study nearly optimal solutions of linear programming models developed for agricultural land use exploration. Ecol. Model. 2000, 131, 65–77. [Google Scholar] [CrossRef]

