Impact of Water Availability on Land and Water Productivity: A Temporal and Spatial Analysis of the Case Study Region Khorezm, Uzbekistan

Abstract
:
1. Introduction
2. Materials and Methods
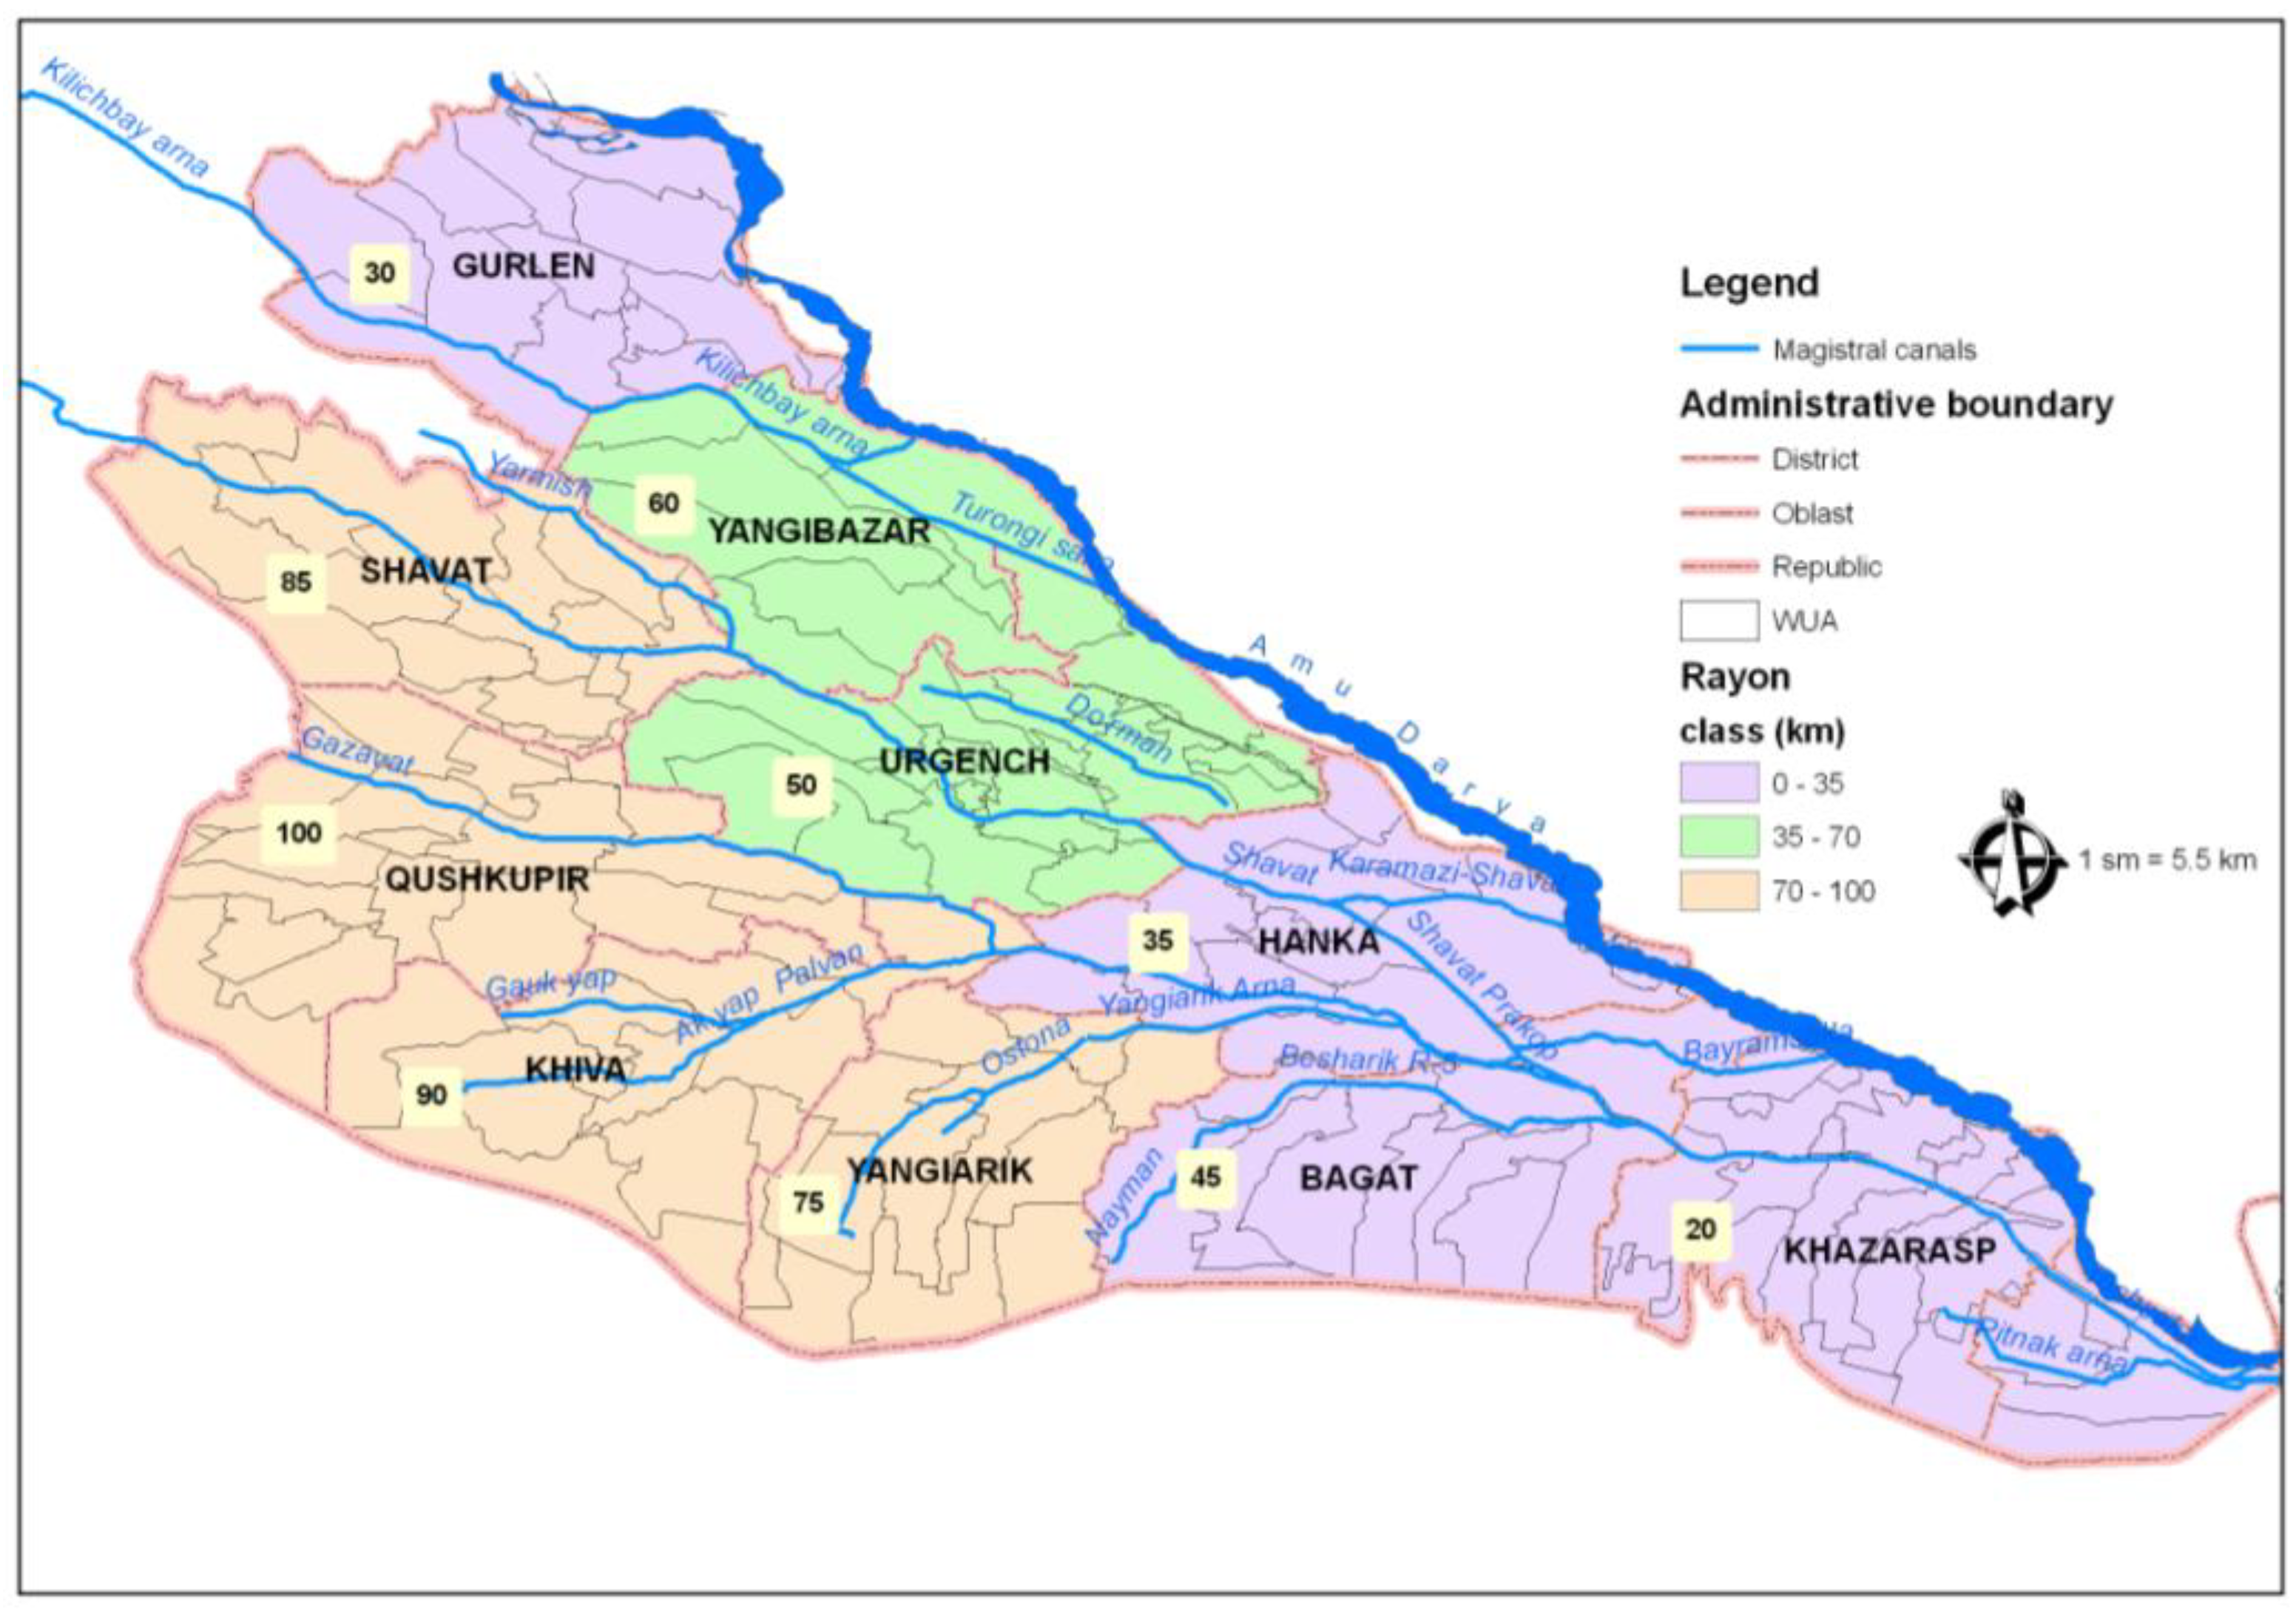
2.1. Description of the Study Region
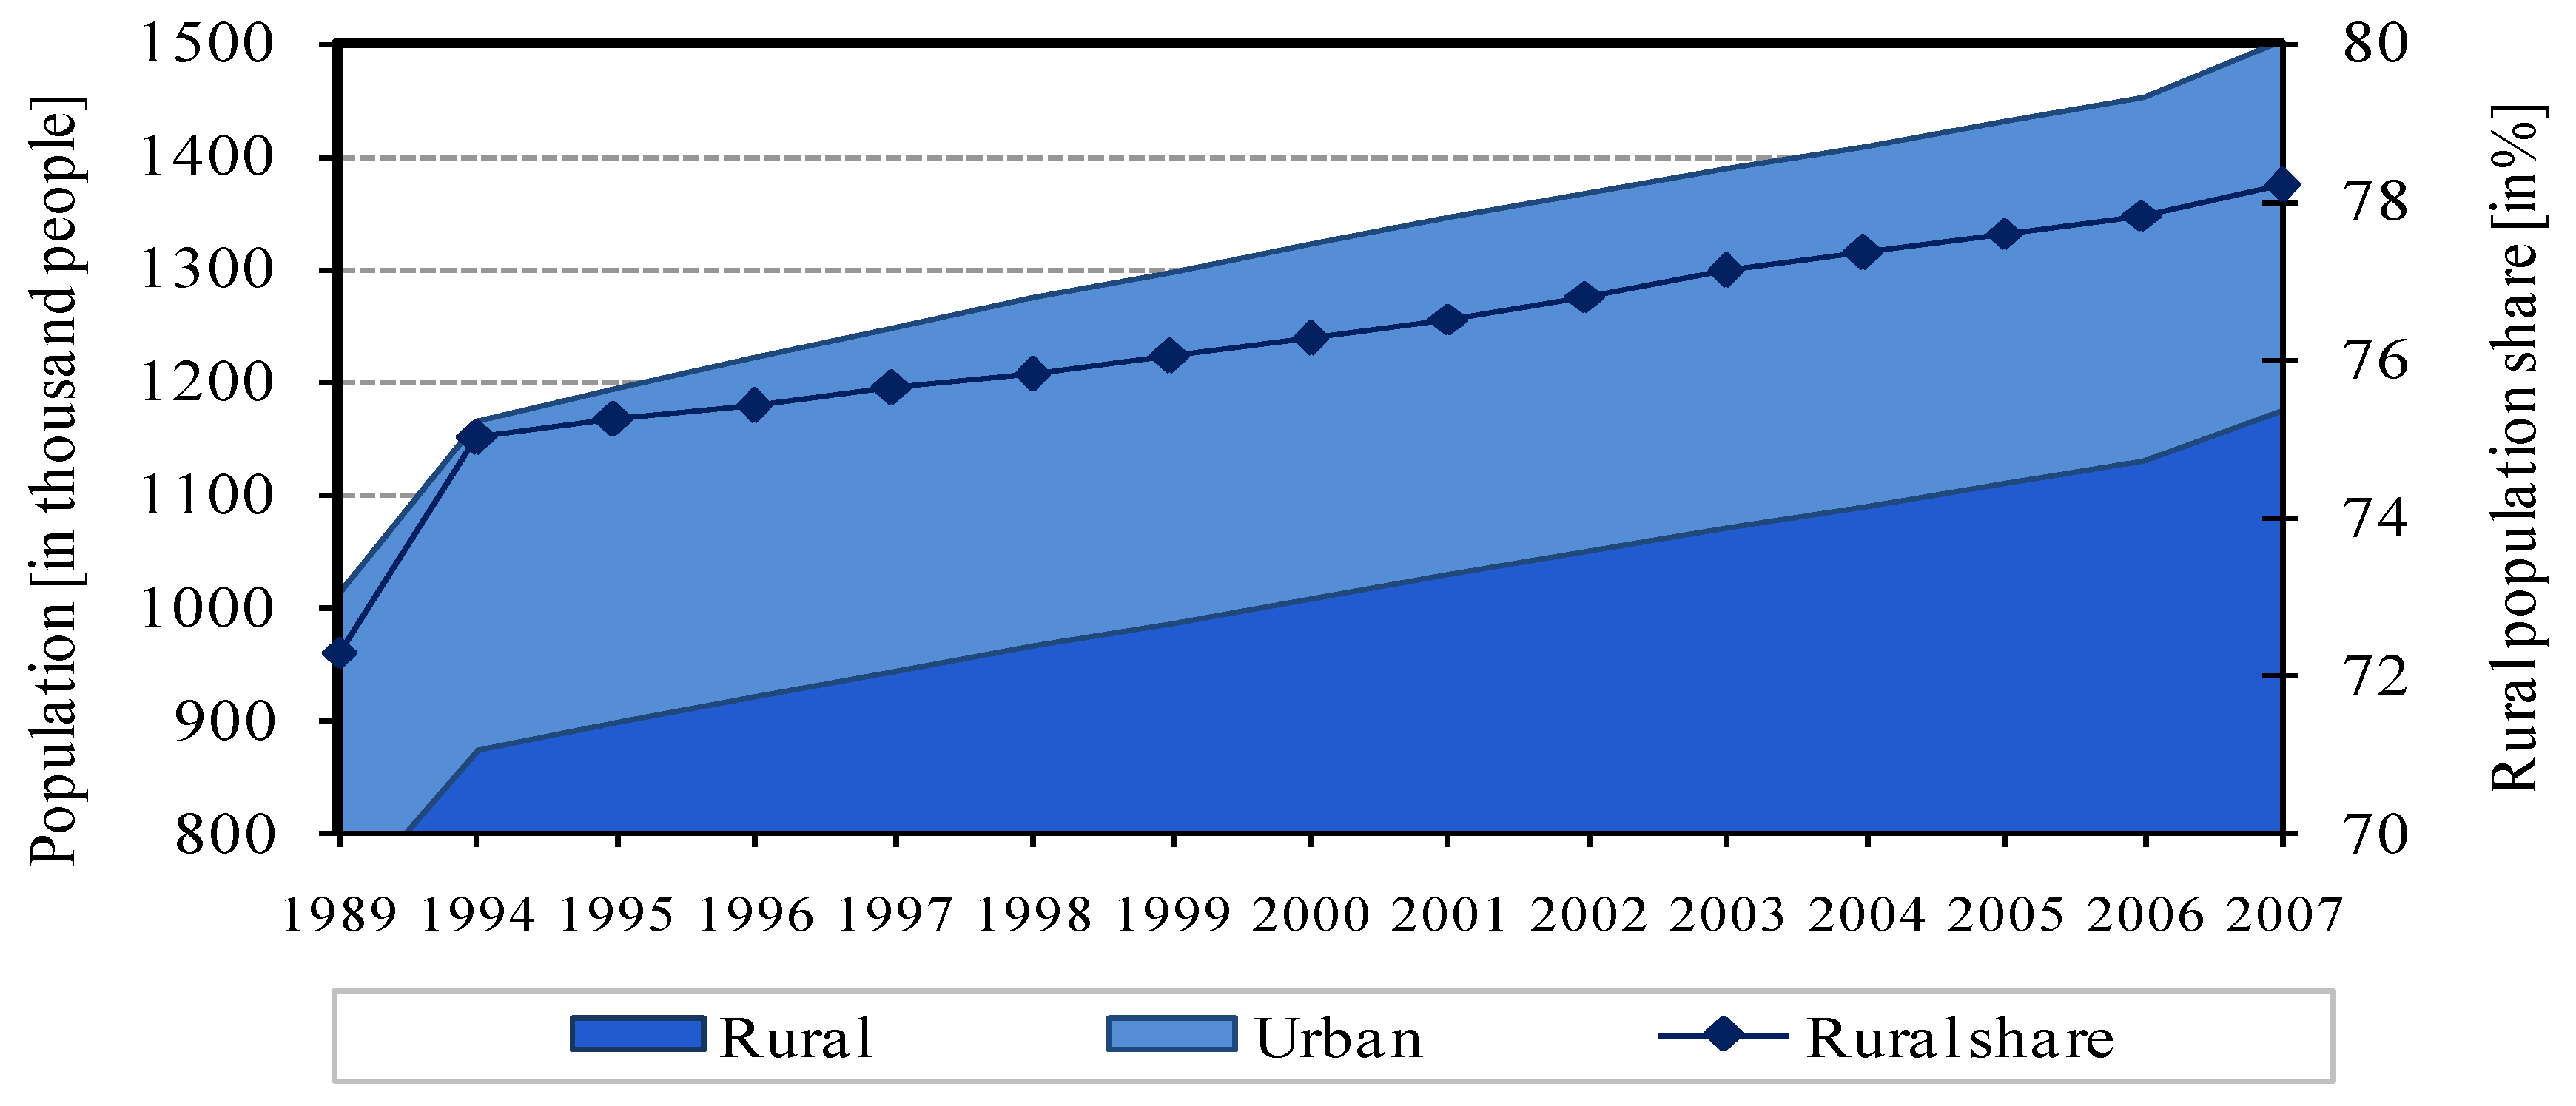
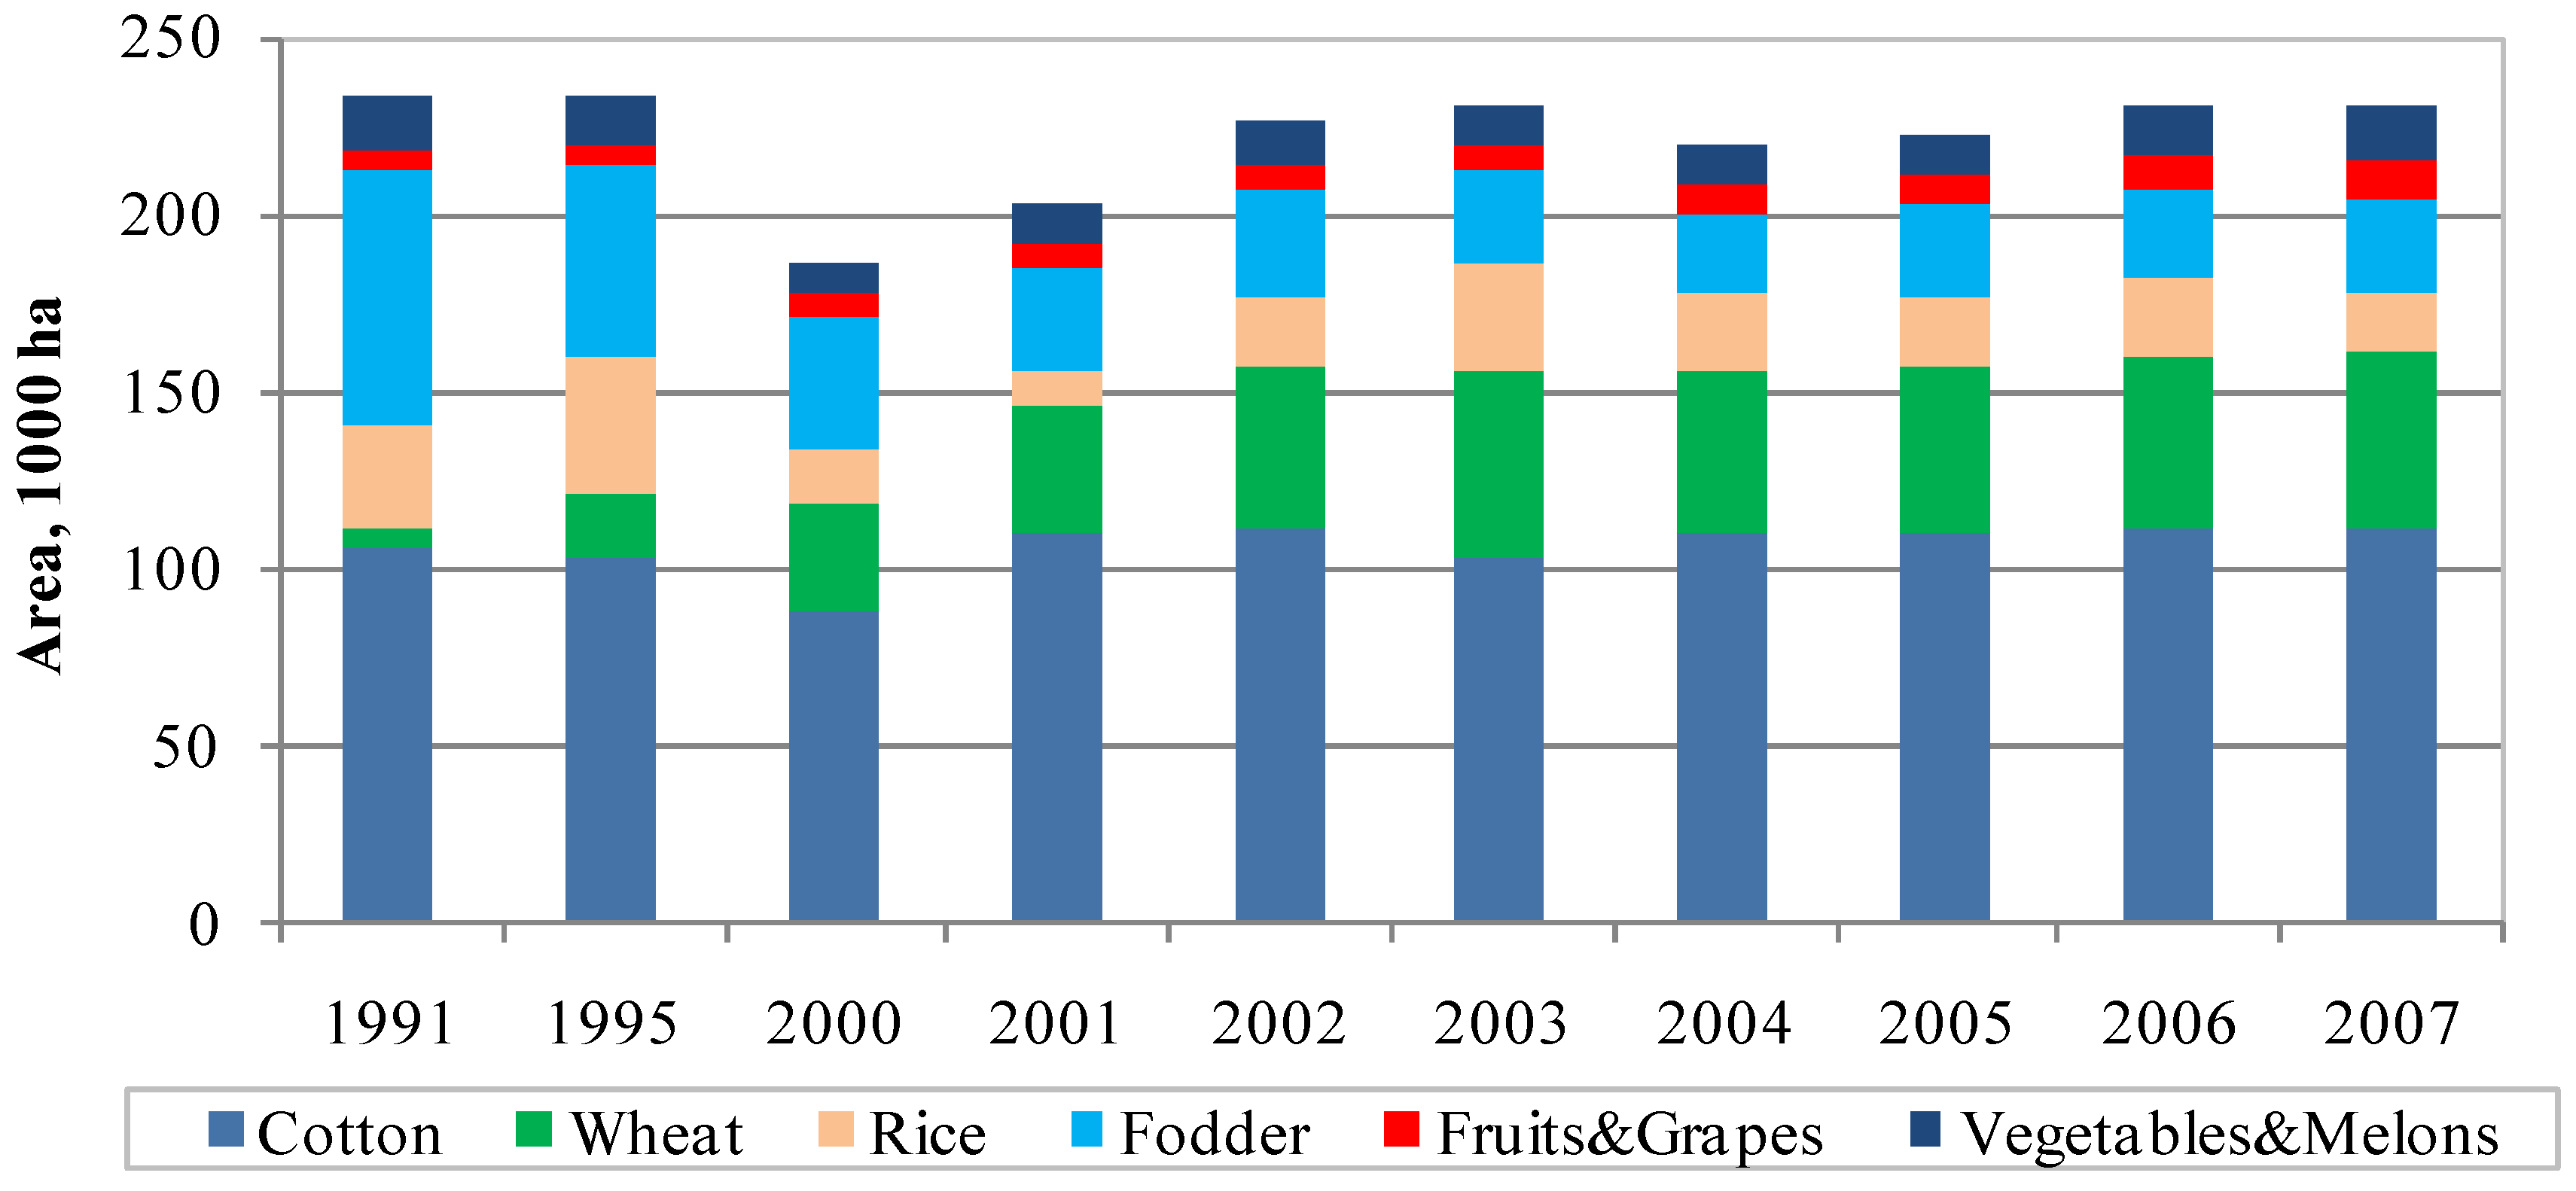
2.2. Cropland Allocation, Regional Population and Agricultural Commodity Prices


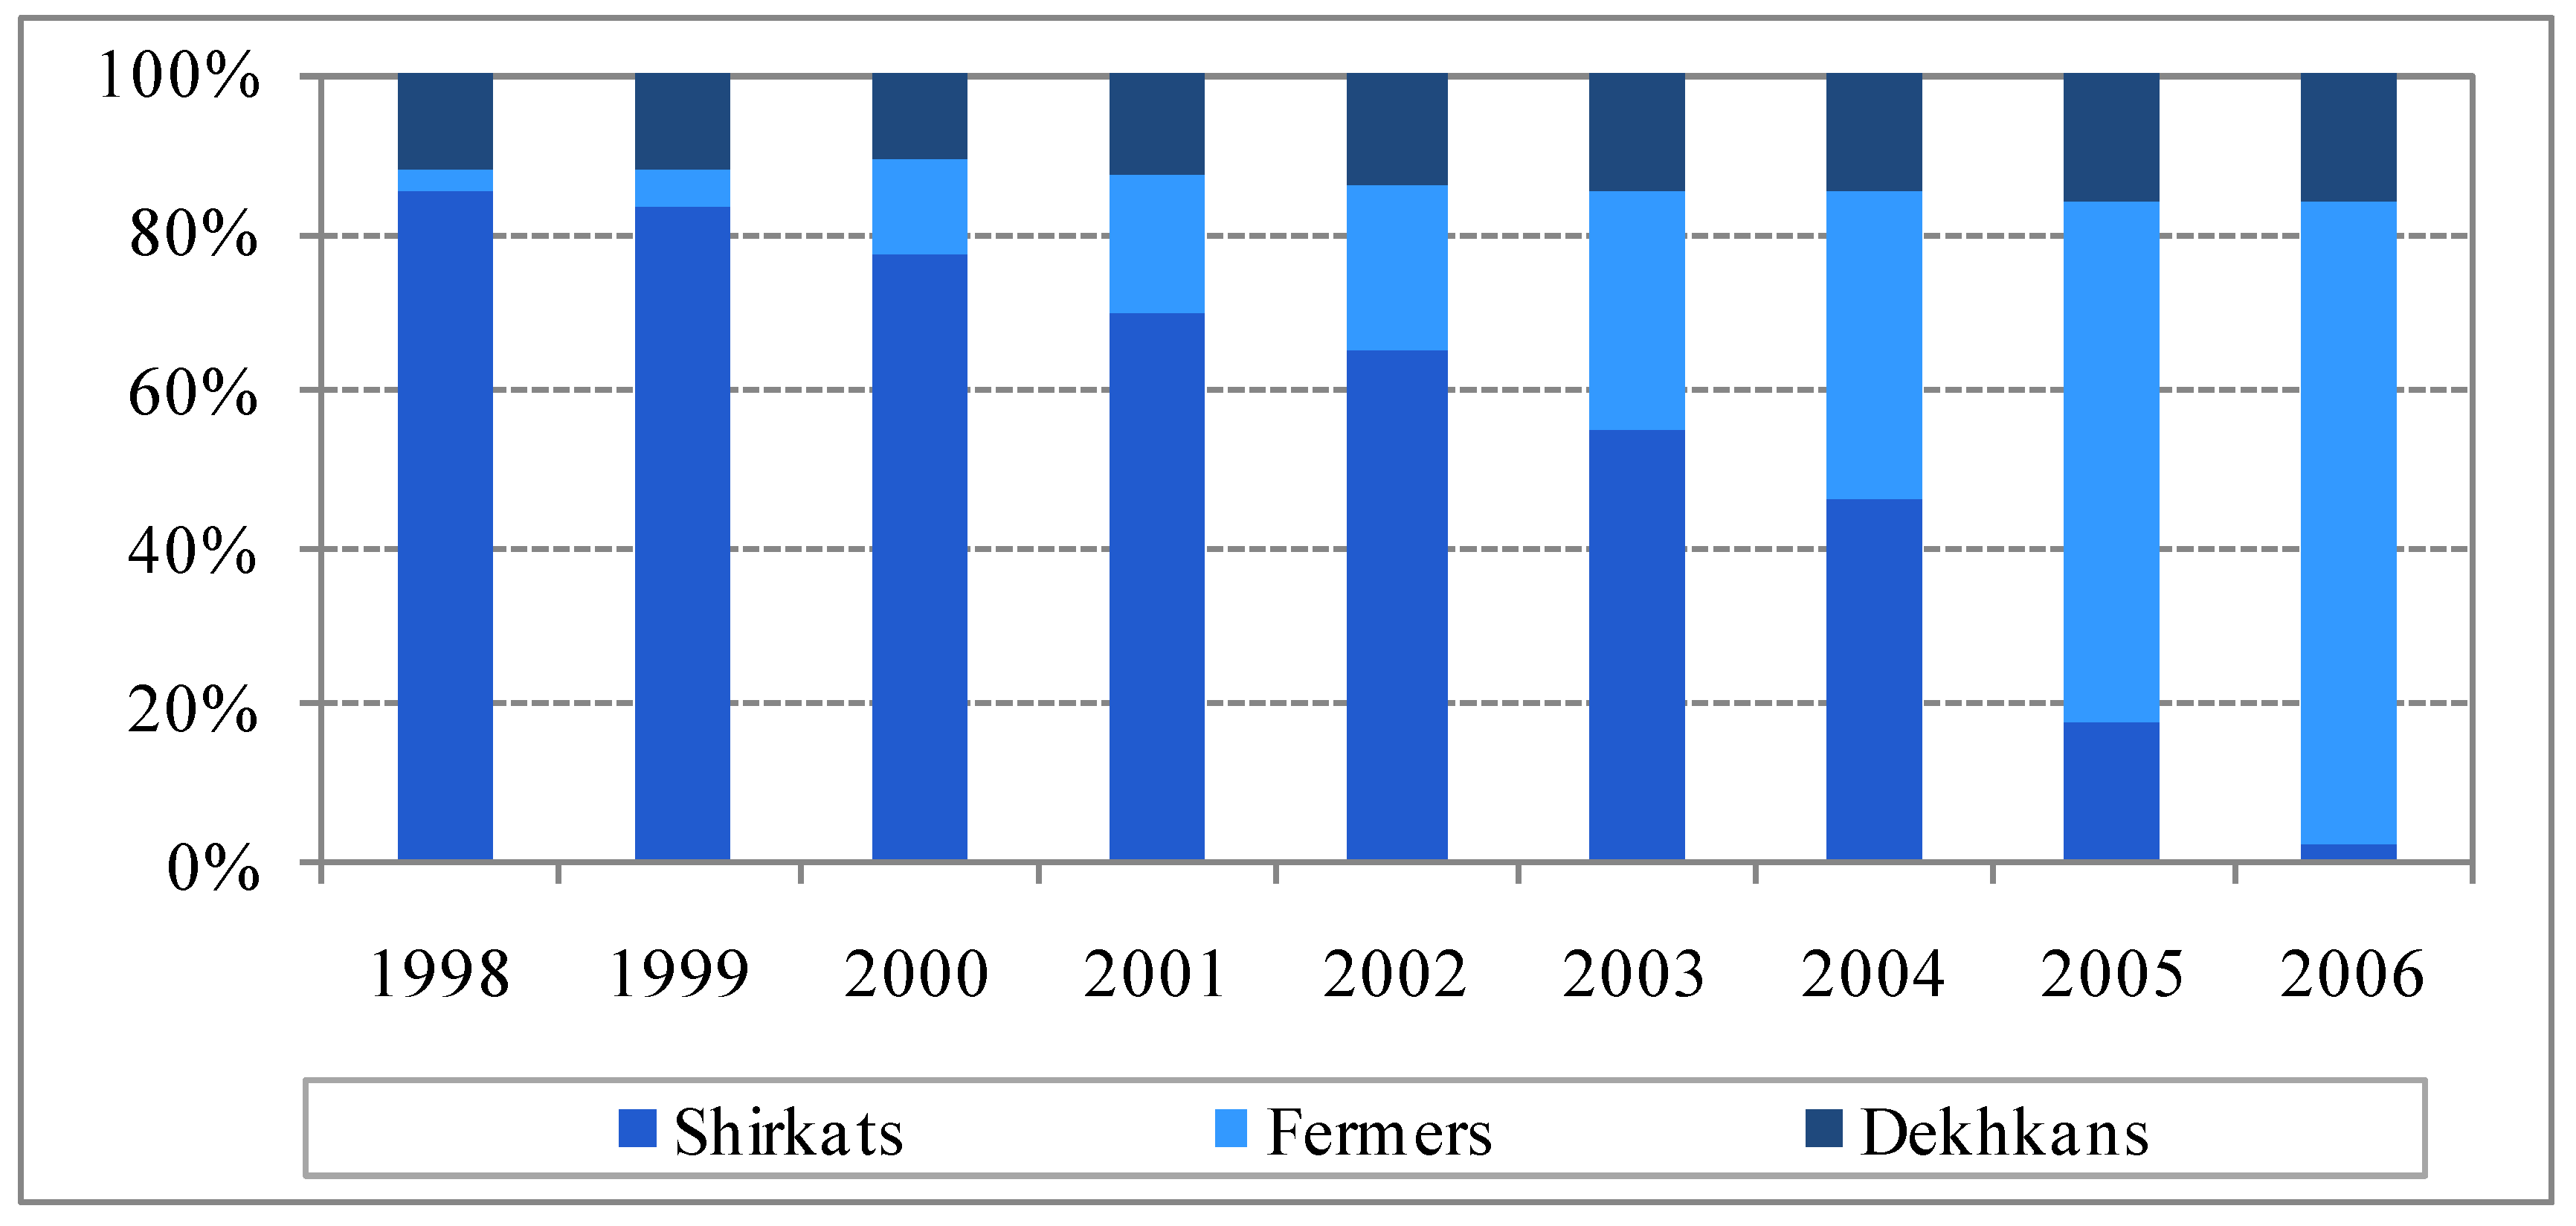
2.3. Land Privatization

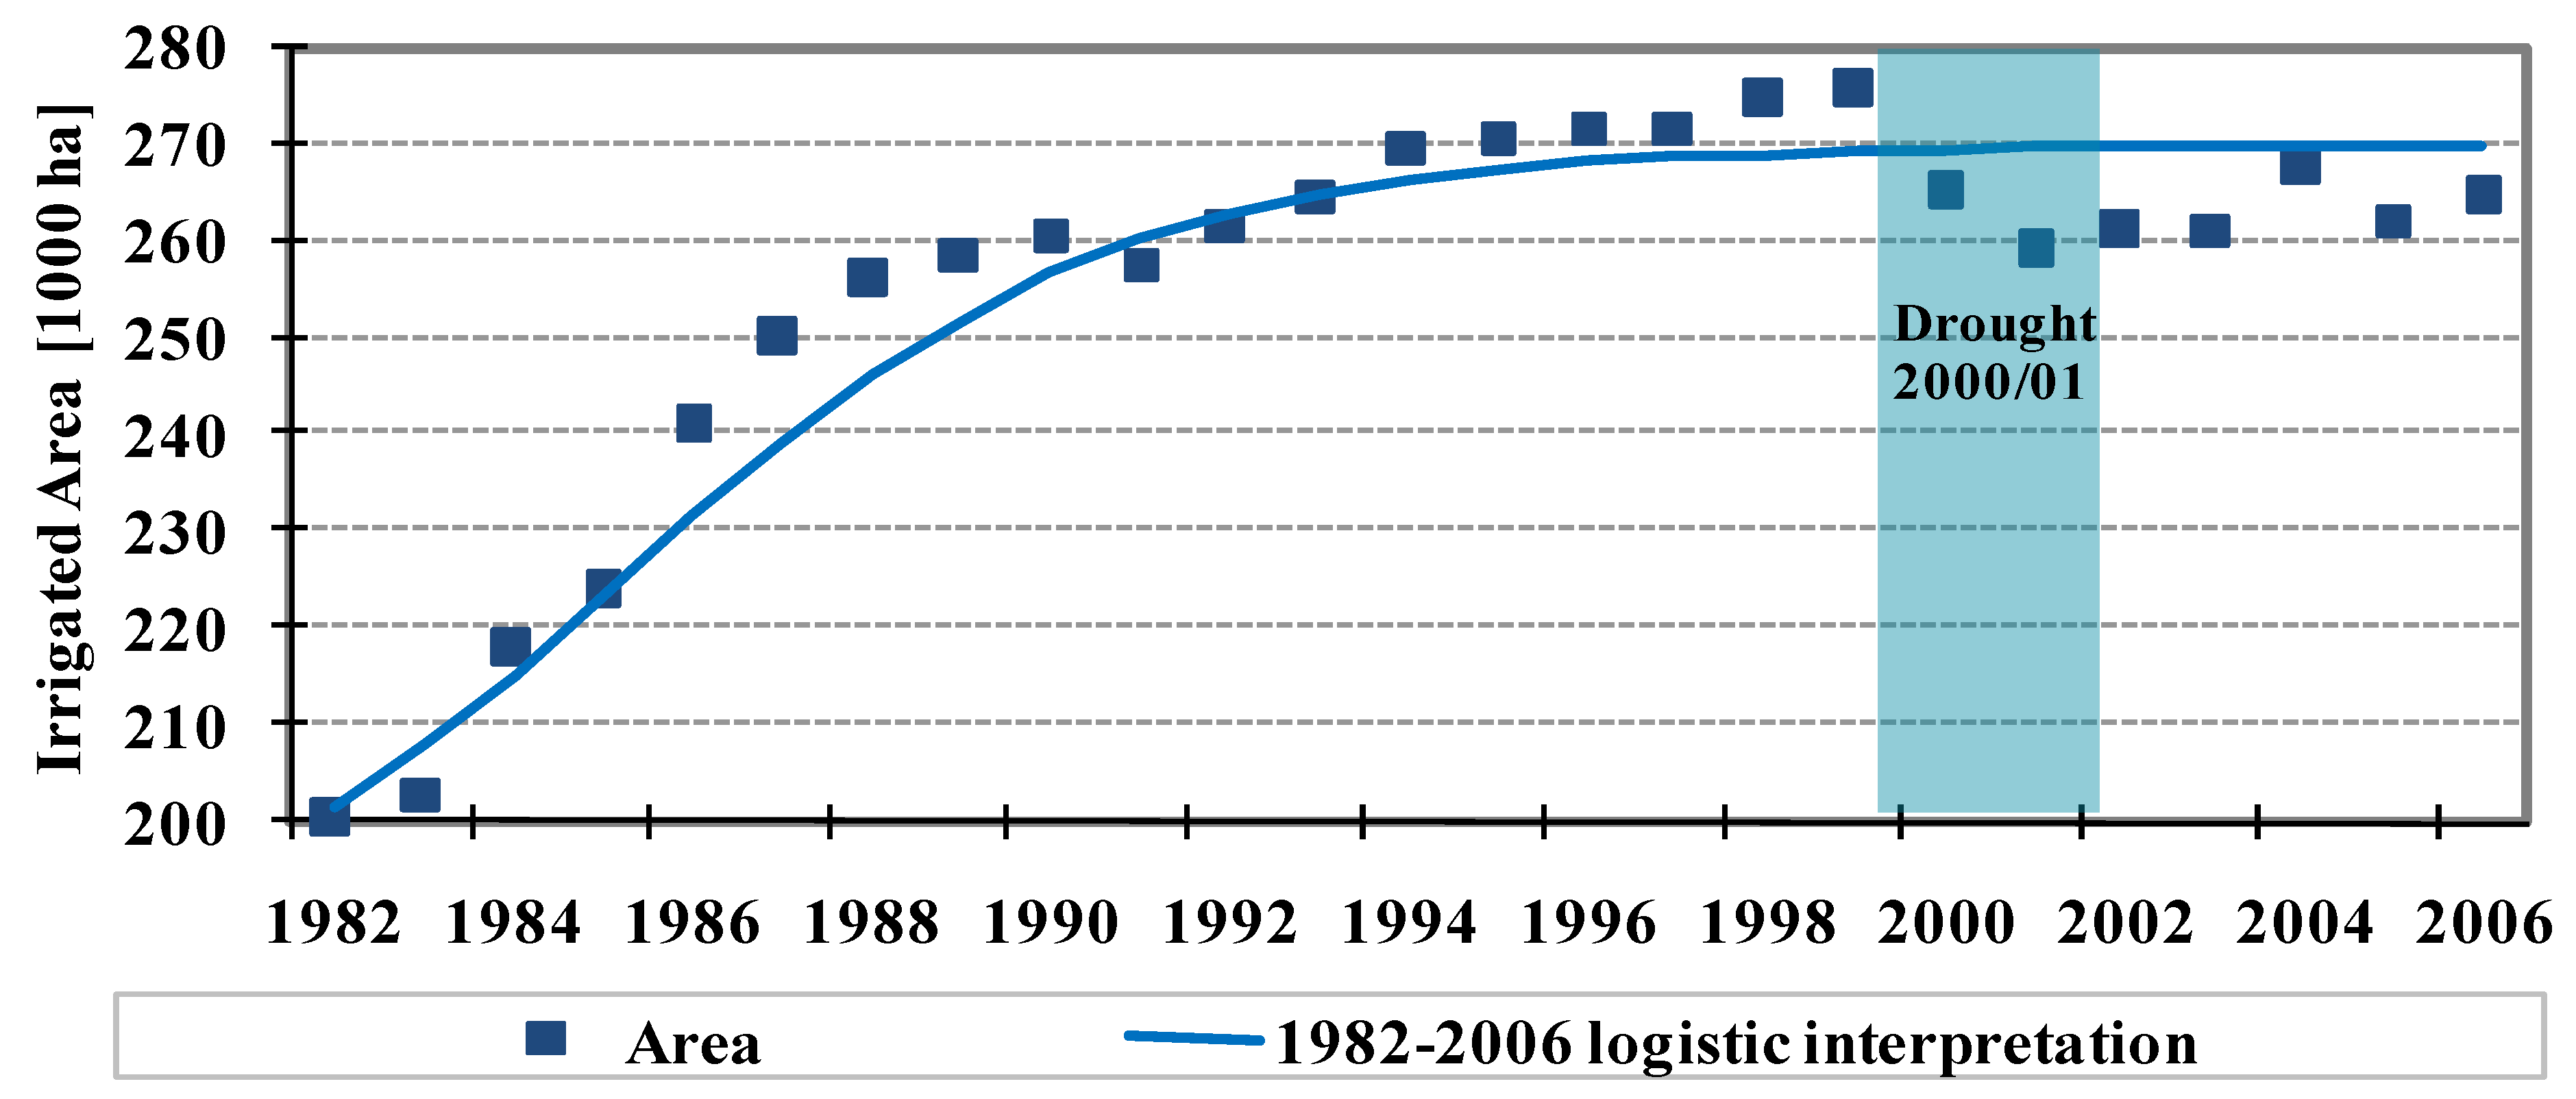
2.4. Irrigation Water Use
2.5. Water and Land Productivity; Productivity Differentiation; and Water Access Assessment Methodology
3. Results and Discussion
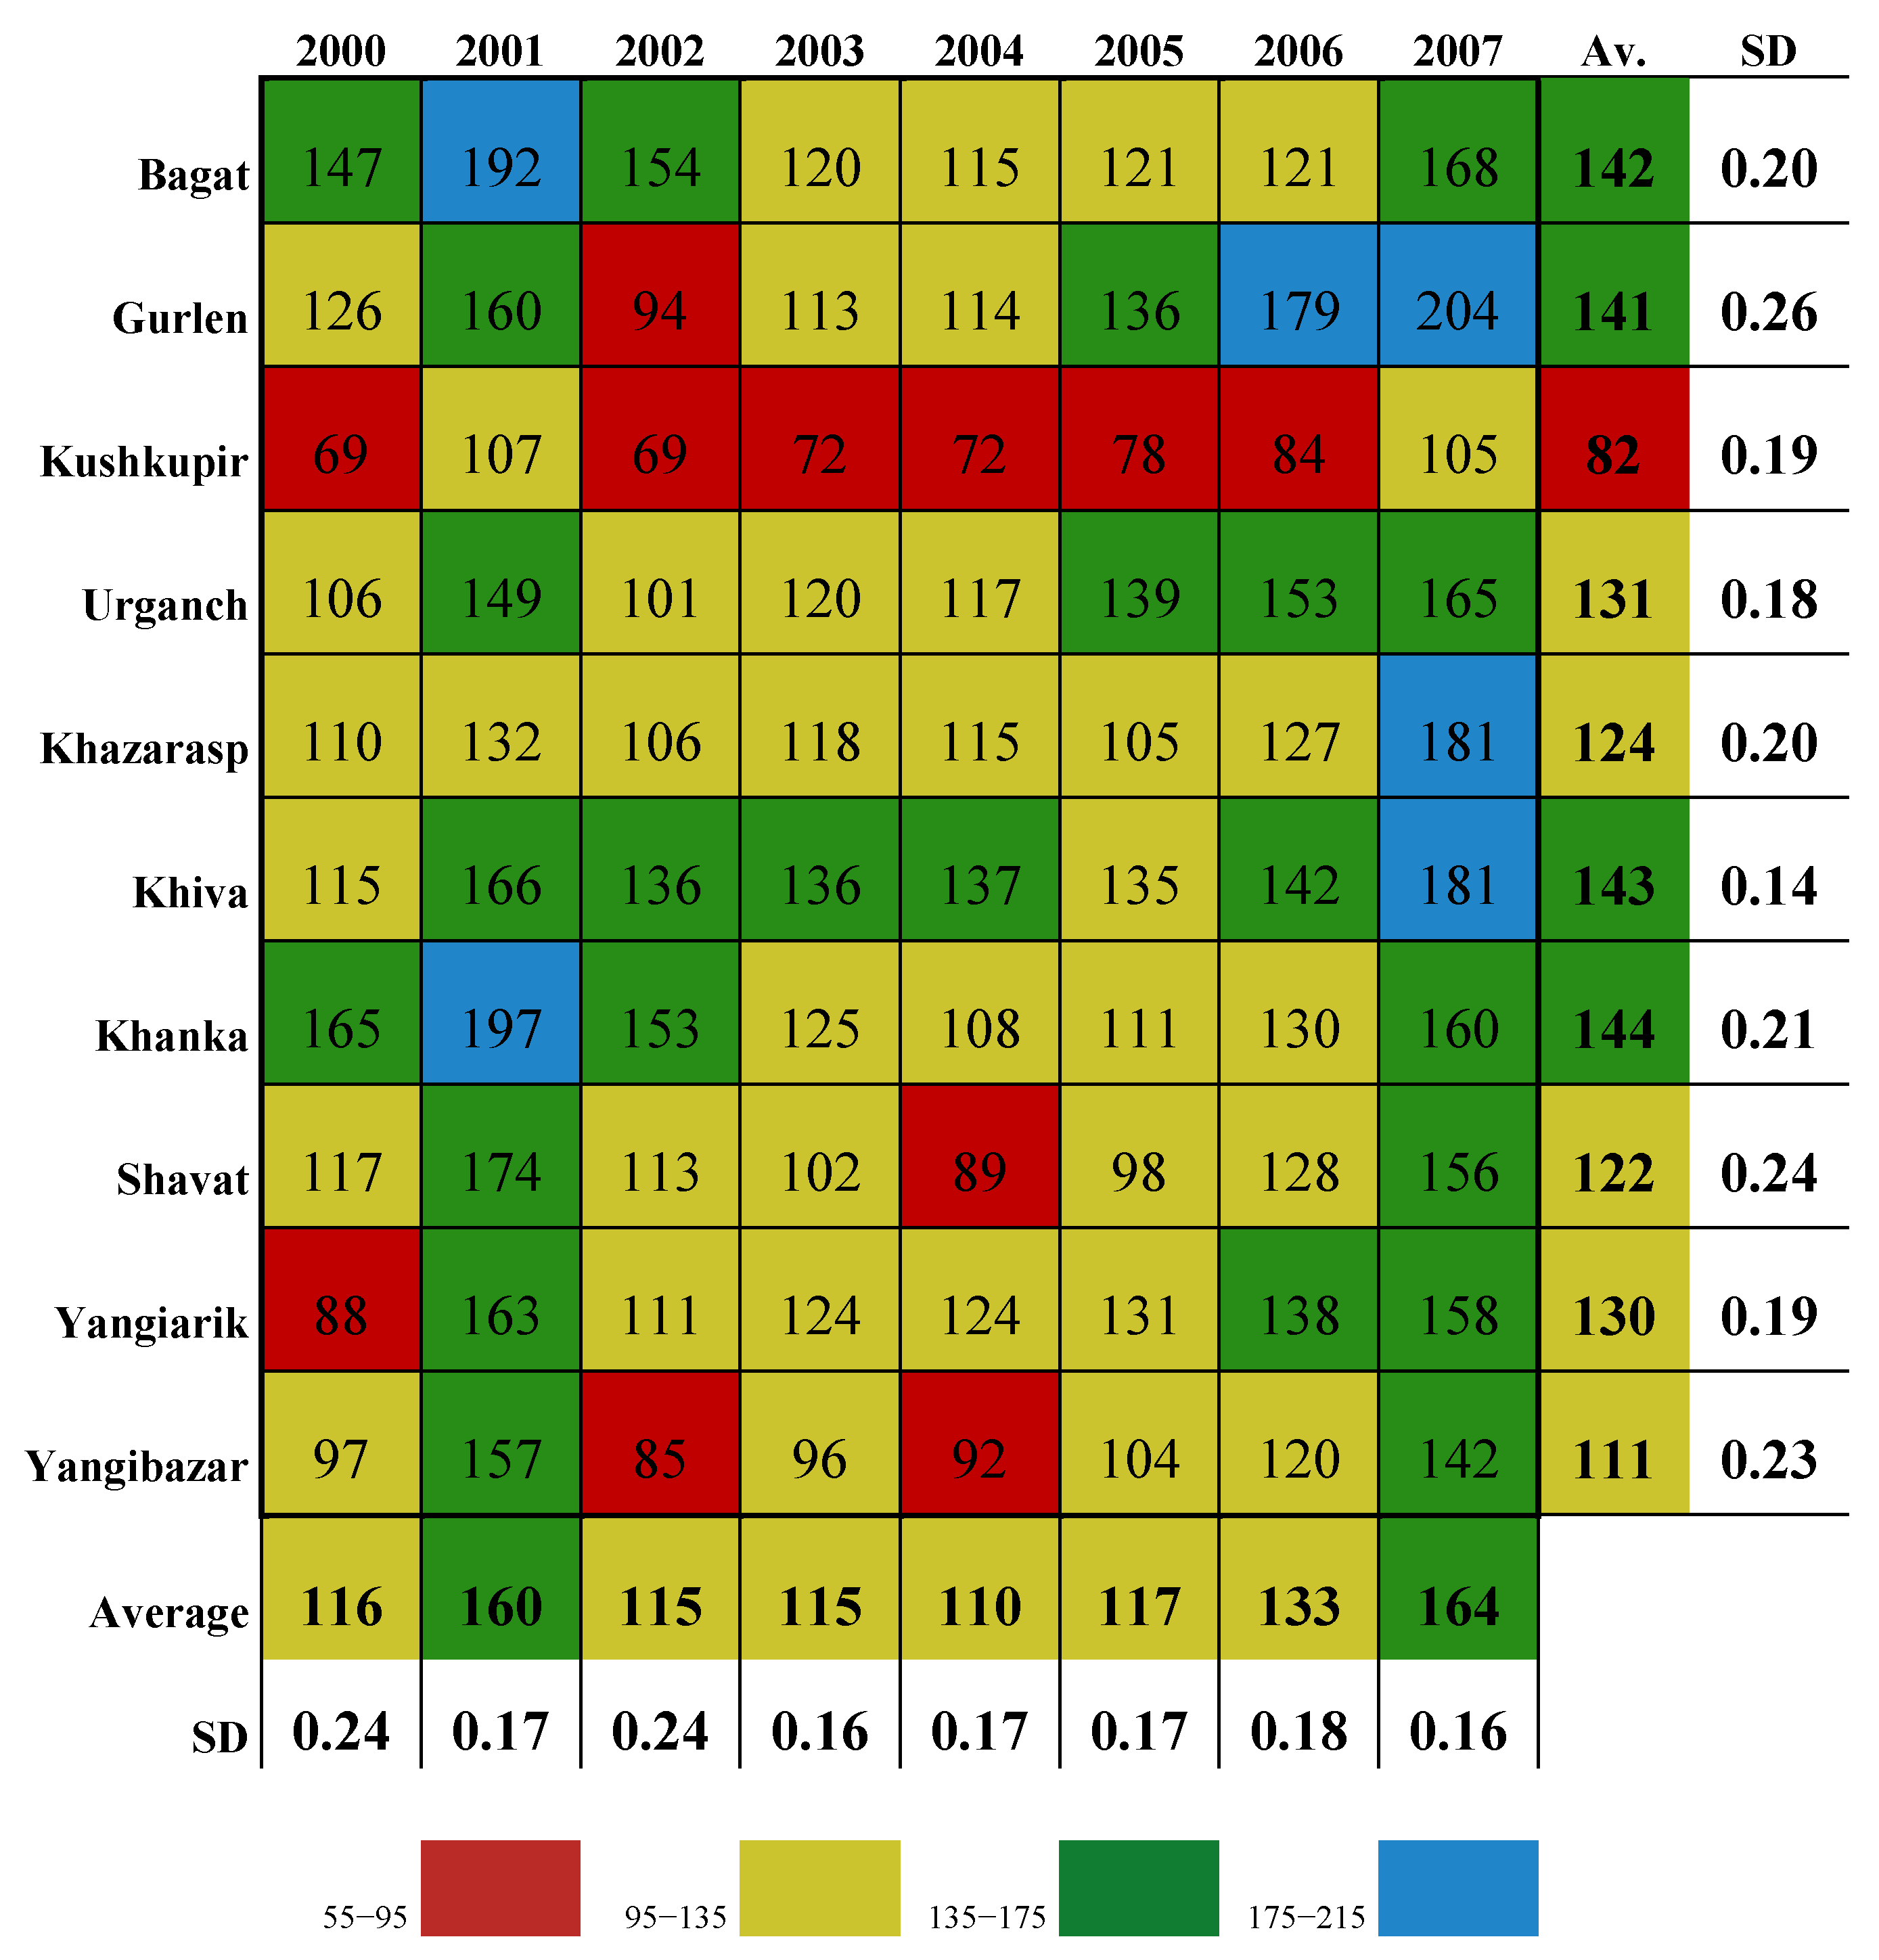
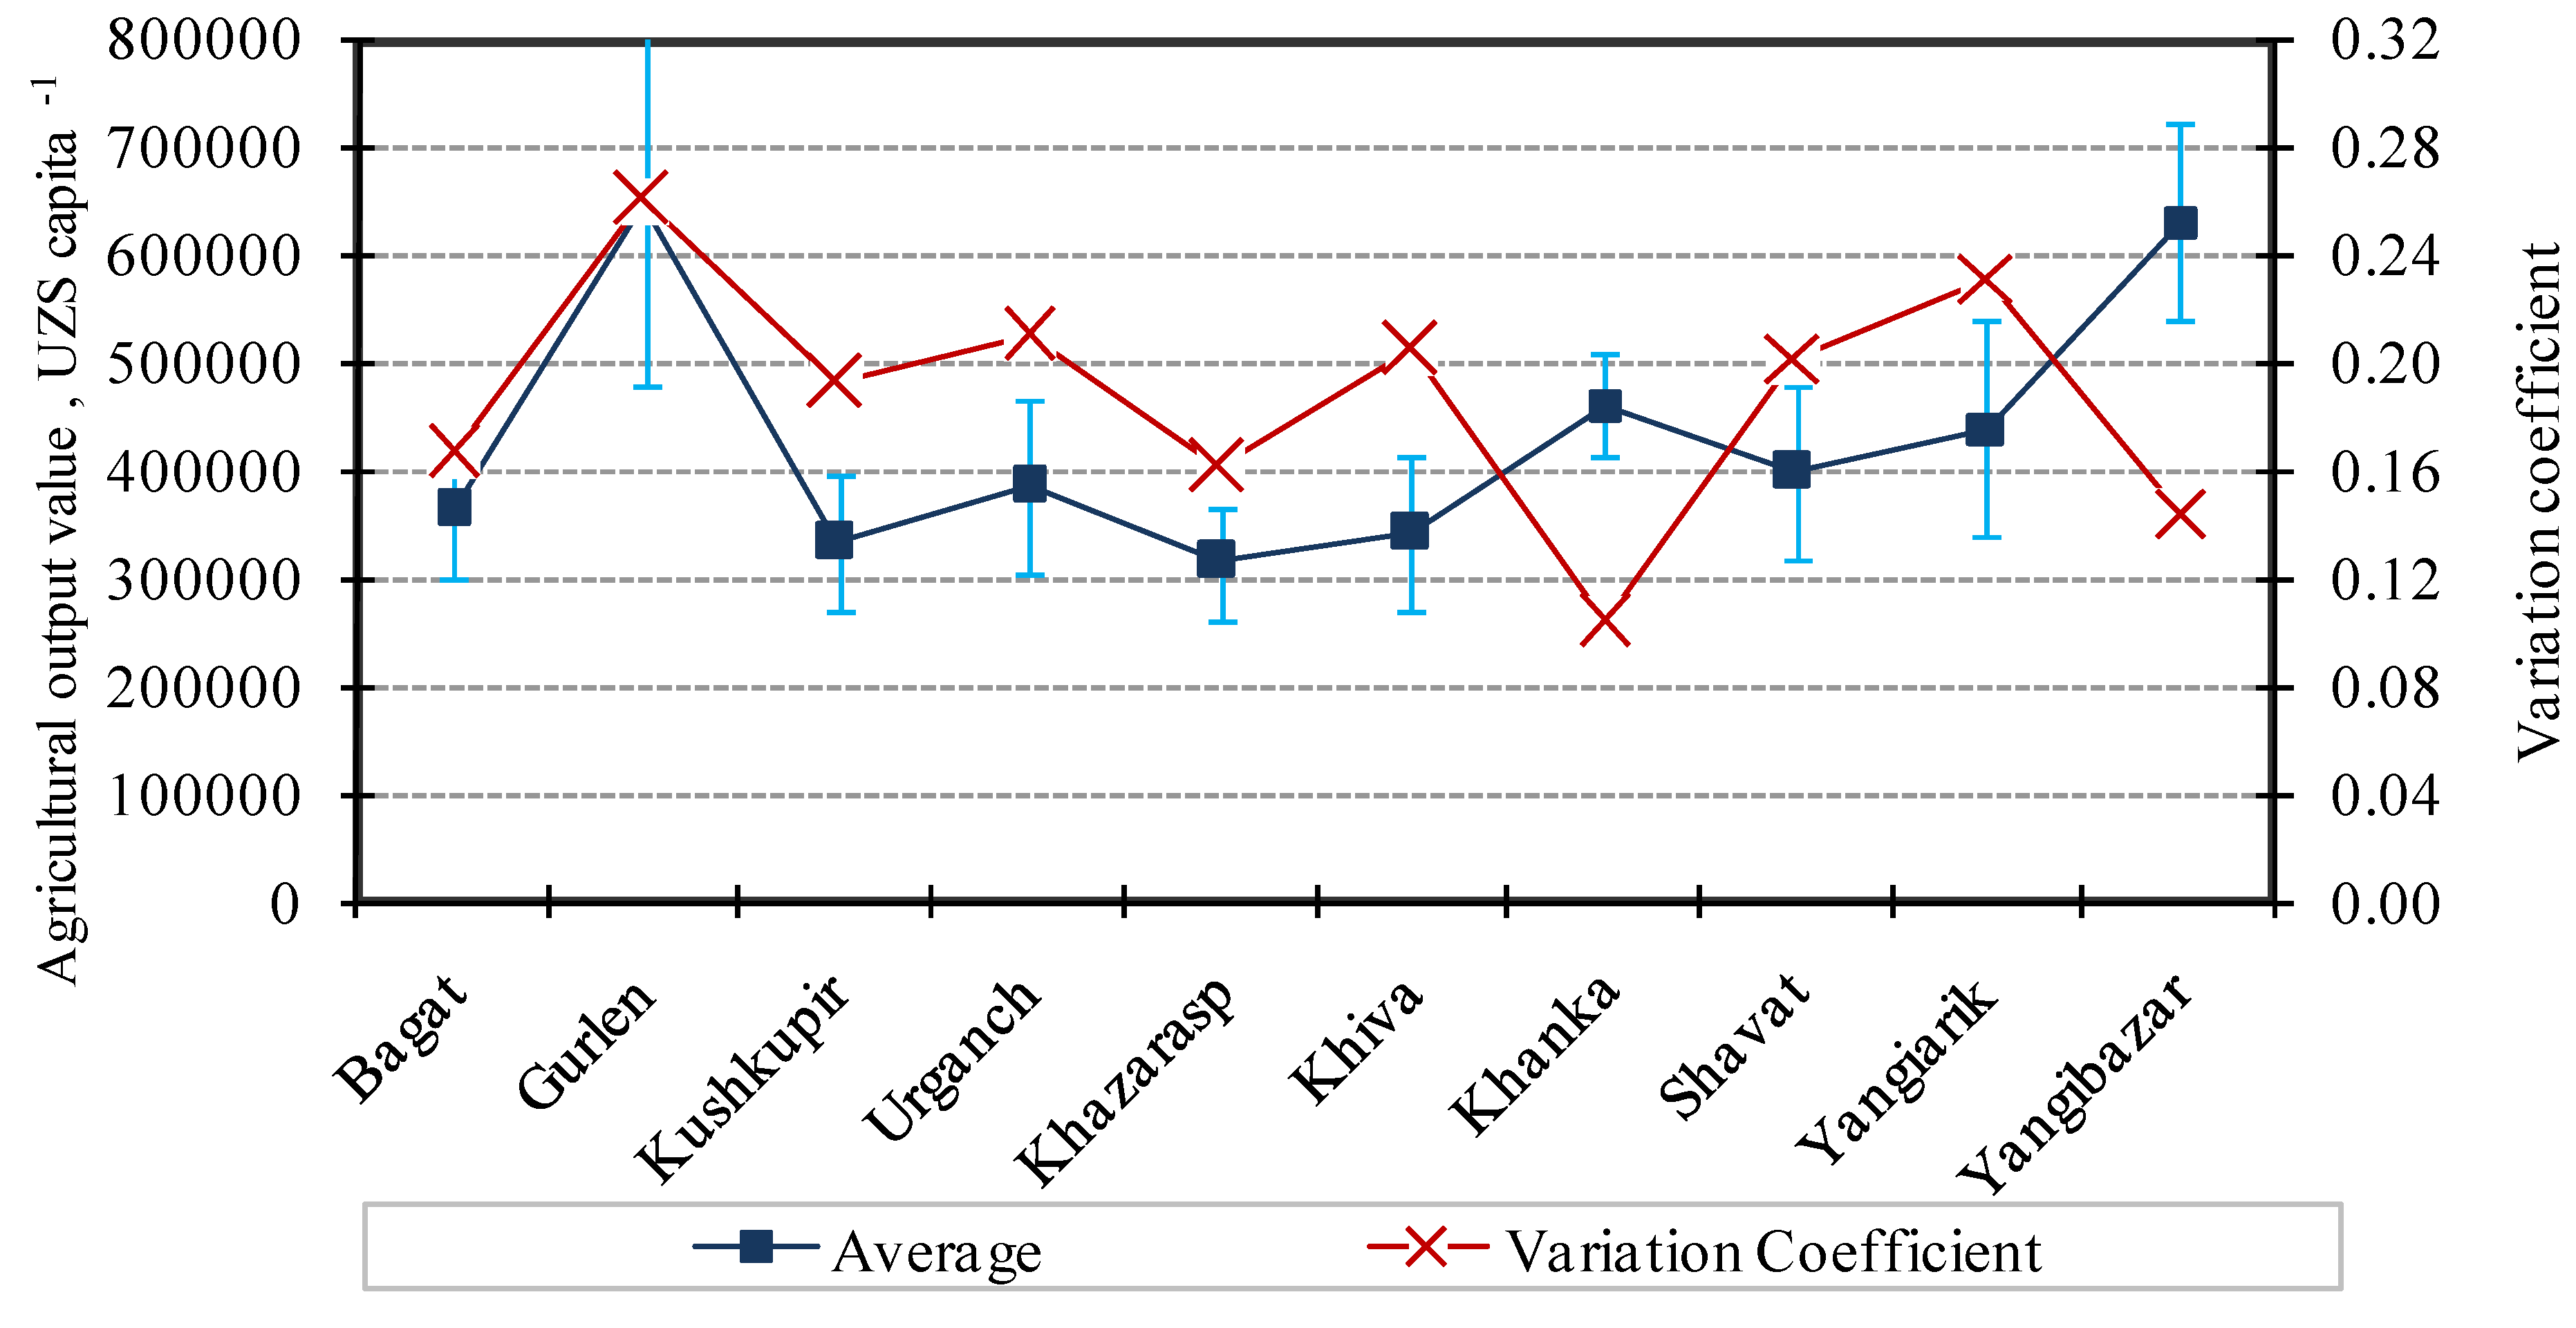
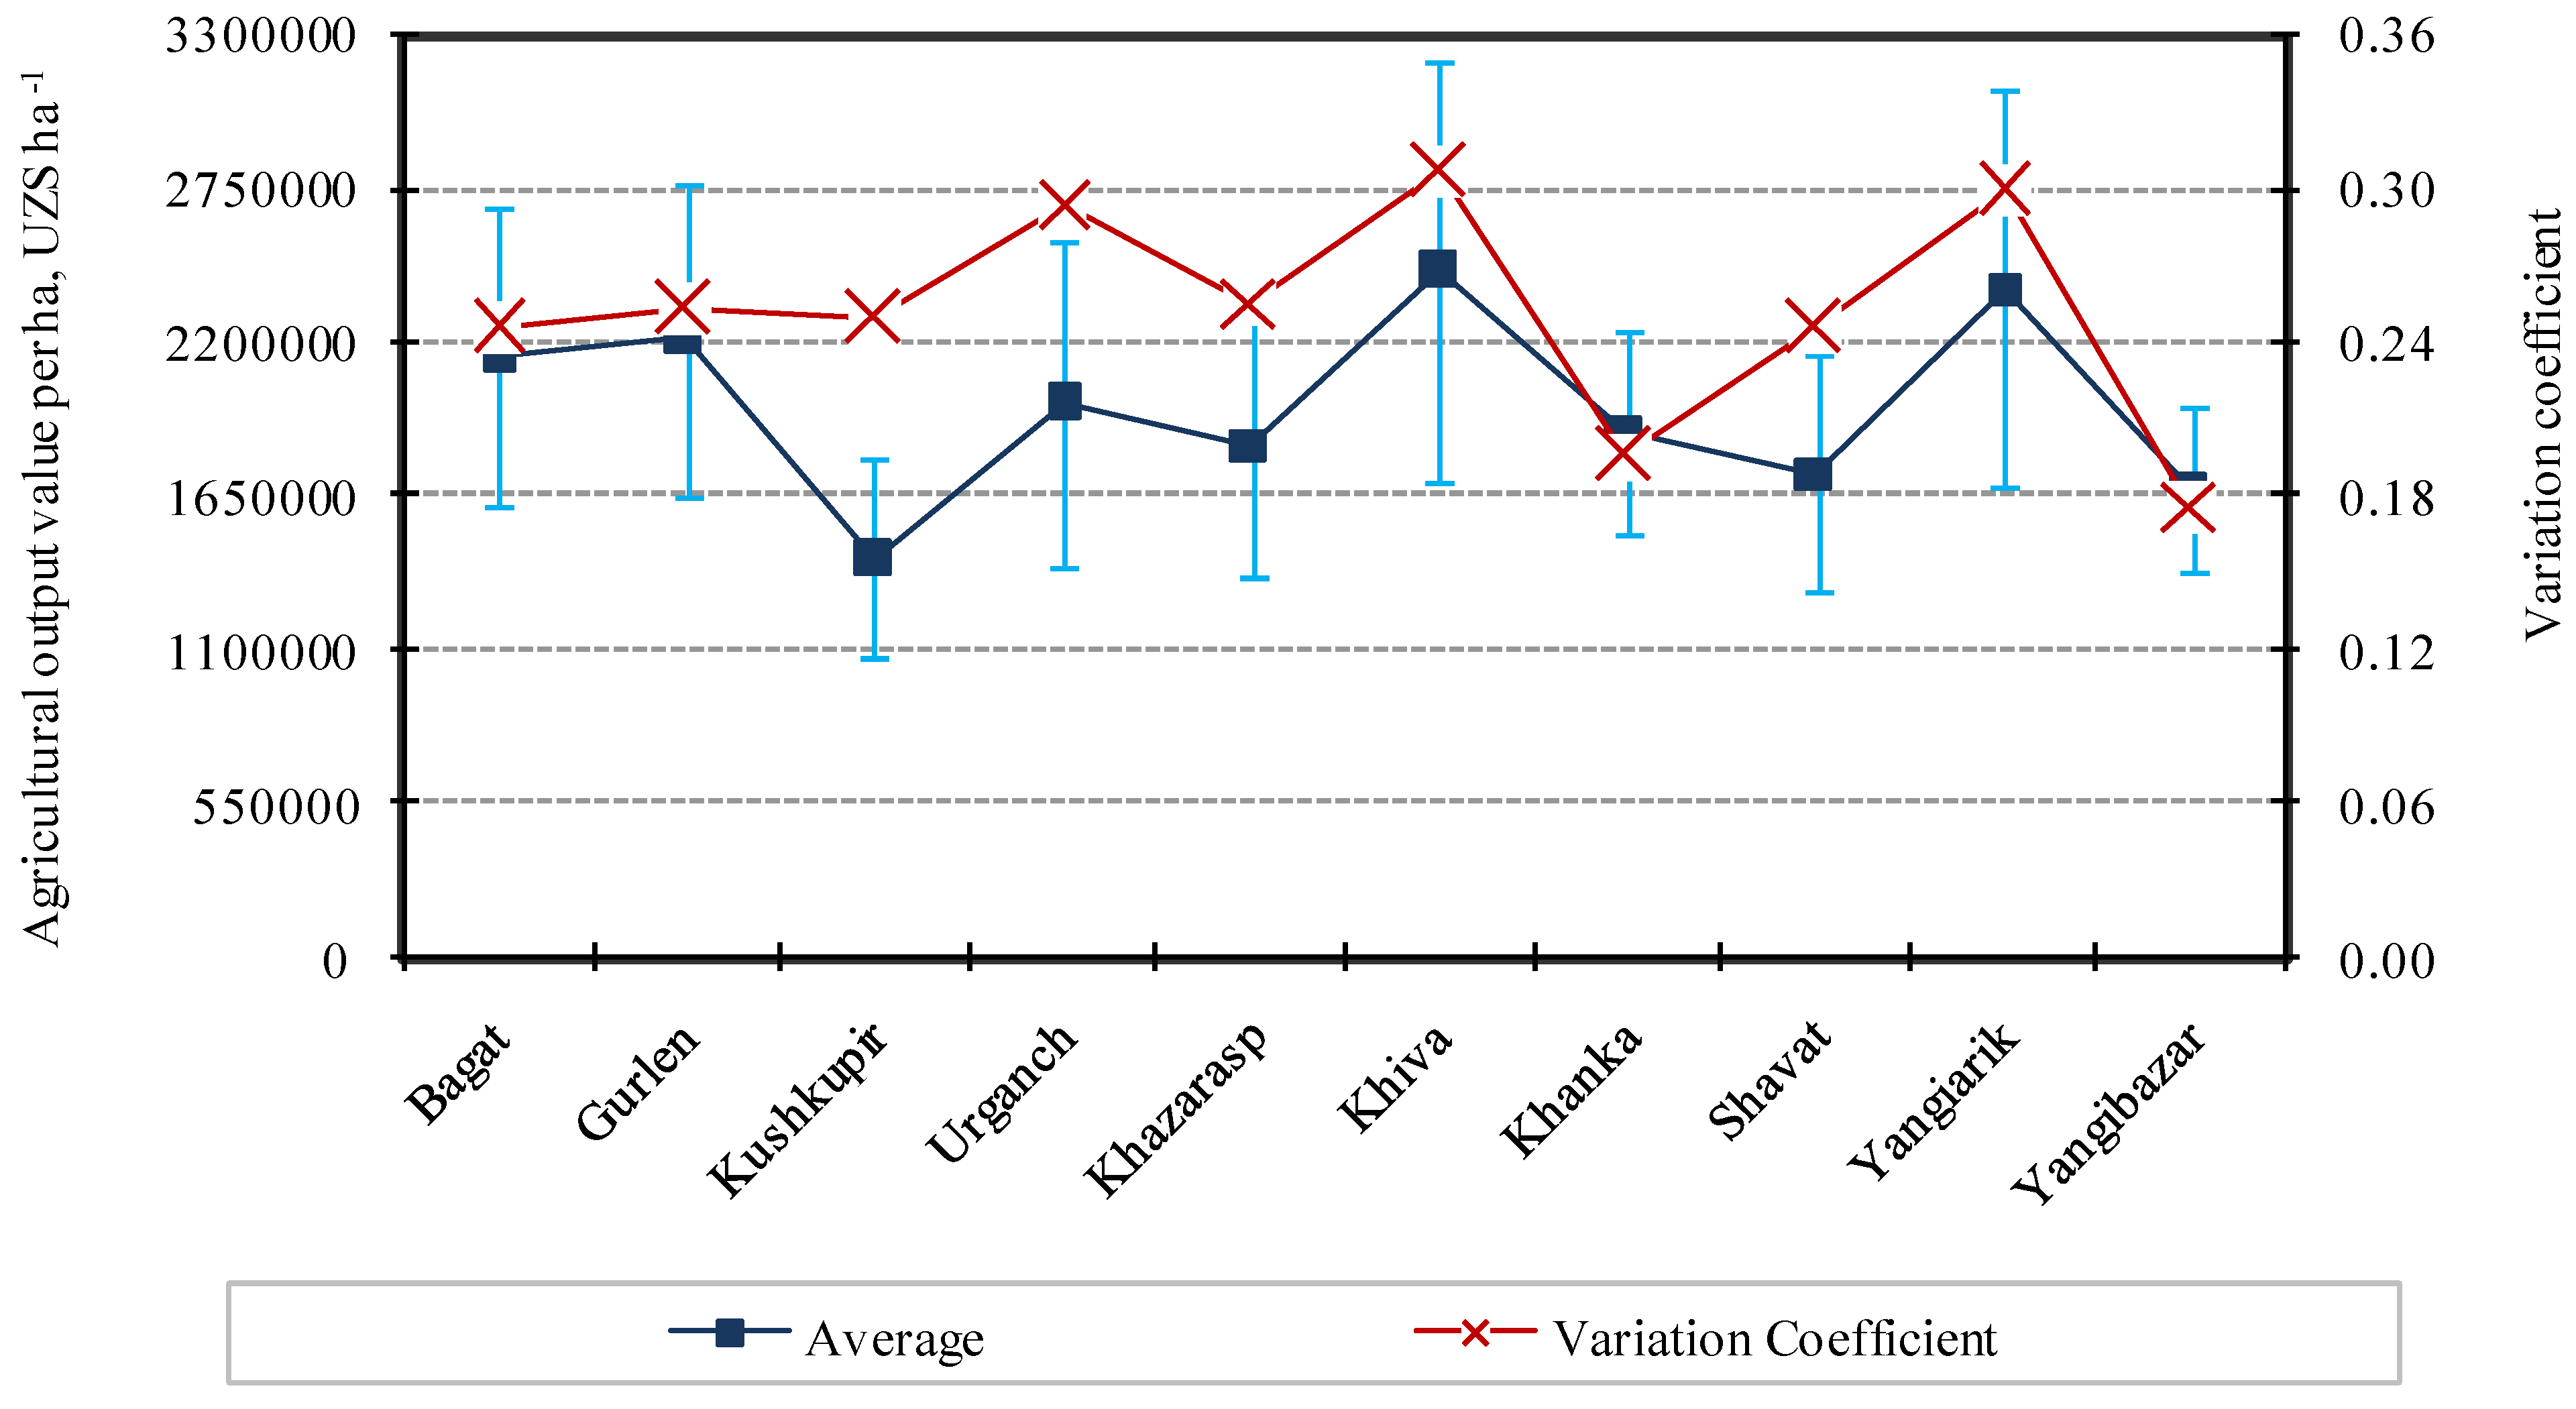
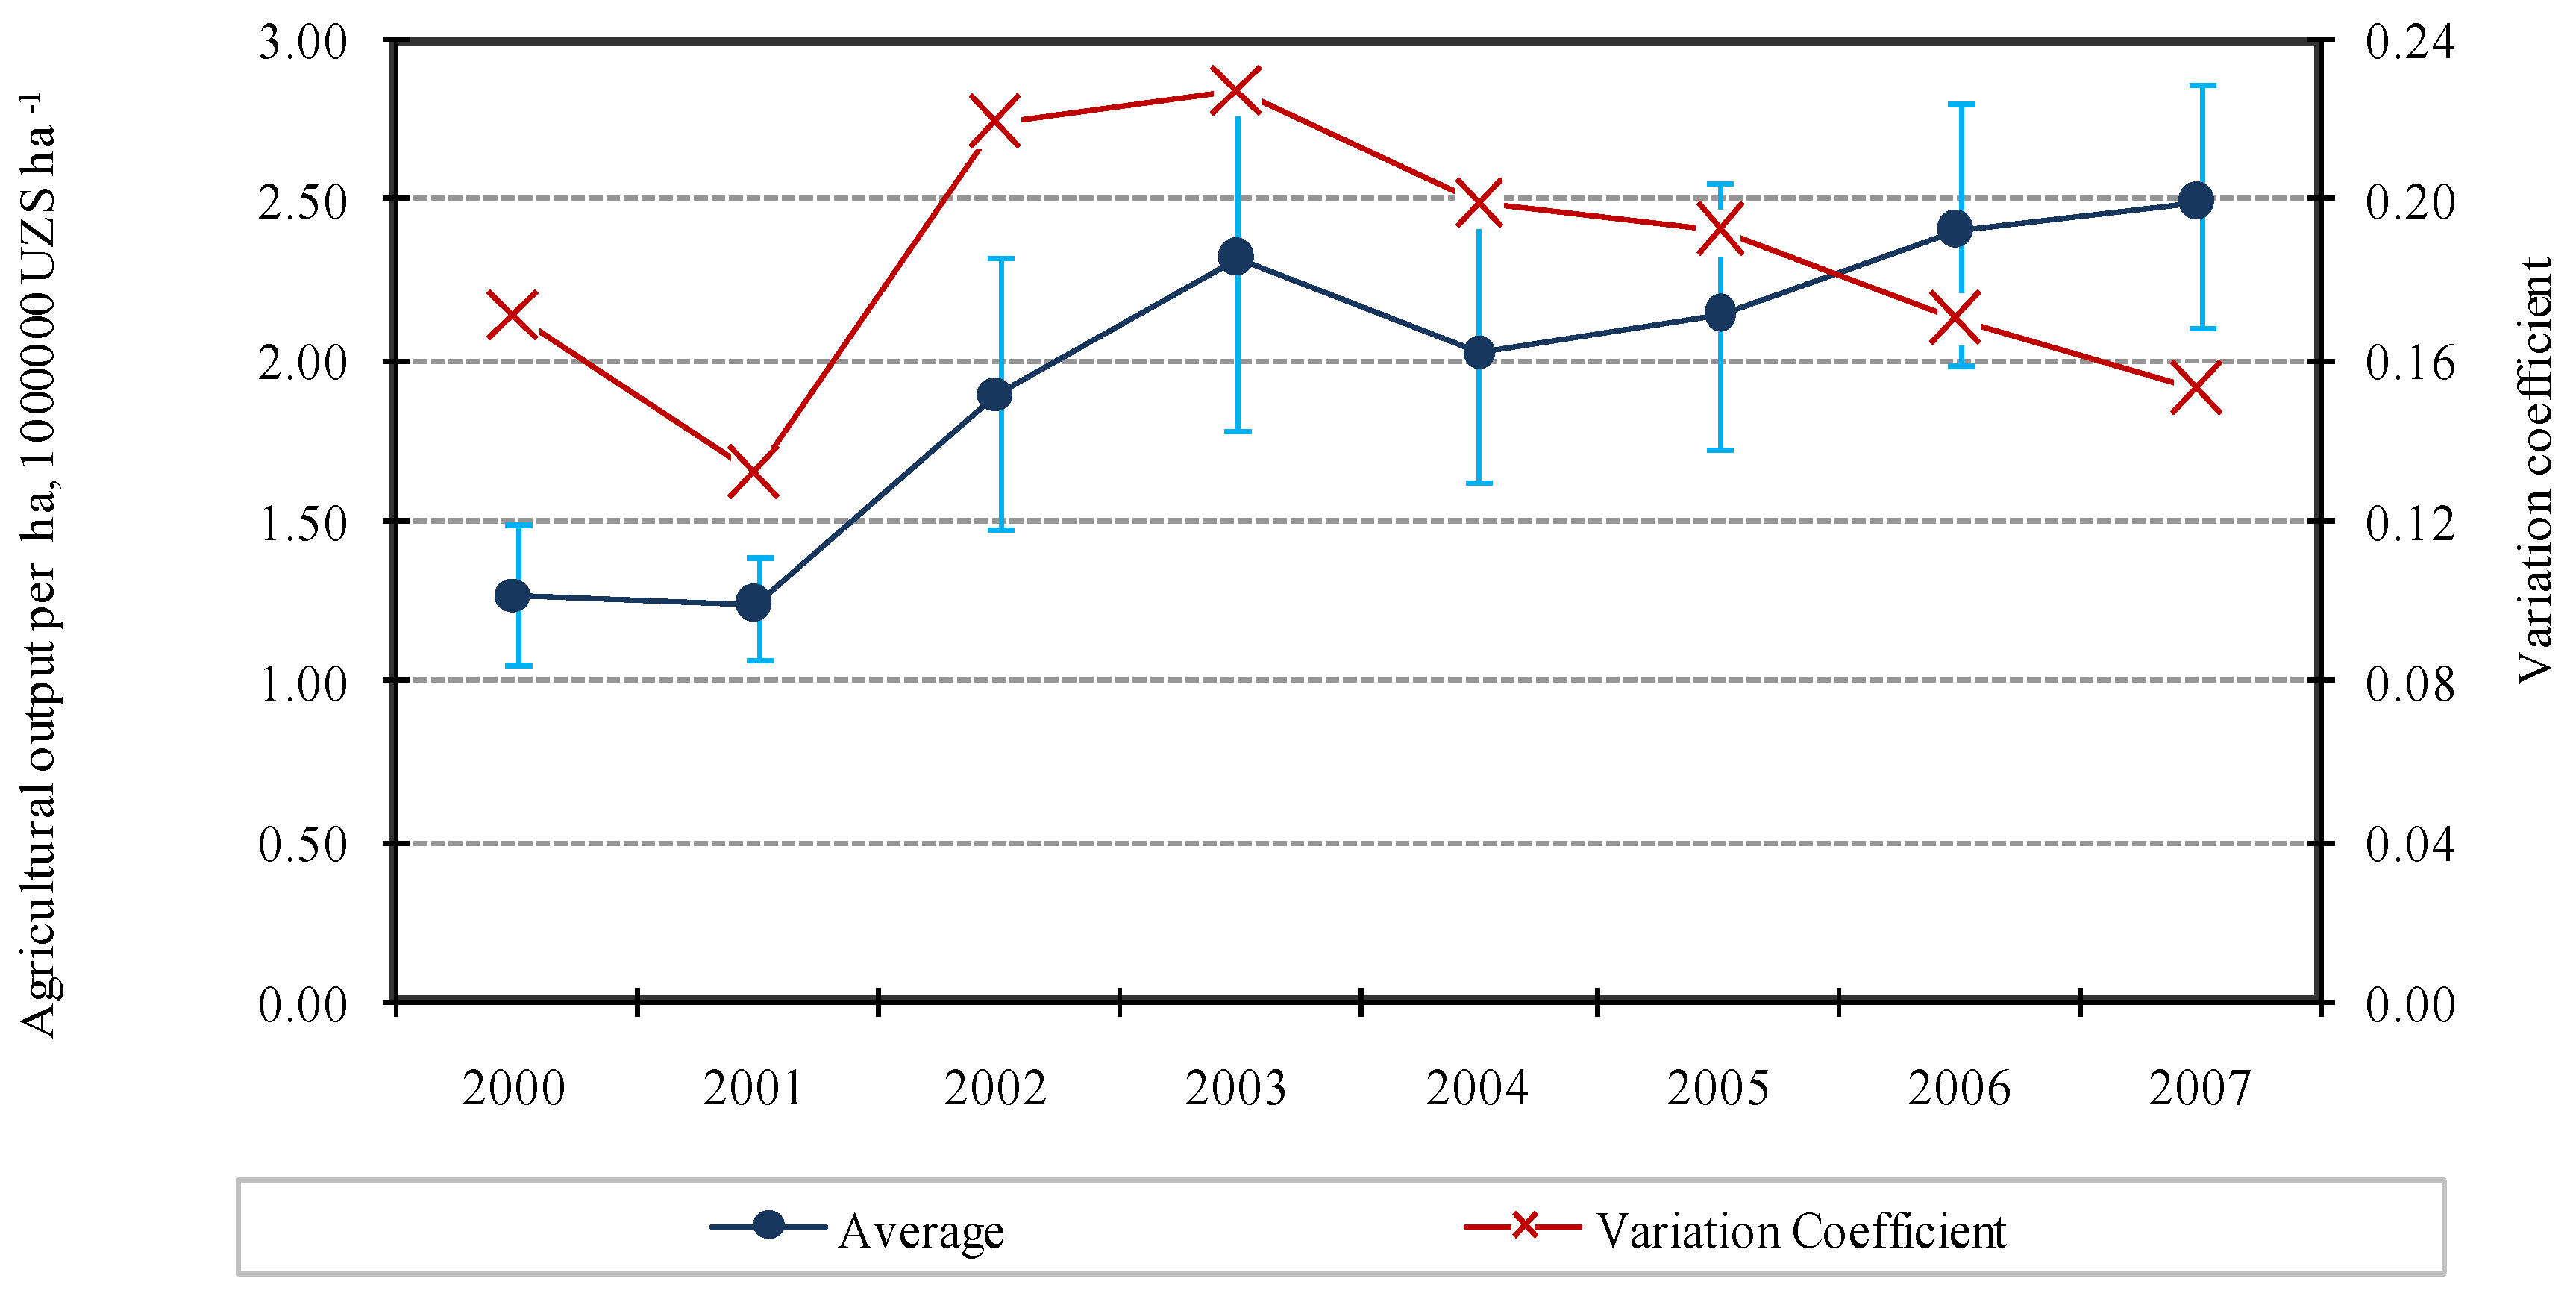
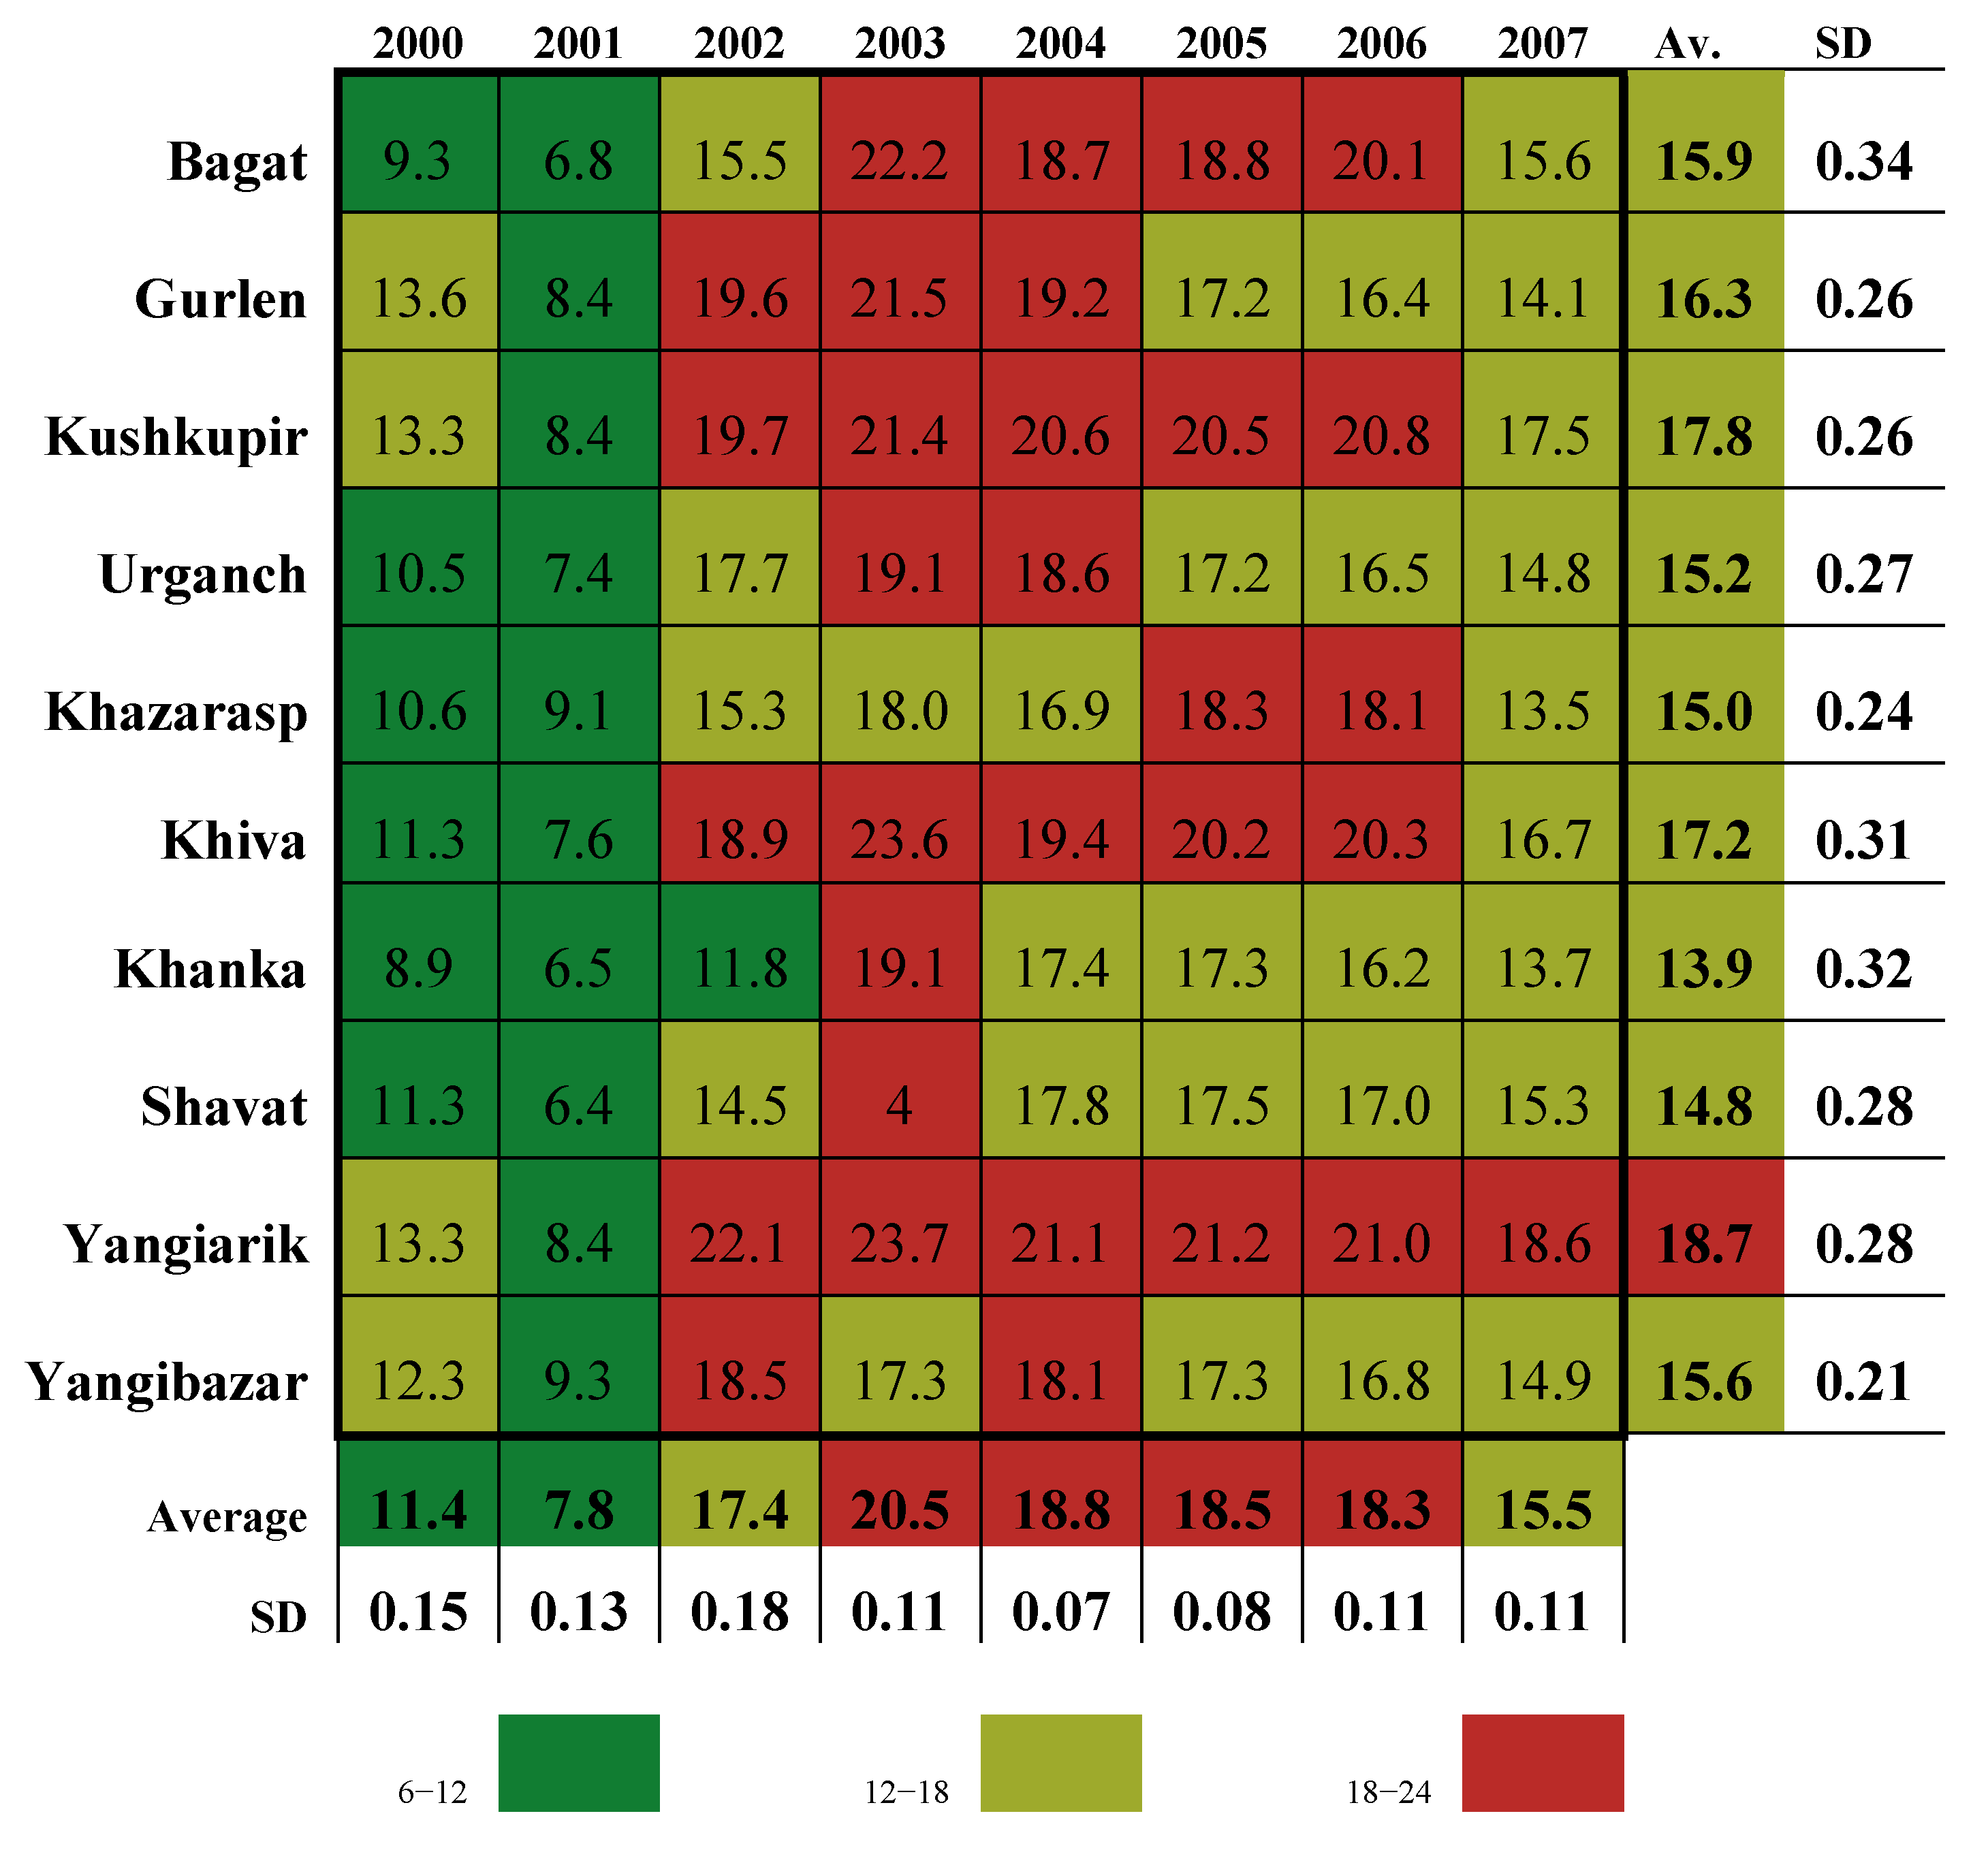
3.1. Analysis of Land Productivity
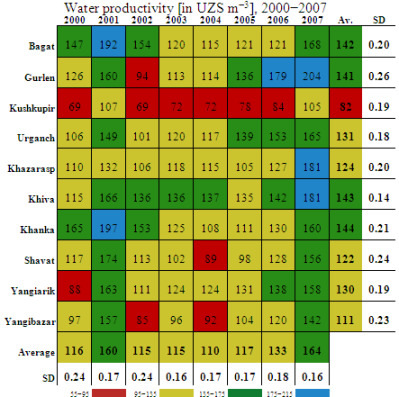
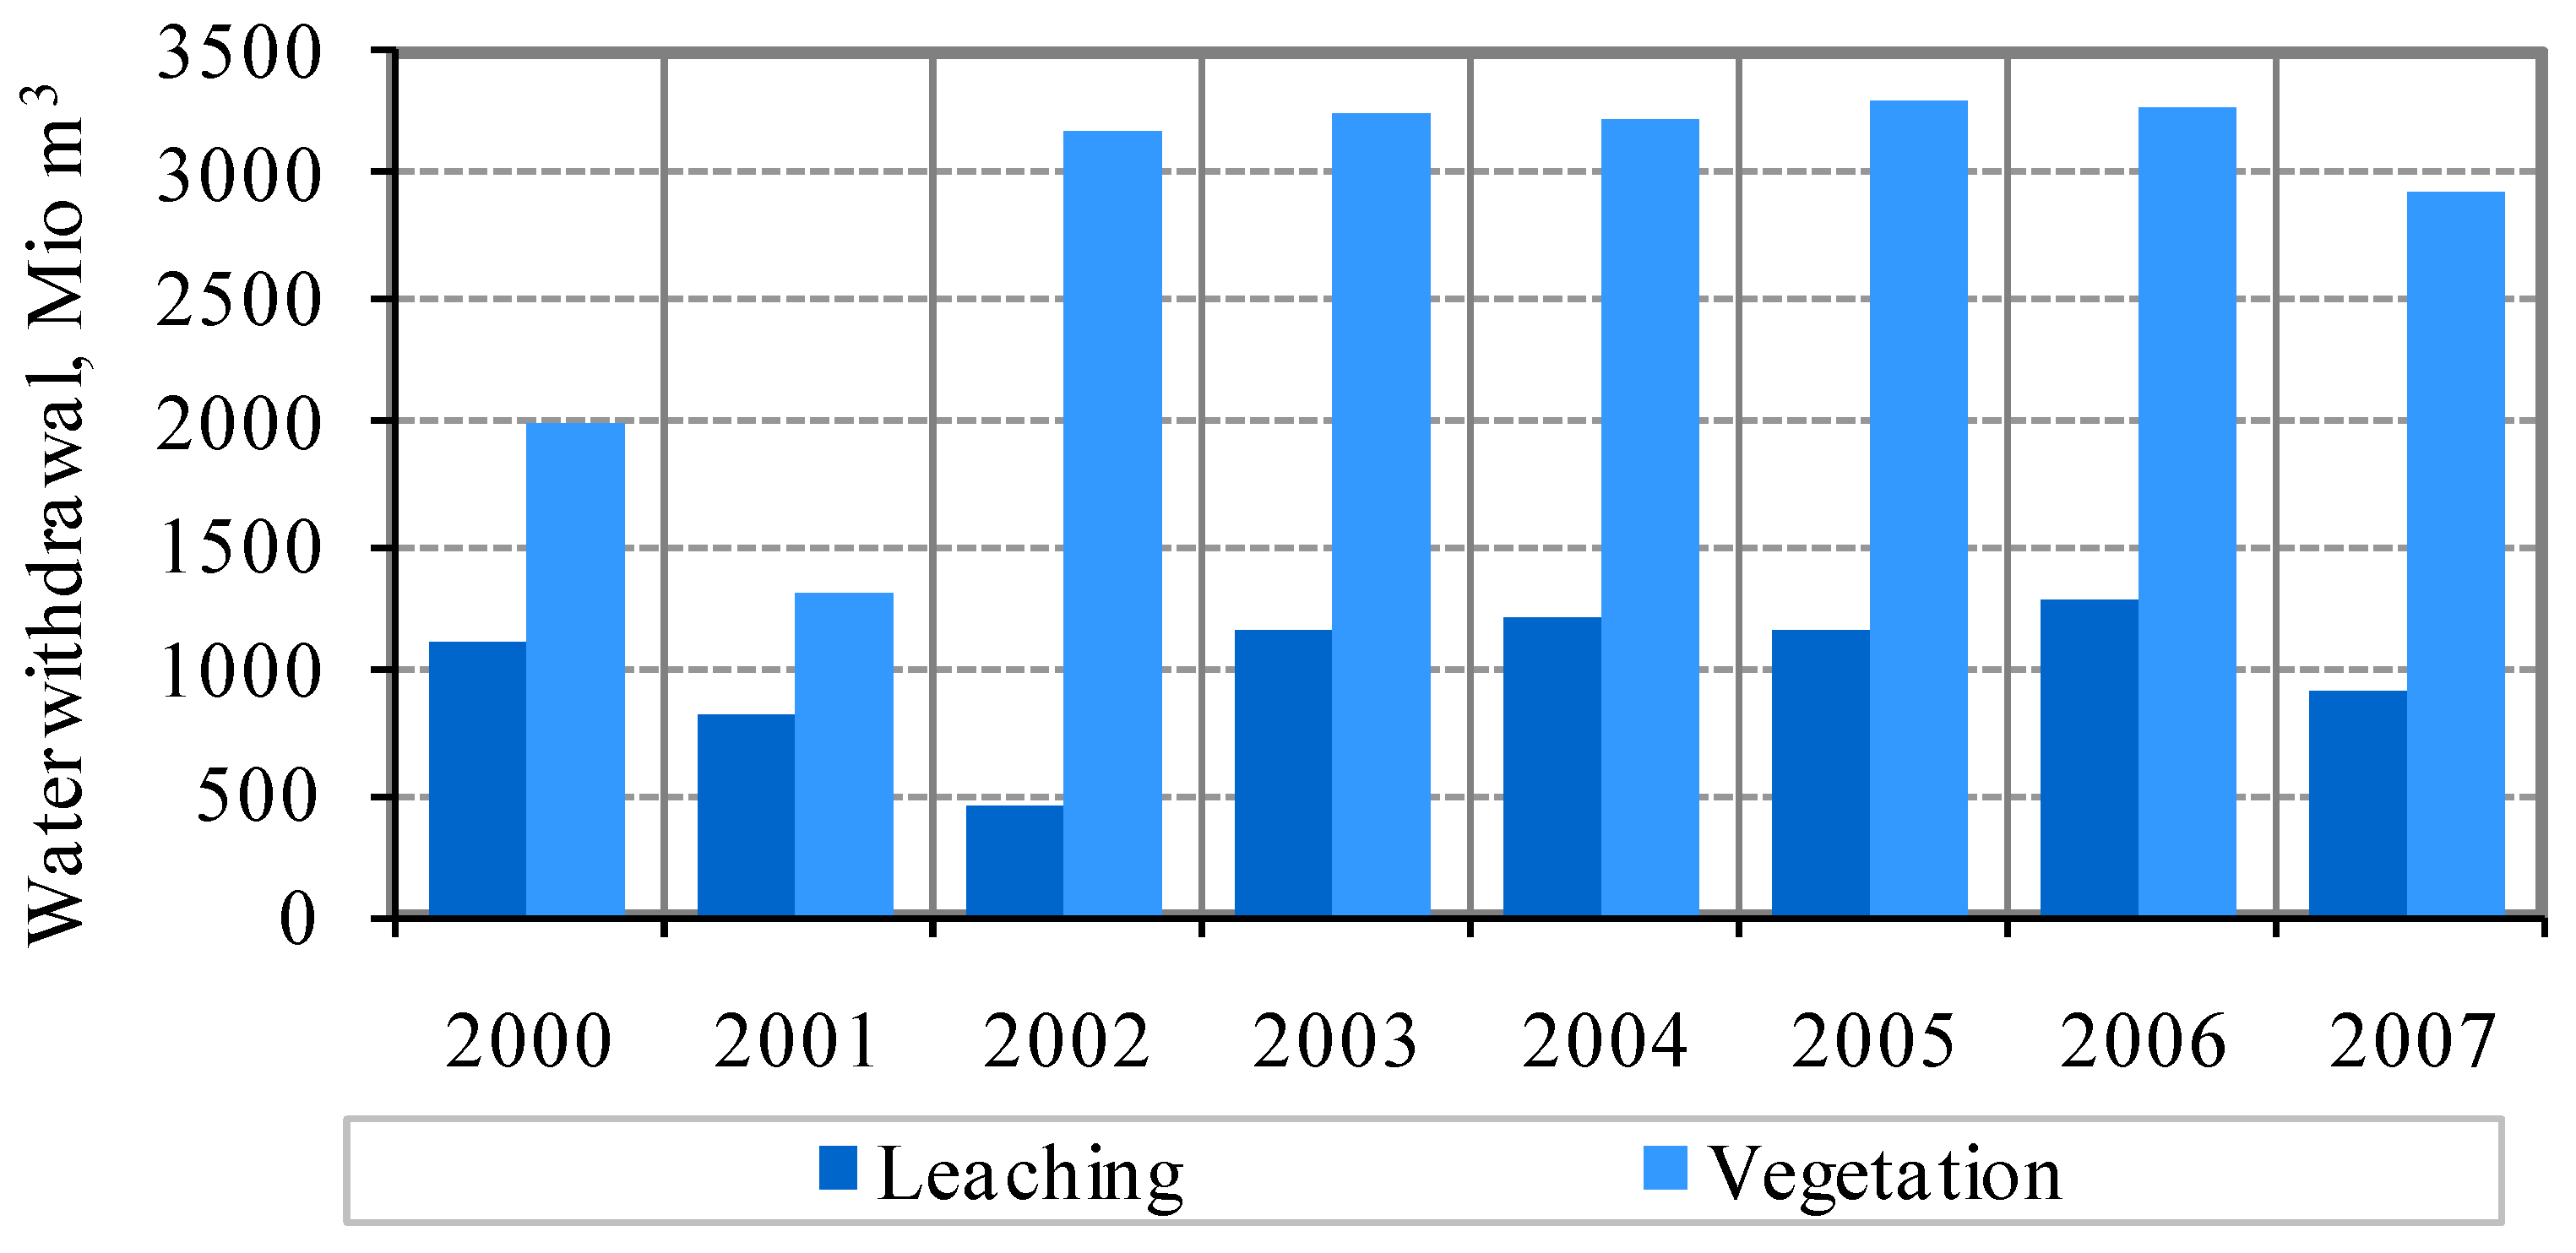
3.2. Irrigation Water Use and Productivity

3.3. Linkages between Water Availability and Income Differentiation

4. Summary and Conclusions
Acknowledgements
References
- Wegerich, K. A critical review of the concept of equity to support water allocation at various scales in the Amudarya basin. Irrig. Drain. Syst. 2007, 21, 185–195. [Google Scholar]
- Integrated Water Resources Management; TAC Background Papers No. 4. Global Water Partnership (GWP): Stockgolm, Sweden, 2000. Available online: http://www.gwptoolbox.org/images/stories/gwplibrary/background/tac_4_english.pdf (accessed on 15 August 2010).
- Abdullayev, I.; De Fraiture, Ch.; Giardano, M.; Yakubov, M.; Rasulov, A. Agricultural water use and trade in Uzbekistan: Situation and potential impacts of market liberalization. Water Resour. Dev. 2009, 1, 47–63. [Google Scholar] [CrossRef]
- Conrad, C.; Dech, S.W.; Hafeez, M.; Lamers, J.P.A.; Martuis, C.; Strunz, G. Mapping and assessing water use in a Central Asian irrigation system by utilizing MODIS remote sensing products. Irrig. Drain. Syst. 2007, 21, 197–218. [Google Scholar] [CrossRef]
- Martius, C.; Lamers, J.P.A.; Wehrheim, P.; Schoeller-Schletter, A.; Eshchanov, R.; Tupitsa, A.; Khamzina, A.; Akramkhanov, A.; Vlek, P.L.G. Developing Sustainable Land and Water Management for the Aral Sea Basin through An Interdisciplinary Research. In Water in Agriculture; ACIAR Proceedings No. 116; Seng, V., Craswell, E., Fukai, S., Eds.; Australian Center for International Agricultural Research (ACIAR): Canberra, Australia, 2004. [Google Scholar]
- Bekchanov, M.; Lamers, J.P.A.; Martius, C. Pros and cons of adopting water-wise approaches in the lower reaches of the Amu Darya: A socio-economic view. Water. 2010, 2, pp. 200–216. Available online: https://www.mdpi.com/2073-4441/2/2/200/pdf (accessed on 1 July 2010). [CrossRef]
- Abdullayev, I.; Nurmetova, F.; Abdullaeva, F.; Lamers, J. Socio-technical Aspects of Water Management in Uzbekistan: Emerging Water Governance Issues at the Grass Root Level. In Central Asian Waters; Rahaman, M.M., Varis, O., Eds.; Helsinki University of Technology: Helsinki, Finland, 2008; pp. 89–103. [Google Scholar]
- Müller, M. Where Has All the Water Gone? In Continuity and Change: Land and Water Use Reforms in Rural Uzbekistan; Wehrheim, P., Shoeller-Schletter, A., Martius, C., Eds.; Leibniz Institute of Agricultural Development in Central and Eastern Europe (IAMO): Haale, Germany, 2008; Volume 43, pp. 89–104. [Google Scholar]
- Conrad, C. Fernerkundungsbasierte Modellierung und hydrologische Messungen zur Analyse und Bewertung der landwirtschaftlichen Wassernutzung in der Region Khorezm (Usbekistan). Ph.D. Thesis, Bonn University, Bonn, Germany, 6 December 2006. [Google Scholar]
- Glazirin, G.E.; Chanishev, S.G.; Chub, V.E. Short Overview of Climate in Uzbekistan; Chinor ENK—Galaba: Tashkent, Uzbekistan, 1999; p. 29. [Google Scholar]
- Poverty and Food Insecurity in Uzbekistan; World Food Program (WFM): Rome, Italy, 2008. Available online: http://documents.wfp.org/stellent/groups/public/documents/ena/wfp179011.pdf (accessed on 15 July 2010).
- Müller, M. A General Equilibrium Approach to Modeling Water and Land Use Reforms in Uzbekistan. Ph.D. Thesis, Bonn University, Bonn, Germany, 20 May 2006; pp. 15–44. [Google Scholar]
- Statistical Review—Socio-Economic Development Indicators for the Khorezm Region in the Years of 1991–2005; Regional Statistical Department of Khorezm (OblStat): Urgench, Uzbekistan, 2006.
- Information on the Program of Attracting Foreign Investment to Khorezm Region; Ministry for Foreign Economic Relations, Investments and Trade of the Republic of Uzbekistan (MFER): Tashkent, Uzbekistan, 2008. Available online: http://www.mfer.uz (accessed on 10 June 2008).
- Rudenko, I.; Grote, U.; Lamers, J.P.A. Using a Value Chain Approach for Economic and Environmental Impact Assessment of Cotton Production in Uzbekistan. Proceedings of the NATO Advanced Research Workshop on Environmental Problems of Central Asia and Their Economic, Social and Security Impacts; Qi, J., Evered, T., Eds.; Springer: Dordrecht, The Netherlands, 2007; pp. 361–380. Available online: http://www.springer.com/environment/environmental+management/book/978-1-4020-8958-9 (accessed on 20 December 2009).
- Khorezm Regional Department of Statistics. Agricultural Indicators for Khorezm Oblast, 2000–2007; OblStat: Urgench, Uzbekistan, 2006. [Google Scholar]
- FAOSTAT. Database; Food and Agriculture Organization (FAO): Rome, Italy, 2008. Available online: http://faostat.fao.org/site/567/DesktopDefault.aspx?PageID=567#ancor (accessed on 10 October 2008).
- Dixon, J.; Gulliver, A.; Gibbon, D. Farming Systems and Poverty: Improving Farmer’s Livelihoods in a Changing World; FAO and World Bank: Rome, Italy, 2001. [Google Scholar]
- Special Report on FAO/WFP Crop and Food Supply Assessment Mission to the Karakalpakstan and Khorezm Regions of Uzbekistan; FAO: Rome, Italy, 2000.
- Djanibekov, N. A Micro-Economic Analysis of Farm Restructuring in the Khorezm Region (Uzbekistan). Ph.D. Thesis, Bonn University, Bonn, Germany, 15 May 2008. [Google Scholar]
- Veldwisch, G.J.A. Cotton, Rice & Water: The Transformation of Agrarian Relations, Irrigation Technology and Water Distribution in Khorezm, Uzbekistan. Ph.D. Thesis, Bonn University, Bonn, Germany, 2 June 2008. [Google Scholar]
- Bobojonov, I. Modeling Crop and Water Allocation under Uncertainty in Irrigated Agriculture: A Case Study on the Khorezm Region, Uzbekistan. Ph.D. Thesis, Bonn University, Bonn, Germany, 12 December 2008. [Google Scholar]
- Molden, D. Accounting for Water Use and Productivity; SystemWide Initiative for Water Management (SWIM) Paper 1; International Water Management Institute (IWMI): Colombo, Sri Lanka, 1997. [Google Scholar]
- Abdullayev, I.; Molden, D. Spatial and temporal variability of water productivity in the Syr Darya Basin, Central Asia. Water Resour. Res. 2004, 40. [Google Scholar] [CrossRef]
© 2010 by the authors; licensee MDPI, Basel, Switzerland. This article is an open access article distributed under the terms and conditions of the Creative Commons Attribution license (http://creativecommons.org/licenses/by/3.0/).
Share and Cite
Bekchanov, M.; Karimov, A.; Lamers, J.P.A. Impact of Water Availability on Land and Water Productivity: A Temporal and Spatial Analysis of the Case Study Region Khorezm, Uzbekistan. Water 2010, 2, 668-684. https://doi.org/10.3390/w2030668
Bekchanov M, Karimov A, Lamers JPA. Impact of Water Availability on Land and Water Productivity: A Temporal and Spatial Analysis of the Case Study Region Khorezm, Uzbekistan. Water. 2010; 2(3):668-684. https://doi.org/10.3390/w2030668
Chicago/Turabian StyleBekchanov, Maksud, Aziz Karimov, and John P. A. Lamers. 2010. "Impact of Water Availability on Land and Water Productivity: A Temporal and Spatial Analysis of the Case Study Region Khorezm, Uzbekistan" Water 2, no. 3: 668-684. https://doi.org/10.3390/w2030668
APA StyleBekchanov, M., Karimov, A., & Lamers, J. P. A. (2010). Impact of Water Availability on Land and Water Productivity: A Temporal and Spatial Analysis of the Case Study Region Khorezm, Uzbekistan. Water, 2(3), 668-684. https://doi.org/10.3390/w2030668