
Article

Estimating the Ground Water Resources of Atoll Islands


1
Department of Civil and Environmental Engineering, Colorado State University, 1372 Campus Delivery, Fort Collins, CO 80523, USA
2
Water and Environmental Research Institute of the Western Pacific (WERI), University of Guam, Mangilao, Guam 96923, USA
*
Author to whom correspondence should be addressed.
Water 2010, 2(1), 1-27; https://doi.org/10.3390/w2010001
Submission received: 1 December 2009 / Revised: 4 January 2010 / Accepted: 8 January 2010 / Published: 14 January 2010
(This article belongs to the Special Issue Feature Papers)

Abstract

Ground water resources of atolls, already minimal due to the small surface area and low elevation of the islands, are also subject to recurring, and sometimes devastating, droughts. As ground water resources become the sole fresh water source when rain catchment supplies are exhausted, it is critical to assess current groundwater resources and predict their depletion during drought conditions. Several published models, both analytical and empirical, are available to estimate the steady-state freshwater lens thickness of small oceanic islands. None fully incorporates unique shallow geologic characteristics of atoll islands, and none incorporates time-dependent processes. In this paper, we provide a review of these models, and then present a simple algebraic model, derived from results of a comprehensive numerical modeling study of steady-state atoll island aquifer dynamics, to predict the ground water response to changes in recharge on atoll islands. The model provides an estimate thickness of the freshwater lens as a function of annual rainfall rate, island width, Thurber Discontinuity depth, upper aquifer hydraulic conductivity, presence or absence of a confining reef flat plate, and in the case of drought, time. Results compare favorably with published atoll island lens thickness observations. The algebraic model is incorporated into a spreadsheet interface for use by island water resources managers.

Graphical Abstract

1. Introduction

Atolls, composed of circular chains of small, coral islands surrounding a shallow lagoon (Figure 1), have long been of particular interest to geologists and hydrologists due to their unique geologic structure and limited water supply [1]. There are over 400 atolls in the world [2], mainly in the Pacific and Indian oceans; Figure 2 shows locations of atolls discussed in this paper. Typical maximum elevations of atoll islands range from 2 to 3 meters [3], while widths vary from 100 to approximately 1500 m. The low-lying topography, small surface area, and isolation from other populated areas make atoll islands particularly vulnerable to over-use and drought. Furthermore, anticipated rises in sea level coupled with natural coastal erosion pose a serious threat to the sustainability of atoll island communities during the next century. Recent atoll island research [4] suggests that current rates of sea level rise will make most atolls around the world uninhabitable by the end of this century.
In the interim, while island governments considerappropriate responses, human habitation of atoll islands requires deliberateand effective management of their limited and increasingly threatened freshwater resources. The small catchment area and highly-porous surface precludesurface reservoirs, and thus the only natural storage of freshwater lies withinthe subsurface. This subsurface storage is essential for vegetation and cropmaintenance, as well as water supply for island residents during times of waterscarcity. Rain catchment water is preferred for domestic purposes, such asdrinking, cooking, and bathing [5,6,7]. Mostroof tops in village communities are therefore equipped with a gutter systemleading to a storage tank, with larger gutter systems and tanks for communitybuildings. However, during periods of scarce rainfall, which for the westernPacific occur during years following each El Niño event (Figure 3), rain water supplies are rapidlydepleted and island inhabitants must rely upon ground water to fulfill allwater needs.
Although ground water is the principal means of fresh water storage on atoll islands, and is a major factor in determining the sustainability of island communities during times of drought, hydrologic data on ground water and aquifer response to changes in recharge remain limited. Data on aquifer response during drought conditions are even scarcer.
To determine the sustainability of atoll island fresh water supplies, estimates of ground water storage under normal climatic conditions as well as ground water storage during periods of scarce rainfall must be addressed. To deal with the first issue, several steady-state models, either analytically- or empirically-derived, have been proposed [8,9,10,11]. None of these steady-state models, however, are tailored to the unique geologic features of atoll islands. Nor are these models designed to deal with time-dependent climatic conditions.
In this paper we first provide an overview of atoll island hydrogeology and its unique departures from non-atoll island hydrogeology; second, we provide a review of current available models for oceanic island aquifers; and third, we present an algebraic model that can be used to predict the thickness of the freshwater lens of atoll islands in both steady-state and transient (drought) conditions. The model includes parameters general to all oceanic islands (recharge rate, island width, upper aquifer hydraulic conductivity, upper aquifer thickness) [8,9,10,11], as well as those unique to atoll islands (dual aquifers and presence of the reef flat plate). The model is based on results from a comprehensive set of numerical simulations and sensitivity tests [12]. Use of a numerical model permitted the effects of important physical processes, such as variable-density flow and vertical flow and mixing, to be captured in the derived algebraic model. As such, the model provides an improvement over analytical models that have been limited by necessary mathematical simplifications. The algebraic model is sufficiently simple to be used as a management tool by trained users, and, due to the inclusion of geologic features of atoll island hydrogeology, delivers results that are consistent with observations.

2. Atoll Island Hydrogeology

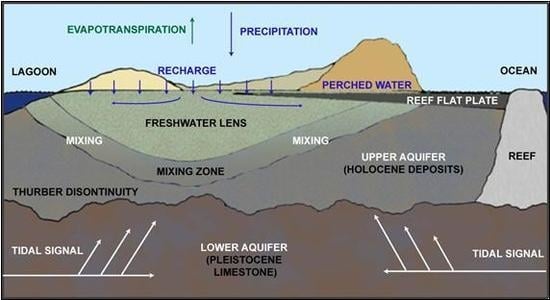
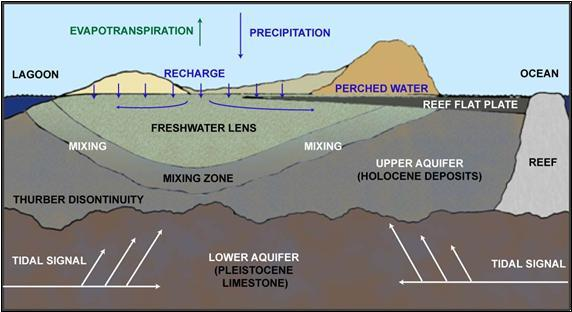
Atolls islands differ from the majority of oceanic islands in that they possess dual aquifers, in which a surficial particulate Holocene aquifer lies atop a Pleistocene paleo-karst aquifer (Figure 4). The contact between the upper and lower aquifers is an unconformity approximately 15-25 m below current sea level [3,13,14], sometimes referred to as the “Thurber Discontinuity” [1]. It is a prevalent feature of atolls across the Indian and Pacific Oceans, and is a remnant of glacio-eustatic sea-level positions [14]. Limestone platforms exposed during the most recent glacial episode were eroded down to the current level of the Thurber Discontinuity, after which the subsequent sea-level over-topped the discontinuity, allowing the deposition of the Holocene limestone aquifer [14].
The large contrast in hydraulic conductivity between the two aquifers, in which the lower aquifer hydraulic conductivity is estimated to be one to two orders of magnitude higher than that of the upper aquifer [15,16], allows both horizontal and vertical mixing as the tidal signal propagates laterally through the highly-conductive Pleistocene aquifer and up into the less-conductive Holocene aquifer [1,17]. For large atoll islands where recharge rates are high enough for the base of the freshwater lens to descend to the contact, freshwater below the Thurber Discontinuity is thoroughly mixed with the seawater, thus truncating the freshwater lens along the Thurber Discontinuity and creating a flat lens base (Figure 5C) [13,18,19]. The truncation of the lens (Figure 5C) on large atoll islands also suggests that the lens volume cannot be estimated from a single lens thickness observation, i.e., by measuring the thickness of the lens under the center of the island and estimating the lens volume based on a Ghyben-Herzberg lens configuration (Figure 5A). Rather, the lens may take on a rectangular-shaped geometry (Figure 5C), thus creating a much larger volume of freshwater than would be expected from a Ghyben-Herzberg lens of the same thickness, since the thickness of the lens is constant underneath much of the island. This phenomenon is illustrated on Diego Garcia, a large atoll in the central Indian Ocean, where the base of the lens is flat along the contact [19].
Depth to the Thurber Discontinuity is thus an important characteristic feature of atoll island aquifers, which, where present, sets an upper limit on the amount of freshwater residing in the upper aquifer. Small islands and islands with a high upper-aquifer hydraulic conductivity contain relatively thin lenses, for which the base does not descend to the Thurber Discontinuity (Figure 5B). For these islands, the lens base will have a shallow, rounded profile and will not be significantly affected by the Thurber Discontinuity.
Hydraulic conductivity of the upper aquifer depends strongly on the position of the island relative to the prevailing winds [20,21]. Windward islands (see Deke Island in Figure 1), which bear the high-energy impact of the prevailing wind and waves, are composed of much coarser sediments than the more protected, leeward islands. Comparison between numerical simulation results and observed lens thickness of atoll islands suggests upper aquifer hydraulic conductivities of 50 and 400 m day-1 for leeward and windward islands, respectively [12]. It should be noted that the estimated hydraulic conductivity of windward islands (400 m day-1) is a very rough estimate. With the high variability of wind and wave patterns amongst the regions of the Indian and Pacific Oceans, it is expected that the coarseness of the sediments on windward islands is also variable, thus creating a wide range of possible hydraulic conductivities. The lower hydraulic conductivity of leeward islands promotes thicker freshwater lenses. This pattern is consistent across the Pacific and Indian Oceans (Table 1), with leeward islands in general possessing a much thicker freshwater lens than windward islands, and lens thickness for large islands, such as Diego Garcia Atoll and Christmas Atoll, being limited by the Thurber Discontinuity. This trend is seen in a plot of lens thickness vs. island width for the leeward islands listed in Table 1 (Figure 6). The identification of the Thurber Discontinuity and the consequent truncation of the lens is thus a defining component of atoll island hydrogeology, and must be included in hydrological analyses of atoll islands. For large atoll islands, hydrological analyses assuming a single aquifer layer may overestimate the lens thickness. This will be discussed further in section 3.
Another characteristic feature of atoll aquifers is a reef flat plate extending inward from the ocean side of the island [24] (Figure 4). Where present, it partially confines the upper aquifer, forcing discharge upward through fractures in the plate or laterally at the reef margin [17,24,33].

3. Island Freshwater Lens Models

3.1. Available Models

In the absence of empirical data, researchers have attempted to provide estimates of the depth to the freshwater-seawater interface in both coastal and oceanic island settings, based on analytical solutions [8,9,11] and empirical fits to observations [10]. To obtain the requisite simplification for derivation of closed-form solutions, analytical approaches adopted the Ghyben-Herzberg-Dupuit (GHD) assumptions of (1) a sharp interface between freshwater and underlying seawater; (2) absence of a vertical component of flow; and (3) limit of the freshwater lens is defined as 50% relative seawater salinity [11]. Both single-layer models, derived for homogeneous aquifers, and double-layer models, derived for vertically-stratified aquifers, are discussed herein.
Fetter [8], assuming an isotropic, homogenous aquifer, derived the following analytical solution for determining the head of the water table at any distance from the shoreline as a function of recharge rate and hydraulic conductivity:
Water 02 00001 i001
where:
  • H = hydraulic head [L]
  • w = island width [L]
  • x = distance from the shoreline [L]
  • R = recharge rate [LT-1]
  • K = aquifer hydraulic conductivity [LT-1]
  • G = Water 02 00001 i002 [-]
  • ρw = density of fresh water [ML-3]
  • ρs = density of salt water [ML-3]
The depth to the freshwater-seawater interface, Z, is then calculated by multiplying H by G, with the maximum lens thickness, ZMAX, found by using H in the center of the island (a = x). Fetter [8] developed a similar expression for circular islands. This was followed by Chapman [9], who developed a similar solution for infinite strip islands. These analytical solutions all take into account island width, average annual recharge rate, aquifer hydraulic conductivity, and the density difference between seawater and freshwater (Table 2).
Oberdorfer and Buddemeier [10] developed an empirical model using observed lens thicknesses to predict the thickness of the freshwater lens on small coral islands. For eight small coral islets, they found the following exponential relationship between the ratio of the lens thickness and the annual rainfall, and the logarithm of the island width:
Water 02 00001 i003
where:
  • H = depth to freshwater-seawater interface [m]
  • P = annual rainfall rate [m yr-1]
  • w = island width [m]
Their empirical model does not take into account hydraulic conductivity of the subsurface. Analytical solutions that accounted for vertical variation in hydraulic conductivity were also derived by Fetter [8] and Vacher [11] for infinite-strip islands (Table 2).

3.2. Comparison to Atoll Island Observations

Single-layer models were compared with the leeward and windward atoll island observations listed in Table 1 (Figure 7), using an annual recharge rate of 2 m yr-1 and a hydraulic conductivity of 50 m day-1 for the range of island widths typical for atoll islands. The Vacher [11] dual-layer model was also included, using the same recharge rate of 2 m yr-1, an upper aquifer hydraulic conductivity of 50 m day-1, a lower aquifer conductivity of 5000 m day-1, and an upper aquifer thickness of 20 m.
Although applicable to other types island and coastal settings, the single-layer models of Fetter [8] and Chapman [9] greatly overestimate the lens thickness when applied to leeward atoll islands (Figure 7A), as there is no provision in the models for a vertical stratification of hydraulic conductivity. Overestimation is also due to the GHD assumption of the freshwater lens ending at 50% relative seawater salinity, rather than the 2.5% as reported in Table 1, although this accounts for only a portion of the overestimated thickness. These models do, however, provide reasonable results when used for windward atoll islands (Figure 7B), since the high hydraulic conductivity of the upper aquifer on windward islands does not allow for the lens base to reach the Thurber Discontinuity (see Figure 5B). Windward islands can thus be treated as having a homogeneous aquifer. The Oberdorfer and Buddemeier [10] empirical model captures the general trend for leeward islands, although it still over-estimates the lens thickness. When used for windward islands, however, which possess aquifers with a much higher hydraulic conductivity, their model greatly overestimates the thickness of the freshwater lens for windward atoll islands, since it does not take into account hydraulic conductivity.
The Vacher dual-layer solution [11] provides reasonable results when compared to observed lens thicknesses for small leeward islands (Figure 7A), but the simulated lens continues to thicken for larger islands, with no sharp truncation. Hence, the lens thickness is also over-estimated. However, for large atoll islands such as Diego Garcia, where the truncated lens spreads wider across the island (Figure 5C), the overall volume of groundwater may not be overestimated to the same degree that the thickness is overestimated.
The limitations of these analytical and empirical models to atoll islands have been noted by other investigators [18,34]. Specifically, results demonstrate the models’ lack of provision for the full array of geologic features (hydraulic conductivity, vertical stratification of hydraulic conductivity, island width, reef flat plate) and flow processes (vertical flow, mixing at the contact between the upper and lower aquifers) that control the thickness of the lens on atoll islands.

4. Development of the Algebraic Model

4.1. Numerical Hydrological Simulations

Numerical modeling was performed using the variable-density, solute transport finite element code SUTRA [35]. Eight different island widths, ranging from 150 m to 1100 m, were modeled using eight different meshes, with each mesh representing a two-dimensional cross-section of the island from the lagoon side of the island to the ocean side (see Figure 4). Full details of the mesh geometry, boundary conditions, and initial conditions are given by [12].
Simulations were run to quantify the influence of rainfall and the principal geologic features of atoll islands (island width, hydraulic conductivity, depth to the Thurber Discontinuity, reef flat plate) on the thickness of the freshwater lens [12]. A test series was performed for each feature, with the feature ranging over a realistic set of values while holding the other feature values constant. Rainfall, held constant at 4 m yr-1 for other test series, ranged from 2.5 to 5.5 m yr-1. Upper aquifer hydraulic conductivity, held constant at 50 m day-1 for other test series, ranged from 25 to 500 m day-1, depth to the Thurber Discontinuity, held constant at 16.5 m for other test series, ranged from 8 to 16.5 m, and simulations were run for each island width with and without the reef flat plate, which was represented by a one-meter thick layer of low-conductivity elements (K = 0.05 m day-1) extending from the ocean side to the middle of the island.
Each test series was run over the range of island widths (150 to 1100 m) in order to quantify the influence of the width of the island, and the annual recharge rate was set at half of the rainfall rate, a reasonable assumption for atoll islands [13,15,20]. The hydraulic conductivity of the lower aquifer was set at 5000 m day-1 for all simulations. The lens base was defined along the 500 mg L-1 isochlor (2.5% sea water), similar to the studies summarized in Table 1.
Time-dependent recharge, calculated from climatic data from the western and eastern Caroline region [12], was used in transient simulations in order to quantify the behavior of the freshwater lens during average seasonal conditions as well as severe drought conditions. Similar to the steady-state test series, simulations were run for both leeward and windward islands over a range of island sizes.
The results of the steady-state numerical simulations enabled the inclusion of the effects of each of the influencing features of atoll island hydrogeology into a compact and simple algebraic model. Results from the transient simulations can be included into the algebraic model to provide an estimate of ground water conditions during periods of scarce rainfall. The development of the model follows. The island features and associated model parameters that will be discussed are presented in Figure 8.

4.2. Rainfall Rate, Island Width, and Thurber Discontinuity Depth

For the recharge test series model results, in which each island width model was run to steady-state for seven different rainfall rates, the lens thickness at the center of the island, ZMAX, was plotted as a function of annual rainfall rate for five island widths (Figure 9A), with each point on the plot representing a separate simulation. For each island width, the numerical modeling results were fitted to a function describing exponential decay to a limit, representing the decreased effect of the rainfall rate on increasing ZMAX as the lens thickness approaches its maximum value L:
Water 02 00001 i004
where:
  • ZMAX = lens thickness at center of island [m]
  • R = annual rainfall rate [m yr-1]
  • L = maximum value of ZMAX [m]
  • b = fitting parameter, dependent on island width (Figure 9B)
For islands receiving low rainfall rates, an increase in rainfall rate brings about a proportional increase in the thickness of the lens. However, for islands with a lens thickness approaching the maximum thickness L, an increase in rainfall rate has a minimal influence on increasing the lens thickness. Notice that each island width has a different L value, shown on the right-hand side of Figure 9A. The maximum lens thickness, L, is a function of both island width and Thurber Discontinuity depth (Figure 10). For an island that is 800 m in width and receives a high rainfall rate, the base of the freshwater lens descends to and is limited at the Thurber Discontinuity. Hence, the value of L is the same as the depth of the Thurber Discontinuity, 16.5 m (Figure 9A). For smaller islands, however, the base of the lens never approaches the depth of the Thurber Discontinuity (see Figure 5B), no matter the rainfall rate. Hence, for an island width of 300 m, L is 13.0 m. The fact that the limiting thickness L can be shallower than the Thurber Discontinuity depth is represented by the dashed line in Figure 8. This is further demonstrated by a plot of the L term for various island widths (Figure 10). For a 200-m wide island, the maximum lens thickness L is 8.6 m, whereas for an 800-m island the maximum lens thickness L is 16.3 m. The lens thickness on the 200-m island is limited by its small width, whereas the lens thickness on the 800-m island is limited by the Thurber Discontinuity.
The plot of L against island width is fitted with the following exponential relationship:
Water 02 00001 i005
where:
  • L = maximum value of ZMAX [m]
  • w = island width [m]
  • yo, a, d = fitting parameters
For modeling purposes, it is desirable to include the depth of the Thurber Discontinuity, ZTD, into equation (4). This is done by recognizing that the limit of L as the island width approaches infinity is the quantity yo + a, which is equal to the depth to the Thurber Discontinuity, which is the limiting factor of the lens thickness for large islands (see Figure 10). Hence:
Water 02 00001 i006
which, when solving for a and inserting into equation (4), yields:
Water 02 00001 i007
where:
  • L = limiting thickness of the freshwater lens [m]
  • w = island width [m]
  • ZTD = depth to the Thurber Discontinuity [m]
  • yo = fitting parameter, equal to -16.07
  • d = fitting parameter, equal to 0.0075
Equation (6) thus provides the maximum possible thickness of the freshwater lens for a given island width and a given depth to the Thurber Discontinuity, and when this calculated value of L is inserted into equation (3), a freshwater lens thickness given the recharge rate, island width, and Thurber Discontinuity depth is determined. A set of curves (Figure 11), with each curve representing the limiting thickness of the lens for a given Thurber Discontinuity, can be used to provide values of L.

4.3 Hydraulic Conductivity and Reef Flat Plate

The influence of the hydraulic conductivity of the upper aquifer on the development of the freshwater lens is seen in Figure 12, which shows the results of numerical simulations in which hydraulic conductivity was varied from 25 m day-1 to 500 m day-1 for various island widths. For each island width, the steady-state thickness of the lens decreases dramatically with increasing hydraulic conductivity. Also, it can be seen that the width of the island influences the rate at which the lens thickness decreases with increasing aquifer hydraulic conductivity, due to the lenses on small islands being more strongly influenced by changes in hydraulic head gradient.
As atoll islands exhibit a wide variation in upper aquifer hydraulic conductivity, it is desirable to incorporate this trend into the algebraic model of equation (3). To do so, a hydraulic conductivity parameter (Figure 13) was calculated by fitting trend lines to the relationships shown in Figure 12. This parameter can then be incorporated into equation (3):
Water 02 00001 i008
where S is the hydraulic conductivity parameter [-]. As seen in Figure 13, S is a function of the upper aquifer hydraulic conductivity and island width. In essence, S scales the freshwater lens thickness depending on the upper aquifer hydraulic conductivity of the island in question. For high hydraulic conductivity values, the parameter values decrease, which results in a thin lens thickness calculated in equation (7).
Using the numerical simulation results of the reef flat plate test series, a similar procedure was used to include a reef flat plate parameter, C [-], to account for the influence of the confining reef flat plate on the lens thickness (Figure 14):
Water 02 00001 i009
If the atoll island does not have a reef flat plate, then C is equal to 1.0. As seen in Figure 14, the reef flat plate thickens the lens for smaller islands. For example, a 200-m island has a C parameter value of 1.14, which when inserted into equation (8) will increase the steady-state freshwater lens thickness. The reef flat plate has negligible influence on the freshwater lens thickness for islands wider than 1000 m.
The algebraic model of equation (8) thus accounts for all the relevant hydrogeologic features on atoll islands: the annual rainfall rate, R; the width of the island and the depth to the Thurber Discontinuity, through L; the hydraulic conductivity, through the hydraulic conductivity parameter, S; and the reef flat plate, through the reef flat plate parameter, C. In situations where the hydraulic conductivity of the upper aquifer is unknown, as is the case for many remote atoll islands, the hydraulic conductivity factors may be reasonably estimated using values of 50 m day-1 and 400 m day-1 for leeward and windward islands, respectively. For islands offset from either the windward or leeward portions of the atoll, a value between these two end-member values may be used. As can be seen in Figure 15, the freshwater lens is most sensitive to the depth to the Thurber Discontinuity and the hydraulic conductivity of the upper aquifer, followed by the width of the island and the annual rainfall rate. The reef flat plate has minimal influence on the lens thickness.

4.4. Incorporating Time-Dependent Rainfall

As seasonal and event-driven weather conditions and tidal fluctuations have an important influence on the thickness and geometry of the freshwater lens, transient simulations were run to predict the behavior of the lens through time [12]. Simulations used weather and tide data from the regions of Yap (western Caroline islands region) and Pohnpei (eastern Caroline islands region) states, FSM, with daily recharge calculated according to the method prescribed by [18]. Average seasonal variation of the freshwater lens thickness was simulated using weather and tide data from the years 1994 to 2005, with daily rainfall averaged for each day. Depletion and recovery of the freshwater lens during drought conditions was simulated using weather and tide data from the years 1997-1999, with the first part of 1998 experiencing a major drought in Micronesia.
Simulations using the average seasonal variation in recharge show the fluctuation of the lens for a typical year in the western Caroline region for various islands widths (Figure 16A). Figure 16B compares the results of the western and eastern Caroline regions, with the higher-rainfall eastern Caroline region with a thicker lens throughout the year.
Simulations for the years 1997-1999 show a rapid depletion of the lens during the first months of 1998 (Figure 17), followed by a recovery of the lens during the next year and a half. The behavior of the lens corresponds to the rainfall patterns, also shown in Figure 17. This pattern of lens depletion and recovery was the same for all island widths. Simulations using the western Caroline region weather data had lens thicknesses consistently larger than those for the eastern Caroline region. Simulations for windward islands, with a high aquifer hydraulic conductivity (results not shown), often showed a complete depletion of the lens during the peak of the drought. Additional simulations were run to determine the time to lens depletion when no rainfall occurred. As seen in Figure 18, all atoll islands in the western Caroline region, except for islands 600 m in width or larger, would be expected to experience a complete ground water storage depletion within 8 months, with lens depletion occurring much more rapidly for small, windward islands.
Using the results of the transient simulations for 1997-1999, a dimensionless drought factor was created by dividing the monthly lens thickness in the transient simulations by the lens thickness computed in the steady-state simulations. The drought factor thus represents the fraction of the lens at steady-state conditions, at a specific moment in time. Table 3 contains the drought factors for both western and Caroline regions, for both leeward and windward and for various island sizes. Factors are provided for 5 distinct times: month 1 (onset of drought), month 6 (peak of drought), month 12 (6 months into recovery), month 18 (12 months into recovery), and month 24 (18 months into recovery). For example, a 600-m leeward atoll island in the western Caroline region has a drought factor of 0.621 at month 6, meaning that the lens thickness is 62.1% of the steady-state lens thickness. By month 24, the drought factor is 0.909, meaning that the lens thickness is now 90.9% of the steady-state lens thickness.
With the inclusion of the drought factor, the algebraic model is formulated as:
Water 02 00001 i010
where D = drought factor [-].

5. Discussions

5.1. Model Comparisons

For windward islands, using a hydraulic conductivity value of 400 m day-1, the single-layer models of Fetter [8] and Chapman [9] provide reasonable fits to observed lens thicknesses (Figure 7B), and similar predictions to those of the algebraic model (Figure 19). Notice, however, that for large island widths the increase in lens thickness predicted by the algebraic model begins to diminish as the base of the lens approaches the Thurber Discontinuity. It should be noted, also, that the trend of observed lens thicknesses as a function of width on windward atoll islands exhibits high variability. The results in Figure 19 merely show that the algebraic model performs as well as previously published models for islands with high upper aquifer hydraulic conductivity. Use of any model for lens thickness estimation on windward atoll islands is strongly cautioned, as it seems that no model without detailed hydrologic and geologic characteristics of the island in question will be able to capture the true nature of the freshwater lens on windward islands due to the high variability of hydraulic conductivity.
As discussed previously, the Vacher dual-layer model [11] provides fairly accurate results for small atoll islands, but over-estimates the lens thickness for large atoll islands (see Figure 7A). Numerical simulations, however, were able to capture the sharp truncation of the lens due to the inclusion of vertical flow and mixing. These effects are embedded in the algebraic model, which thus offers a more accurate estimation of the lenses on leeward atoll islands (Figure 20), and for any island where the aquifer is divided into two stratified sections of differing hydraulic conductivity.

5.2. Applications of the Algebraic Model

The algebraic model can be applied in different ways. The first was described previously, in which equations and charts are used to determine the value of each parameter. A second and more direct method is to derive a set of curves such as those shown in Figure 21, which provide the thickness of the freshwater lens under the central axis of the island as a function of island and rainfall rate. The chart was created using the algebraic model, with the Thurber Discontinuity depth set at 17.5 m and the hydraulic conductivity factor values consistent with leeward and windward islands (50 m day-1 and 400 m day-1, respectively). Similar charts could be created for any rainfall rate, hydraulic conductivity, and depth to the Thurber Discontinuity. In most cases, especially for remote atoll islands, the hydraulic conductivity of the upper aquifer and the depth to the Thurber Discontinuity are not known. In such situations, a tool such as Figure 21 may be applied using island width and annual rainfall rate, which are often available or can be more readily measured. Such tools are valuable for water resources managers of atoll islands.
Furthermore, the algebraic model, when incorporating the time-dependent D term, can provide water resources managers with estimates of freshwater lens depletion and recovery during periods of scarce rainfall. The model has been incorporated into a spreadsheet user interface (“Atoll Freshwater Lens Tool”, attached software) and training on the model and spreadsheet has been presented to water resources managers of the Federated States of Micronesia, and is currently being used in their assessment of ground water resources of atoll islands.

6. Summary and Conclusions

The number and variability of atoll islands, combined with the lack of data for specific islands, have historically made it difficult for island water resource managers to accurately estimate the availability of ground water resources under stressful conditions, such as the droughts that accompany El Niño events in the western Pacific. Accumulated research, however, has shown that there is sufficient consistency in geologic conditions that certain generalizations can be made with sufficient confidence to produce models that can be useful for estimating ground water resource availability in the absence of island-specific data. The algebraic model described herein is implemented through parameterized equations, factor value charts, and rainfall curves. It is intended as a practical tool for water resources managers of atoll islands who typically do not have abundant data or access to numerical modeling resources.
Most importantly, the algebraic model presented in this paper takes into account, along with rainfall and recharge to the lens, the geologic features that constrain the dimensions of the freshwater lens: island width, hydraulic conductivity of the upper aquifer, depth to the Thurber Discontinuity, and the presence or absence of a reef flat plate. Comparisons between algebraic model results and observations on both leeward and windward atoll islands provide an improvement over previous analytical and empirical models. In particular, the algebraic model, which is constrained by numerical simulation results accounts for the effects of features not included in earlier analytical models. The implicit inclusion of the effects of vertical flow and mixing enables the model to more accurately simulate the freshwater lens thickness on large, leeward islands, where the lens is truncated sharply at the Thurber Discontinuity. It should be noted that the model only provides the maximum lens thickness given the island climatic and geologic conditions, and does not provide any indication of the actual lens volume. For large atoll islands where the lens base is truncated at the Thurber Discontinuity, this volume may be much larger than would be expected from a classic Ghyben-Herzberg freshwater lens.
Future research and use of the model may include an analysis of ground water resources in response to anticipated sea level rise, as well as the response of atoll island staple crops to current and anticipated ground water resources.

Acknowledgements

Primary funding for this project was provided by the Department of Interior via the Water Resources Research Institute Program of the USGS (Award No. 01HQPA0010) administered through the Water and Environmental Research Institute of the Western Pacific at the University of Guam, with secondary funding from the Guam Hydrological Survey. The content of this article does not necessarily reflect the views and policies of the Department of the Interior. We wish to thank Donald Rubinstein, Micronesia Area Research Center, University of Guam, for his invaluable cultural and linguistic expertise during visits to Ulithi and Pingelap Atolls, as well as Steve Anthony of the USGS for providing valuable hydrologic information on Ulithi Atoll. We also would like to thank two anonymous reviewers for helpful suggestions and corrections. Finally, we are deeply grateful to the people from Ulithi and Pingelap Atolls.

References

  1. Vacher, H.L. Introduction: Varieties of carbonate islands and a historical perspective. In Geology and Hydrogeology of Carbonate Islands. Developments in Sedimentology 54; Vacher, H.L., Quinn, T., Eds.; Elsevier: Amsterdam, The Netherlands, 2007; pp. 1–33. [Google Scholar]
  2. Bryan, E.H., Jr. Check list of atolls. Atoll Res. Bull. 1953, 19, 1–38. [Google Scholar] [CrossRef]
  3. Wheatcraft, S.W.; Buddemeier, R.W. Atoll island hydrology. Ground Water 1981, 19, 311–320. [Google Scholar] [CrossRef]
  4. Dickinson, W.R. Pacific Atoll Living: How Long Already and Until When? GSA Today 2009, 19, 4–10. [Google Scholar] [CrossRef]
  5. Stephenson, R.A. A Comparison of freshwater use customs on Ultihi Atoll with those of selected other Micronesia islands, Technical Report No. 51; Water and Energy Research Institute, University of Guam, 1984.
  6. MacCracken, R.S.; Jenson, J.W.; Heitz, L.F.; Rubinstein, D.H.; Mylroie, J.E. Water Resources Analysis of Fais Island, Federated States of Micronesia. Technical Report No. 111. Water and Environmental Research Institute of the Western Pacific, University of Guam, 2007. [Google Scholar]
  7. Bailey, R.T. Groundwater resources of Micronesian atoll islands: observations, modeling, and managemen. M.S. thesis, College of Natural and Applied Sciences, University of Guam, 2008. [Google Scholar]
  8. Fetter, C.W. Position of the saline water interface beneath oceanic islands. Water Resour. Res.. 1972, 8, 1307–1315. [Google Scholar] [CrossRef]
  9. Chapman, T.G. The use of water balances for water resource estimation with special reference to small islands. Bulletin No. 4; Pacific Regional Team. Australian Development Assistance Bureau: Canberra, Australia, 1985. [Google Scholar]
  10. Oberdorfer, J.A.; Buddemeier, R.W. Climate change: effects on reef island resources. In Proceedings of the Sixth International Coral Reef Symposium, Townsville, Australia; 1988; vol. 3, pp. 523–527. [Google Scholar]
  11. Vacher, H.L. Dupuit-Ghyben-Herzberg analysis of strip-island lenses. Bull. Geol. Soc. Am.. 1988, 100, 580–591. [Google Scholar] [CrossRef]
  12. Bailey, R.T.; Jenson, J.W.; Olsen, A.E. Numerical Modeling of Atoll Island Hydrogeology. Ground Water 2009, 47, 184–196. [Google Scholar] [CrossRef]
  13. Hamlin, S.N.; Anthony, S.S. Ground-water resources of the Laura area, Majuro Atoll, Marshall Islands. USGS Water Resour. Invest. Report 87-4047. 1987. [Google Scholar]
  14. Dickinson, W.R. Impacts of eustasy and hydro-eustasy on the evolution and landforms of Pacific atolls. Palaeogeogr. Palaeocl. 2004, 213, 251–269. [Google Scholar] [CrossRef]
  15. Hunt, C.D.; Peterson, F.L. Groundwater resources of Kwajalein Island, Marshall Islands. Technical Report No. 126. Water Resources Research Center, University of Hawaii, 1980. [Google Scholar]
  16. Woodroffe, C.D.; Falkland, A.C. Geology and hydrogeology of the Cocos (Keeling) Islands. In Geology and Hydrogeology of Carbonate Islands. Developments in Sedimentology 54; Vacher, H.L. , Quinn, T., Eds.; Elsevier: Amsterdam, The Netherlands, 2007; pp. 885–908. [Google Scholar]
  17. Buddemeier, R.W.; Holladay, G. Atoll hydrology: island groundwater characteristics and their relationship to diagenesis. In Proceedings of the Third International Coral Reef Symposium, Miami, FL, USA; Taylor, D.L., Ed.; Fisher Island Station: University of Miami, Miami, FL, USA, 1977; 2, pp. 167–174. [Google Scholar]
  18. Falkland, A.C. Climate, hydrology and water resources of the Cocos (Keeling) Islands. Atoll Res. Bull. 1994, 400, 1–23. [Google Scholar] [CrossRef]
  19. Hunt, C.D., Jr. Hydrogeology of Diego Garcia. In Geology and Hydrogeology of Carbonate Islands. Developments in Sedimentology 54; Vacher, H.L., Quinn, T., Eds.; Elsevier: Amsterdam, The Netherlands, 2007; pp. 909–931. [Google Scholar]
  20. Anthony, S.S. Hydrogeology of selected islands of the Federated States of Micronesia. In Geology and Hydrogeology of Carbonate Islands. Developments in Sedimentology 54; Vacher, H.L., Quinn, T., Eds.; Elsevier: Amsterdam, The Netherlands, 2007; pp. 693–706. [Google Scholar]
  21. Spennemann, D. Non-traditional settlement patterns and typhoon hazard on contemporary Majuro Atoll, Republic of the Marshall Islands. Trans. Cul. eJournal 2006, 2, 44–63. [Google Scholar]
  22. Anthony, S.S. Hydrogeology and ground-water resources of Ngatik Island, Sapwuahfik Atoll, State of Pohnpei, Federated States of Micronesia; USGS Water Resources Investigation Report 92-4005. 1996. [Google Scholar]
  23. Anthony, S.S. Hydrogeology and ground-water resources of Kahlap Island, Mwoakilloa Atoll, State of Pohnpei, Federated States of Micronesia; USGS Water Resources Investigation Report 92-4005. 1996. [Google Scholar]
  24. Ayers, J.F.; Vacher, H.L. Hydrogeology of an atoll island: A conceptual model from detailed study of a Micronesian example. Ground Water 1986, 24, 2–15. [Google Scholar] [CrossRef]
  25. Anthony, S.S. Hydrogeology and ground-water resources of Pingelap Island, Pingelap Atoll, State of Pohnpei, Federated States of Micronesia; USGS Water Resources Investigation Report 92-4005. 1996. [Google Scholar]
  26. Gingerich, S.B. Numerical simulation of the freshwater lens on Roi-Namur Island, Kwajalein Atoll, Republic of the Marshall Islands. M.S. thesis, Department of Geology and Geophysics, University of Hawaii at Manoa, 1992. [Google Scholar]
  27. Peterson, F.L. Hydrogeology of the Marshall Islands. In Geology and Hydrogeology of Carbonate Islands. Developments in Sedimentology 54; Vacher, H.L., Quinn, T., Eds.; Elsevier: Amsterdam, The Netherlands, 2007; pp. 611–666. [Google Scholar]
  28. Falkland, T. Kiribati water resources assessment report. Promotion of Effective Water Management Policies and Practices; TAR: 35494-01; Sinclair Knight Merz in association with Brisbane City Enterprises: Brisbane, Australia, 2003. [Google Scholar]
  29. Jacobson, G.; Taylor, F.J. Hydrogeology of Tarawa Atoll, Kiribati, Record 1981/31; Bureau of Mineral Resources, Geology and Geophysics, Australian Government, 1981.
  30. Lloyd, J.W.; Miles, J.C.; Chessman, G.R.; Bugg, S.F. A ground water resources study of a Pacific Ocean atoll – Tarawa, Gilbert Islands. Water Res. Bull. 1980, 16, 646–653. [Google Scholar] [CrossRef]
  31. Falkland, A.C. Review of Tarawa freshwater lenses, Republic of Kirabati; Report No. HWR 92/682; Australian International Development Assistance Bureau: Canberra, Australia, 1992; p. 73. [Google Scholar]
  32. Falkland, A.C. Christmas Island (Kiritimati) water resources study; Hydrology and Water Resources Unit Report No. HWR 83/03; Australian Dept. Housing and Construction: Victoria, Australia, 1983; p. 425. [Google Scholar]
  33. Cox, D.C. The hydrology of Arno Atoll, Marshall Islands. Atoll Res. Bull. 1951, 8, 1–29. [Google Scholar] [CrossRef]
  34. White, I. Fresh groundwater lens recharge, Bonriki, Kiribati, preliminary report; Project 6-1; International Hydrological Programme; UNESCO: Paris, France, 1996; p. 33. [Google Scholar]
  35. Voss, C.I.; Provost, A.M. SUTRA, A model for saturated-unsaturated variable-density ground-water flow with solute or energy transport; USGS Water-Resources Investigations Report 02-4231; USGS: Reston, Virginia, 2003. [Google Scholar]
Figure 1. (A) Pingelap Atoll, Pohnpei State, Federated States of Micronesia, in the western Pacific Ocean, (B) Diego Garcia Atoll, Indian Ocean, and (C) Majuro Atoll, Marshall Islands, central-western Pacific Ocean, showing the general trend of leeward and windward islands, with the leeward islands generally larger than the windward islands. Leeward islands, protected from the full force of the prevailing winds, tend to be composed of finer sediments than windward islands.
Water 02 00001 g001
Figure 2. (A) Map of the Indian Ocean and (B) Map of the Pacific Basin, showing locations of atoll islands that will be discussed in this paper (refer to Table 1).
Water 02 00001 g002
Figure 3. Monthly rainfall depths during 1997-1999 in Pohnpei, Federated State of Micronesia, highlighting the scarce rainfall during the first few months in 1998, following the 1997 El Niño.
Water 02 00001 g003
Figure 4. Conceptual model of atoll island hydrogeology, after Ayers and Vacher [24].
Water 02 00001 g004
Figure 5. Schematic of freshwater lens cross-section geometry on (A) islands with a homogeneous aquifer, (B) dual aquifer islands with a high-conductivity lower aquifer, but in which the lens, due to climatic and geologic reasons, does not reach the Thurber Discontinuity, and (C) dual-aquifer islands in which the lens is thick enough to be truncated at the Thurber Discontinuity. In (B) and (C) K2 is generally one to two orders of magnitude higher than K1.
Water 02 00001 g005
Figure 6. Lens thickness plot for leeward islands, showing the increase in lens thickness with increasing island width, with the lens thickness limited for large islands by the Thurber Discontinuity.
Water 02 00001 g006
Figure 7. Comparison of single-layer subsurface hydrology models with observed lens thicknesses of (A) leeward and (B) windward atoll islands.
Water 02 00001 g007
Figure 8. Island features and associated algebraic model parameters.
Water 02 00001 g008
Figure 9. (A) Lens thickness at center of island, ZMAX, as a function of rainfall, calculated by the numerical model, for representative island widths, and (B) the b parameter, as a function of island width.
Water 02 00001 g009
Figure 10. Values of the limiting parameter L in the rainfall-lens thickness relationship, for various island widths.
Water 02 00001 g010
Figure 11. L parameter curves as a function of Thurber Discontinuity depth and island width.
Water 02 00001 g011
Figure 12. Numerical simulation results for the hydraulic conductivity test series, for various island widths, demonstrating the decrease in lens thickness with increasing hydraulic conductivity of the upper aquifer.
Water 02 00001 g012
Figure 13. Relationship between hydraulic conductivity factors and hydraulic conductivity, for various island widths.
Water 02 00001 g013
Figure 14. Relationship between the width of the island and the reef flat plate factor, C, which is the ratio of the lens thickness for islands with reef flat plates and those without. The influence of the reef flat plate in increasing the thickness of the lens decreases as the island width increases.
Water 02 00001 g014
Figure 15. Sensitivity analysis of the island features in the algebraic model.
Water 02 00001 g015
Figure 16. (A) Average seasonal variation of freshwater lens thickness in western Caroline islands region, and (B) comparison of average seasonal variation between western (using Yap data) and eastern (using Pohnpei data) Caroline islands regions.
Water 02 00001 g016
Figure 17. Typical freshwater lens depletion and recovery during 1997-1999, corresponding to the associated rainfall patterns.
Water 02 00001 g017
Figure 18. Depletion of the lens with no rainfall, for both windward and leeward islands in the western Caroline region, for varying island widths.
Water 02 00001 g018
Figure 19. Comparison between the algebraic model and Fetter (1972) and Chapman (1985) models in their ability to estimate the lens thickness on windward atoll islands, using hydraulic conductivity factors pertaining to hydraulic conductivity values of 400 m day-1.
Water 02 00001 g019
Figure 20. Comparison between the algebraic model and Vacher 2-layer model in their ability to estimate the lens thickness on leeward atoll islands.
Water 02 00001 g020
Figure 21. Rainfall curves used to estimate the thickness of the freshwater lens, for leeward and windward islands. Such curves may be valuable tools to water resource manager of atoll islands.
Water 02 00001 g021
Table 1. Region, width, and observed lens thicknesses for atoll islands across the Pacific and Indian Oceans. Thickness is reported as maximum thickness of the lens. Bottom of the lens for most studies was defined as 500 mg L-1 chloride concentration (2.5% relative seawater salinity of ground water). The study by Hunt and Peterson [15] used the 250 mg L-1 isochlor. The letter associated with each atoll corresponds to the letter found on the map in Figure 2.
Island / LocationAtollRegion or NationSourceLocation on AtollWidth
(m)
Lens Thickness
(m)
CantonmentDiego Garcia ACentral Indian[19]Leeward 220020
AO NWDiego GarciaCentral Indian[19]Leeward 115015
AO SEDiego GarciaCentral Indian[19]Leeward 130020
Home IslandCocos B East Indian[18]Offset7758
WI NorthernCocos East Indian[18]Leeward 80014
WI 1Cocos East Indian[18]Leeward 80015
WI 6Cocos East Indian[18]Leeward 50015
WI 8Cocos East Indian[18]Leeward 40012
WI 22Cocos East Indian[18]Leeward 2707
South IslandCocos East Indian[18]Windward100011
FalalopUlithi CFSM[20]Offset9505
KhalapMwoakilloa DFSM[22]Windward4256
NgatikSapwuahfik EFSM[23]Leeward 90020
DekePingelap FFSM[24]Windward4004
PingelapPingelapFSM[25]Leeward 75016
LauraMajuro GMarshall Islands[13]Leeward 120014 to 22
KwajeleinKwajelein HMarshall Islands[15]Offset60010 to 18
Roi-NamurKwajeleinMarshall Islands[26]Windward7505 to 7
EneuBikini IMarshall Islands[27]Offset4005 to 10
BikiniBikiniMarshall Islands[27]Windward600<2
EnjebiEnewetak JMarshall Islands[17]Windward1000<2
MatabouNonouti KGilbert Islands[28]Offset3755
BuarikiTarawa LGilbert Islands[29]Offset120029
BuotaTarawaGilbert Islands[31]Offset65023
BonrikiTarawaGilbert Islands[31]Windward120023
NZ 4Christmas MKiribati[32]Leeward 150014
NZ 2ChristmasKiribati[32]Leeward 150017
Table 2. Attributes of Island Subsurface Hydrology Models.
ModelIsland TypeSolution
Type
Island
Width
RechargeUpper
Aquifer
K
Lower
Aquifer
K
Upper
Aquifer
Thickness
Single-Layer
Fetter [8]CircularAnalyticalxxx
Fetter [8]Infinite-stripAnalyticalxxx
Chapman [9]Infinite-stripAnalyticalxxx
Oberdorfer and Buddmeier [10] Empiricalxx
Double-Layer
Fetter [8]Infinite-stripAnalyticalxxxxx
Vacher [11]Infinite-stripAnalyticalxxxxx
Table 3. Table of drought factors for the algebraic model, for both western and eastern Caroline regions, leeward and windward islands, various island sizes.
Month 1Month 6Month 12Month 18Month 24
Island WidthOnset of DroughtPeak of DroughtRecoveryRecoveryRecovery
DROUGHT FACTORS D
WESTERN CAROLINE REGIONLeeward2000.4510.0000.4210.4880.711
4000.6980.3170.4750.5070.733
6000.8990.6210.6080.6790.909
Windward2000.0000.0000.0000.0000.000
4000.1220.0000.2620.2690.342
6000.2930.0000.2780.3920.475
EASTERN CAROLINE REGIONLeeward2000.7350.1190.4860.9530.643
4001.0680.4920.5900.9170.788
6000.9240.6350.7850.9120.875
Windward2000.0000.0000.0640.2890.000
4000.4200.0000.3590.8750.551
6000.8020.2230.5110.9570.690
Publisher’s Note: MDPI stays neutral with regard to jurisdictional claims in published maps and institutional affiliations.