Article

Analysis of Hydrological Evolution and Drought–Flood Patterns in Dongting Lake Based on Improved Standardized Water-Level Index (ISWI)


College of Environment and Ecology, Hunan Agricultural University, Changsha 410128, China
*
Author to whom correspondence should be addressed.
Water 2026, 18(9), 1039; https://doi.org/10.3390/w18091039
Submission received: 19 February 2026 / Revised: 16 April 2026 / Accepted: 24 April 2026 / Published: 27 April 2026
(This article belongs to the Section Hydrology)

Abstract

The primary aim of this study is to identify the driving mechanisms behind long-term water-level changes and drought–flood transitions in Dongting Lake. To achieve this, we employed methods including the Improved Standardized Water Level Index (ISWI), Mann–Kendall test, Sen’s slope estimator, and a random forest–SHAP model to analyze hydro-meteorological data from 1992 to 2023. The results demonstrate a significant overall decline and spatial heterogeneity in water levels, alongside a systemic shift in the regional pattern from flood-dominated conditions to frequent droughts with intense drought–flood abrupt alternations. Crucially, during the critical autumn water recession period, runoff anomalies from the Yangtze River’s three outlets emerged as the dominant factor driving water-level changes, far exceeding the influence of local precipitation. Furthermore, a recent downward shift in the water level–discharge relationship indicates that under identical inflow conditions, water levels are now 1.5 to 2.0 m lower than in previous decades. These general findings highlight that critical-period inflow reductions and altered boundary hydrodynamic conditions mutually amplify low-water-level risks, providing a scientific reference for adaptive water resource management in complex river-connected lakes.

1. Introduction

River-connected lakes are vital complex water systems that play key roles in regional flood control, runoff regulation, and wetland ecosystem maintenance. Driven by climate change and human activities, their hydrological processes have altered significantly in recent years [1]. Dongting Lake, a typical river-connected lake in the middle Yangtze River, has its water levels controlled not only by basin hydro-meteorology but also by mainstream water–sediment processes and evolving river–lake relationships. Therefore, identifying the driving mechanisms of its water-level variations is essential for ensuring regional water security and maintaining wetland stability.
Since the 21st century, the combined effects of upstream cascade reservoirs, channel silting, and shifting precipitation patterns have destabilized Dongting Lake’s hydrological regime [2]. This manifests as earlier dry seasons, frequent extreme low-water events, and intense drought–flood abrupt alternations, which exacerbate seasonal water shortages and threaten migratory bird habitats [3]. Previous studies have highlighted climate factors and human disturbances as the primary drivers of lake water-level changes [4,5]. For inland lakes, evapotranspiration often dominates water decline [6,7]. Conversely, for river-connected lakes like Dongting Lake, the mainstream’s backwater and drawing effects have been heavily discussed [8,9]. Following the Three Gorges Project (TGP) operation, riverbed scouring in the Jingjiang reach has notably increased low-water-level risks under identical inflow conditions [10,11], while upstream reservoir impoundment further alters dry-season water supply [12].
Despite these foundations, current research presents three main gaps. First, traditional meteorological indicators like SPI or SPEI [13] exhibit limited suitability for river-connected lakes. They fail to capture “hydraulic droughts” driven by river regulation and riverbed scouring, often confusing normal seasonal low water levels with true drought anomalies [14,15]. Second, quantitative structural attribution remains incomplete. While Dongting Lake is fed dynamically by the Yangtze River’s three outlets, four local rivers, and precipitation [16,17], most studies focus on isolated factors or periods. Systematic evaluations quantifying the evolving contributions of these diverse sources during critical low-water periods are lacking [18,19]. Third, the long-term stage-transition characteristics of extreme events require deeper investigation. Although recent anomalies (e.g., the 2022 extreme drought) have been noted, a systematic review of how the regional pattern has shifted from flood-dominated to frequent drought–flood abrupt alternations over the past 30 years is still needed [20,21].
To fill these identified research gaps, this study proposes a comprehensive framework for drought–flood identification and structural attribution using hydro-meteorological data from Dongting Lake (1992–2023). To address the first gap, we developed an Improved Standardized Water Level Index (ISWI) based on STL decomposition to filter seasonal noise and accurately capture abnormal hydrological events. To address the second gap, we integrated key water sources into a unified random forest—SHAP model to quantitatively attribute water-level changes during the critical autumn water recession period. Finally, to address the third gap, we conducted a long-term series analysis to reveal the stage-by-stage evolution and intensity shifts of the lake’s drought–flood patterns. The findings aim to answer three main questions: (1) What are the long-term trends and spatial–temporal characteristics of water-level changes from 1992 to 2023? (2) How has the drought–flood pattern shifted, and how have extreme events evolved? (3) How do varying inflows and altered river–lake relationships drive critical-period water-level changes? Ultimately, this research provides a scientific reference for adaptive water resource management and disaster defense in complex river-connected lakes.

2. Materials and Methods

2.1. Study Area

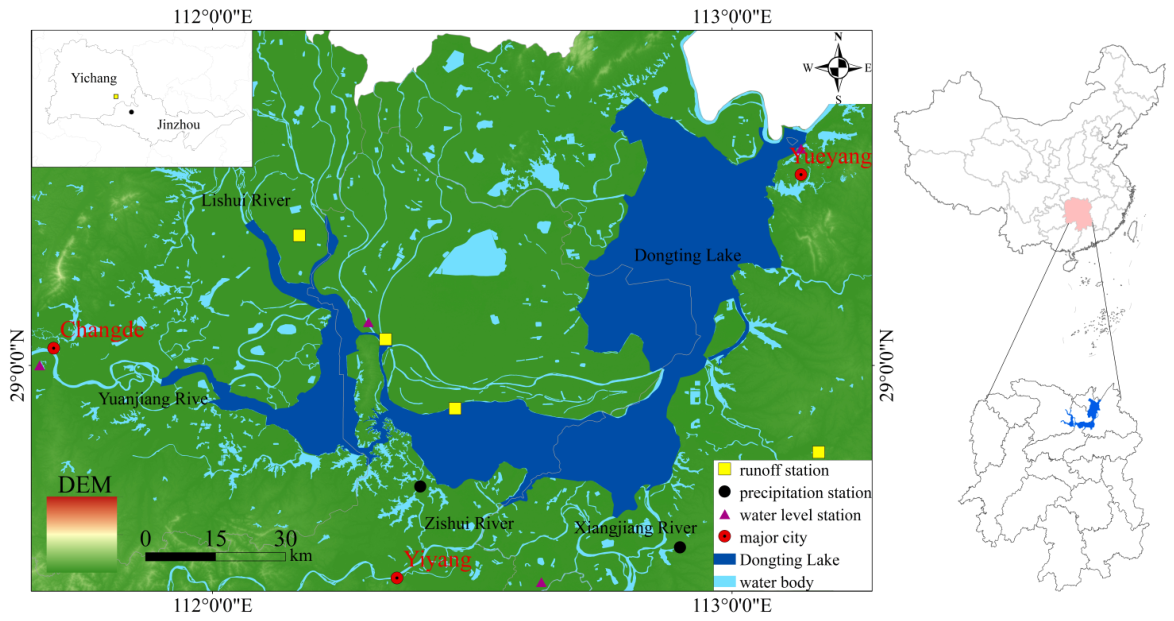
Dongting Lake (110°–113° E, 28°–30° N) is located in central and northern Hunan Province, on the south bank of the middle reaches of the Yangtze River. As shown in the detailed and contour maps of the study area (Figure 1), it is the second-largest freshwater lake in China and a typical river-connected lake that regulates and stores water [22]. Its catchment area is about 263,300 km2, covering parts of Hunan, Hubei, and Jiangxi provinces. The lake area consists of East Dongting Lake, South Dongting Lake, West Dongting Lake, and the surrounding river branches. The overall terrain is higher in the west and lower in the east, presenting the typical features of a lakeside alluvial plain [23].
The water system has a complex connected pattern. On the south side, it receives water from the four rivers in Hunan (the Xiang, Zi, Yuan, and Li rivers). On the north side, it diverts floodwater from the Jingjiang reach of the Yangtze River through the three outlets (Songzi, Taiping, and Ouchi). After the lake regulates this mixed runoff, the water flows back into the mainstream of the Yangtze River at Chenglingji [24]. Due to long-term sediment deposition and human activities like land reclamation, the normal water level area has shrunk to about 2625 km2. The water level fluctuates significantly within the year, and during the dry season, the lake is highly sensitive to changes in external inflow [25].
The climatic conditions of the region are characterized by a humid subtropical monsoon climate. The regional average annual air temperature was 16–18 °C, and the average annual precipitation was 1200–1700 mm during 1992–2023. Crucially, the precipitation exhibits strong seasonality, dividing the year into distinct wet and dry periods. The wet period typically begins in late March or early April and extends through early July, accounting for 50% to 60% of the annual precipitation. Subsequently, a significant decrease in precipitation marks the transition into the dry period from July to September, making the area prone to periodic summer and autumn droughts. Affected by both this concentrated monsoon precipitation and the dynamic water exchange between the river and the lake, the water level of Dongting Lake shows clear seasonal changes [26]. This strong seasonality provides an important background for distinguishing normal seasonal low water levels from abnormal drought events.

2.2. Data Sources

This study collected water level, precipitation, and runoff data in the Dongting Lake area (Table 1) to analyze long-term water-level changes, drought–flood pattern transitions, and their driving factors. The data were mainly obtained from the Hydrological Yearbook of the Yangtze River Basin (Volume 6), the Hydrology Bureau of the Changjiang Water Resources Commission, and the Hunan Hydrology Platform. Specifically, we used water level data from 1992 to 2023 to identify long-term trends and construct the SWI. We used precipitation and runoff data from 2009 to 2023 to analyze changes in the water source structure and conduct the attribution study.
Before the analysis, we processed all data and applied quality control. This included checking time series completeness, verifying station details and units, and handling outliers. We then used the data at daily or monthly scales based on the specific analysis needs.
We focused the water source and attribution analysis on the 2009–2023 period for two main reasons. First, this period provides complete and synchronized precipitation and runoff data across multiple stations. Second, after 2009, the Three Gorges Project (TGP) moved from construction to full operation, entering the 175 m experimental impoundment and subsequent regulation stages [27]. This makes the 2009–2023 period ideal for studying how changes in river–lake relationships affect Dongting Lake’s water levels under human regulation. Therefore, our results better represent the current and future realities of the river–lake connection.

2.3. Trend Tests of Hydro-Meteorological Variables

In this study, we used three methods to identify the statistical characteristics of the water level, runoff, and precipitation series. We used the Mann–Kendall (M-K) test to determine trend significance, the UF/UB test to identify abrupt change years, and Sen’s slope estimator to calculate the rate of change. We then combined these statistical results with subsequent process analyses for a comprehensive interpretation.

2.3.1. Mann–Kendall Trend Test

The M-K test is a non-parametric statistical method recommended by the World Meteorological Organization [28]. It is widely used to analyze time series of hydro-meteorological variables. The main advantage of this method is that it does not require the sample data to follow a specific distribution. Also, it is not affected by a few outliers. By standardizing the statistical variables, we obtained the test statistic Z. A positive value ( Z > 0 ) indicates an increasing trend, while a negative value ( Z < 0 ) indicates a decreasing trend. If | Z | 1.96 , the trend passes the 95% significance test.

2.3.2. Abrupt Change Identification (UF/UB Test)

We used the UF/UB test to identify the year of abrupt changes [29]. This method constructs a rank sequence to calculate a forward statistic ( UF k ) and a backward statistic ( UB k ). If UF k or UB k exceeds the critical value ( ± 1.96 at the α = 0.05 significance level), the trend is significant. If the UF k and UB k curves cross each other within the critical value range, the intersection point indicates the exact year when the abrupt change occurred.

2.3.3. Sen’s Slope Estimator

Sen’s slope (the Theil–Sen estimator) is a non-parametric statistical method used to quantify the rate of change in a time series [30]. The resulting β value represents this rate of change. Specifically, β > 0 indicates an increasing trend, and β < 0 indicates a decreasing trend. The absolute value, | β | , reflects the magnitude of the trend change.

2.4. Introduction and Validation of the Improved SWI (ISWI) Method

Using daily water level data from the Chenglingji station (1992–2023), we developed the Improved Standardized Water Level Index (ISWI) to identify abnormal water levels in river-connected lakes. We then combined this index with run theory to identify drought and flood events.
The ISWI does not redefine the basic principles of standardized indices. Instead, it adjusts three specific steps: extracting abnormal signals, applying conditional standardization, and identifying continuous events. We made these adjustments to address the unique features of river-connected lakes, such as strong seasonality, heavy human regulation, and rapid water-level fluctuations. The main goal of the ISWI is to identify abnormal water levels compared to the normal seasonal background. This improves the accuracy of identifying daily-scale drought–flood events in river-connected lakes [31].

2.4.1. Construction of the ISWI

The daily water level series of river-connected lakes usually includes a long-term trend, a stable seasonal cycle, and short-term abnormal fluctuations. To remove the long-term trend and seasonal effects, we first used the STL method to decompose the daily water level series Y t [32]:
Y t = T t + S t + R t
where T t is the trend component, reflecting the long-term water level background. S t is the seasonal component, representing the periodic wet and dry changes within the year. R t is the residual component, representing the short-term abnormal fluctuations after removing the trend and seasonal components.
The traditional SWI uses the overall mean ( μ Y ) and standard deviation ( σ Y ) of the entire series for calculation (i.e., S W I t = Y t μ Y σ Y ). This reflects the overall water level fluctuation [33,34]. In contrast, the ISWI aims to capture abnormal water level deviations relative to the normal seasonal background. Therefore, we discarded the uniform annual standardization. Instead, we built a conditional empirical distribution for each calendar day.
Suppose day t corresponds to calendar day d. We extracted the residual samples within a k-day window before and after day d across all years. To balance seasonal representation and sample size stability, we set k = 15 (i.e., using a 31-day window). Let r t be the rank of R t in this sample, and n d be the total sample size. Its empirical probability P t is calculated as
P t = r t 0.44 n d + 0.12
Based on this, the Improved SWI (ISWI) is defined as
I S W I t = Φ 1 ( F ^ d ( R t ) )
where Φ 1 is the inverse function of the standard normal distribution, and F ^ d ( R t ) corresponds to the empirical probability P t . This calculation process converts the daily residual R t into its relative probability position under the same seasonal background. Then, it maps this probability into the standard normal space to complete the construction of the index.

2.4.2. Identification and Classification of Drought and Flood Events

After calculating the ISWI series, we used run theory to identify continuous abnormal events. Water-level changes in river-connected lakes usually start quickly and happen in distinct stages. To capture the early stages of abnormalities and filter out high-frequency noise, we set a precise daily threshold of ± 0.5 . This is finer than the conventional threshold of ± 1.0 often used in the multi-scalar SPI [35,36]. In a standard normal distribution, these thresholds correspond to the 30.8% and 69.2% percentiles. They serve as sensitive statistical tipping points to show when the hydrological system deviates from its normal state [37,38].
The specific identification criteria are as follows:
  • State Determination: If I S W I t 0.5 , we define it as an abnormally high water level state. If I S W I t 0.5 , we define it as an abnormally low water level state.
  • Event Identification: When the abnormal state lasts for D 5 consecutive days, allowing for a brief interruption of no more than 3 days, we identify this time period as a single run (i.e., a continuous event).
To scale up from daily abnormal events to annual drought and flood characteristics, we applied the “dominant extreme” principle to determine the annual attribute. We extracted the maximum and minimum ISWI values for year y. We then defined the annual intensity index ( I y ) as
I y = I S W I max ( y ) , I S W I max ( y ) | I S W I min ( y ) | I S W I min ( y ) , I S W I max ( y ) < | I S W I min ( y ) |
  • Annual Classification: If I y > 0 , we classify it as a flood year. If I y < 0 , we classify it as a drought year. Table 2 details the specific grading standards for these drought and flood events.

2.4.3. Method Validation and Limitations

To objectively evaluate how accurately and sensitively the ISWI identifies abnormal water levels, we validated the method in two ways: internal index comparison and external event verification. We also examined its limitations.
  • Internal Index Comparison: First, we used the SPI-3 as a meteorological baseline to compare the results of the SWI and the ISWI from 2009 to 2023 (Table 3). The results show that the ISWI identified more abnormal events than the SWI (101 versus 57 events). The ISWI also showed a shorter average duration for these events (20.5 days versus 67.4 days). In addition, the ISWI significantly reduced the seasonal misjudgment rate during the dry and wet seasons. The ISWI also had a higher correlation coefficient (0.61) and a higher consistency rate (68.3%) with the SPI-3 compared to the SWI. This proves that the ISWI is much more suitable for the complex water level environments of river-connected lakes.
  • External Event Verification: Second, we selected two typical events for external validation based on official hydrological records from the Hunan Provincial Government: the 2020 flood and the 2022 drought. We converted both the official event status and the ISWI results into a daily-scale series. Then, we calculated the consistency rate, hit rate, missed alarm rate, Kappa coefficient, and the time deviation for the start and end dates. This further confirms the ability of the ISWI to capture actual extreme hydrological events.
  • Limitations: Finally, we must point out that the ISWI results depend partly on specific parameter settings. These include the width of the calendar window (k), the threshold for abnormal states ( ± 0.5 ), and the allowed interruption days in the run theory. Therefore, our identification results rely to some extent on these empirical parameters.

2.5. Construction of the Random Forest Attribution Model and SHAP Interpretation

To quantitatively identify the relative effects of different water source factors on water-level changes in Dongting Lake during the critical period, we built a random forest attribution model. We also combined it with the SHAP (SHapley Additive exPlanations) method to explain variable importance. Compared to linear regression, the random forest model better captures the nonlinear relationships between variables and water levels under multi-source supply conditions. It also reduces how multicollinearity among explanatory variables affects the stability of attribution results. In this study, we explain each factor based mainly on its relative statistical strength within the model; we do not treat this directly as a strict physical contribution [39].

2.5.1. Critical Period Sample Construction and Variable Setting

We focused our attribution analysis on the critical water recession period from September to November. During this stage, the lake water level is most sensitive to changes in boundary inflow, and low-water-level risks mainly form and grow during this time. We built the critical period samples based on monthly data from 2009 to 2023, obtaining a total of 45 samples (15 years × 3 months).
Because the critical period still has clear seasonal differences between its months, we wanted to reduce this interference. Therefore, we calculated the monthly anomaly values for the water level, runoff from the three outlets, runoff from the four rivers, and lake precipitation. This helps us capture the interannual abnormal fluctuations within the critical period. We set the dependent variable as the monthly water-level anomaly at the Chenglingji station. We set the explanatory variables as the runoff anomalies from the three outlets, runoff anomalies from the four rivers, and lake precipitation anomalies.

2.5.2. Random Forest Model Construction and Validation

We used a random forest regression model to fit the relationship between water-level anomalies and the explanatory variables during the critical period. The model inputs are the runoff anomalies from the three outlets, runoff anomalies from the four rivers, and lake precipitation anomalies. The model output is the monthly water-level anomaly at Chenglingji. To avoid sample leakage and test the model’s robustness across different years, we used a grouped cross-validation method based on years. We used the cross-validation R 2 , RMSE, and MAE to evaluate how well the model fits and generalizes.

2.5.3. SHAP Interpretation and Relative Contribution Calculation

After fitting the random forest model, we used SHAP values to explain the marginal contribution of each variable to the model output. We used the mean absolute SHAP value to measure the overall explanatory strength of each variable on water-level changes during the critical period. We then normalized these values into relative contribution rates. At the same time, we used SHAP dependence plots to determine the main response direction between each variable and the water-level anomaly. Note that the SHAP results mainly reflect the explanatory strength within the model itself.

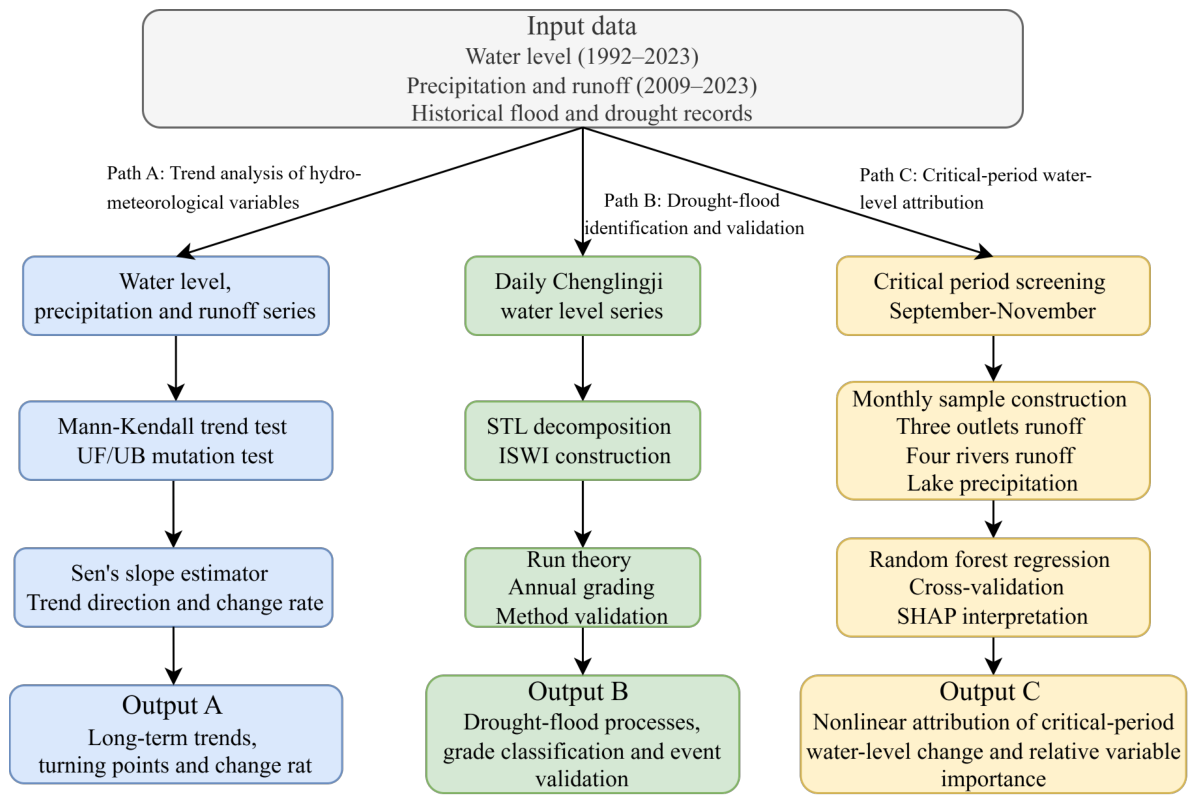
2.6. Research Workflow

This study focuses on water-level changes, drought–flood identification, and their driving mechanisms in Dongting Lake. We designed a clear research workflow comprising six main steps: data input, trend testing, ISWI construction, drought and flood identification, attribution analysis, and result validation.
Specifically, the workflow was as follows: First, we used the M-K test, the UF/UB test, and Sen’s slope estimator to analyze hydro-meteorological changes. Second, we used STL decomposition and run theory to construct and validate the ISWI. Finally, we applied the random forest model and the SHAP method to attribute water-level changes during the critical water recession period. We also used cross-validation metrics to ensure the robustness of our results. Figure 2 illustrates this complete process.

3. Results

3.1. Water Level Trends in Dongting Lake

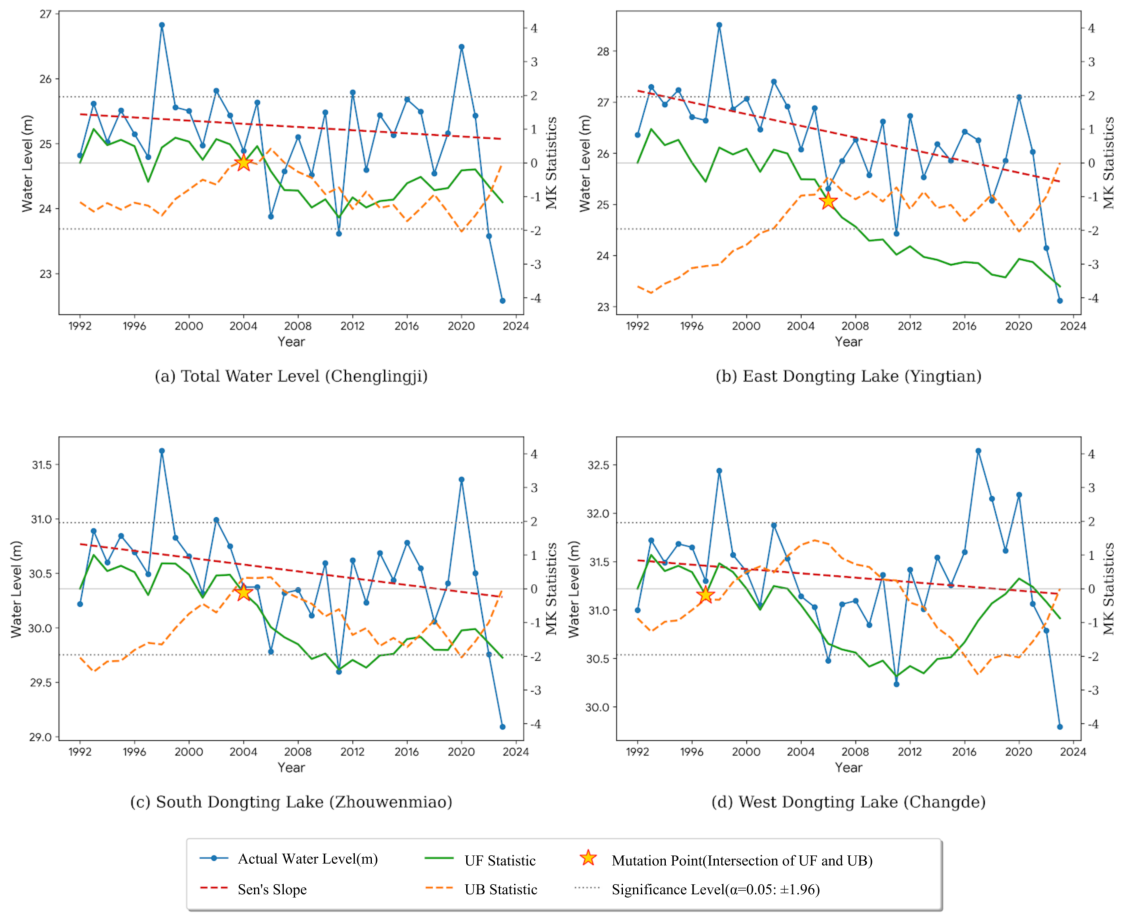
From 1992 to 2023, water levels in Dongting Lake showed an overall downward trend with clear spatial heterogeneity (Figure 3).
The M-K test and Sen’s slope analysis showed that the water level in East Dongting Lake dropped the most significantly ( Z = 3.65 , p < 0.001 , Sen’s slope = 0.057 m/a, Figure 3b). South Dongting Lake followed, also showing a significant decline ( Z = 2.03 , p < 0.05 , Sen’s slope = 0.016 m/a, Figure 3c). West Dongting Lake showed a much smaller decline ( Z = 0.20 ).
The abrupt change test further revealed that these water-level changes were not synchronized across different regions. West Dongting Lake experienced an abrupt water-level change first in 1997. In contrast, the abrupt change points (the intersections of the UF and UB curves) for the overall water level, East Dongting Lake, and South Dongting Lake were highly concentrated between 2004 and 2006.
The UF statistics for East Dongting Lake and the overall water level continuously broke below the 1.96 critical value. This indicates that the average water level in the central and eastern parts of Dongting Lake has shifted downward substantially. As a result, the trend of frequent low water levels during the dry season has become much more severe.

3.2. Evolution Characteristics of Drought and Flood in Dongting Lake and Validation with Typical Events

3.2.1. Characteristics of Drought and Flood Evolution

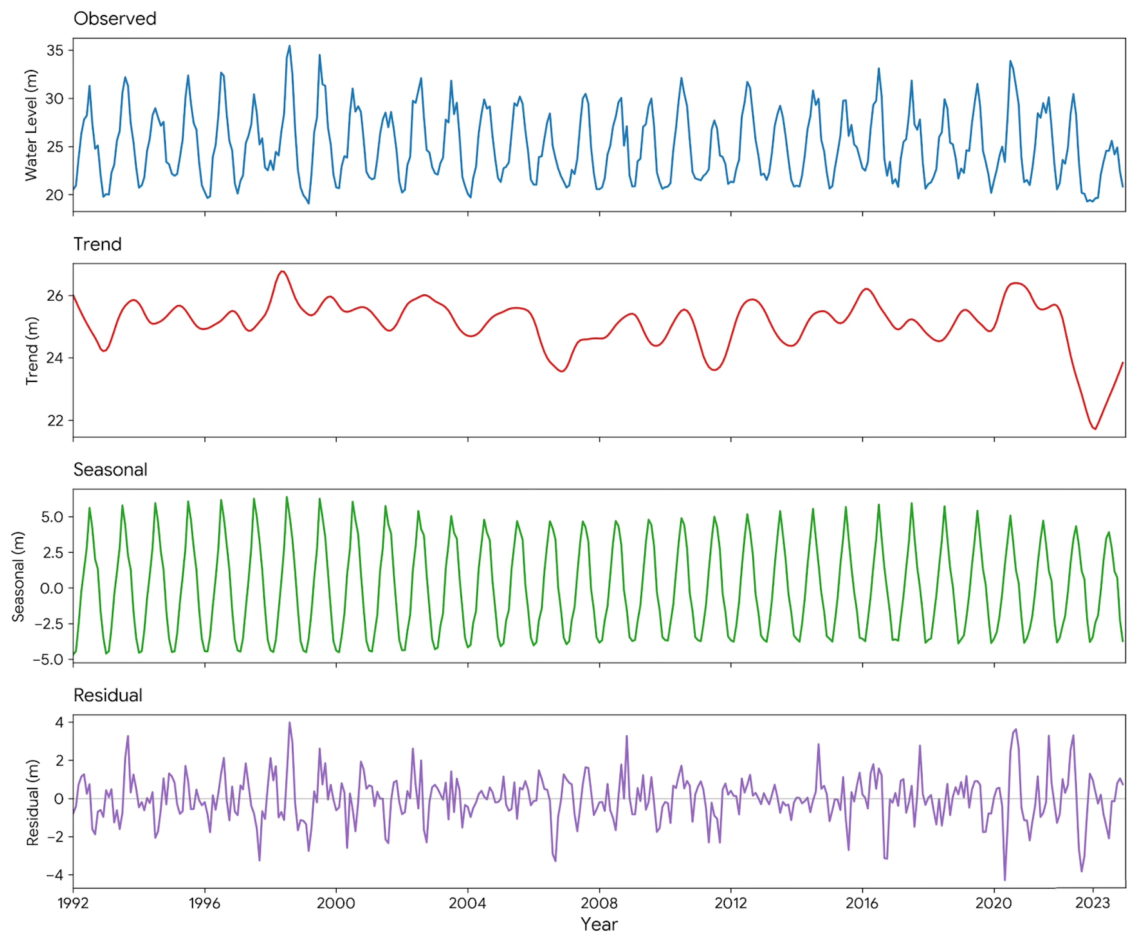
The results show (Figure 4 and Table 4) that from 1992 to 2023, the drought–flood pattern experienced a clear transition. It shifted from being “flood-dominated” to having “frequent droughts,” and finally to showing intense “drought–flood abrupt alternations.”
During the study period, the entire area experienced 12 flood years and 8 drought years, with clear differences in their extreme values. Specifically, 1998 was the extreme flood year ( I y = 3.854 ), while 2022 was the extreme drought year ( I y = 3.204 ).
The evolution of droughts and floods showed clear stages. Before 2002, floods dominated the system, with consecutive severe or worse floods. From 2003 to 2013, the region entered a period of frequent droughts. For example, severe droughts occurred in 2006 ( I y = 1.952 ) and 2011 ( I y = 1.883 ). After 2014, extreme drought and flood events happened continuously. Notably, the system switched from an extreme flood in 2020 to an extreme drought in 2022. This rapid shift had a huge amplitude of 6.06, highlighting the severe instability of the hydrological system.
The M-K test and Sen’s slope analysis showed that the overall flood intensity weakened slightly (Sen’s slope = 0.002 ). However, the drought intensity increased significantly at a rate of about 0.068 /a. This indicates that the destructive power of extreme drought events is rapidly growing.

3.2.2. Validation with Typical Historical Events

We selected the massive flood in 2020 and the severe drought in 2022 as typical cases for external validation. We analyzed the consistency between the time periods identified by the ISWI and the official hydrological records (Table 5).
The results showed a high level of agreement. The classification consistency rates for both events were over 93.5%, and the Kappa coefficients were 0.867 and 0.877, respectively.
For the 2020 flood event, the ISWI achieved a 100% hit rate. Its identified end time was 10 days later than the official record. This is because official records are mostly based on fixed warning water levels for daily management. In contrast, the ISWI reflects statistical abnormalities compared to the same historical period.
For the 2022 “drought during the normal flood season” event, the ISWI removed the masking effect of the normal wet season. As a result, it captured the early signal of a sudden water level drop much more sensitively. It identified the start of the drought 7 days earlier than the official record.
This validation shows that the ISWI can effectively filter out the interference of seasonal fluctuations. It accurately captures the abnormal drought–flood processes in river-connected lakes.

3.3. Water Source Structure and Water-Level Attribution Analysis in Dongting Lake

3.3.1. Characteristics of Precipitation and Runoff Changes

From 2009 to 2023, precipitation and runoff in the lake area showed significant interannual fluctuations. Also, their trends varied across different seasons.
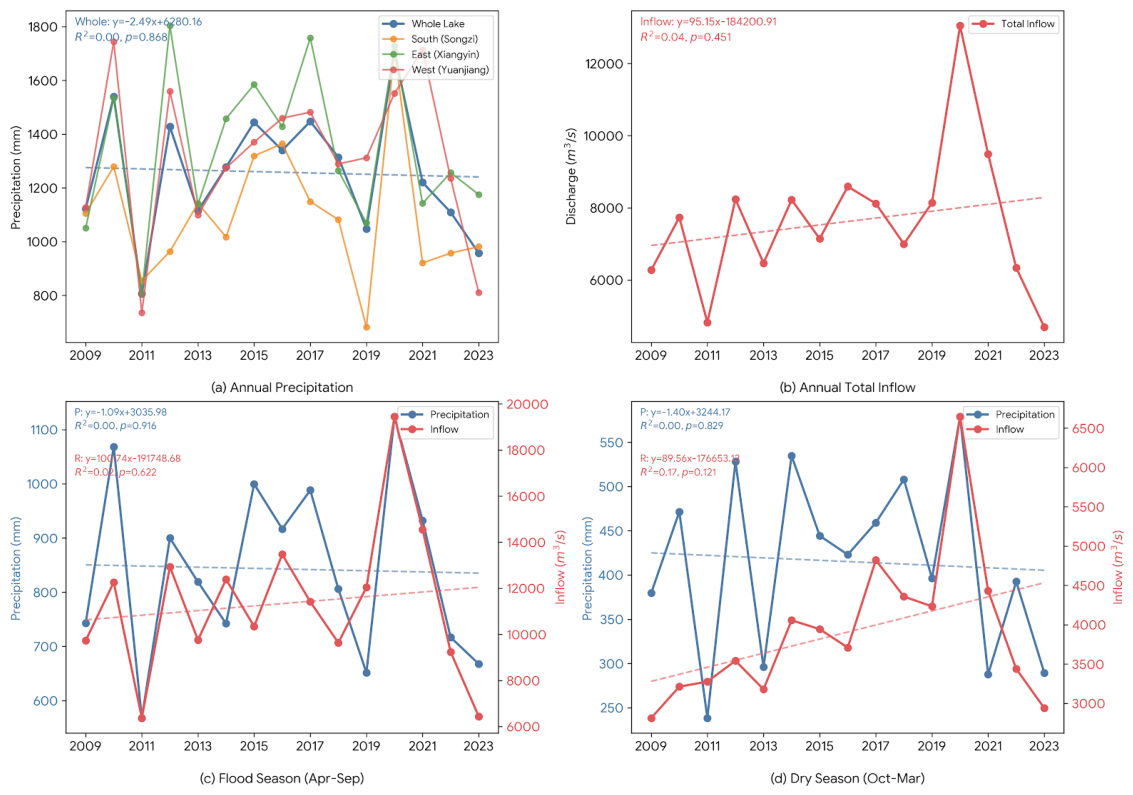
On an interannual scale (Figure 5a,b), neither precipitation nor runoff showed abrupt trend changes ( p > 0.05 ). The average annual precipitation across the whole lake showed a slight downward trend (Sen’s slope = 11.82 mm/a). The precipitation curves for the eastern, southern, and western areas highly overlapped, showing clear spatial consistency. However, unlike the precipitation trend, the total inflow runoff showed a slight upward trend (Sen’s slope = 27.46 × 10 8 m3/a, Figure 5b).
The differences were clearer on a seasonal scale. During the flood season (April to September, Figure 5c), precipitation and runoff changed almost synchronously. They both showed weak trends that were not significant. Specifically, precipitation decreased slightly (Sen’s slope = 3.19 mm/a), while runoff increased slightly (Sen’s slope = 5.39 × 10 8 m3/a). In contrast, during the dry season (October to March of the following year), precipitation continued to decrease (Sen’s slope = 1.76 mm/a, Figure 5d). At the same time, the inflow runoff showed an upward trend (Sen’s slope = 17.27 × 10 8 m3/a).

3.3.2. Analysis of Water Source Structure Changes

From 2009 to 2023, the water source structure generally followed a clear pattern: “dominated by the four rivers, supported by the three outlets, with minimal precipitation.” On average, the four rivers contributed 59.5% of the annual water volume. The three outlets contributed 39.8%, and lake precipitation contributed only 0.7%.
Trend analysis showed that the contribution of the four rivers increased slightly (Sen’s slope = 0.32%/a). The contribution of the three outlets decreased slowly (Sen’s slope = 0.31 %/a). These two sources showed a clear complementary trade-off. However, neither trend passed the significance test ( | Z | < 1.96 ).
In extreme years, the basin showed a strong buffer and compensation effect. During the extreme flood year of 2020 and the extreme drought year of 2022, the contribution rate of the four rivers surged to 64.98% and 62.36%, respectively. Then, it quickly returned to normal in 2023 (56.53%, Table 6).

3.3.3. Attribution Analysis of Water-Level Changes

We conducted a random forest attribution analysis focusing on the critical water recession period (September to November). The model showed good explanatory power under the year-based grouped cross-validation (CV R 2 = 0.732 , RMSE = 1.180 m, MAE = 0.828 m; Table 7).
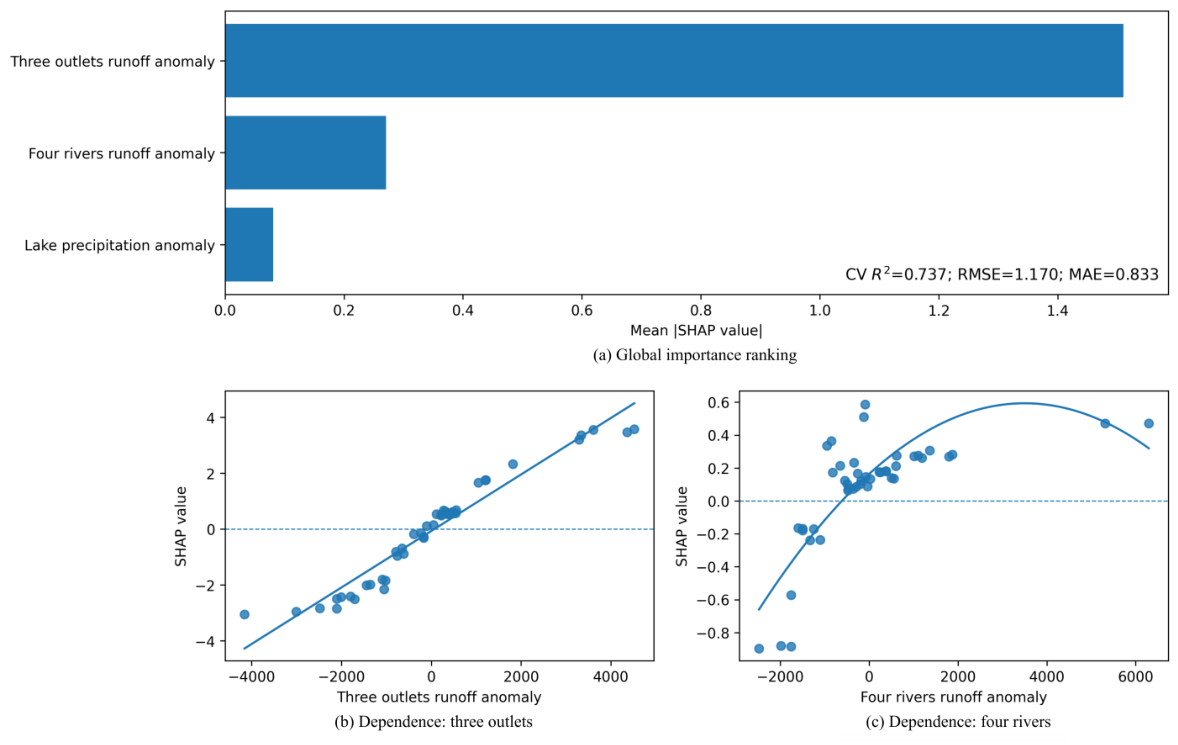
The SHAP values showed that runoff anomalies from the three outlets had the highest overall explanatory strength for water-level anomalies during this critical period. Its mean absolute SHAP value was 1.499, and its relative contribution rate was 79.5%. The four rivers came second, with a mean absolute SHAP value of 0.259 and a relative contribution rate of 13.7% (Figure 6). Lake precipitation had the lowest impact, with a mean absolute SHAP value of 0.128 and a relative contribution rate of 6.8%.
The SHAP dependence plots further showed that an increase in runoff anomalies from the three outlets generally corresponded to higher water-level anomalies. When this runoff dropped to a low level, the risk of water-level decline increased significantly. Runoff from the four rivers and lake precipitation also showed an overall positive but weaker influence.
These results indicate that under the current model, the inflow changes from the three outlets have a stronger link to the formation of low water levels.

3.4. Process Response Analysis of the Drought–Flood Pattern

3.4.1. Changes in the Water Level–Discharge Relationship

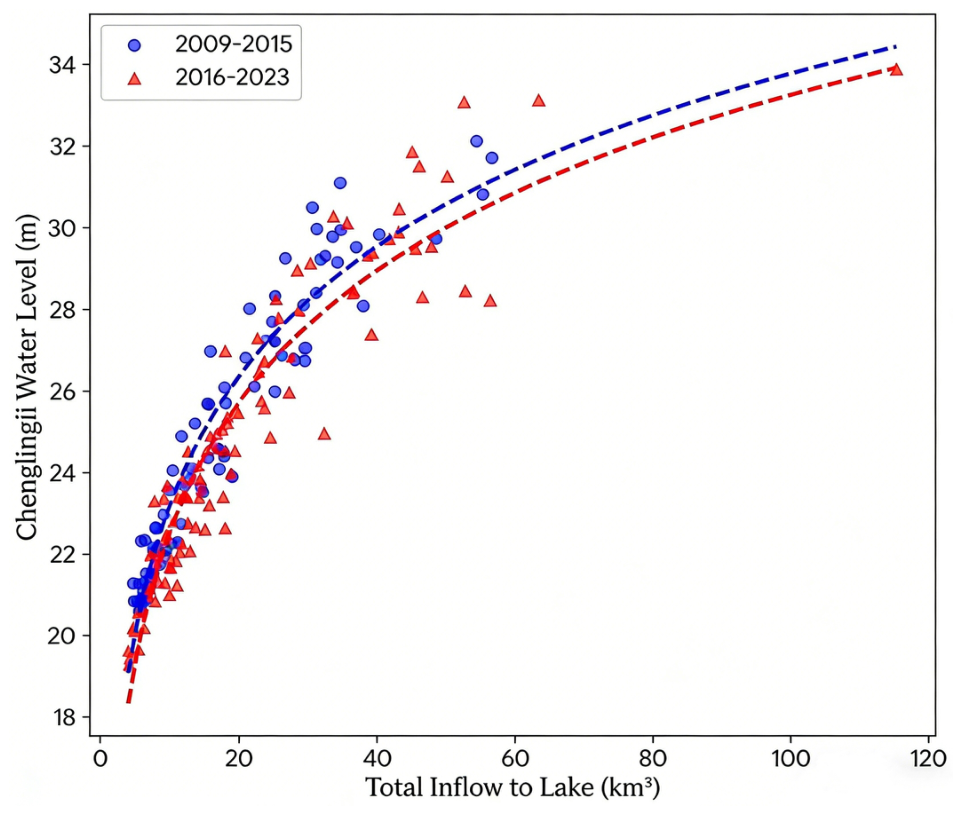
We divided the study period into an early stage (2009–2015) and a recent stage (2016–2023), and built logarithmic fitting models for the water level–discharge relationship for each. The results show a clear separation between the two curves (Figure 7).
Both stages showed high correlations, with R 2 = 0.85 for the early stage and R 2 = 0.8 for the recent stage. However, the recent curve shifted significantly to the lower right. This indicates that under the same discharge conditions, the corresponding water level in the lake is now lower than in the early stage. For example, at a typical dry-season discharge of 10,000 m3/s, the recent water level dropped by about 1.5 to 2.0 m compared to the early stage.
This shift reveals a structural change in Dongting Lake’s water level–discharge relationship. Specifically, the water level per unit of discharge has decreased, suggesting that the lake’s outflow capacity may have improved compared to the early period.

3.4.2. Source-Flow Responses to Drought–Flood Abrupt Alternations

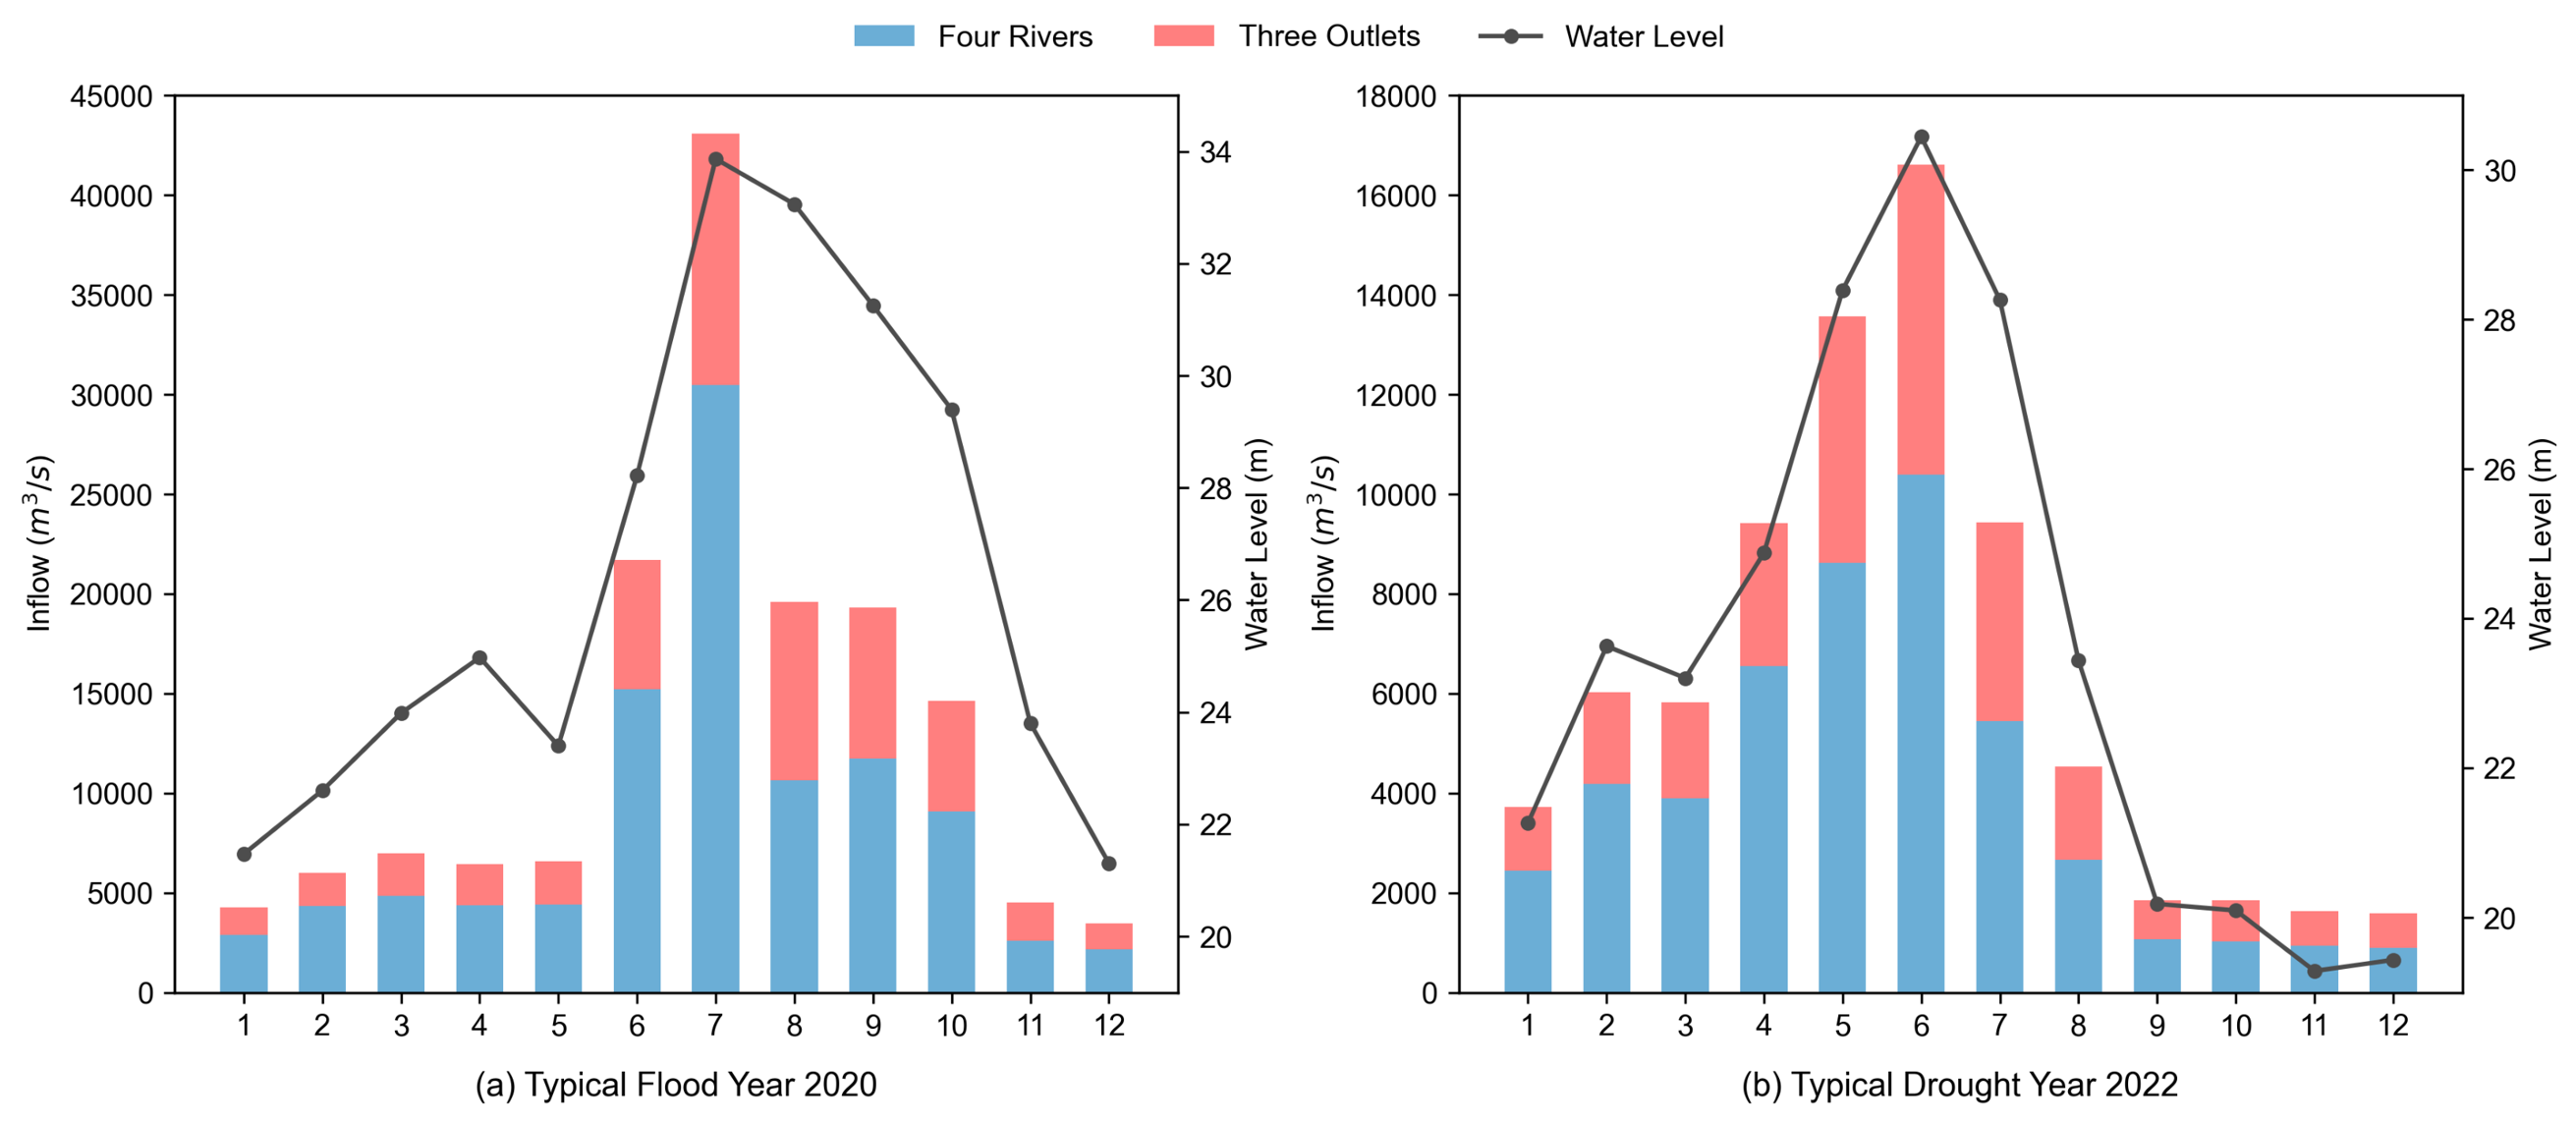
The 2020 extreme flood and the 2022 extreme drought showed significant differences in their inflow structures and water-level responses (Figure 8).
In June and July of 2020, inflows from both the four rivers and the three outlets increased simultaneously. The peak total inflow reached about 43,000 m3/s. The water level at Chenglingji stayed between 33 and 34 m, and this high-water period lasted for about 15 days (Figure 8a).
In contrast, in August 2022, runoff from the three outlets completely dried up, dropping to 0 m3/s. Inflows from the four rivers also weakened at the same time. The total inflow plummeted from 12,000 m3/s to below 4500 m3/s in just about 30 days. As a result, the water level at Chenglingji dropped by nearly 5 m within a single month (Figure 8b).
Correlation analysis showed that the correlation coefficient between the water level and total inflow reached 0.97 in 2022, which is significantly higher than in normal years. This indicates that under low-water-level conditions, the lake system responds much more directly to inflow changes, and its buffering capacity is severely weakened.

4. Discussion

4.1. Spatial Differentiation of Water-Level Evolution and Its Boundary Responses

During the study period, the most notable feature of Dongting Lake’s water-level evolution was not a uniform decline. Instead, it showed strong spatial heterogeneity and a time lag. Statistical results show that the water level in East Dongting Lake dropped highly significantly ( Z = 3.65 , p < 0.001 , Sen’s slope = 0.057 ). In contrast, West Dongting Lake showed only a weak decline ( Z = 0.20 ). Regarding the timing of abrupt changes, West Dongting Lake changed first in 1997. East and South Dongting Lake lagged behind, changing between 2004 and 2006.
This spatial decoupling shows that the lake’s water levels are not simply responding to uniform regional climate forcing. Rather, it deeply reflects how external boundary disturbances spread differently within a complex connected lake. Looking at this in a broader geographical context, large lakes worldwide generally face severe challenges of water storage depletion [40]. However, unlike closed lakes controlled by arid inland climates, the spatial divergence of water levels in river-connected lakes like Dongting Lake is mainly the result of shifts in the hydrodynamic axis of the river–lake system.
Similar spatial evolution features have also been observed in Poyang Lake, which belongs to the same Yangtze River system. Studies by Li et al. [41] and Chen et al. [42] point out that, affected by the incision of the Yangtze River mainstem and reservoir water storage, the hydrological connectivity of Poyang Lake’s inflow and outflow channels weakened asynchronously. This caused severe water recession in the northern lake area, while the south remained relatively stable.
For Dongting Lake, West Dongting Lake directly receives runoff from the three outlets of the Yangtze River. Therefore, it is most sensitive to the decline in upstream runoff. East Dongting Lake serves as the regulating outlet. Its continuous decline is more likely related to enhanced outflow caused by the lowered water level of the Yangtze River mainstem. Therefore, in the comprehensive management of large river-connected lakes, relying only on the lake-wide average water level as a warning indicator may mask the risk differences among different hydrological units. In the future, it is necessary to establish a partitioned monitoring and early warning threshold system for different lake areas.

4.2. Reconstruction of the Drought–Flood Pattern and Changes in System Buffering Capacity

Based on the identification results of the improved SWI, the drought–flood pattern of Dongting Lake underwent a substantial reorganization over the past 30 years. Before 2002, the system was dominated by floods (such as in 1998). However, after 2014, it fully shifted into regular fluctuations characterized by “enhanced droughts and abrupt drought–flood alternations.”
Notably, while the magnitude of historical floods did not decrease significantly, the drought intensity has been increasing at a rate of 0.068 /a. This led to rapid year-to-year switching between the extreme flood in 2020 and the extreme drought in 2022. This shows that the Dongting Lake hydrological system’s buffering capacity against extreme hydro-meteorological events is weakening, and its interannual stability has declined. Recent studies on Poyang Lake by Xue et al. [43] and Jia et al. [44] show that intensified extreme droughts not only cause low water levels to appear earlier but also weaken the ecological resilience of floodplain lakes.
The sheer scale of the abrupt drought–flood alternation in Dongting Lake between 2020 and 2022 further highlights a critical issue. Under the dual pressures of climate change and human activities, open lakes are showing a significantly stronger nonlinear amplification effect in response to basin precipitation and upstream inflow fluctuations. Therefore, the basin’s water security defense system should shift from a traditional “one-way flood and drought defense” to a “synergistic response to abrupt alternations.”
At the same time, the evolutionary logic of Dongting Lake is completely different from that of inland terminal lakes. Studies by Liu et al. [45] and Touge et al. [46] on the Aral Sea and Lake Balkhash show that closed lakes are more likely to experience one-way, continuous water depletion under the combined effects of long-term water consumption and climate drought. In contrast, Dongting Lake, as a river-connected lake, still maintains a large interannual water flux. Its core problem today is not one-way shrinking. Instead, it is the destabilized drought–flood rhythm and the faster switching between extreme states. Therefore, the risk characteristics of Dongting Lake are better summarized as “frequent low water levels and enhanced abrupt alternations,” rather than “persistent shrinking like a terminal lake.”

4.3. Attribution Analysis of Water-Level Variations During the Critical Period

Analysis of the water source structure shows that, on an annual scale, the four rivers in Hunan dominate the total inflow to Dongting Lake. However, during the critical water recession period from September to November, the random forest and SHAP results tell a different story. Runoff from the three outlets of the Yangtze River acts as the most important explanatory variable. Its relative contribution reaches 79.5%, which is significantly higher than that of the four rivers and precipitation during the same period.
This result highlights a key point: “who supplies more water” annually is not the same as “who better explains water-level changes” during the critical period. In other words, while the four rivers dominate the annual water supply, changes in the three outlets have a much stronger link to water-level variations when critical low water levels form. The three outlets do not just represent changes in inflow volume. They also reflect complex boundary effects, such as the water-level decline in the Yangtze River mainstem, the weakened river–lake blocking effect, and changes in outflow conditions [47,48]. Therefore, strictly speaking, under the current model framework and during the critical period, runoff from the three outlets is the dominant explanatory factor for water-level changes in Dongting Lake.
Our comparative analysis of the water level–discharge relationship between the early and recent stages further supports this conclusion. The recent curve shifted significantly to the lower right. Under the same inflow conditions, the corresponding water level dropped by 1.5 to 2.0 m. This means the worsening of low water levels during the dry season is not solely caused by a physical reduction in water from the three outlets. Instead, it is the combined result of changes in how inflow is structured during the critical period and the reshaping of outflow conditions. This aligns with the findings of Long et al. [49] regarding the evolution of Dongting Lake’s hydrodynamic performance after the impoundment of the Three Gorges Reservoir.
The significance of this section is that it clearly distinguishes between annual source dominance and critical-period water-level control. When assessing the low-water-level risk in Dongting Lake, we cannot simply look at which source supplies more water throughout the year. We must focus on how the inflow is structured during the critical period and its corresponding boundary hydrodynamic conditions.

4.4. Changes in Water Level–Discharge Relationship and Responses to Abrupt Drought–Flood Alternations

The results show that changes in Dongting Lake’s drought–flood pattern are not only affected by interannual precipitation and total runoff fluctuations but are also heavily controlled by the evolving water level–discharge relationship and the reorganization of source-flow processes during the critical period.
First, the structural shift in the water level–discharge relationship forms the foundation for the reshaping of droughts and floods. The lake is now more likely to experience extremely low water levels under the same inflow conditions. This reflects substantial changes in its outflow capacity and boundary control conditions. Studies by Sun et al. [50] and Luo et al. [51] on Dongting Lake and the Jingjiang–Dongting system indicate that changes in water age distribution, hydrodynamic performance, and the river–lake disconnection process collectively alter how the lake responds to inflow. In our study, the 1.5 to 2.0 m drop in water level under the same discharge conditions is a direct empirical reflection of this systemic reshaping.
Second, comparing typical events clearly reveals the process amplification mechanism behind abrupt drought–flood alternations. During the 2020 flood season, inflows from the three outlets and the four rivers surged simultaneously. This maintained high water levels (33–34 m) for 15 days. In contrast, in August 2022, the complete drying up of the three outlets combined with weakened inflow from the four rivers. This caused the total inflow to plummet, leading to a cliff-like drop in the water level within a single month. This shows that under extremely low water levels, the lake significantly loses its ability to buffer external disturbances. Furthermore, the correlation coefficient between water level and inflow reached 0.97 in 2022. This shows that once the inflow decline during the critical period overlaps with the currently lowered baseline water level, it easily triggers a rapid and severe low-water-level event.
Research by Gao et al. [52] and Lin et al. [53] on Dongting Lake’s ecological responses shows that changes in the river–lake connectivity pattern not only reshape the water-level process but also further affect vegetation patterns and lake ecological functions. Tian et al. [54] and Chen et al. [55] further note that since the Three Gorges Project began operating, the expansion of small water bodies in the Dongting Lake region and the ecological risks to downstream lakes have evolved in new ways.
In summary, the reconstruction of Dongting Lake’s drought–flood pattern is not caused by a single climate factor. Instead, under the regional climate background, it is more likely the result of the combined and mutually amplifying effects of large reservoir operations, riverbed scouring, inflow decline during the critical period, and changes in outflow conditions [56,57]. Therefore, basin disaster prevention and mitigation should no longer treat floods and droughts as isolated issues. They must be managed synergistically and adaptively within the framework of the same coupled river–lake system.

4.5. Research Limitations

Although this study systematically identified the drought–flood evolution of Dongting Lake and its key influencing factors, our data and methods still have some limitations.
  • Data Resolution: First, our trend and attribution analyses mainly rely on monthly and annual data. These broad time scales cannot fully capture shorter, daily-scale extreme processes, such as rapid water recession, reverse flow, and river–lake blocking.
  • Methodological Framework: Second, while the random forest and SHAP method reduces multicollinearity and captures nonlinear relationships, it remains a data-driven attribution framework. Therefore, its results serve better as evidence of statistical explanatory power rather than strict physical mechanism identification.
  • Source Variables: Third, our current water source analysis focuses mainly on runoff from the three outlets, runoff from the four rivers, and lake precipitation. We have not yet explicitly included groundwater extraction, water diversion for large irrigation districts, or more direct water-level boundary variables from the Yangtze River mainstem.
In the future, researchers should use higher-resolution time-series data and introduce large-scale coupled 1D–2D hydrodynamic models. This will help further verify the exact physical contributions of climate fluctuations, reservoir operations, riverbed evolution, and human water usage.

5. Conclusions

This study focused on Dongting Lake, a typical river-connected lake in the middle reaches of the Yangtze River. Based on the ISWI, combined with the M-K test, Sen’s slope estimator, and the random forest–SHAP attribution framework, we systematically analyzed the spatiotemporal evolution of drought and flood patterns in Dongting Lake from 1992 to 2023. We also explored the influencing factors from the perspectives of critical-period water-level variations and process responses.
The general research results are summarized as follows:
  • Water-Level Trends and Spatial Divergence: The overall water level of Dongting Lake showed a downward trend with clear spatial differentiation. From 1992 to 2023, the drop was most significant in East Dongting Lake, followed by South Dongting Lake, while West Dongting Lake showed no significant change. The asynchronous timing of abrupt changes indicates that the lake’s water-level evolution is not a uniform process but rather driven jointly by external boundary changes and local inflow conditions.
  • Shift in Drought–Flood Patterns: The regional pattern gradually shifted from being flood-dominated to having frequent droughts, with intensified drought–flood abrupt alternations. While flood intensity changed little, drought intensity continued to increase. The quick succession of extreme floods and droughts in recent years shows that the amplitude of fluctuations has widened, significantly weakening the system’s hydrological buffering capacity.
  • Source Structure vs. Critical-Period Attribution: Although the four rivers act as the main annual water source, the random forest–SHAP model reveals that runoff from the three outlets is the dominant factor for water-level changes during the critical autumn water recession period. The relative explanatory power of the four rivers and lake precipitation is much lower, suggesting that dry-season low-water processes are strictly linked to inflow changes from the three outlets.
  • Amplified Process Responses: Dongting Lake now responds to abnormal hydrological processes with more dramatic water-level fluctuations. The recent downward shift in the water level–discharge relationship means that under identical inflow conditions, water levels are generally lower. Consequently, current boundary conditions more easily amplify drought and flood anomalies, triggering rapid water-level responses.
Based on these general results, we propose the following recommendations for adaptive basin management:
  • Implement Partitioned Early Warning Systems: Due to the observed spatial heterogeneity, differentiated water-level early warning thresholds should be established separately for East, West, and South Dongting Lake, rather than relying on a single lake-wide indicator.
  • Enhance Joint Operation During Critical Periods: Management must prioritize the critical autumn water recession period and strengthen joint hydrological monitoring. Maintaining the ecological base flow of the three outlets should be explicitly integrated into the joint river–lake–reservoir operation framework to enhance the security of river-connected lakes against extreme hydrological events.

Author Contributions

Conceptualization, B.T. and J.S.; methodology, B.T. and J.S.; software, B.T.; validation, W.D., Z.L. and B.T.; formal analysis, B.T.; investigation, B.T., W.D. and Z.L.; resources, J.S.; data curation, B.T.; writing—original draft preparation, B.T.; writing—review and editing, J.S.; visualization, B.T.; supervision, J.S.; project administration, J.S. All authors have read and agreed to the published version of the manuscript.

Funding

This research received no external funding.

Data Availability Statement

Some of the data that support the findings of this article are openly available in the Bureau of Hydrology, Yangtze River Commission at http://www.cjh.com.cn/ (accessed on 23 April 2026) and in the Hunan Hydrology Platform at http://slt.hunan.gov.cn/ (accessed on 23 April 2026). The publications “Hydrological Yearbook of the Yangtze River Basin (Volume 6: Poyang Lake Area and Ganjiang River System)” and “Authentic records of typical drought and flood disasters compiled by the People’s Government of Hunan Province” cannot be made publicly available because they are non-public publications recorded by the government. However, the data will be made available by the authors upon reasonable request.

Conflicts of Interest

The author declares no conflicts of interest.

References

  1. Woolway, R.I.; Sharma, S.; Smol, J.P. Lakes in Hot Water: The Impacts of a Changing Climate on Aquatic Ecosystems. BioScience 2022, 72, 1050–1061. [Google Scholar] [CrossRef] [PubMed]
  2. Tan, Z.; Wang, X.; Li, Y.; Zhang, Z.; Xue, C.; Yao, J.; You, H. The impact of Three Gorges Dam on the hydrological connectivity of “off-stream” floodplains. J. Hydrol. 2024, 629, 130619. [Google Scholar] [CrossRef]
  3. Zhu, Y.; Wang, H.; Guo, W. The impacts of water level fluctuations of East Dongting Lake on habitat suitability of migratory birds. Ecol. Indic. 2021, 132, 108277. [Google Scholar] [CrossRef]
  4. Gronewold, A.D.; Rood, R.B. Recent water level changes across Earth’s largest lake system and implications for future variability. J. Great Lakes Res. 2019, 45, 1–3. [Google Scholar] [CrossRef]
  5. Zhang, Q.; Miao, C.; Guo, X.; Gou, J.; Su, T. Human activities impact the propagation from meteorological to hydrological drought in the Yellow River Basin, China. J. Hydrol. 2023, 623, 129752. [Google Scholar] [CrossRef]
  6. Vicente-Serrano, S.M.; Beguería, S.; López-Moreno, J.I. A Multiscalar Drought Index Sensitive to Global Warming: The Standardized Precipitation Evapotranspiration Index. J. Clim. 2010, 23, 1696–1718. [Google Scholar] [CrossRef]
  7. Jia, Y.; Shi, Y. Preliminary study on evolutions of Yangtze River and Dongting Lake water and sediment fluxes exchanges based on MLP method. Hydro-Sci. Eng. 2020, 24–32, (In Chinese with English abstract). [Google Scholar] [CrossRef]
  8. Wang, Y.; Yang, G.; Yuan, S.; Zhang, H.; Tang, H. Nonstationary response of hydrology and water quality in river-connected lakes: Comparative analysis of pre- and post- three Gorges Dam. J. Hydrol. 2025, 662, 133958. [Google Scholar] [CrossRef]
  9. Lai, X.; Zou, H.; Jiang, J.; Jia, J.; Liu, Y.; Wei, W. Hydrological dynamics of the Yangtze river-Dongting lake system after the construction of the three Gorges dam. Sci. Rep. 2025, 15, 50. [Google Scholar] [CrossRef] [PubMed]
  10. Mei, X.; Dai, Z.; Du, J.; Chen, J. Linkage between Three Gorges Dam impacts and the dramatic recessions in China’s largest freshwater lake, Poyang Lake. Sci. Rep. 2015, 5, 18197. [Google Scholar] [CrossRef]
  11. Zhu, L.; Chen, D.; Yang, C.; Chen, K.; Li, S. Sediment deposition of cascade reservoirs in the lower Jinsha River and scouring of river channel under dam. J. Lake Sci. 2023, 35, 1097–1110, (In Chinese with English abstract). [Google Scholar] [CrossRef]
  12. Huang, T.; Liu, Y.; Jia, Z.; Shi, J.; Wei, Y.; Sun, P. Hydrological drought characteristics and its propagation from meteorological drought in the Jing river basin under environmental change. J. Hydrol. Reg. Stud. 2026, 63, 103084. [Google Scholar] [CrossRef]
  13. Yin, H.; Liu, G.; Pi, J.; Chen, G.; Li, C. On the river–lake relationship of the middle Yangtze reaches. Geomorphology 2007, 85, 197–207. [Google Scholar] [CrossRef]
  14. Wu, P.; Zeng, L.; Zhu, X.; Zhang, Y.; Xiao, P.; Zhao, X.; Li, Q.; Jiang, C.; Chen, L.; Zhang, X. On the hydrological changes and their attribution analyses in the Dongting Lake Region in the past 60 years. J. Hydrol. Reg. Stud. 2025, 59, 102428. [Google Scholar] [CrossRef]
  15. Yuan, S.; Jiang, C.; Ma, Y.; Li, S. Evolution of the Hydrological Regime at the Outlet of West Dongting Lake Since 1955. Water 2025, 17, 2487. [Google Scholar] [CrossRef]
  16. Guo, W.X.; Jin, Y.G.; Zhao, R.C.; Wang, H.X. The impact of the ecohydrologic conditions of Three Gorges Reservoir on the spawning activity of four major Chinese carps in the middle of Yangtze River, China. Appl. Ecol. Environ. Res. 2021, 19, 4313–4330. [Google Scholar] [CrossRef]
  17. Lyu, Z.Z.; Gao, H.; Gao, R.; Ding, T. Extreme characteristics and causes of the drought event in the whole Yangtze River Basin in the midsummer of 2022. Adv. Clim. Change Res. 2023, 14, 642–650. [Google Scholar] [CrossRef]
  18. Su, H.L.; Chen, X.X.; Zhang, J.H.; Wang, Z.W.; Guo, Y.X.; Ouyang, S. Quantitative analysis of water exchange between Yangtze River and Dongting Lake. Water Sci. Eng. 2026, 19, 56–66. [Google Scholar] [CrossRef]
  19. Lv, H.; Wang, Y.; Yan, D.; Peng, S.; Zheng, X. Quantifying the impacts of climate change and human activities on hydrological regime in Jinsha River, China. J. Hydrol. 2025, 662, 134008. [Google Scholar] [CrossRef]
  20. Yang, P.; Zhang, S.; Xia, J.; Zhan, C.; Cai, W.; Wang, W.; Luo, X.; Chen, N.; Li, J. Analysis of drought and flood alternation and its driving factors in the Yangtze River Basin under climate change. Atmos. Res. 2022, 270, 106087. [Google Scholar] [CrossRef]
  21. Wang, H.; Zhang, D.; Peng, Y. Analysis of the characteristics and propagation patterns of drought in Dongting Lake basin. Theor. Appl. Climatol. 2026, 157, 82. [Google Scholar] [CrossRef]
  22. Zhou, W.; Sun, Z.; Yang, Z.; Guo, G. Confluence Effects of Dongting Lake in the Middle Yangtze River: Discontinuous Fluvial Processes and Their Driving Mechanisms. Water Resour. Res. 2025, 61, e2024WR039030. [Google Scholar] [CrossRef]
  23. Xu, Q.; Li, S.; Yuan, J.; Yang, C. Analysis of equilibrium sediment transport in the middle and lower reaches of the Yangtze River after the impoundment of the Three Gorges Reservoir. J. Lake Sci. 2021, 33, 806–818, (In Chinese with English abstract). [Google Scholar] [CrossRef]
  24. Ministry of Water Resources of the People’s Republic of China. Bulletin of River Sediment in China; China Water & Power Press: Beijing, China, 2017. (In Chinese)
  25. Xiong, A. Analysis on background of climatic variation for extremely rainy over the middle reaches of the Changjiang River in the 1990s. J. Appl. Meteorol. Sci. 2001, 12, 113–117, (In Chinese with English abstract). [Google Scholar]
  26. Shi, J.; Xi, L.; Wang, J.; Ren, B.; Fu, H.; Yuan, G.; Wu, A.; Niu, Y.; Xie, Y.; Xu, X.; et al. Plant height mediates hydrological impacts on soil nutrients in seasonal floodplain wetlands. Ecol. Indic. 2025, 178, 113918. [Google Scholar] [CrossRef]
  27. Wang, H.; Zhu, Y.; Zha, H.; Guo, W. Quantitative assessment of water level regime alterations during 1959–2016 caused by Three Gorges Reservoir in the Dongting Lake, China. Water Supply 2021, 21, 1188–1201. [Google Scholar] [CrossRef]
  28. Ali, R.; Kuriqi, A.; Abubaker, S.; Kisi, O. Long-Term Trends and Seasonality Detection of the Observed Flow in Yangtze River Using Mann-Kendall and Sen’s Innovative Trend Method. Water 2019, 11, 1855. [Google Scholar] [CrossRef]
  29. Xia, Z.H.; Chen, X.X. Evolution Characteristics of Compound Extreme Climate Events in the Yangtze River Basin from 1961 to 2022. J. Yangtze River Sci. Res. Inst. 2025, 42, 1–8, (In Chinese with English abstract). [Google Scholar] [CrossRef]
  30. Liu, Y.; Li, J.; Yan, D.; Chen, L.; Li, M.; Luan, Z. Typical vegetation dynamics and hydrological changes of Dongting Lake wetland from 1985 to 2020. Ecohydrol. Hydrobiol. 2024, 24, 910–919. [Google Scholar] [CrossRef]
  31. Xue, C.; Zhang, Q.; Jia, Y.; Tang, H.; Zhang, H. Attribution of hydrological droughts in large river-connected lakes: Insights from an explainable machine learning model. Sci. Total Environ. 2024, 952, 175999. [Google Scholar] [CrossRef] [PubMed]
  32. Cleveland, R.B.; Cleveland, W.S.; McRae, J.E.; Terpenning, I. STL: A seasonal-trend decomposition procedure based on loess. J. Off. Stat. 1990, 6, 3–73. [Google Scholar]
  33. Brkić, Ž.; Kuhta, M. Lake Level Evolution of the Largest Freshwater Lake on the Mediterranean Islands through Drought Analysis and Machine Learning. Sustainability 2022, 14, 10447. [Google Scholar] [CrossRef]
  34. He, S.; Zhang, E.; Huo, J.; Yang, M. Characteristics of Propagation of Meteorological to Hydrological Drought for Lake Baiyangdian in a Changing Environment. Atmosphere 2022, 13, 1531. [Google Scholar] [CrossRef]
  35. GB/T 20481-2017; Grades of Meteorological Drought. Standards Press of China: Beijing, China, 2017. (In Chinese)
  36. Mishra, A.K.; Singh, V.P. A review of drought concepts. J. Hydrol. 2010, 391, 202–216. [Google Scholar] [CrossRef]
  37. Yevjevich, V.M. An Objective Approach to Definitions and Investigations of Continental Hydrologic Droughts; Hydrology Papers; Colorado State University: Fort Collins, CO, USA, 1967. [Google Scholar]
  38. Liang, Y.; Han, P.; Kim, T.W.; Zhang, X.; Li, Z.; Liu, H.; Chen, S. Development of drought-flood abrupt alternations identification method based on daily soil moisture index: Spatiotemporal characterization and risk assessment in the middle and lower reaches of Yangtze River Basin. J. Hydrol. Reg. Stud. 2025, 61, 102690. [Google Scholar] [CrossRef]
  39. Missimer, T.M.; Tsegaye, S.; Thomas, S.; Danley-Thomson, A.; Michael, P.R. Evaluation of Seasonal Reservoir Water Treatment Processes in Southwest Florida: Protection of the Caloosahatchee River Estuary. Water 2024, 16, 2145. [Google Scholar] [CrossRef]
  40. Yao, F.; Livneh, B.; Rajagopalan, B.; Wang, J.; Crétaux, J.F.; Wada, Y.; Berge-Nguyen, M. Satellites reveal widespread decline in global lake water storage. Science 2023, 380, 743–749. [Google Scholar] [CrossRef]
  41. Li, B.; Yang, G.; Wan, R. Reassessment of the declines in the largest freshwater lake in China (Poyang Lake): Uneven trends, risks and underlying causes. J. Environ. Manag. 2023, 342, 118157. [Google Scholar] [CrossRef] [PubMed]
  42. Chen, H.; Jin, G.; Tang, H.; Wu, J.; Wang, Y.G.; Zhang, Z.; Deng, Y.; Zhang, S. Spatiotemporal variations of water levels and river-lake interaction in the Poyang Lake basin under the extreme drought. J. Hydrol. Reg. Stud. 2025, 57, 102165. [Google Scholar] [CrossRef]
  43. Xue, C.; Zhang, Q.; Jia, Y.; Yuan, S. Intensifying drought of Poyang Lake and potential recovery approaches in the dammed middle Yangtze River catchment. J. Hydrol. Reg. Stud. 2023, 50, 101548. [Google Scholar] [CrossRef]
  44. Jia, Y.; Zhang, Q.; Xue, C.; Wu, B.; Zhang, H.; Wang, J. Decline of Poyang floodplain lakes under extreme dry conditions and interpretation of influencing factors. J. Environ. Manag. 2025, 395, 127867. [Google Scholar] [CrossRef] [PubMed]
  45. Liu, S.; Long, A.; Luo, G.; Wang, H.; Yan, D.; Deng, X. What drives the distinct evolution of the Aral Sea and Lake Balkhash? Insights from a novel CD-RF-FA method. J. Hydrol. Reg. Stud. 2024, 56, 102014. [Google Scholar] [CrossRef]
  46. Touge, Y.; Kobayashi, G.; Khujanazarov, T.; Tanaka, K. Reproduction of historical water balance in the Aral Sea Basin: The physically-based framework to quantify water consumption components in endorheic lake. J. Hydrol. 2024, 640, 131711. [Google Scholar] [CrossRef]
  47. Shang, H.X.; Xia, J.Q.; Hu, C.H.; Zhou, M.R.; Deng, S.S. Quantification of backwater effect in Jingjiang Reach due to confluence with Dongting Lake using a machine learning model. Water Sci. Eng. 2025, 18, 187–199. [Google Scholar] [CrossRef]
  48. Zhang, X.; Bai, L.; Xu, Z.; Jiang, C.; Chen, H.; Ye, C.; Ma, X.; Huang, Y. Impacts of large reservoirs on downstream lake hydrological regimes in complex river-lake systems: A case study of the Three Gorges Reservoir and Dongting Lake. J. Hydrol. 2025, 661, 133694. [Google Scholar] [CrossRef]
  49. Long, Y.; Cao, J.; Xiong, W.; He, H.; Ren, P. Spatiotemporal pattern of water age in Dongting Lake before and after the operation of the Three Gorges Project. J. Hydrol. Reg. Stud. 2024, 55, 101902. [Google Scholar] [CrossRef]
  50. Sun, Z.; Li, Z.; Chen, L.; Fan, J.; Liu, Y. Assessment of hydraulic performance changes of Dongting Lake after the Three Gorges Reservoir impoundment by a novel semi-empirical approach. J. Geogr. Sci. 2024, 34, 1537–1557. [Google Scholar] [CrossRef]
  51. Luo, W.; Han, Y.; Yan, L.; Xia, J.; Tang, G. Hydromorphological adjustment and river-lake disconnection in the Jingjiang Reach under long-term regulation of three Gorges Reservoir. Geomorphology 2026, 495, 110113. [Google Scholar] [CrossRef]
  52. Gao, X.; Xie, Y.; Geng, M.; Zou, Y.; Li, F.; Deng, Z. Dominant hydrological drivers of vegetation pattern changes in a river-connected lake after dam construction: Outlet or inlet? Ecol. Indic. 2025, 180, 114307. [Google Scholar] [CrossRef]
  53. Lin, J.; Ding, W.; Zhou, H.; Wang, H. Mitigating adverse impacts of reservoir impoundment on lake ecology: A case study of the Three Gorges Reservoir and Dongting Lake. J. Clean. Prod. 2024, 451, 141835. [Google Scholar] [CrossRef]
  54. Tian, M.; Mao, J.; Wang, K.; Chen, Y.; Gao, H.; Wang, T. Significant expansion of small water bodies in the Dongting Lake region following the impoundment of the Three Gorges Dam. J. Environ. Manag. 2025, 376, 124443. [Google Scholar] [CrossRef]
  55. Chen, X.; Guo, Y.; Zhang, J.; Han, X.; Huang, W.; Yue, Y. Ecological risks in downstream lakes exacerbated by the three Gorges reservoir. Ecol. Indic. 2025, 170, 113041. [Google Scholar] [CrossRef]
  56. Li, Z.; Sun, Z.; Chen, L.; An, S. A large-scale hydrological and hydrodynamic coupled model for flow routing in the Yangtze-Dongting system. J. Hydrol. 2024, 641, 131768. [Google Scholar] [CrossRef]
  57. Yang, Y.; Zhang, M.; Zhu, L.; Liu, W.; Han, J.; Yang, Y. Influence of Large Reservoir Operation on Water-Levels and Flows in Reaches below Dam: Case Study of the Three Gorges Reservoir. Sci. Rep. 2017, 7, 15640. [Google Scholar] [CrossRef] [PubMed]
Figure 1. Locations of representative water-level, precipitation, and runoff stations in the Dongting Lake area.
Water 18 01039 g001
Figure 2. Research workflow of the study.
Water 18 01039 g002
Figure 3. Interannual variations of water levels in Dongting Lake from 1992 to 2023.
Water 18 01039 g003
Figure 4. STL decomposition of water level of Dongting Lake (Chenglingji station) from 1992 to 2023.
Water 18 01039 g004
Figure 5. Variation trends of precipitation and runoff in Dongting Lake from 1992 to 2023.
Water 18 01039 g005
Figure 6. SHAP interpretation results of the water-level attribution model during the critical period (2009–2023).
Water 18 01039 g006
Figure 7. Evolution characteristics of water level–discharge relationship in Dongting Lake.
Water 18 01039 g007
Figure 8. Comparison of inflow discharge and water level response in typical drought–flood abrupt alternation years.
Water 18 01039 g008
Table 1. Representative water-level, precipitation, and runoff stations used in this study.
StationCoordinatesRepresentative RegionTime Period
Water Level & Runoff Station
Chenglingji113°08′ E, 29°25′ NOverall lake & outlet1992–2023 (Level)
2009–2023 (Runoff)
Water Level Stations
Zhouwenmiao112°18′ E, 29°05′ NSouth Dongting Lake1992–2023
Yingtian112°38′ E, 28°35′ NEast Dongting Lake1992–2023
Changde111°40′ E, 29°00′ NWest Dongting Lake1992–2023
Runoff Stations
Nanzui112°20′ E, 29°03′ NThe three outlets2009–2023
Caowei112°10′ E, 29°15′ NThe three outlets2009–2023
Xinjiangkou111°35′ E, 30°25′ NThe three outlets2009–2023
Shimen111°29′ E, 29°36′ NThe four rivers2009–2023
Shatou112°20′ E, 28°30′ NThe four rivers2009–2023
Xiaohezui112°28′ E, 28°55′ NThe four rivers2009–2023
Wushi113°10′ E, 28°50′ NThe four rivers2009–2023
Precipitation Stations
Xiangyin112°54′ E, 28°39′ NEast Dongting Lake2009–2023
Songzi111°48′ E, 30°15′ NSouth Dongting Lake2009–2023
Yuanjiang112°24′ E, 28°46′ NWest Dongting Lake2009–2023
Table 2. Classification of drought and flood grades.
GradeFlood ( I > 0 )Drought ( I < 0 )
Mild 0.5 I < 1.0 1.0 < I 0.5
Moderate 1.0 I < 1.5 1.5 < I 1.0
Severe 1.5 I < 2.0 2.0 < I 1.5
Extreme I 2.0 I 2.0
Table 3. Comparison of abnormal water-level identification results between SWI and ISWI.
MethodNo. of EventsAvg. Duration (d)Dry Season Abnormal (%)Wet Season Abnormal (%)Correlation with SPI-3Consistency with SPI-3 (%)
SWI5767.472.762.20.29441.0
ISWI10120.525.042.20.61068.3
Notes: The dry season is from October to March of the following year, and the wet season is from April to September. The correlation coefficient and consistency rate are calculated based on the monthly aggregated results.
Table 4. Drought and flood classification for key years in Dongting Lakefrom 1992 to 2023.
Year ISWI max ISWI min I y (Dominant)Classification
19930.945−0.4120.945Mild Flood
19940.411−0.923−0.923Mild Drought
19961.853−1.1021.853Severe Flood
19970.350−0.980−0.980Mild Drought
19983.854−0.8213.854Extreme Flood
19991.627−0.9541.627Severe Flood
20021.458−0.7321.458Moderate Flood
20060.354−1.952−1.952Severe Drought
20070.950−0.8100.950Mild Flood
20081.785−0.6201.785Severe Flood
20090.651−1.256−1.256Moderate Drought
20100.980−0.5100.980Mild Flood
20110.459−1.883−1.883Severe Drought
20130.753−1.157−1.157Moderate Drought
20150.650−0.950−0.950Mild Drought
20161.924−1.2151.924Severe Flood
20171.958−0.5421.958Severe Flood
20191.356−1.1051.356Moderate Flood
20202.856−1.4232.856Extreme Flood
20220.856−3.204−3.204Extreme Drought
Table 5. Consistency analysis results of typical historical flood and drought events.
EventOfficial RecordISWI IdentifiedConsistency (%)Hit Rate (%)Missed Alarm (%)Kappa
2020 Flood2020-07-04–2020-09-022020-07-04–2020-09-1293.5100.00.00.867
2022 Drought2022-08-05–2023-06-062022-07-29–2023-06-0196.798.41.60.877
Notes: The consistency rate, hit rate, missed alarm rate, and Kappa coefficient are calculated based on daily-scale binary classification results. The official records are provided by the Hunan Provincial Government.
Table 6. Annual volumes and proportions of inflow sources of Dongting Lake.
YearThree OutletsFour RiversPrecipitation
Prop. (%)Vol. (km3/a)Prop. (%)Vol. (km3/a)Prop. (%)Vol. (km3/a)
200941.4083.07657.17114.7291.442.886
201040.79101.13857.60142.8201.613.990
201143.0566.39555.5785.7121.382.129
201241.52109.38857.09150.4191.393.666
201341.1985.18757.41118.7271.402.904
201439.88104.75858.83154.5401.293.375
201540.1091.85658.25133.4231.653.789
201639.57108.62059.11162.2611.333.642
201741.53107.89957.02148.1281.453.773
201842.9496.14855.59124.4861.473.290
201935.0390.85763.92165.7681.042.710
202033.97141.27264.98270.2371.064.390
202135.78108.28063.11190.9841.103.339
202236.1873.38462.36126.4741.452.950
202341.7662.83356.5385.0631.712.571
Table 7. SHAP-based attribution results for critical-period water-level variations in Dongting Lake.
Driving FactorVariable CodeMean |SHAP|Relative Contribution (%)Main DirectionInterpretation
Three Outlets Runoff X 1 ( External ) 1.49979.5Overall positiveMost important variable
Four Rivers Runoff X 2 ( Internal ) 0.25913.7Overall positiveSecondary variable
Lake Precipitation X 3 ( Precip ) 0.1286.8Weak positiveLowest explanatory power
Notes: The model is built based on monthly anomaly samples from September to November (2009–2023), with a total of 45 samples. It is evaluated using a year-based grouped cross-validation method (CV R 2 = 0.732 , RMSE = 1.180 m, MAE = 0.828 m). The relative contribution rate is calculated by normalizing the mean absolute SHAP values. The SHAP results reflect the relative explanatory strength within the model.
Disclaimer/Publisher’s Note: The statements, opinions and data contained in all publications are solely those of the individual author(s) and contributor(s) and not of MDPI and/or the editor(s). MDPI and/or the editor(s) disclaim responsibility for any injury to people or property resulting from any ideas, methods, instructions or products referred to in the content.