Article

AI-Assisted Operating Window Screening for Microwave Thin-Layer Drying of Dewatered Municipal Sewage Sludge: Drying Kinetics, Hygienisation, and an Energy-Use Proxy

by
Mhamed Belkacem-Filali
1,
Farid Dahmoune
2,
Mohamed Hentabli
3 and
Katarzyna Kubiak-Wójcicka
4,*
1
Laboratory of Preservation and Protection of Water Resources, Department of Water Sciences and Environment, University of Blida 1, Blida 09000, Algeria
2
Department of Biological Sciences, Faculty of Nature, Life Science and Earth Science Bouira University, Bouira 10000, Algeria
3
Process Engineering Department, Faculty of Technology, Hassiba Ben Bouali University of Chlef, Chlef 02000, Algeria
4
Department of Hydrology, Cryology and Water Management, Faculty of Earth Sciences and Spatial Management, Nicolaus Copernicus University, 87-100 Toruń, Poland
*
Author to whom correspondence should be addressed.
Water 2026, 18(7), 808; https://doi.org/10.3390/w18070808
Submission received: 2 March 2026 / Revised: 16 March 2026 / Accepted: 23 March 2026 / Published: 28 March 2026

Abstract

Municipal sewage sludge is an environmental liability but also an energy-rich biomass that can support circular economy resource recovery. Here, we benchmark thin-layer drying of dewatered municipal sewage sludge (sludge cake) (40 g; layer thickness ≤ 5 mm) under open-air, convective hot air (40–150 °C), and microwave (70–1200 W) conditions to quantify drying kinetics, hygienisation indicators, and a screening-level energy-use proxy. High-power microwave drying reduced the time to constant mass from 32 h (open air) and 25 h 05 min (40 °C convection) to 20 min (900 W) and 14 min 05 s (1200 W). Faecal indicators (total/thermotolerant coliforms and presumptive Escherichia coli) were below detection after ≥100 °C convection or ≥300 W microwave treatment, while mesophilic aerobes and sulfite-reducing Clostridium spp. decreased by ~3–4 log10 with increasing exposure. A dragonfly-optimised ε-support vector regression model (DA–SVR) predicted drying trajectories across modes (overall RMSE ≈ 0.79 percentage points; held-out RMSE ≈ 1.47; R2 ≥ 0.99). Overall, microwave thin-layer drying coupled with DA–SVR decision support enables constraint-based screening of sewage–sludge conditioning windows for logistics and thermal valorisation pathways; the framework can be extended to incorporate additional analytical endpoints where available.

1. Introduction

Municipal wastewater treatment plants (WWTPs) are increasingly expected to operate as resource recovery hubs rather than end-of-pipe utilities [1,2,3]. Among their major residual streams, municipal sewage sludge is both an environmental and public health liability—because of high water content, odor, and pathogen/contaminant burdens—and a potentially valuable biomass rich in organics and nutrients [4,5]. Circular economy strategies, therefore, promote treatment trains that minimise environmental impacts while recovering energy, nutrients, and water from wastewater and sludge [5,6,7,8,9]. Within this framework, recovering energy from sludge as biogas, syngas, bio-oil, or heat is widely discussed; for example, via anaerobic digestion of wet sludge [9] or via thermochemical conversion of dewatered/dried solids [7], contributing to broader carbon management goals [2,5,6,10,11,12].
Regulatory tightening and societal expectations are accelerating the shift from disposal-led sludge management toward safer, higher-value resource recovery [13]. Restrictions on landfilling and increasing scrutiny of emissions and contaminants are progressively constraining long-term reliance on landfill disposal of sewage sludge and sludge-derived solids [14,15,16]. Consequently, utilities are exploring stabilisation and conditioning approaches that enable beneficial use and energy-oriented valorisation while meeting hygienic standards [6,17,18]. Integrating sludge conditioning with energy recovery can improve overall plant energy balances and reduce net greenhouse gas footprints [7,8,9,10,11]. In parallel, growing attention to emerging pollutants in sewage sludge and sludge-derived products reinforces the need for conditioning strategies that can be paired with robust analytical monitoring and risk-based decision making.
Importantly, anaerobic digestion and drying typically occupy different positions in sludge treatment lines. Anaerobic digestion is generally applied to wet sludge; evaporating water prior to digestion is usually energetically unfavourable and may reduce biodegradable volatile solids. For WWTPs equipped with digesters, drying is, therefore, most commonly considered downstream of digestion (and dewatering) to improve storage/transport, support hygienisation where required, and, in particular, to enable thermal valorisation routes (e.g., combustion/co-combustion, pyrolysis, or gasification) [6,9,17]. Accordingly, the present study frames thin-layer drying primarily as an enabling step for logistics and thermochemical energy recovery rather than as a pretreatment to enhance anaerobic digestion.
Across these strategies, drying remains a key enabling step because high moisture content increases transport burdens, reduces storage stability, and limits downstream conversion efficiency [6,17]. Conventional convective drying, however, is often slow and energy intensive, and its performance is strongly affected by sludge rheology and prior dewatering [6,8,17,19]. Microwave (MW) drying has, therefore, attracted growing interest as a compact intensified option because volumetric dielectric heating can accelerate internal temperature rise and moisture migration, particularly in thin-layer configurations [8,20]. Published MW studies, including pilot-scale systems, commonly report substantial reductions in drying time and meaningful hygienisation, but the reported energy-use metrics and optimal operating windows remain highly dependent on sludge properties, layer thickness/load, vapour handling, and scale [8,20,21]. In parallel, AI-assisted drying models are increasingly used when process responses are nonlinear and interaction-rich, yet unified screening tools that connect operating conditions with drying kinetics, sanitary outcomes, and energy demand across different drying modes remain limited [20,21].
Accordingly, this study contributes not merely another single-mode drying dataset but a constraint-based operating window framework. We benchmark thin-layer drying of dewatered municipal sewage sludge under open-air, convective hot air (40–150 °C), and microwave (70–1200 W) conditions to constant mass, quantify drying kinetics, hygienisation indicators, and a screening-level specific energy consumption (SEC) proxy, and enumerate microbiological indicators according to ISO/AFNOR methods. We then develop a dragonfly-optimised ε-support vector regression surrogate (DA–SVR) to predict time-dependent drying trajectories and rapidly screen conditions that jointly satisfy dryness, hygienisation, and energy constraints within the investigated domain. This integrated approach is intended to support early-stage decision making for sludge conditioning in WWTP resource recovery schemes.

2. Materials and Methods

2.1. Sludge Source, Sampling, and Experimental Drying Protocols

The Bouira municipal wastewater treatment plant (Algeria) operates with pretreatment (coarse and fine screening), activated sludge biological treatment, secondary clarification, tertiary treatment, and sludge thickening/dewatering. The material analysed in this study was dewatered municipal sewage sludge (sludge cake), collected in April 2023 from the cake discharge of the belt filter press on the sludge dewatering line, i.e., after thickening and mechanical dewatering; no prior digestion or stabilisation step was documented for the sampled line. To avoid ambiguity, this material is referred to throughout the manuscript as dewatered municipal sewage sludge. Immediately after collection, the material was transferred to clean, tightly sealed containers, protected from heat and light, and transported to the laboratory under refrigerated conditions. Upon receipt, the samples were stored at 4 °C until further analysis, in accordance with ISO 5667-13 [22] guidelines for sludge sampling and preservation. In this campaign, the directly measured batch descriptors used for interpretation were the wet mass and the oven-dry reference mass determined as described below; volatile solids, TOC/organic matter, and particle size distribution or morphology were not measured for this batch and are, therefore, treated as study limitations rather than inferred from external sources.
Prior to subsampling for each drying run, the bulk sludge was homogenised by vigorous manual mixing with a stainless-steel spatula for approximately 2–3 min (including scraping the container walls and bottom) until no obvious phase separation was observed. Replicate 40 g portions were taken immediately after mixing from different locations within the container to minimise solids settling and to improve reproducibility across runs.
For each run, 40 g (wet mass) of homogenised sludge was spread in borosilicate glass dishes to a target layer thickness of ≤5 mm (thin-layer configuration). This thickness was selected deliberately to maintain a thin-layer regime suitable for comparative kinetic screening because it limits strong internal heat- and mass-transfer gradients while remaining within the low-millimetre range commonly reported for thin-layer sludge drying (typically about 2–10 mm) [23]. Dish diameter and spread area were recorded to verify the achieved thickness. Three drying approaches were evaluated, each in triplicate.
Microwave drying (MW). Experiments were conducted in a domestic microwave oven (STARLIGHT, P70B17L-S2 (Essalem Electronics, Algiers, Algeria); 17 L; 220–240 V, 50 Hz; 2450 MHz; cavity 262 × 452 × 335 mm). Sludge portions were dried in borosilicate glass dishes at six nominal power settings (70, 150, 300, 600, 900, and 1200 W), each run in triplicate until constant mass. Because this domestic unit modulates output by duty cycle control, the reported settings represent nominal power–time exposure descriptors rather than continuously metered industrial power delivery.
Limitations specific to domestic microwave operation should, therefore, be noted. Domestic cavities can exhibit spatially non-uniform electromagnetic fields, leading to hot spots and uneven heating within the thin layer. Outcomes may also depend on load size, container geometry, and vapour/condensate handling inside the cavity, which differ from engineered microwave dryers equipped with controlled airflow/exhaust and calibrated power delivery. Consequently, the reported power–time settings should be interpreted as pragmatic exposure descriptors rather than direct temperature histories; scale-up will require metered energy input, controlled vapour removal, and validated temperature mapping.
Convective hot air drying (CD). A Memmert UN110 universal drying oven (Memmert GmbH & Co. KG, Schwabach, Germany; natural convection) was used at 40, 60, 80, 100, 120, and 150 °C, again with triplicate runs to constant mass.
Open-air reference (OA). Open-air drying was used as an ambient still-air reference under the same thin-layer configuration. Immediately after preparation (40 g; ≤5 mm), each dish was placed on a clean perforated rack in a draft-shielded laboratory area. Dishes were loosely covered to limit dust ingress while maintaining airflow.
Constant-mass criterion and mass metrics. For each drying run (OA, CD, MW), sample mass was recorded by discontinuous weighing (the dish was removed briefly from the dryer, weighed, and returned) at condition-specific fixed time steps: MW—every 30 s (600–1200 W), every 60 s (300 W), every 5 min (150 W), and every 10 min (70 W); CD—every 30 min at 40 °C, every 20 min at 60–80 °C, every 10 min at 100–120 °C, and every ~2–3 min at 150 °C; and OA—every 4 h. Measurements continued until the change between two successive measurements was <0.5% or 1 mg (whichever was greater). Open-air runs were conducted under laboratory ambient conditions, without active control of temperature or relative humidity; this is treated as a study limitation. Sample temperature during microwave exposure was not recorded continuously, so MW conditions are reported by nominal power and exposure time. To determine the oven-dry reference mass (mdry), a representative aliquot was dried at 105 ± 2 °C, cooled to room temperature in a desiccator (≥30 min), and reweighed to constant weight. For the sludge analysed here, this directly measured constant weight procedure yielded mdry ≈ 17.8 g for mi = 40.0 g (mdry/mi ≈ 44.5%), corresponding to removal of approximately 22.2 g of water to constant weight; all normalised-mass plateaus and derived water removal/energy calculations in the manuscript are based on this value. The final wet basis mass loss at constant weight, MLfinal (%), was calculated as:
M L f i n a l = m i m d r y m i × 100
where mi is the initial wet mass and mdry is the oven-dry mass at constant weight. For time-dependent drying trajectories, we report the normalised mass remaining Mrel(t) = m(t)/mi × 100; the corresponding time-dependent mass loss is ML(t) = 100 − Mrel(t). This definition is consistent with thin-layer sludge-drying practice [24]. For the sludge analysed here, the oven-dry fraction was mdry/mi ≈ 44.5% (Table 1); therefore, Mrel(t) is expected to asymptotically approach approximately 44–45% at complete drying (wet basis), and the corresponding ML(t) approaches approximately 55–56%.
Energy indicators. The microwave drying configuration and analysis follow the sludge-specific literature on drying kinetics, energy use, and stage behaviour [8,21]. For screening purposes, the electrical energy proxy was defined as E_proxy = P_nameplate × t, and the specific energy proxy as SEC_proxy = E_proxy/m_evap, where m_evap = m_i − m_dry is the mass of water removed to constant weight. In the domestic, low-load configuration used here, nameplate power × time represents an upper-bound estimate of electrical energy use rather than the true absorbed microwave energy. Accordingly, the reported SEC values are intentionally conservative and are used only for comparative schedule screening, not as claims of process-level energy efficiency. Appropriate microbiological safety measures were observed when handling wet sludge and operating heated equipment.

2.2. Microbiological Assays

To quantify sanitation outcomes of the drying pretreatments, indicator organisms were enumerated in wet sludge and dried products (oven schedules 40–150 °C; microwave schedules 70–1200 W). For each analysis, a 10 g test portion was aseptically transferred to a sterile stomacher bag with 90 mL diluent, homogenised for 1–2 min, and the filtrate (initial suspension) was used to prepare serial tenfold dilutions. Preparations were kept at ≤6 °C during handling and processed immediately. Sample preparation and dilutions followed ISO 6887-1:2017/Amd 1:2024; general laboratory requirements, biosafety, and reporting followed ISO 7218:2024; and culture media preparation and performance testing complied with ISO 11133:2014 with amendments [25,26].
Total mesophilic aerobic counts at 30 °C were obtained using either the pour-plate method (ISO 4833-1:2013/Amd 1:2022) or, where specified, the surface (spread) method (ISO 4833-2:2013) [27,28]. Presumptive total coliforms were enumerated by the most probable number (MPN) technique in brilliant green bile lactose broth with appropriate confirmations, following ISO 4831:2006 for solid matrices [29]. Presumptive Escherichia coli were enumerated by the MPN method as per ISO 7251:2005/Amd 1:2023 [30]. When analyses were performed on aqueous extracts or water fractions, E. coli and coliforms followed the MPN method in ISO 9308-2:2012 [31].
Sulfite-reducing Clostridium spp. were enumerated on tryptose (tryptone)–sulfite–cycloserine (TSC) agar under anaerobiosis at 46 °C, following NF V 08-061:2009; the approach aligns with ISO 15213-1:2023 [32] for the enumeration of sulfite-reducing Clostridium spp. by the colony count technique [33]. Detection of Salmonella spp. followed ISO 6579-1:2017/Amd 1:2020: non-selective pre-enrichment in buffered peptone water; selective enrichment in Rappaport–Vassiliadis (RVS) and Müller–Kauffmann tetrathionate novobiocin (MKTTn) broth; isolation on XLD and bismuth sulfite agar; and biochemical confirmation (e.g., TSI) [34].
Unless stated otherwise, all microbiological assays were performed in triplicate under aseptic conditions. Plate counts are expressed as CFU·g−1 and MPN estimates as MPN·g−1. “Not detected (ND)” denotes values below the method-specific detection limit determined from the test portion, plating/MPN scheme, and replicate numbers, consistent with ISO 7218:2024 [35].

2.3. Mathematical Modelling with DA–SVR

To predict sludge drying behaviour, a support vector regression (SVR) model was developed and optimised using the dragonfly algorithm (DA). This data-driven approach complements classical regression and response surface methods commonly used for optimising sludge conditioning and dewatering at full scale [18] while providing improved handling of nonlinear interactions between drying mode, intensity, and time. The methodology is detailed below.

2.3.1. Support Vector Machine (SVM)

Following Vapnik’s statistical learning framework [36], a support vector machine was configured for regression (SVR) to estimate the normalised mass remaining Mrel(t) (%, m(t)/mi × 100) from the predictors—drying mode, temperature, applied power, and time. Nonlinearity was handled through a Gaussian (radial basis function, RBF) kernel, which implicitly maps the inputs into a high-dimensional feature space where a linear model can represent complex relations.
f ( x ) = w · φ ( x ) + b
where w is the weight vector, b is the intercept, and φ is the nonlinear feature map induced by the kernel. Estimation proceeds by solving a convex optimisation problem employing the ε-insensitivity loss introduced by Vapnik; the formal specification is given in Equations (3) and (4) [37]:
m i n i m i z e : 1 2 w 2 + C K = 1 N ξ k + ξ k *
subject to, for k = 1, …, N
y k w . x k + b ε + ξ k w . x k + b ε + ξ k * ξ k ,   ξ k * 0
Here, C > 0 is the regularisation (capacity) constant that balances model complexity against empirical error; larger values penalise violations more strongly. The parameter ε ≥ 0 defines the width of the ε-insensitive tube. The non-negative slack variables ξk and ξ*k quantify deviations below and above the tube, respectively; when predictions fall outside the tube, these deviations are penalised in the objective function.
Solving the optimisation via the Lagrangian multiplier framework and enforcing the Karush–Kuhn–Tucker (KKT) conditions (Platt, 1998) [38] yields the dual representation of the regressor Equation (5):
f x , α i , α i * = i = 1 N α i α i * · K x , x i + b
where αi and αi* are paired Lagrange multipliers and K is a positive definite kernel. A commonly used choice is the Gaussian radial basis kernel:
K x , x i = e x p x x i 2 σ 2
as discussed by Bafithile and Li [37].

2.3.2. Dragonfly Algorithm Optimisation

The dragonfly algorithm (DA) is a swarm intelligence-based metaheuristic introduced by Mirjalili [39]. In this study, we implemented a hybrid modelling framework in which SVR is coupled with DA for hyperparameter optimisation. The overall workflow of the DA–SVR approach follows the schematic shown in Figure 1 [40,41,42,43].
Although the underlying formulation of the SVR remains the same as in Liu et al. [44], the dragonfly algorithm is used here purely as a hyperparameter optimiser. For each DA candidate, a set of hyperparameters (C, ε, and kernel width σ) is sampled within predefined bounds and passed to the ε-SVR. The data are then partitioned using 5-fold grouped cross-validation, and the RMSE averaged across the five folds is used as the fitness value. The DA then updates the swarm and proposes new hyperparameter combinations for subsequent evaluation. After 100 optimisation trials, the hyperparameter set yielding the lowest cross-validated RMSE is retained as the optimal DA–SVR model.
Prior to model training, numeric values in the input data matrix are range-normalised (min–max scaling) to improve optimisation stability and convergence. Scaling parameters are computed from the training data and applied unchanged to the validation/test folds to avoid information leakage. The normalisation function is given by Equation (7):
X i norm = X i X m i n X m a x X m i n
where Xmin and Xmax denote the minimum and maximum values of the variable computed from the training set.
The probability density function (PDF) constitutes a fundamental element in the statistical characterisation of random variables. Specifically, a density function defines a random variable wherein event probabilities within measurable sets are obtained by integration over these sets. Kernel density estimation (KDE) utilises the underlying PDF for non-parametric density approximation. The KDE formulation for any real argument x is given by Equation (8):
f ^ h ( x ) = 1 n h i = 1 n K x x i h
In this context, n is the sample size, h is the bandwidth that controls the smoothness of the estimate, and K is the kernel function. Let (x1, x2, …, xn) be independent and identically distributed observations drawn from a distribution with no assumed parametric form.
The predictive performance of the DA–SVR model was assessed using the coefficient of determination R2, Equation (9), and the root mean square error, RMSE, Equation (10) [45,46], defined as follows:
R 2 = 1 S S r e s S S t o t = 1 i = 1 n q e i e x p q e i c a l 2 i = 1 n q e i e x p q e m o y 2
And
R M S E = i = 1 n q e i exp q e i cal 2 n
q e i exp q e i cal , where qe,i denotes the i-th observed experimental value, q_p,i denotes the corresponding model-predicted value, and q e ¯ represents the mean of the observed experimental values.

2.3.3. Data Splitting and Encoding

To avoid information leakage from repeated measurements within a drying schedule, the evaluation used grouped cross-validation with groups defined as (mode, setpoint). “Drying mode” was one-hot encoded (MW, CD, OA); continuous predictors (time, temperature, power) were range-normalised (min–max scaled). The dragonfly algorithm tuned hyperparameters within C ∈ [10−2, 103], ε ∈ [10−5, 10−1], and kernel scale σ ∈ [10−2, 102] to minimise 5-fold grouped-CV RMSE. All experiments were performed at the same initial mass (40 g) and target layer thickness (≤5 mm); therefore, the DA–SVR is validated for interpolation within this geometry and the tested setpoint ranges, and extrapolation to other masses/layer thicknesses requires additional training data and re-validation.

2.4. Data Analysis

Drying mode, temperature, power, time, and the output variable (normalised mass remaining) were analysed for statistical properties, including standard deviation, variance, kurtosis, and skewness, as shown in Table 1. Multicollinearity among predictors was assessed to ensure model stability. All computations were performed using MATLAB 2018, with SVR implemented via the fitrsvm function and DA coded based on Mirjalili’s framework. Replicated endpoints are reported as mean ± SD (n = 3), unless stated otherwise. Differences between setpoints in time to constant mass and log10 reductions were assessed by one-way ANOVA with Tukey’s HSD (or Kruskal–Wallis with Dunn’s test if Shapiro–Wilk rejected normality); α = 0.05. For “ND”, we report the assay-specific LOD numerically.

3. Results

3.1. Drying Kinetics and Efficiency

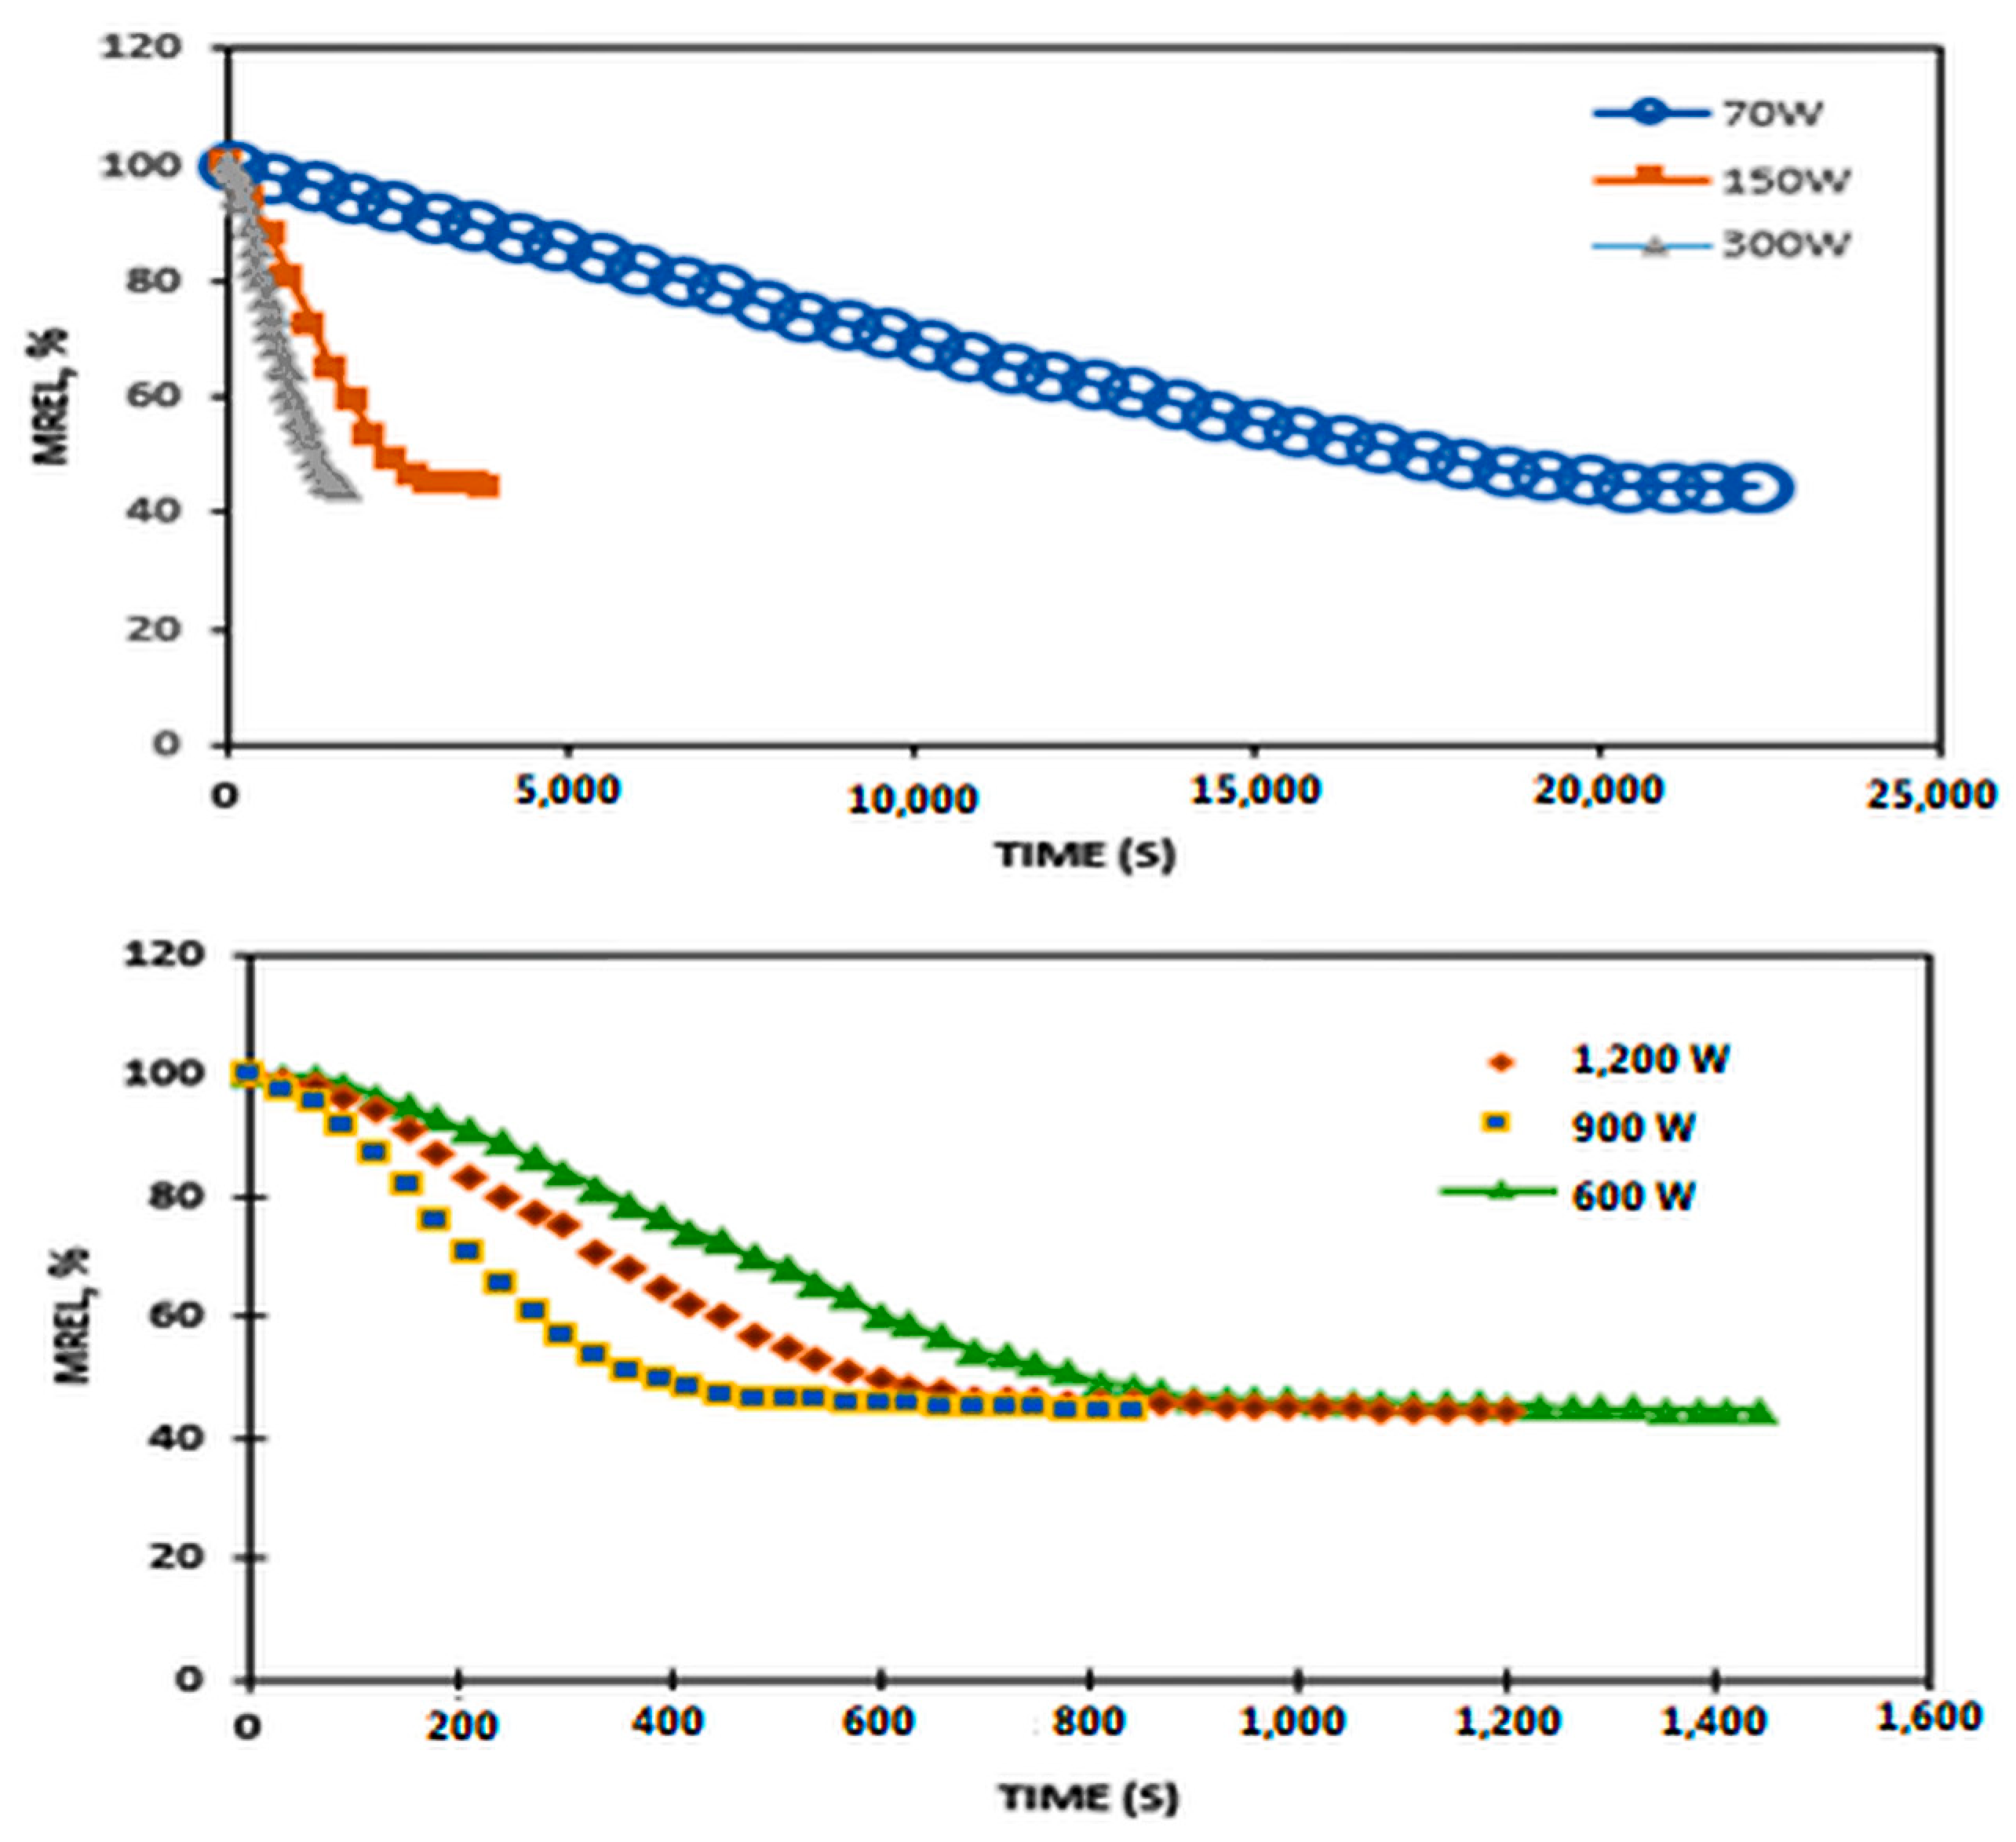
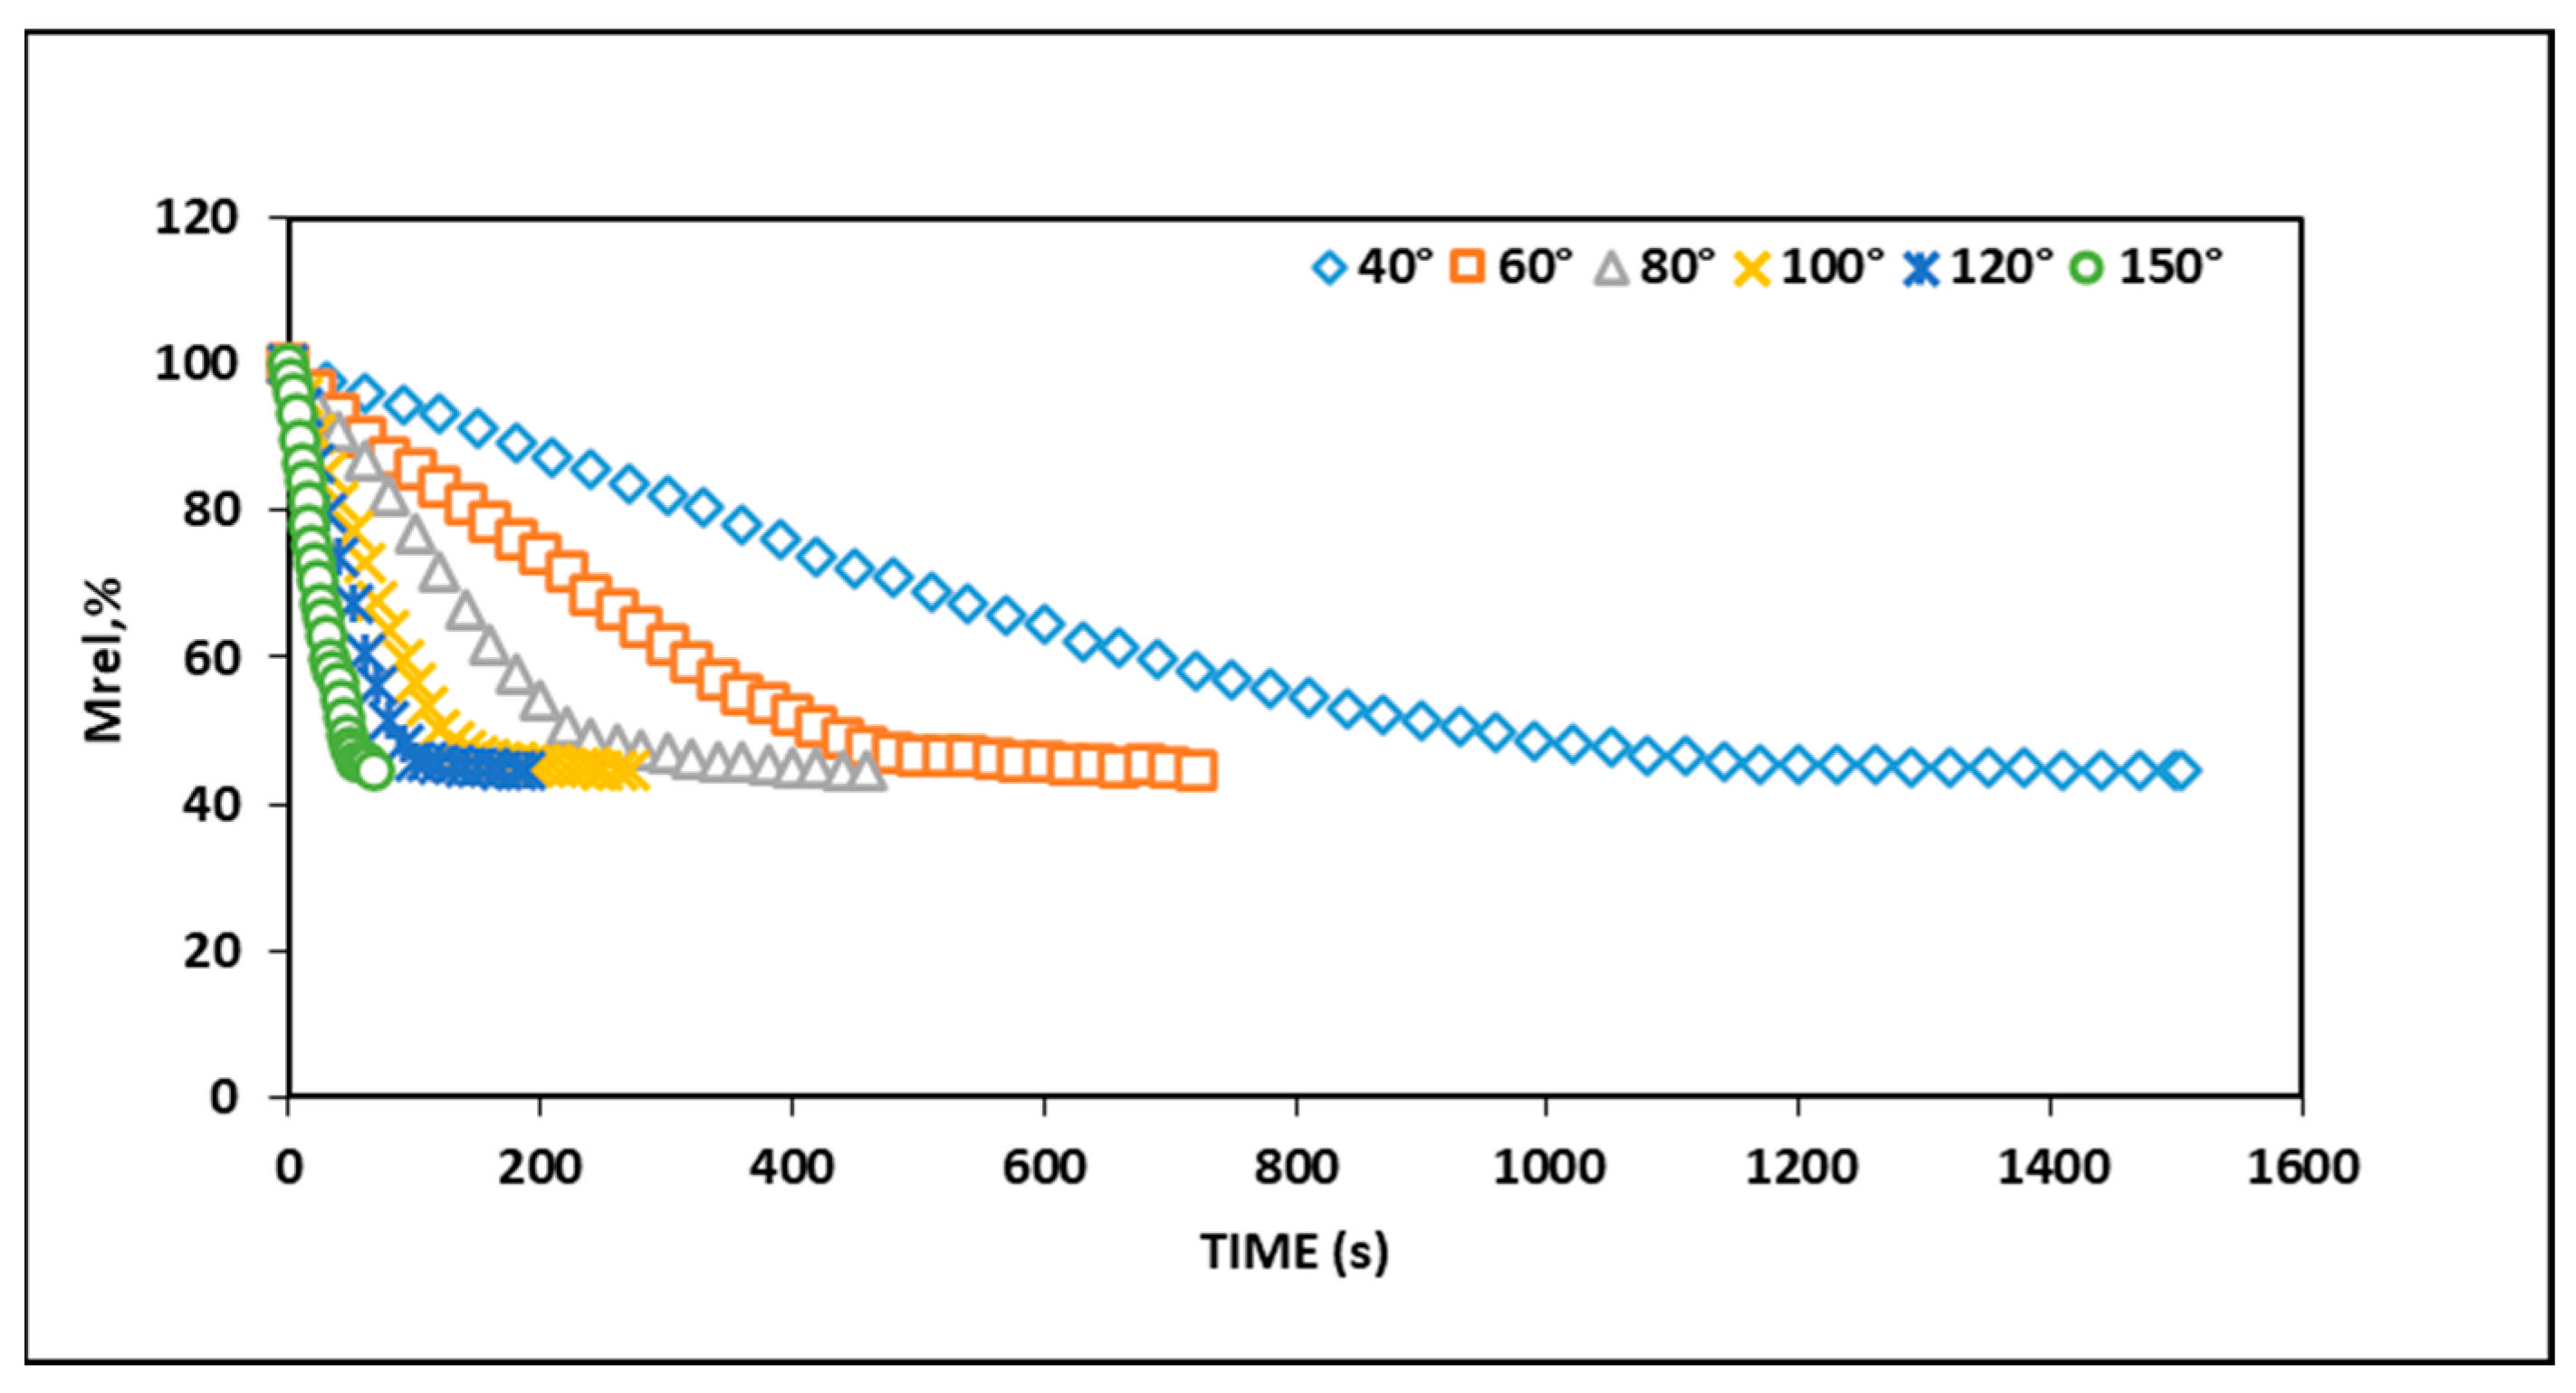
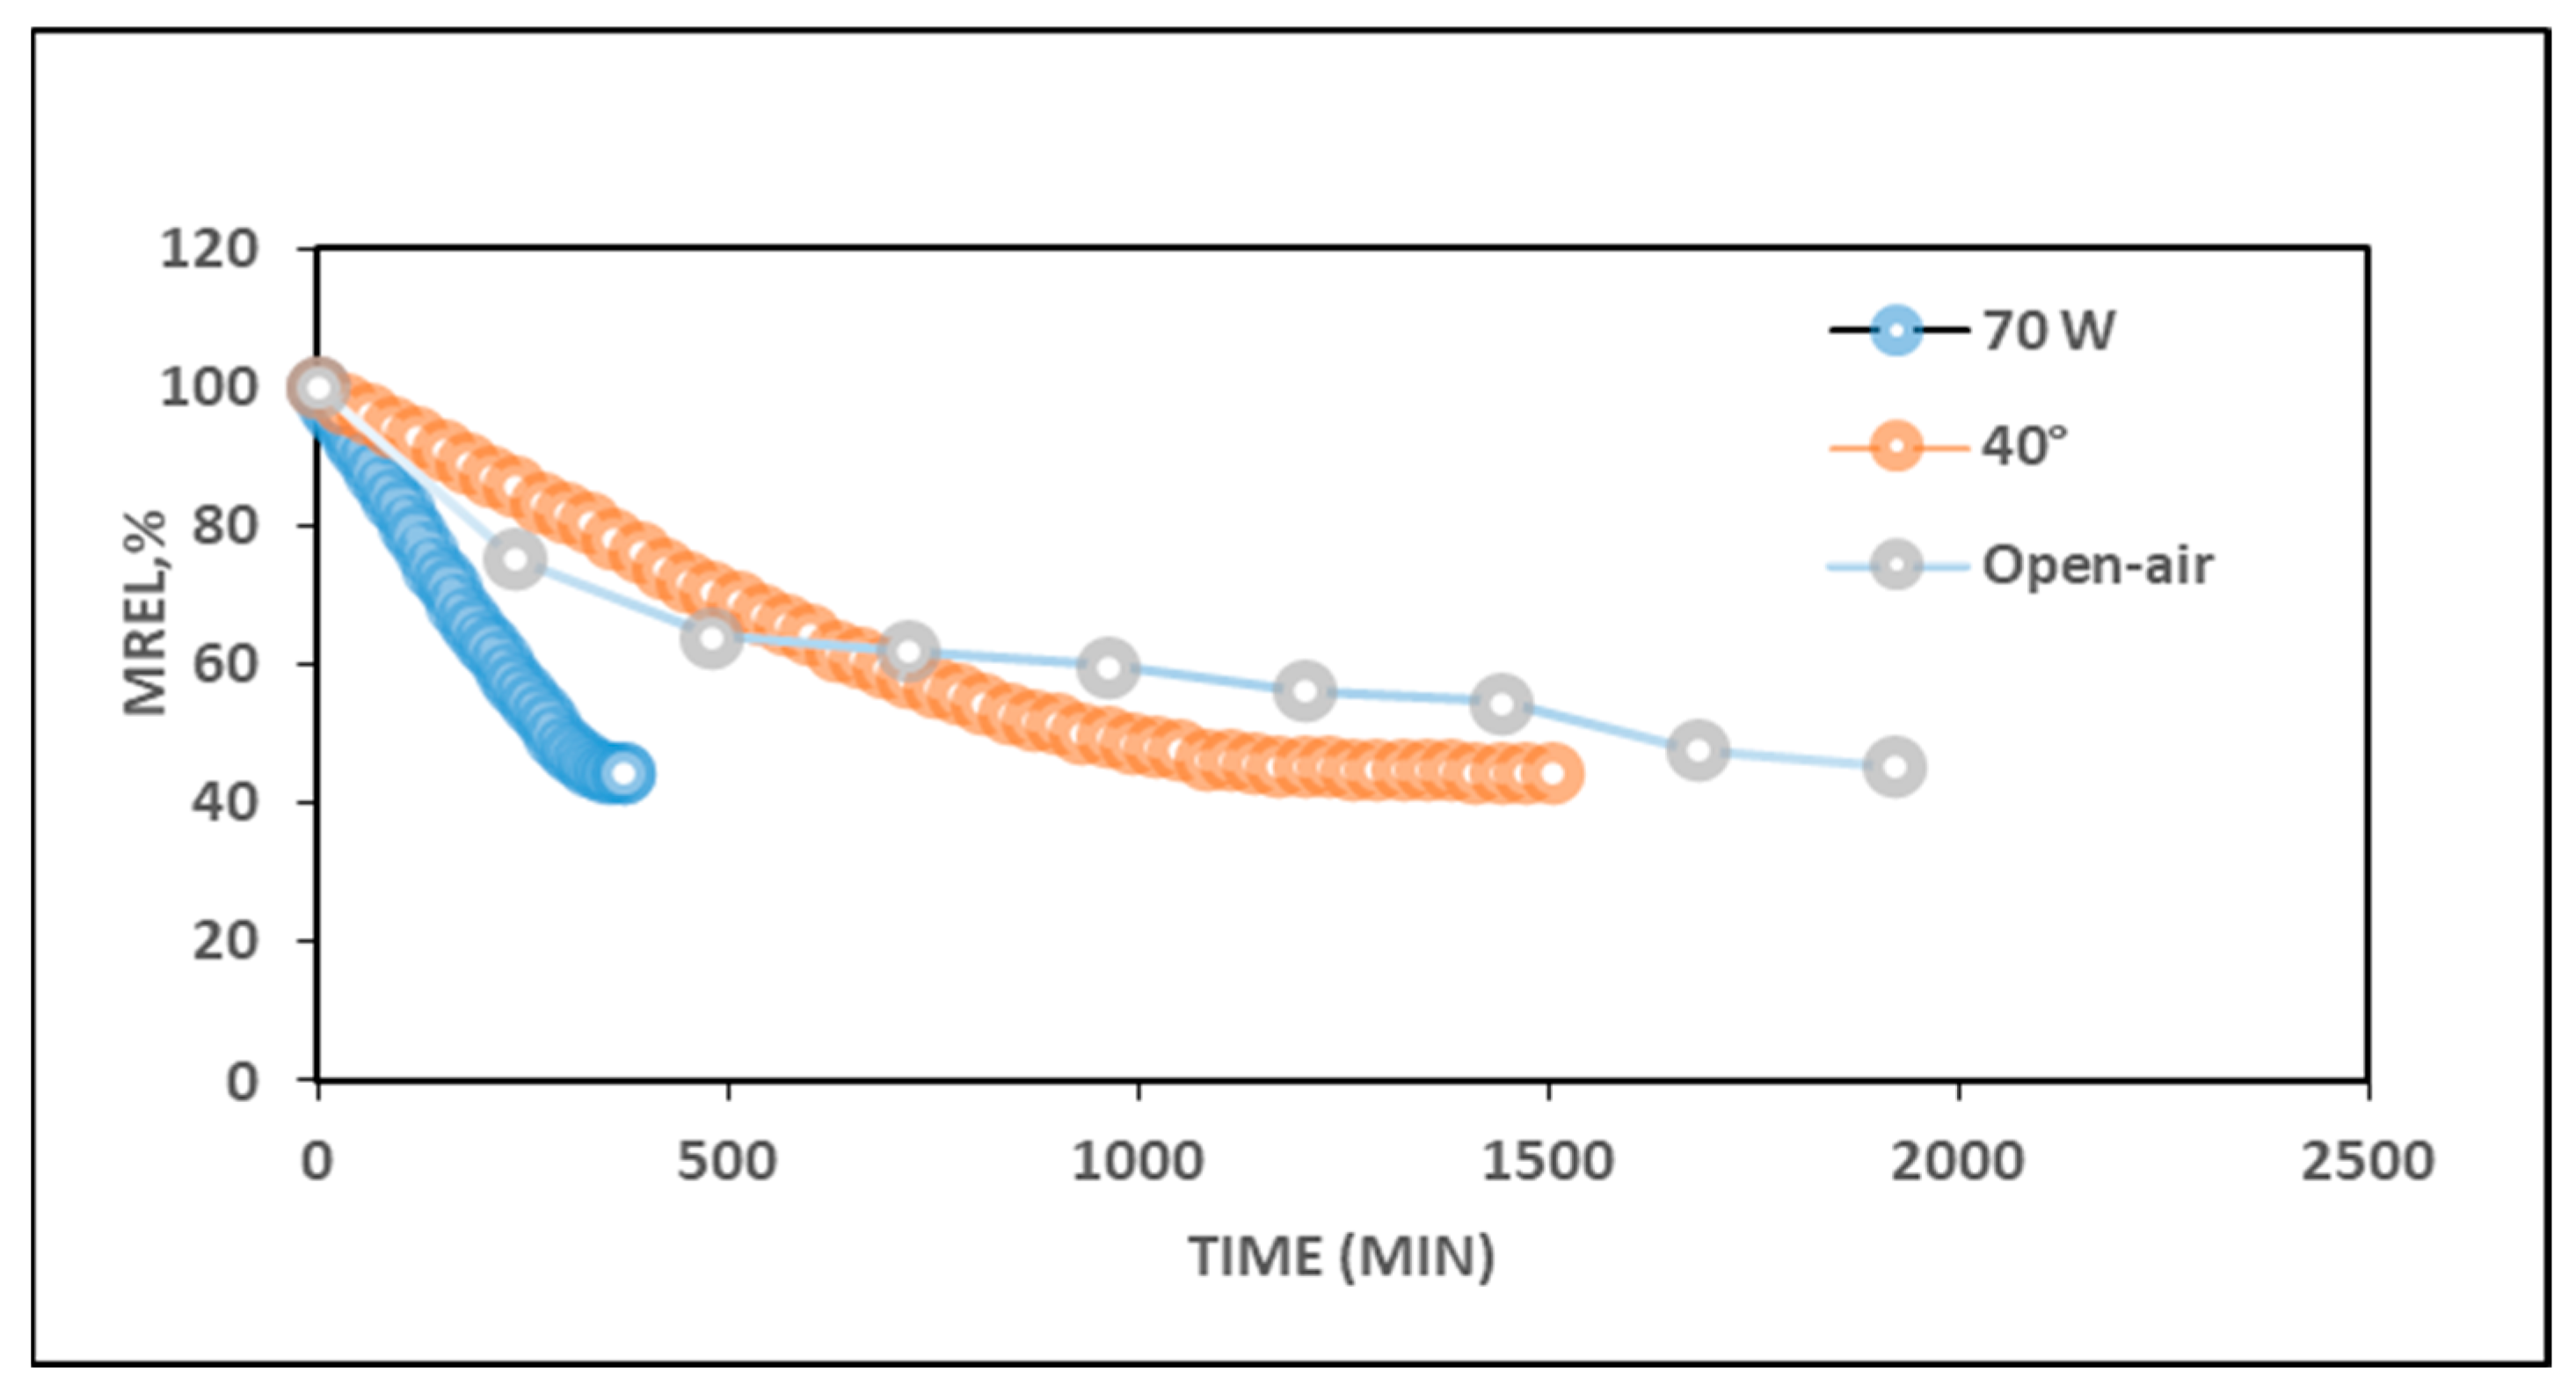
Normalised mass trajectories and time to constant mass. Under the thin-layer protocol (40 g wet mass; layer thickness ≤ 5 mm; constant mass endpoint as defined in Methods), the sample mass decreased rapidly at early times and then approached an asymptote as the material approached constant mass. Time to constant mass depended strongly on mode and intensity: open-air drying required 32 h; hot air runs required 25 h 05 min at 40 °C and 1 h 07 min at 150 °C; and microwave drying reached constant mass in 6 h 02 min at ~70 W, 20 min at 900 W, and 14 min 05 s at 1200 W. The corresponding trajectories are shown for microwave drying in Figure 2 and for convective oven drying in Figure 3; a direct cross-mode comparison appears in Figure 4. Relative to 40 °C (25 h 05 min), 900 W and 1200 W shortened time by 98.7% (to 20 min) and 99.1% (to 14 min 05 s); relative to open air (32 h), the reductions were 99.0% and 99.3%, respectively. In all cases, the curves exhibit a rapid initial decrease followed by a slower approach toward an asymptote; total drying time decreases monotonically with increasing oven temperature and with increasing microwave power (Figure 2, Figure 3 and Figure 4). This pattern, in which volumetric heating compresses the overall trajectory in time, matches thin-layer studies in which microwave heating accelerates internal moisture transport relative to surface-limited convective transfer [8,44].
Sample temperature during microwave exposure was not recorded continuously; therefore, MW conditions are reported by nominal power and exposure time. The terminal plateau corresponds to mdry/mi × 100 (≈44.5% for this sludge).
For the microwave curve, sample temperature was not recorded continuously; therefore, the MW condition is reported by nominal power and exposure time. The terminal plateau corresponds to mdry/mi × 100 (≈44.5% for this sludge).
From a process engineering standpoint, such two-order-of-magnitude reductions in residence time at comparable endpoints translate into substantial gains in sludge handling capacity for a given dryer footprint and highlight the potential of microwave thin-layer units as compact conditioning steps for storage/transport and for thermal valorisation pathways, subject to scale-up constraints.
Drying-rate behaviour. Average rates for the ~22.2 g of water removed increased approximately in the order open-air < 40 °C convective < 70 W microwave < 150 °C convective < 900 W microwave < 1200 W microwave (Figure 2, Figure 3 and Figure 4). Pointwise drying rate (DR) versus time profiles show a brief warm-up phase in MW runs and a higher initial surface evaporation segment in convective runs, followed by a falling-rate period dominated by internal diffusion and bound water, consistent with classical thin-layer kinetics in both MW and hot air modes (as illustrated by slope changes in Figure 2 and Figure 3) [8,47].
Viewed through an applied chemistry lens, the transition from constant-rate to falling-rate stages reflects the progressive depletion of free and capillary water and the increasing importance of moisture bound to the organic–mineral matrix. This transition governs both energy demand and thermal exposure relevant for microbial inactivation.
Energy use and SEC (upper-bound estimate). To improve cross-method clarity, the comparison among drying modes is expressed here in terms of (i) time to constant mass, (ii) estimated electrical energy input, and (iii) SEC_proxy, rather than as a direct operating cost metric. Under the present screening definition, E_proxy = P_nameplate × t and SEC_proxy = E_proxy/m_evap, so the apparent SEC depends on both residence time and system-level losses. Bench- and pilot-scale studies commonly show that SEC is highest during pre-heating and decreases during the constant-rate stage when most input power contributes to the latent heat of vapourisation; raising MW power shortens pre-heating and can, therefore, reduce SEC per kilogram of evaporated water, although device-level losses (magnetron/cavity inefficiencies, heat leaks, vapour handling) may erode these gains [8]. These trends are consistent with the pronounced time reductions observed at higher temperature/power (Figure 2, Figure 3 and Figure 4). For the ~22.2 g of water removed (initial 40.0 g → final ~17.8 g), a water-only theoretical minimum energy to heat the removed water from 20 to 100 °C and evaporate it is ≈57 kJ (sensible + latent). Including sensible heating of the sludge solids to the evaporation temperature adds only a few kJ (order of magnitude), giving ≈60 kJ for the material. Importantly, this thermodynamic lower bound does not include heating of the glass dish or any device-level losses; if the system boundary is expanded to include these thermal masses, the minimum increases accordingly, especially at very low loads in domestic-scale equipment.
Example calculation (material lower bound): water removed mw ≈ 0.0222 kg; ΔT ≈ 80 K; cp,w ≈ 4.18 kJ·kg−1·K−1; and λ ≈ 2257 kJ·kg−1. Therefore, Emin, water ≈ mw cp,w ΔT + mw λ ≈ (0.0222 × 4.18 × 80) + (0.0222 × 2257) ≈ 7 + 50 ≈ 57 kJ. If m_dry ≈ 0.0178 kg and cp,s ≈ 1–2 kJ·kg−1·K−1 are assumed, sensible heating of solids by 80 K adds ≈1–3 kJ.
Using nameplate power × time as an upper-bound estimate, the MW runs drew ~1.52 MJ (70 W, 6 h 02 min), ~1.08 MJ (900 W, 20 min), and ~1.01 MJ (1200 W, 14 min 05 s), corresponding to ~68.5, 48.6, and 45.5 MJ·kg−1 H2O, respectively (based on mw = 0.0222 kg). These SEC values were computed as illustrative upper bounds using nameplate power × time in a domestic cavity at low load (40 g). Because device-level and thermal losses are unmetered, these values overestimate energy consumption (and thus underestimate process-level efficiency) and are reported strictly for comparative assessment across schedules. Even within this upper-bound framework, the observed decrease in apparent SEC with increasing power is informative for screening operating windows and motivates hybrid strategies in which slower, energy-flexible convective pre-drying is combined with short, high-power MW finishing to deliver the required thermal dose with minimised additional energy input. In this sense, the present thin-layer experiments provide process-relevant guidance for the design of sludge conditioning lines rather than merely a laboratory comparison of devices.
Non-MW SEC proxy (upper bound). To provide a comparable screening indicator for the non-microwave techniques, we estimated an upper-bound electrical SEC for convective drying by multiplying the oven nameplate electrical load (approximately 2.8 kW at 230 V for the UN110 unit) by the measured time to constant mass. Assuming continuous full-load operation (i.e., neglecting thermostat cycling), the 40 °C run (25 h 05 min) corresponds to approximately 253 MJ (≈70.2 kWh) total electrical energy, i.e., ≈1.14 × 10⁴ MJ·kg−1 H2O (≈3160 kWh·kg−1 H2O) for 0.0222 kg of evaporated water; the 150 °C run (1 h 07 min) corresponds to approximately 11.3 MJ (≈3.13 kWh), i.e., ≈507 MJ·kg−1 H2O (≈141 kWh·kg−1 H2O). These values are intentionally conservative laboratory-scale screening estimates and should not be interpreted as process-level efficiencies or direct operating costs; at this very-low loading (40 g in a 108 L chamber oven), the energy term is dominated by heating the chamber and by control losses, and the true average power is lower because of thermostat cycling. Open-air drying has negligible direct electrical input but requires long residence time and a large footprint. Metered electricity input (plug-level kWh) and higher loading are required for defensible cross-technology SEC benchmarking.

3.2. Sanitary Outcomes (Indicator Organisms)

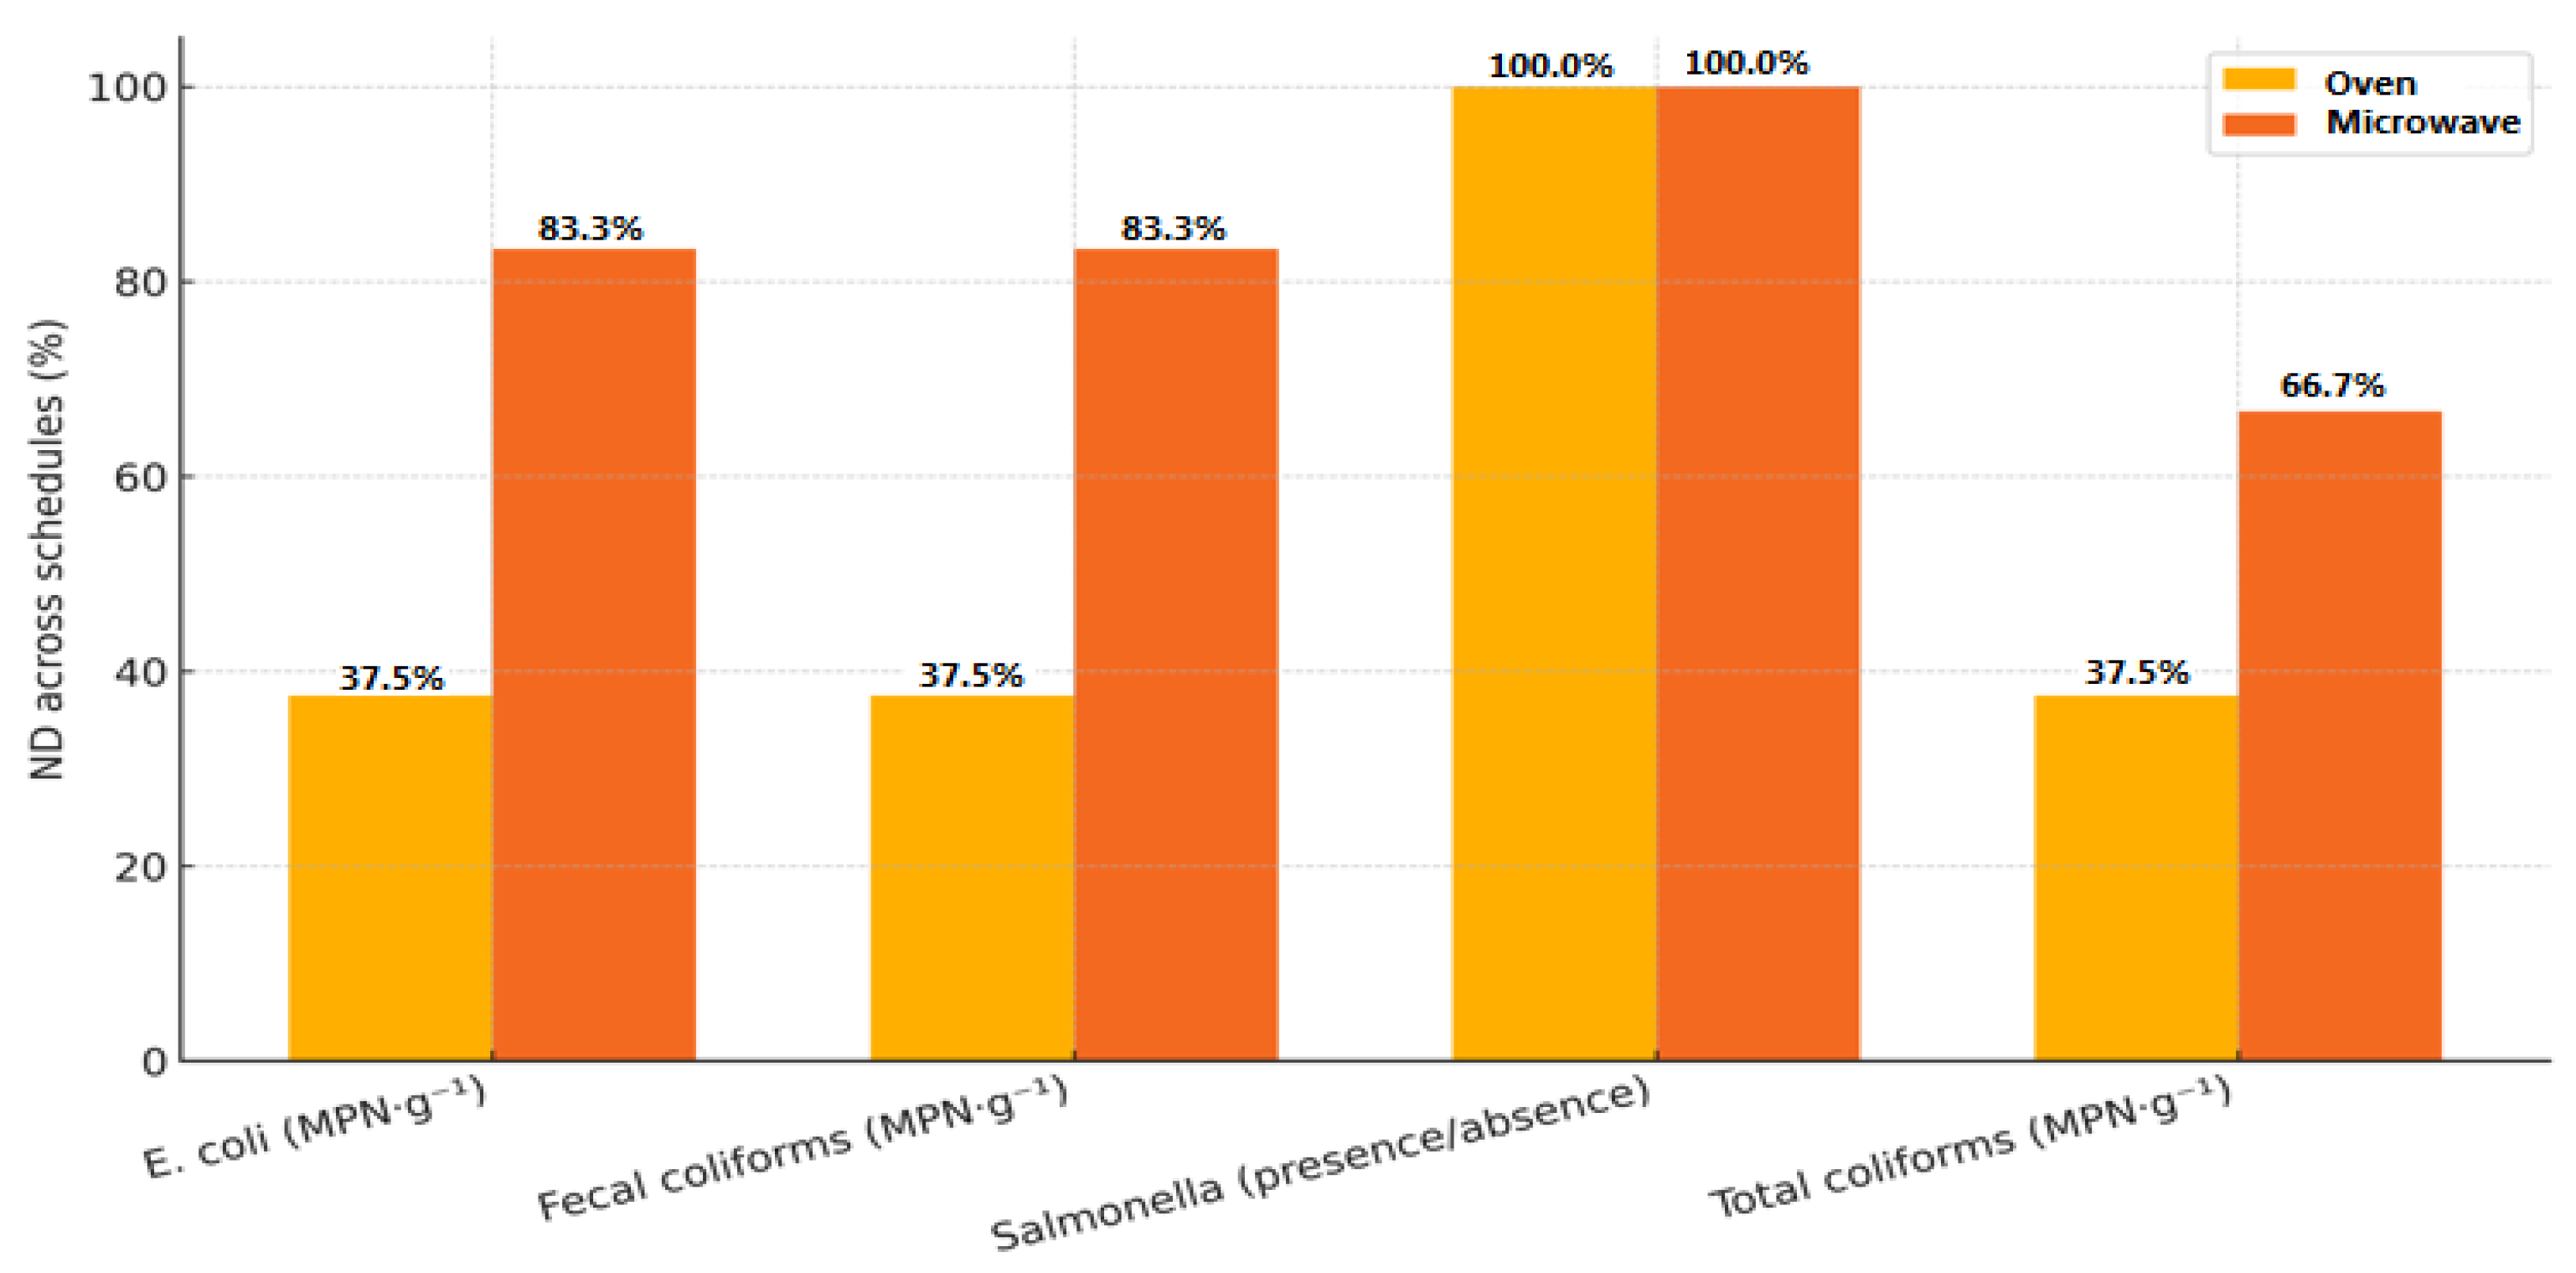
Across both heating modes, a clear dose–response was observed (Figure 5). Under conventional oven drying, total coliforms, thermotolerant coliforms, and presumptive E. coli reached ND by 100 °C, whereas under MW treatment, the same indicators reached ND at ≥300 W. All samples were negative for Salmonella throughout, consistent with prior reports that adequately dosed MW treatment/drying achieves complete or near-complete inactivation of faecal indicators in sewage sludge [20,48] and with recent analyses describing the staged drying kinetics and energy behaviour of MW sludge drying [8,49]. Foundational work has also reported Salmonella spp. to be often below detection following MW-based thermal treatment of sludge [50].
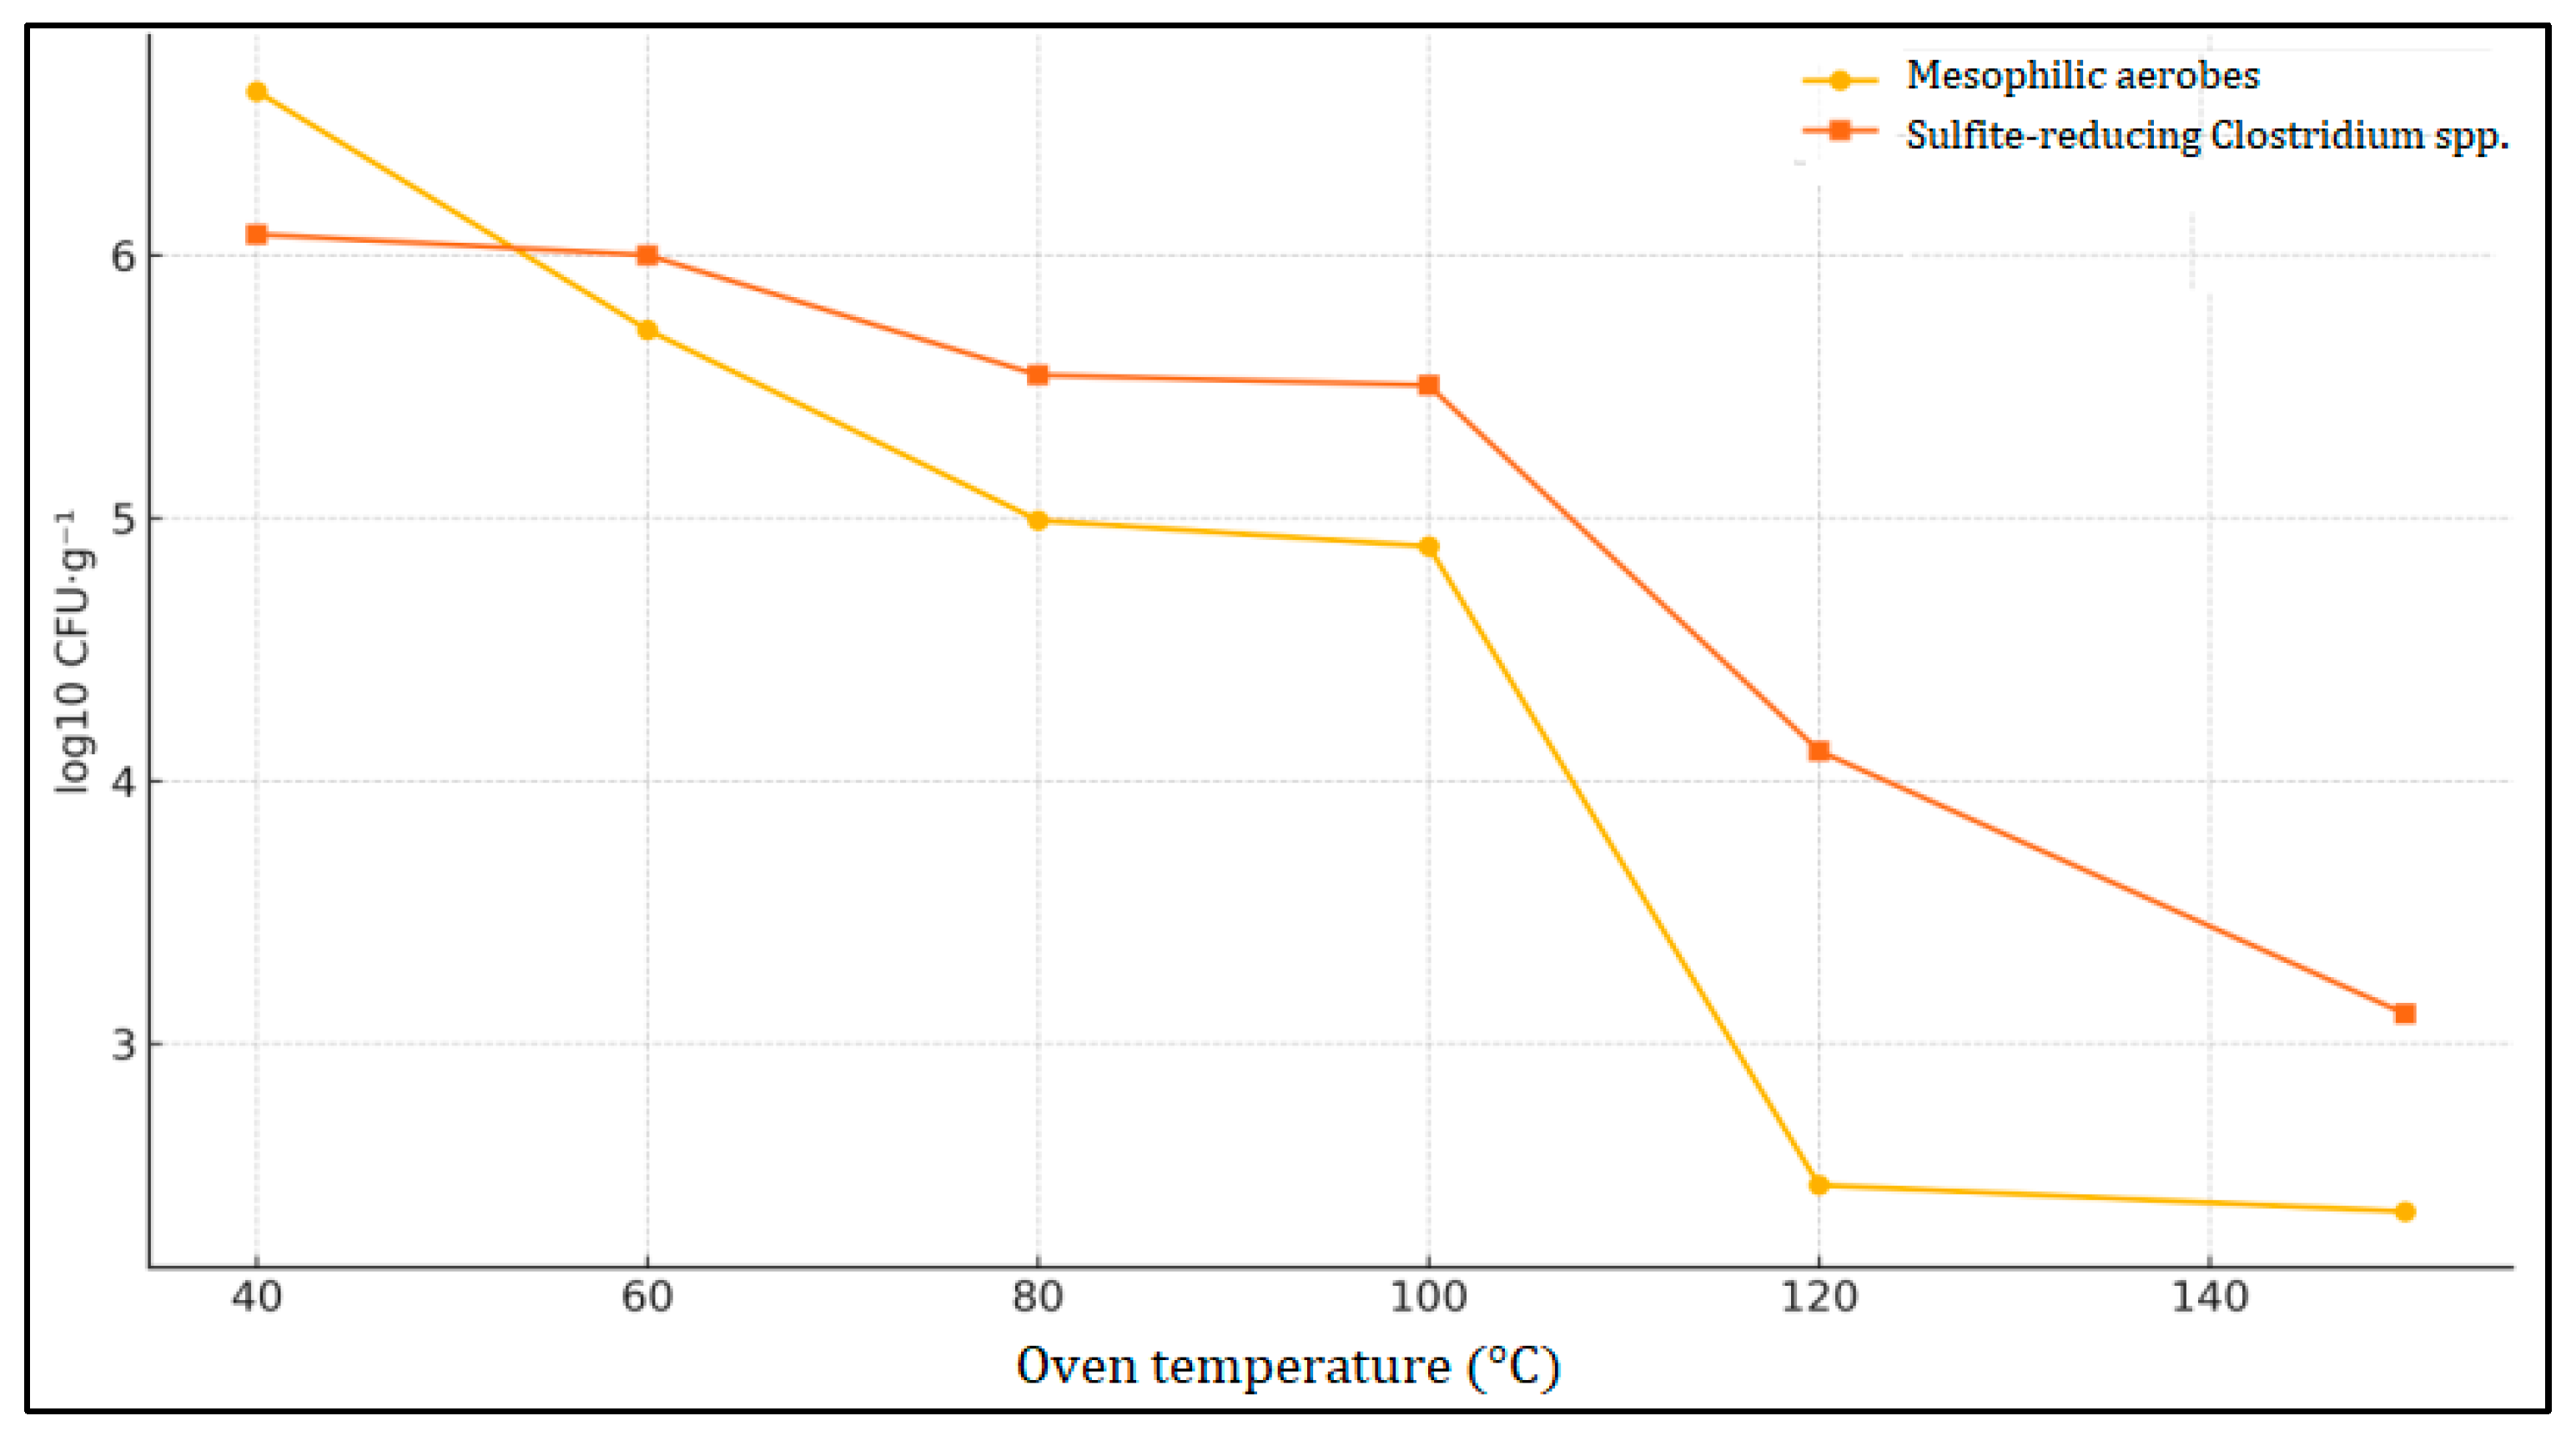
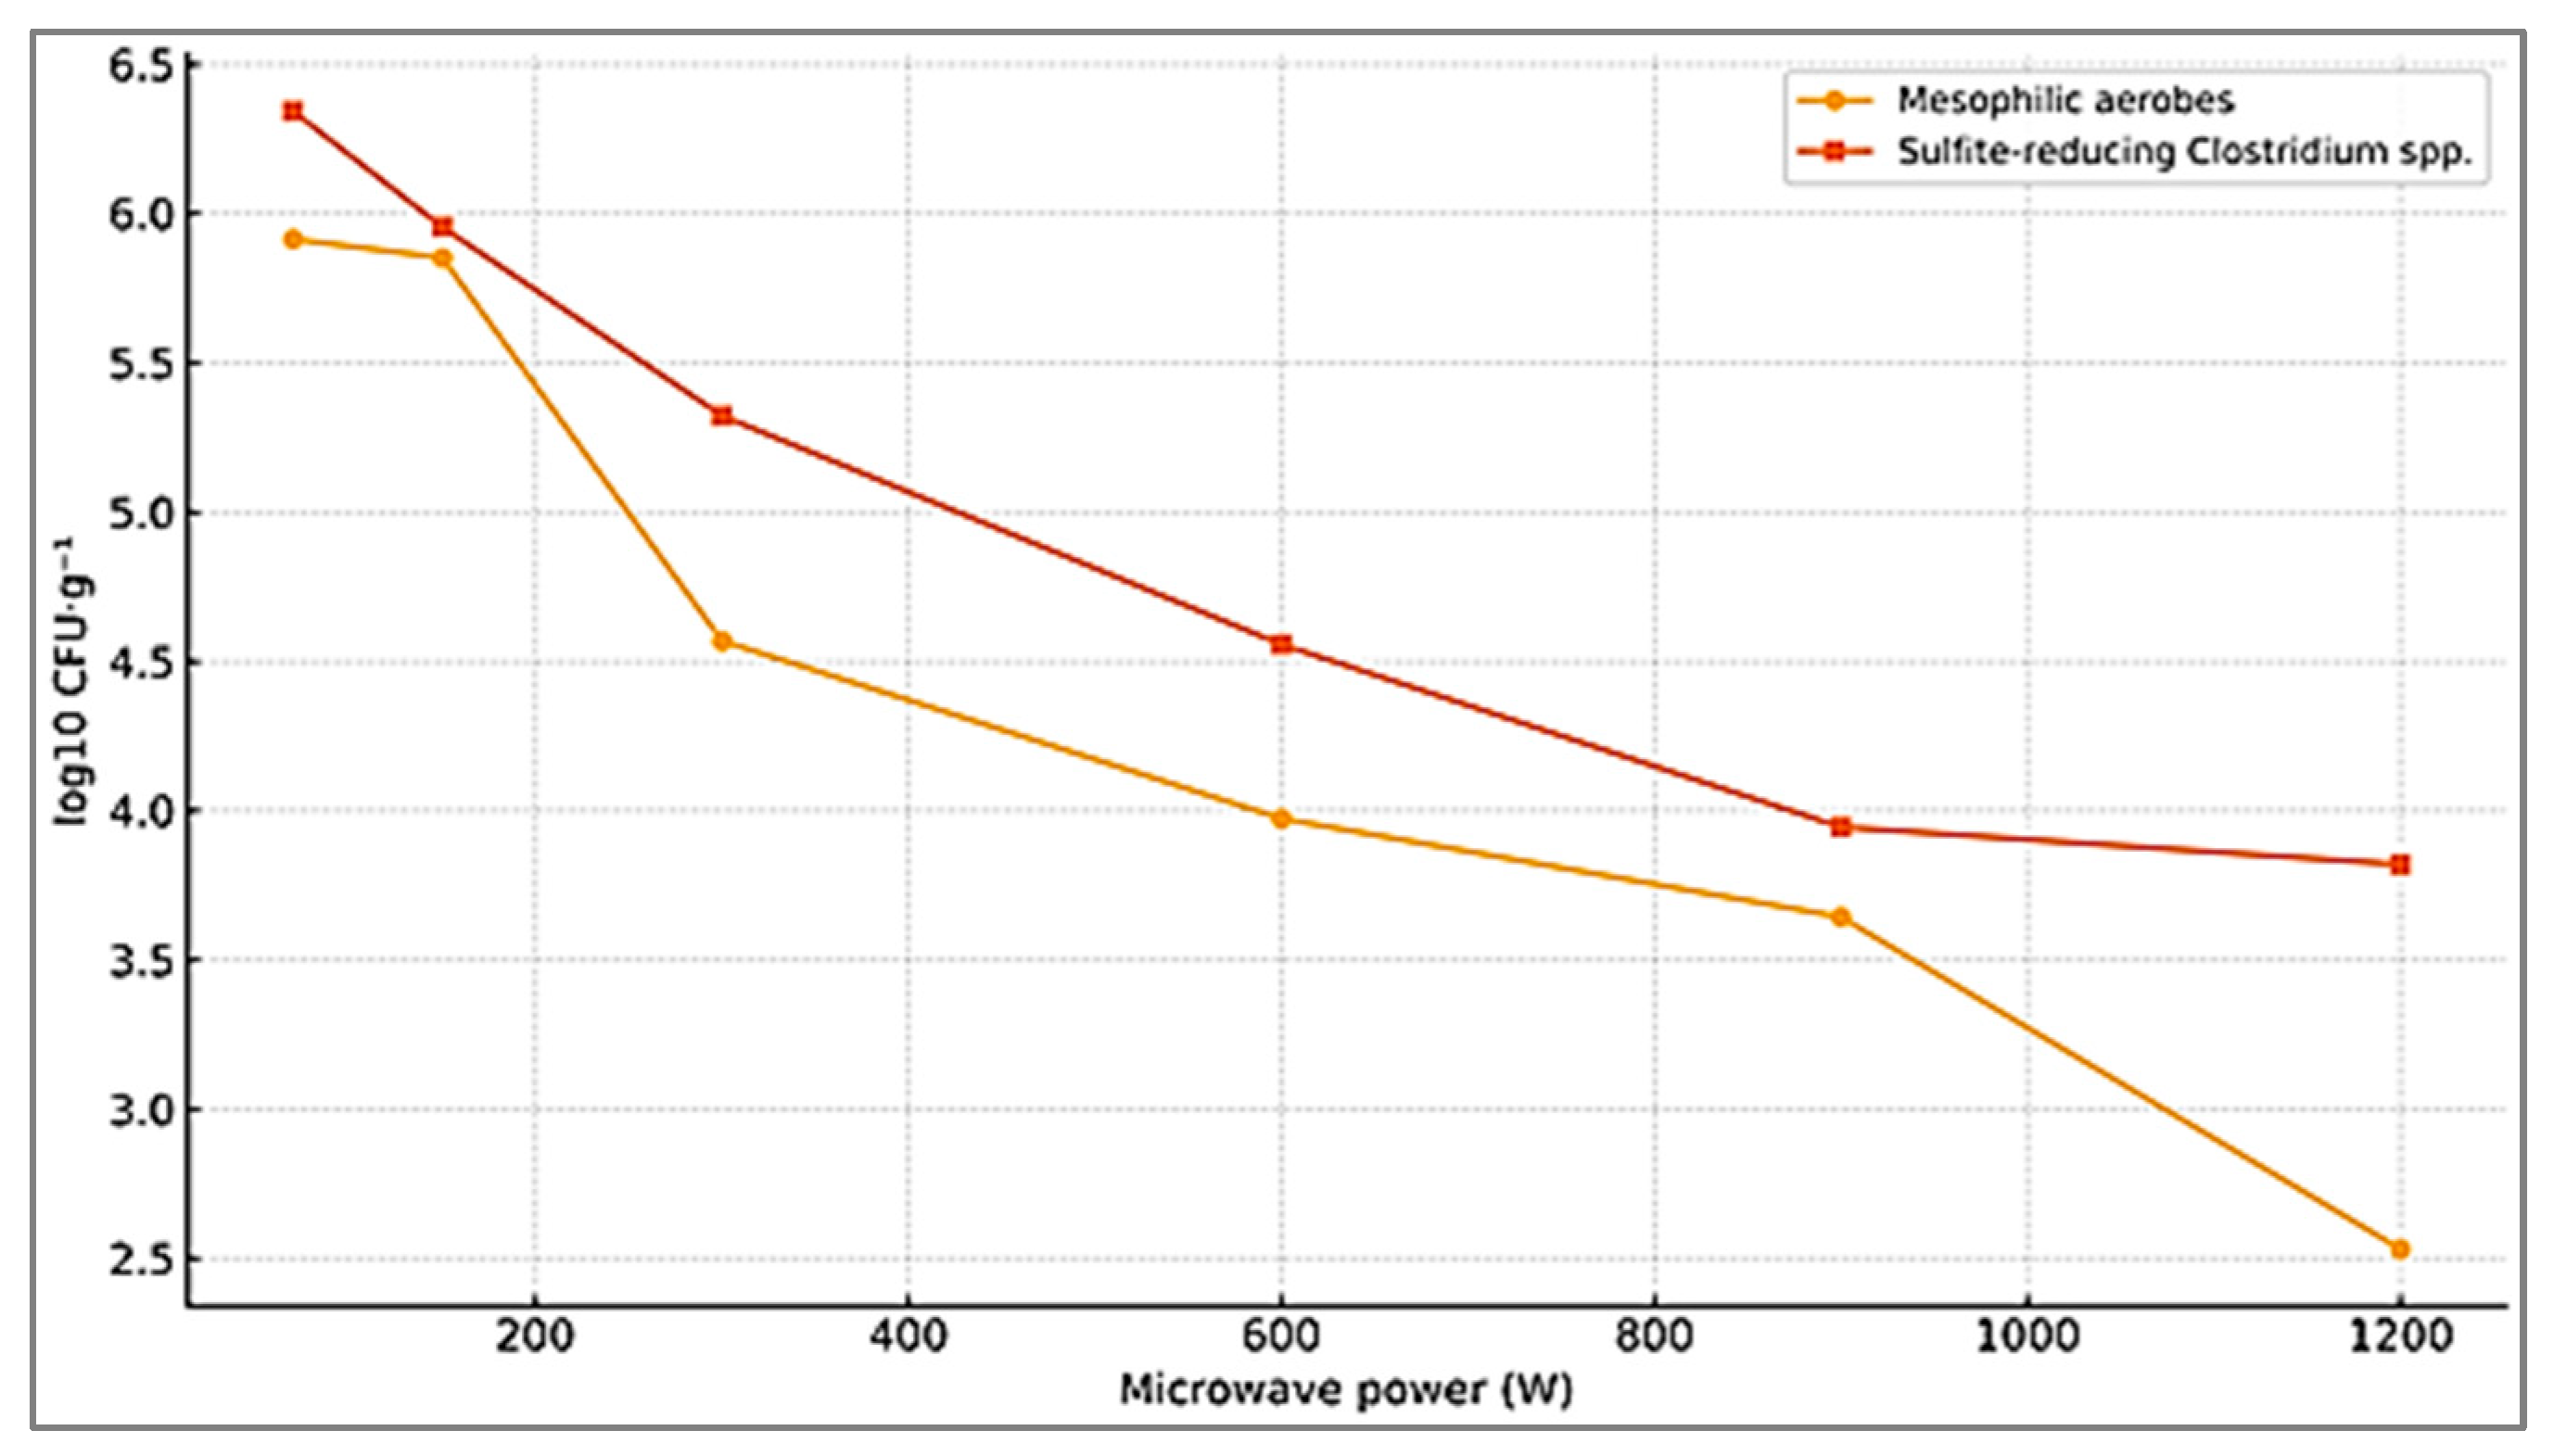
ND reflects the method-specific detection limit for the tested portion and should not be interpreted as sterility. Quantitative inactivation trends as a function of oven temperature and microwave power are shown in Figure 6 and Figure 7.
ND indicates values below the method-specific detection limit for the tested mass/volume.
In the conventional oven (Figure 6), mesophilic aerobes declined from roughly 4.2 × 10⁶ CFU·g−1 at 40 °C to 2.3 × 10² CFU·g−1 at 150 °C, a ≈ 4.3-log10 reduction. Over the same temperature range, sulfite-reducing Clostridium spp. decreased from about 1.2 × 10⁶ to 1.3 × 10³ CFU·g−1 (≈3.0-log10). Under MW heating (Figure 7), increasing the power from 70 to 1200 W reduced aerobic counts from 8.2 × 10⁵ to 3.4 × 10² CFU·g−1 (≈3.4-log10) and sulfite-reducing Clostridium spp. from 2.2 × 10⁶ to 6.6 × 10³ CFU·g−1 (≈ 2.5-log10). Together with the binary endpoints, these data indicate monotonic sanitation gains with thermal/MW dose, consistent with the temperature- and energy-dependent inactivation kinetics reported for sludge matrices [8,51,52].
The convergence of binary and quantitative indicators suggests that, under the present thin-layer conditions, (1) oven temperatures ≥ 100 °C or (2) MW power ≥ 300 W are sufficient to drive faecal indicators to ND, while progressive log-scale reductions in total aerobes and sulfite-reducing Clostridium spp. accrue with increasing dose. This pattern aligns with the literature documenting rapid mass-loss kinetics and volumetric heating effects under MWs, which reduce time to constant mass and favour microbial inactivation when field uniformity is adequate [8,20,51,52].
Because sample temperature was not recorded continuously during microwave exposure, we cannot report a direct log10 reduction versus temperature (or a temperature-based F-value/FU comparison) for microwave schedules; microwave hygienisation outcomes are, therefore, reported against nominal power and exposure time.
Dose framing: for convective drying, inactivation trends are governed by cumulative thermal exposure (time–temperature history). For microwave drying, because continuous sample temperature was not recorded, outcomes are interpreted against a power–time surrogate dose (nominal power × exposure time), with the recognition that field non-uniformity may cause spatial temperature heterogeneity. This limitation is explicitly acknowledged and motivates future work with continuous temperature logging to enable temperature-based FU/F-value comparisons.
The TSC method captures sulfite-reducing Clostridium spp. rather than exclusively C. perfringens; the assay, therefore, reflects a conservative indicator group. Moreover, ND reflects method-specific LODs rather than absolute sterility, so scale-up should incorporate verification of dose delivery (field uniformity, layer thickness, residence time) and matrix variability before asserting regulatory compliance [32,34,35].

3.3. Probability Density and Multicollinearity Analysis

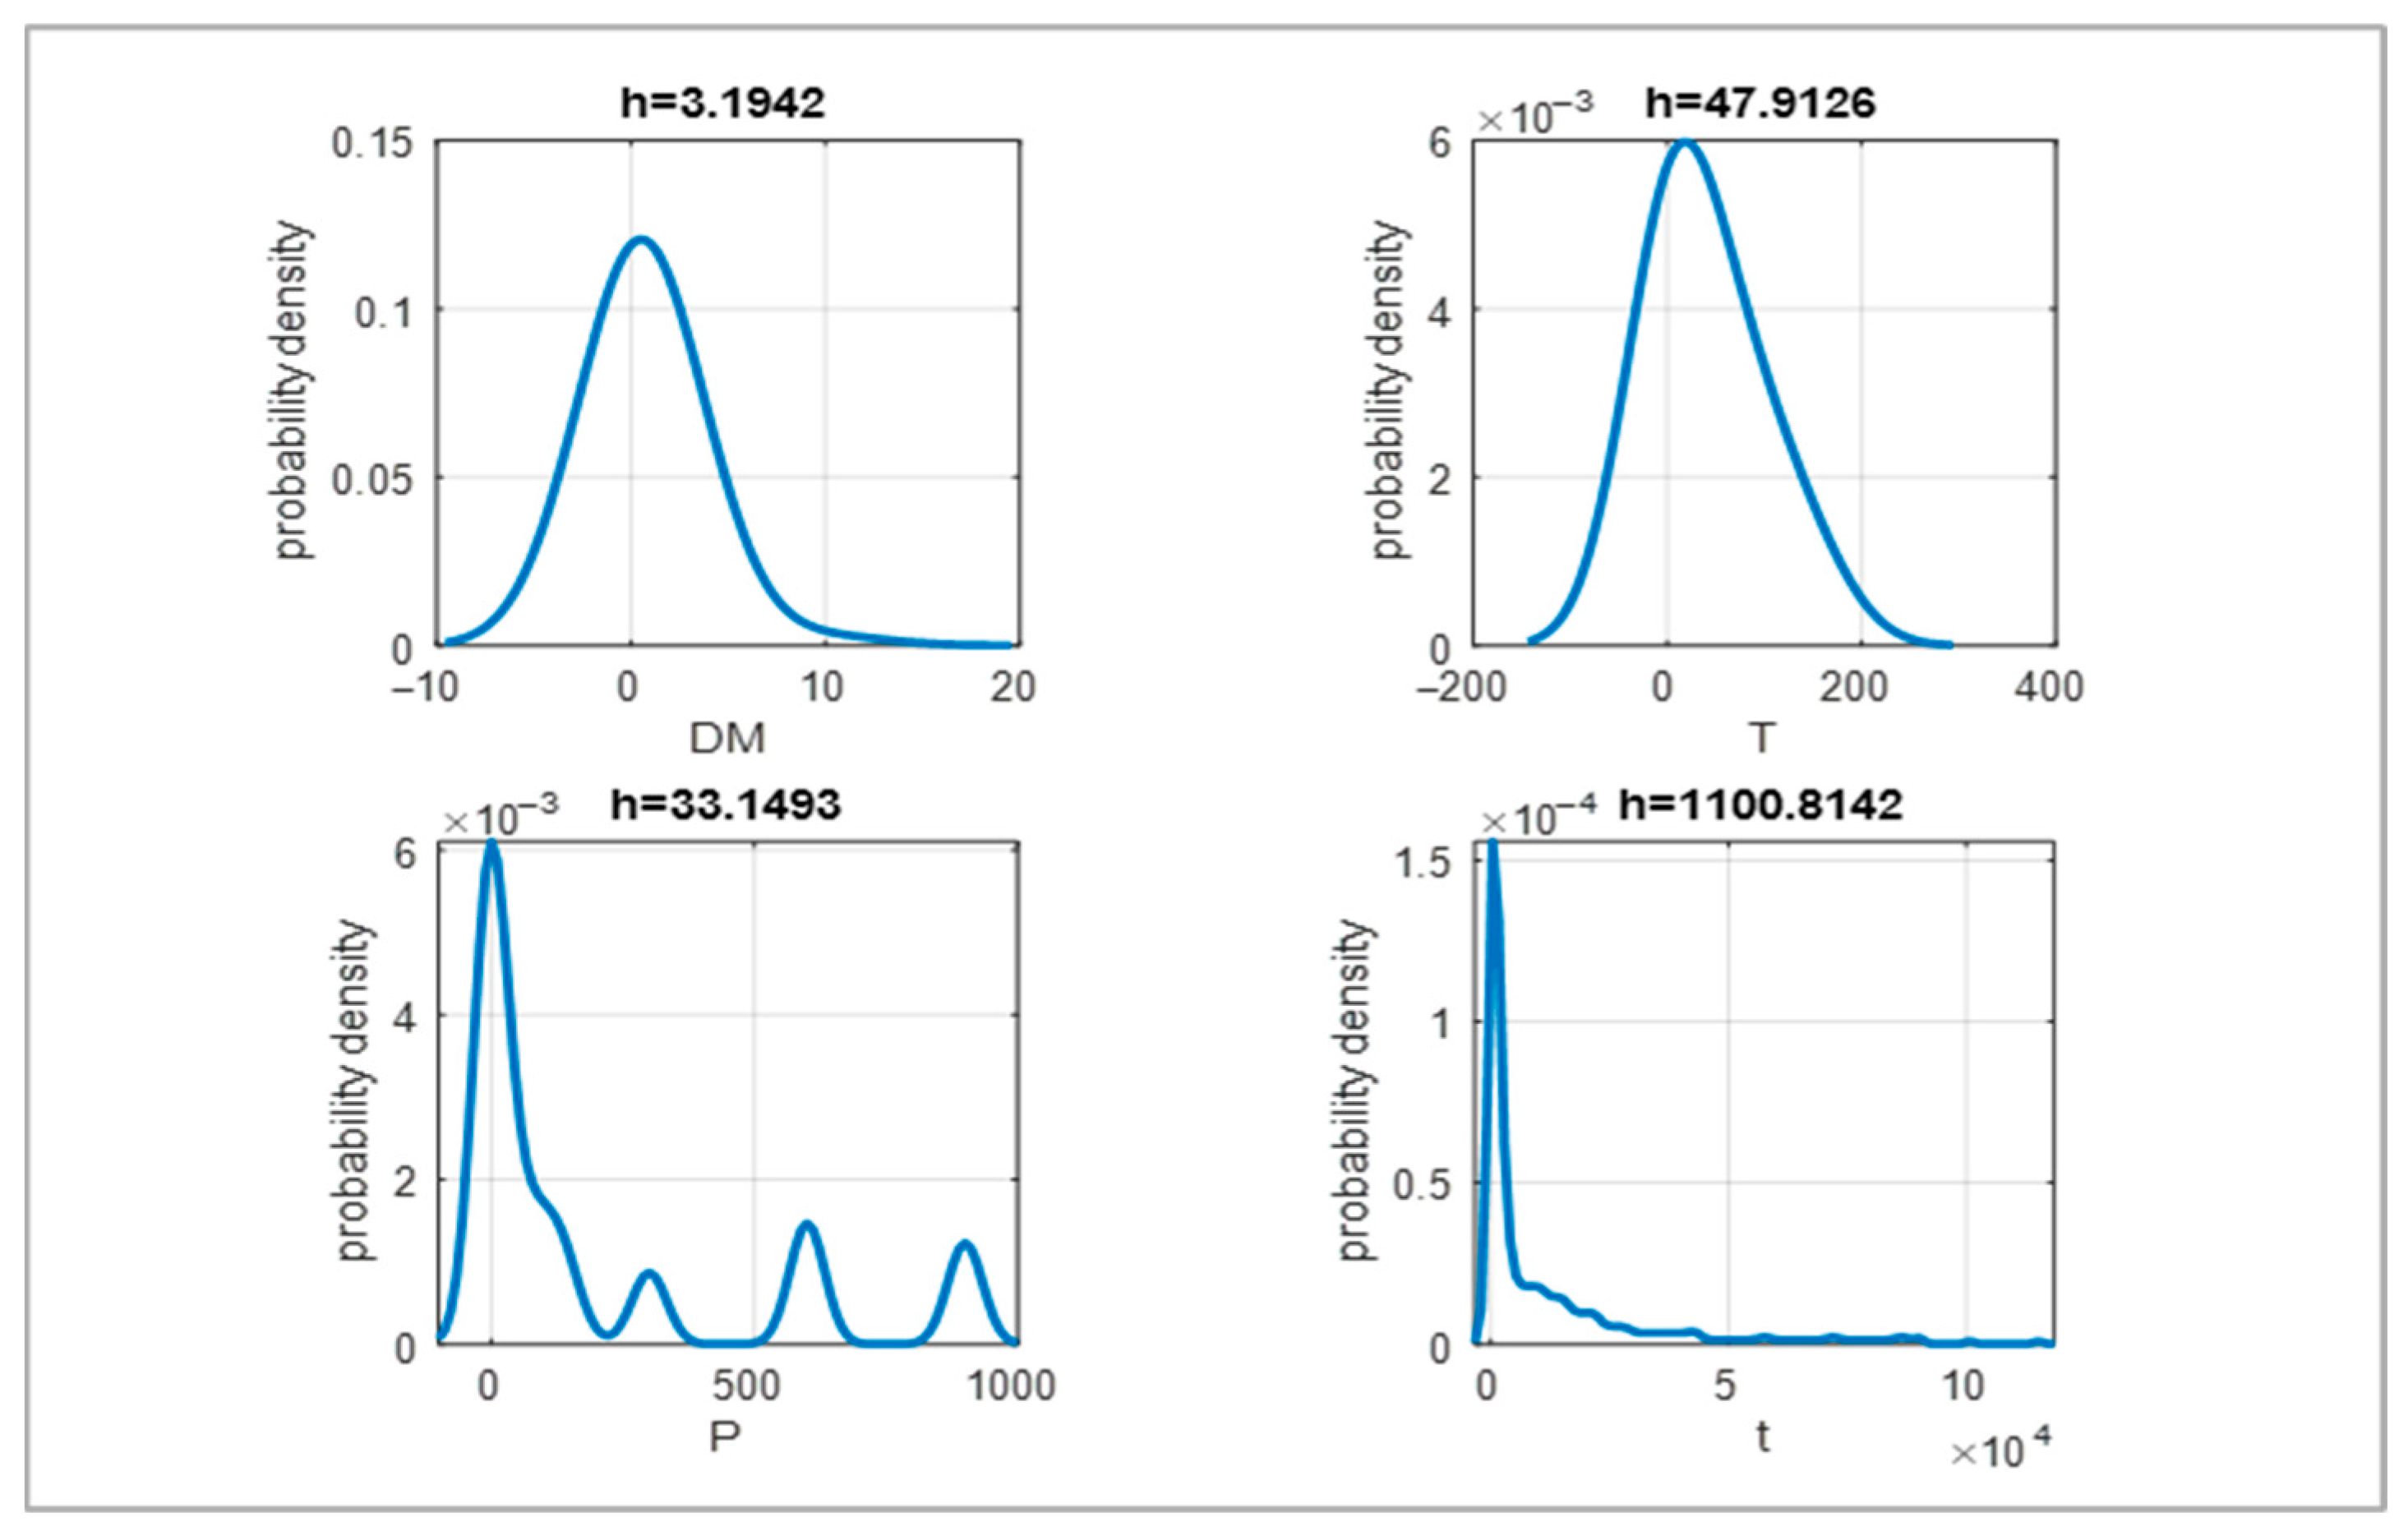
Density structure of inputs. The empirical distributions of the continuous inputs—temperature (T, °C), microwave power (P, W), and time (t, s)—were estimated by kernel density estimation using a Gaussian kernel and an automatic bandwidth (Silverman/Scott rule) implemented in MATLAB. Drying mode (DM) is categorical and was summarised by category frequencies (probability mass) rather than a continuous PDF.
The KDE plots (Figure 8) show right-skewed densities for t and P and moderate skew for T, reflecting the broad operating window (short, high-power MW runs combined with longer, low-temperature convective runs). Such non-Gaussian, sometimes heavy-tailed inputs are typical in sludge drying datasets and motivate kernelised predictors that do not assume normality [53,54].
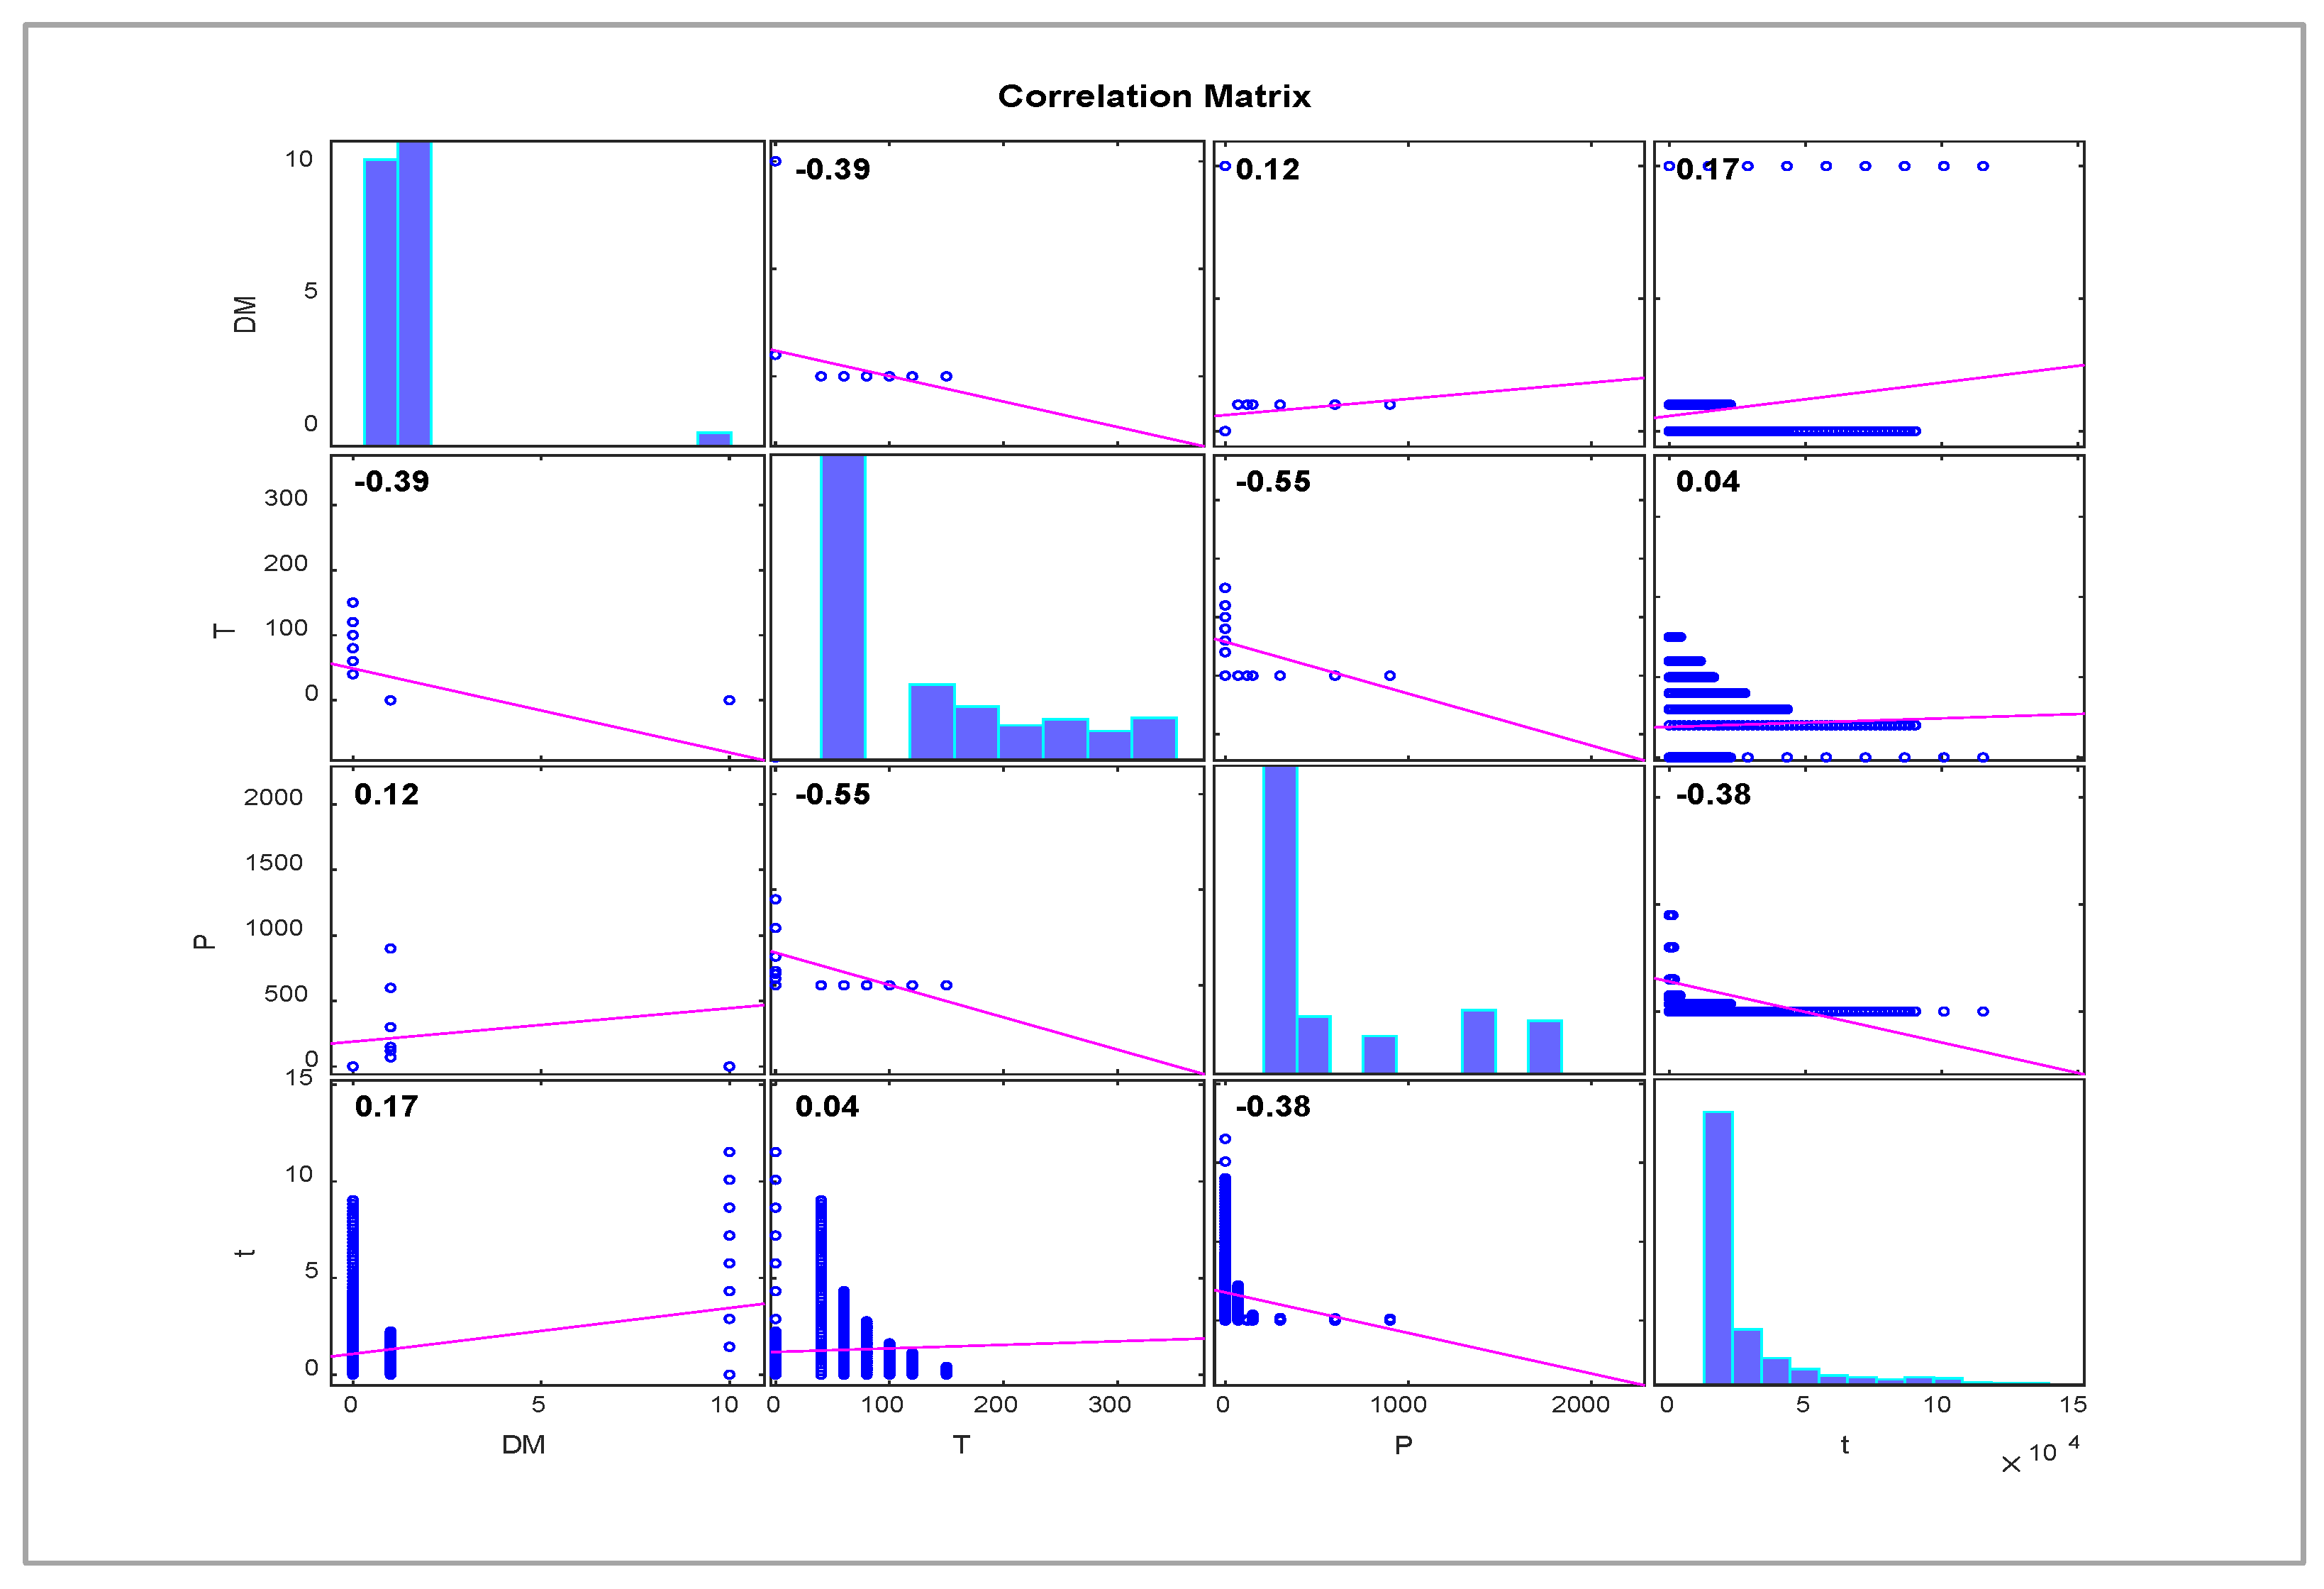
Multicollinearity diagnostics (Figure 9). Redundancy among predictors was assessed in two steps. First, pairwise associations were computed as Pearson correlations (continuous–continuous) and point-biserial/Cramér’s V (categorical–continuous/categorical). Because T and P are mutually exclusive by drying mode, correlations were reported within mode (MW subset for P, CD subset for T), and the design-induced association between DM and [T, P] was documented. Second, variance inflation factors (VIFs) were calculated from auxiliary regressions; values below conventional thresholds (≈5–10) indicated no problematic inflation of variance for prediction.
Implications for modelling. The observed skewness and the design-induced links between DM and [T, P] justify a kernelised ε-SVR with appropriate regularisation rather than strictly parametric linear models [55]. While multicollinearity chiefly undermines coefficient interpretability in linear regression, its impact on SVR predictive performance is typically limited when inputs are properly scaled (range-normalised) and hyperparameters are tuned via resampling. Publishing correlation matrices and VIF values nonetheless increases transparency and aligns with best practice [56,57].

3.4. DA–SVR Model Performance

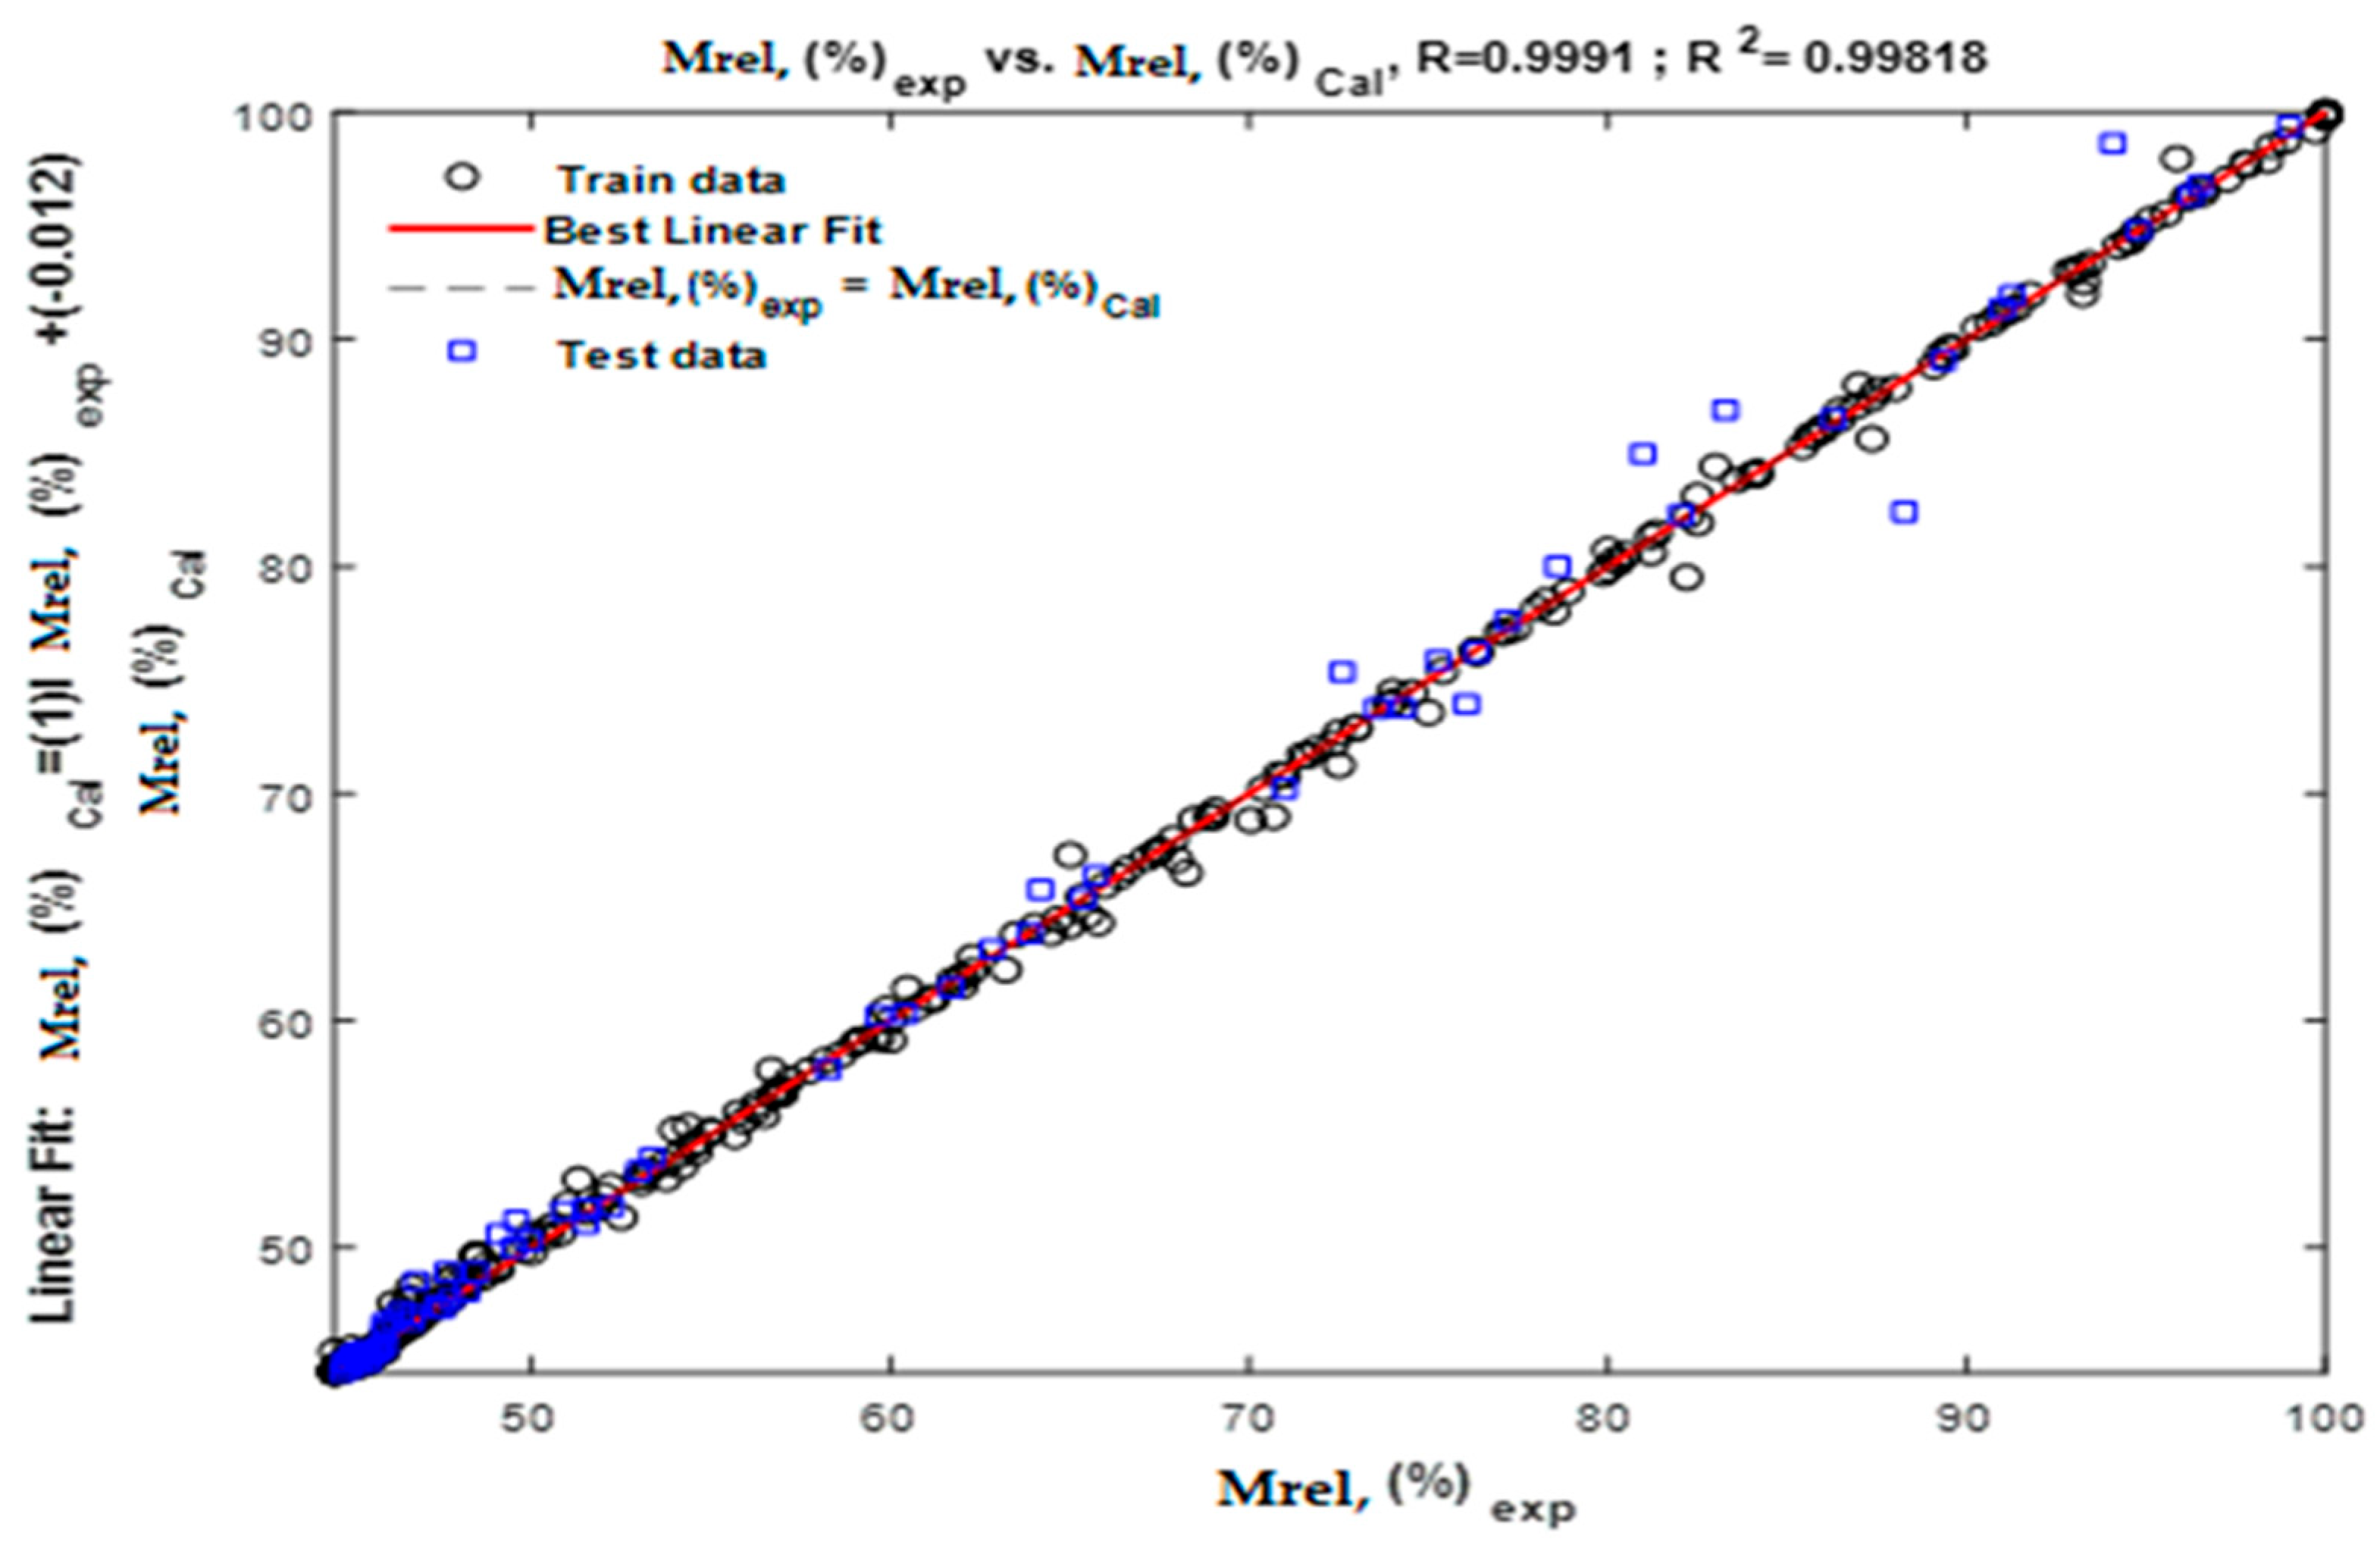
A Gaussian kernel ε-SVR optimised by the dragonfly algorithm (DA) was trained to predict normalised mass remaining (Mrel, %). The selected model used hyperparameters C = 46.8120, σ = 0.2655, and ε = 9.26 × 10⁻⁵ and retained 321 support vectors (Table 2). The predictive performance metrics for the DA–SVR model are presented in Table 3.
The choice of a Gaussian (RBF) kernel is appropriate for drying because the mapping captures nonlinear and interaction-rich responses without prespecifying basis functions [58]. In thin-layer drying, SVR models—particularly when tuned by metaheuristics, such as DA—have matched or surpassed semi-empirical equations, achieving very high R2 with small RMSE across MW and convective modes [46,58]. In sludge systems, recent studies emphasise stage-dependent kinetics and strong nonlinearity, reinforcing the value of kernelised predictors [8]. In the present work, the DA–SVR is trained on the same experimental matrix used to characterise drying kinetics and sanitary outcomes, so the surrogate model implicitly encodes the underlying physicochemical response of the sludge rather than functioning as a purely statistical black box.
Computationally, SVR prediction cost scales with the number of support vectors; with 321 support vectors, per-sample inference is heavier than for compact parametric models. Real-time deployment can be facilitated by (i) model compression (reduced-set approximations) or (ii) tuning a slightly larger ε to reduce the support vector count with minimal loss of accuracy, as commonly recommended for SVR [58]. For batch decision support (what-if setpoint exploration), the present DA–SVR is sufficiently efficient while offering strong held-out generalisation. Overall, the model provides a unified response surface across ambient, convective, and microwave schedules within the experimental operating window.
Overall, DA–SVR offers a flexible alternative to thin-layer empirical equations, particularly when responses deviate from simple exponential forms or when mode–intensity interactions are important, as is often the case in sludge drying [46,49,59]. From an applied chemistry perspective, such a data-driven surrogate can support rapid setpoint screening and hybrid schedule design without requiring a full mechanistic simulation for each candidate condition. This agreement between experimental and predicted values for the training and test sets is shown in Figure 10.

4. Discussion

This study interprets the drying kinetics, hygienisation indicators, and the DA–SVR surrogate in terms of practical conditioning windows for wastewater treatment plant (WWTP) sewage–sludge management and downstream energy/resource recovery. The thin-layer configuration isolates the effects of drying mode and intensity on moisture removal and indicator organisms, while the surrogate model provides a pragmatic decision support tool for screening candidate setpoints without exhaustive experimentation. Although continuous sample temperature during microwave exposure and ambient humidity during open-air runs were not recorded, the drying trajectories, time to constant mass metrics, and microbiological endpoints reported here are direct quantitative measurements obtained within a fixed geometry. For the same reason, specific energy consumption (SEC) is intentionally reported as a conservative upper-bound proxy based on nameplate power × time, suitable for early-stage comparison and prioritisation of conditions for later metered, system-level evaluation [2,12].

4.1. Energy Sustainability and a Minimum Viable Metering Upgrade

Energy use is decisive for the sustainability and economics of sludge drying. Under the present screening approach, SEC is estimated as an upper bound from nameplate power × time, which intentionally overestimates the true electrical energy delivered to the sludge in a low-load domestic cavity. Even within this conservative framing, higher MW power substantially shortens residence time (Figure 2, Figure 3 and Figure 4) and lowers the apparent SEC per kilogram of evaporated water, consistent with reduced warm-up overhead and faster traversal of the constant-rate stage [8]. To strengthen the sustainability analysis with minimal additional experimental burden, future work should implement plug-level power metering (true Wh) for each run and report kWh·kg−1 H2O removed using an explicit system boundary that includes standby losses, duty cycle behaviour, and ventilation/condensate handling. Metered SEC values would provide a more defensible basis for life-cycle and techno-economic screening, and for comparing electricity-driven MW finishing with lower-exergy pre-drying options such as waste heat, solar-assisted, or convective stages [2,12].

4.2. Circular Economy Endpoints and Deployment Pathways

The experimental endpoint used here (constant mass; ~55% wet mass loss for the investigated sludge) represents an upper-bound conditioning level that can substantially reduce transport and storage burdens while improving feed consistency for downstream conversion. In circular economy treatment trains, such conditioning can support (i) post-dewatering and/or post-digestion logistics (storage and transport) and hygienisation, (ii) thermochemical valorisation routes (co-combustion/incineration with energy recovery, pyrolysis, gasification, or MW-assisted conversion), and (iii) safer handling where hygienisation is required (Figure 5, Figure 6 and Figure 7) [10,17,21,24]. Because anaerobic digestion is generally performed on wet sludge, the present thin-layer drying results should not be read as an argument for pre-drying before digestion; rather, drying is framed here primarily as a downstream conditioning step for logistics and thermochemical energy recovery.
From a system perspective, drying should be evaluated together with downstream residue management. Conversion routes redistribute constituents into digestate, ash, or char streams; these may be candidates for nutrient recovery or materials use, subject to contaminant constraints and leachability. The pronounced time compression under MW thin-layer drying (Figure 2, Figure 3 and Figure 4) suggests that MW units may be most effective as modular, controllable finishing steps in hybrid configurations—preceded by low-exergy pre-drying and followed by energy recovery—thereby aligning throughput, hygienic quality, and energy demand [8,40,60].

4.3. Resilience and Operating Window Decision Support

Municipal sewage sludge is intrinsically variable across WWTPs; solids content, ash fraction, organic composition, rheology, and microbial loads can shift with season, industrial inputs, and upstream process changes. In addition, electricity price and carbon intensity can fluctuate over short timescales, which matters for electrically driven MW unit operations. The DA–SVR surrogate contributes to operational resilience by enabling rapid, constraint-based screening of setpoints (mode, intensity, time) that meet dryness and hygienisation targets while considering energy constraints, without requiring exhaustive experiments. Because model training and evaluation use grouped cross-validation by drying schedule, the approach reduces leakage from repeated measurements and supports robust interpolation within the tested operating window. As plant data accumulate (including metered energy and, where available, contaminant metrics), the surrogate can be re-trained to maintain performance under changing feed and operating contexts and to support adaptive hybrid strategies [18,41,46].
Emerging pollutants and broader chemical risk endpoints (e.g., pharmaceuticals, PFAS, metals) were not quantified in this study and are, therefore, outside the scope of the present operating window screening. Future work should couple drying window optimisation with targeted analytical monitoring (e.g., before/after drying and across downstream valorisation routes) to evaluate contaminant fate and ensure risk-based compliance for intended reuse pathways.

4.4. Footprint and Scaling Implications of Thin-Layer Drying

Thin-layer drying (≤5 mm) is intentionally mass transfer-intensive, but it scales directly with surface area. For wet sludge with a bulk density on the order of 1000 kg·m−3, the surface area A required to spread a wet mass mwet to thickness h can be approximated as A ≈ mwet/(ρ·h). At h = 5 mm, for example, 1 tonne of wet sludge corresponds to roughly 200 m2 of spread area, illustrating why static thin-layer configurations become space-intensive at the WWTP scale. Practical implementation would, therefore, rely on continuous belt dryers, multi-tray or multi-tier systems, or periodically mixed/turned beds to increase effective area per unit footprint. Because residence time decreases strongly with drying intensity (Figure 2, Figure 3 and Figure 4), MW-assisted finishing can reduce the required drying area for a given throughput; however, scale-up must still address vapour extraction, field uniformity, and safe control of aerosols and odours.

4.5. Volatile Carbon Retention and Implications for Energy Recovery

For thermal energy recovery, retaining volatile solids (VSs) and organic carbon matters because these parameters influence the lower heating value and the net energy yield. Drying is not chemically neutral; prolonged hot air exposure, especially at high temperatures and long residence times, can promote oxidation and volatilisation of organics and odorous compounds, whereas open-air drying may additionally permit biological degradation and carbon loss. The shorter MW schedules used here may reduce oxidative exposure, but local hot spots can still volatilise organics. Because batch-specific VSs, total organic carbon (TOC), fuel properties (e.g., LHV), and morphology were not measured in this campaign, volatile carbon losses across modes cannot be quantified directly. Future work should, therefore, measure VS/TOC/LHV before and after drying (and, where relevant, after downstream conversion) and incorporate carbon retention constraints into operating window screening when thermal valorisation is the objective.

4.6. Mechanistic Considerations for Microbial Inactivation

The sanitation improvements observed across modes are consistent with primarily thermal and dehydration-driven mechanisms. In convective drying, inactivation is governed by the cumulative time–temperature history (e.g., protein denaturation and membrane damage) and may be accelerated as water activity decreases during later drying stages. Open-air drying relies mainly on slow desiccation under variable ambient boundary conditions (temperature, humidity, and airflow), which can lead to variable inactivation. In microwave drying, volumetric dielectric heating can raise internal temperatures rapidly; inactivation is, therefore, expected to be dominated by thermal effects when sufficient temperatures are achieved, but spatial field non-uniformity can produce hot spots and cold spots within the thin layer. Because continuous sample temperature was not recorded during MW irradiation, this study reports MW sanitation outcomes against nominal power and exposure time rather than a temperature-based lethality metric; future work should log temperature profiles and map field uniformity to enable direct comparison using temperature-based doses.

5. Conclusions

This study benchmarked microwave (MW) thin-layer drying as a compact conditioning step for dewatered municipal sewage sludge by comparing open-air, convective (40–150 °C), and MW (70–1200 W) schedules to constant mass. High-power MW produced orders of magnitude reductions in drying time relative to open air and low-temperature convection while meeting the hygienisation indicators reported here (faecal indicators below detection at ≥100 °C or ≥300 W and ≈3–4 log10 reductions in mesophilic aerobes and sulfite-reducing Clostridium spp.). A dragonfly-optimised ε-SVR surrogate reproduced the normalised mass remaining trajectories with low error, enabling rapid exploration of operating windows under combined dryness and sanitation constraints.
Specific energy consumption was intentionally reported as a conservative upper-bound screening proxy based on nameplate power × time. As a minimum viable upgrade to strengthen sustainability assessment and improve comparability across technologies, future work should meter electricity input (true Wh) and report kWh·kg−1 H2O removed with explicit system boundaries, ideally in pilot-scale lines equipped with vapour/condensate handling and heat recovery. The DA–SVR framework is readily extensible to incorporate additional constraints relevant to circular economy endpoints—such as energy/carbon intensity signals, residue management targets, and targeted analytical monitoring of emerging pollutants—thereby supporting more resilient decision making for WWTP resource recovery schemes.

Author Contributions

Conceptualization, M.B.-F. and K.K.-W.; methodology, M.B.-F. and F.D.; software, M.B.-F. and M.H.; validation, M.B.-F., F.D., M.H., and K.K.-W.; formal analysis, M.B.-F., M.H., and K.K.-W.; investigation, M.B.-F. and K.K.-W.; resources, M.B.-F.; data curation, M.B.-F. and M.H.; writing—original draft preparation, M.B.-F. and K.K.-W.; writing—review and editing, M.B.-F., F.D., M.H., and K.K.-W.; visualization, M.B.-F.; supervision, M.B.-F., F.D., and K.K.-W.; project administration, K.K.-W.; funding acquisition, K.K.-W. All authors have read and agreed to the published version of the manuscript.

Funding

This research received no external funding.

Data Availability Statement

The raw data supporting the conclusions of this article will be made available by the authors upon request.

Conflicts of Interest

The authors declare no conflicts of interest.

Nomenclature

OAopen-air reference drying
CDconvective hot air drying
MWmicrowave drying
SECspecific energy consumption (screening proxy, nameplate power × time)
DRdrying rate
miinitial wet mass (g)
m(t)sample mass at time t (g)
mdryoven-dry mass at constant weight (105 ± 2 °C) (g)
Mrel(t)normalised mass remaining, m(t)/mi × 100 (%)
ML(t)time-dependent mass loss, 100 − Mrel(t) (%)
MLfinalfinal wet basis mass loss at constant weight, (mi − mdry)/mi × 100 (%)
Tdrying temperature (°C) for CD schedules
Pnominal microwave power (W) for MW schedules
ttime (min or s, as specified)
DMdrying mode (categorical variable; OA/CD/MW) (Table 1)
NDnot detected (below method-specific detection limit)

References

  1. Guo, H.; Teng, Z.; Han, H.; Li, T. Biohydrogen production from saline wastewater: An overview. Clean Energy Sci. Technol. 2024, 2, 210. [Google Scholar] [CrossRef]
  2. Reis, T.R.d.; Tolari, D.L.M.; da Silva, A.C.P.; Bonafé, E.G.; Samulewski, R.B.; Tessaro, A.L. Use of Domestic Polymeric Waste for Surfactant Removal from Wastewater. Sustain. Chem. 2025, 6, 6. [Google Scholar] [CrossRef]
  3. United Nations Environment Programme (UNEP). Wastewater—Turning Problem to Solution: A UNEP Rapid Response Assessment; United Nations Environment Programme: Nairobi, Kenya, 2023. [Google Scholar] [CrossRef]
  4. Zhang, X.; Wang, X.Q.; Wang, D.F. Immobilization of heavy metals in sewage sludge during land application process in China: A review. Sustainability 2017, 9, 2020. [Google Scholar] [CrossRef]
  5. Shaddel, S.; Bakhtiary-Davijany, H.; Kabbe, C.; Dadgar, F.; Østerhus, S.W. Sustainable sewage sludge management: From current practices to emerging nutrient recovery technologies. Sustainability 2019, 11, 3435. [Google Scholar] [CrossRef]
  6. Khanlari, A.; Doğuş-Tuncer, A.; Sözen, A.; Şirin, C.; Gungor, A. Energetic, environmental and economic analysis of drying municipal sewage sludge with a modified sustainable solar drying system. Sol. Energy 2020, 208, 787–799. [Google Scholar] [CrossRef]
  7. Omondi, E.A.; Aluda Kegode, A. Chemical pretreatment of lignocellulosic biomass in anaerobic digestion and biomethanation. Clean Energy Sci. Technol. 2023, 1, 70. [Google Scholar] [CrossRef]
  8. Wang, G.; Zhang, K.; Huang, B.; Zhang, K.; Chao, C. Microwave drying of sewage sludge: Process performance and energy consumption. Processes 2024, 12, 432. [Google Scholar] [CrossRef]
  9. Abubakar, R.A. Biogas production using conventional plastic water tank digester. Clean Energy Sci. Technol. 2025, 3, 269. [Google Scholar] [CrossRef]
  10. Pratap, V.; Kumar, S.; Yadav, B.R. Sewage sludge management and enhanced energy recovery using anaerobic digestion: An insight. Water Sci. Technol. 2024, 90, 696–720. [Google Scholar] [CrossRef]
  11. Ferrer, I.; Passos, F.; Romero, E.; Vázquez, F.; Font, X. Optimising sewage sludge anaerobic digestion for resource recovery in wastewater treatment plants. Renew. Energy 2024, 224, 120123. [Google Scholar] [CrossRef]
  12. Wink, K.; Hartmann, I. Recent Progress in Turning Waste into Catalysts for Green Syntheses. Sustain. Chem. 2024, 5, 27–39. [Google Scholar] [CrossRef]
  13. European Union. Directive (EU) 2018/850 of the European Parliament and of the Council of 30 May 2018 Amending Directive 1999/31/EC on the Landfill of Waste; Official Journal of the European Union: Luxembourg, 2018; Volume L150, pp. 100–108. [Google Scholar]
  14. United States Environmental Protection Agency (US EPA). Sewage Sludge Incineration Units (SSI): New Source Performance Standards (NSPS) and Emission Guidelines (EG)—40 CFR Part 60, Subparts LLLL and MMMM; US Environmental Protection Agency: Washington, DC, USA, 2011; Updated 2025.
  15. United States Environmental Protection Agency (US EPA). Sewage Sludge Incineration, Final Section—May 2023; US Environmental Protection Agency: Washington, DC, USA, 2023.
  16. Yu, S.; He, P.; Lü, F.; Zhang, H. Environmental impacts of sewage sludge incineration ash: Leaching characterization and scenario-based assessment. J. Environ. Chem. Eng. 2025, 13, 117056. [Google Scholar] [CrossRef]
  17. United States Environmental Protection Agency (US EPA). Biosolids Technology Fact Sheet: Heat Drying; EPA 832 F 06 029; US Environmental Protection Agency: Washington, DC, USA, 2006.
  18. Zhou, S.; Chen, C.; Li, R. Optimization of Fe(II)/SPC Sludge Conditioning and Dewatering Process Based on Response Surface Methodology: Full-Scale Application. Water 2023, 15, 3838. [Google Scholar] [CrossRef]
  19. Li, S.; Li, C.; Shao, Z. Microwave pyrolysis of sludge: A review. Sustain. Environ. Res. 2022, 32, 23. [Google Scholar] [CrossRef]
  20. Mawioo, P.M.; Garcia, H.A.; Hooijmans, C.M.; Velkushanova, K.; Simonič, M.; Mijatović, I.; Brdjanovic, D. A pilot scale microwave technology for sludge sanitization and drying. Sci. Total Environ. 2017, 601–602, 1437–1448. [Google Scholar] [CrossRef]
  21. Rao, B.; Wang, G.; Xu, P. Recent advances in sludge dewatering and drying technology. Dry. Technol. 2022, 40, 3049–3063. [Google Scholar] [CrossRef]
  22. ISO 5667-13:2011; Water Quality—Sampling—Part 13: Guidance on Sampling of Sludges. International Organization for Standardization (ISO): Geneva, Switzerland, 2011.
  23. Wang, H.L.; Yang, Z.H.; Huang, J.; Wang, L.-K.; Gou, C.-L.; Yan, J.-W.; Yang, J. The thin layer drying characteristics of sewage sludge by the appropriate foaming pretreatment. Water Sci. Technol. 2014, 69, 1859–1866. [Google Scholar] [CrossRef]
  24. American Public Health Association (APHA); American Water Works Association (AWWA); Water Environment Federation (WEF). Standard Methods for the Examination of Water and Wastewater, 23rd ed.; APHA: Washington, DC, USA, 2017. [Google Scholar]
  25. ISO 6887-1:2017/Amd 1:2024; Microbiology of the Food Chain—Preparation of Test Samples, Initial Suspension and Decimal Dilutions—Part 1: General Rules—Amendment 1. International Organization for Standardization (ISO): Geneva, Switzerland, 2024.
  26. ISO 11133:2014; Microbiology of Food, Animal Feed and Water—Preparation, Production, Storage and Performance Testing of Culture Media. International Organization for Standardization (ISO): Geneva, Switzerland, 2014.
  27. ISO 4833-1:2013/Amd 1:2022; Microbiology of the Food Chain—Horizontal Method for the Enumeration of Microorganisms—Part 1: Colony Count at 30 °C by the Pour Plate Technique—Amendment 1. International Organization for Standardization (ISO): Geneva, Switzerland, 2022.
  28. ISO 4833-2:2013; Microbiology of the Food Chain—Horizontal Method for the Enumeration of Microorganisms—Part 2: Colony Count at 30 °C by the Surface Plating Technique. International Organization for Standardization (ISO): Geneva, Switzerland, 2013.
  29. ISO 4831:2006; Microbiology of Food and Animal Feeding Stuffs—Horizontal Method for the Detection and Enumeration of Coliforms—Most Probable Number Technique. International Organization for Standardization (ISO): Geneva, Switzerland, 2006.
  30. ISO 7251:2005/Amd 1:2023; Microbiology of Food and Animal Feeding Stuffs—Horizontal Method for the Detection and Enumeration of Presumptive Escherichia coli—Most Probable Number Technique. Amendment 1: Inclusion of Performance Testing of Culture Media and Reagents. International Organization for Standardization (ISO): Geneva, Switzerland, 2023.
  31. ISO 9308-2:2012; Water Quality—Enumeration of Escherichia coli and Coliform Bacteria—Part 2: Most Probable Number Method. International Organization for Standardization (ISO): Geneva, Switzerland, 2012.
  32. ISO 15213-1:2023; Microbiology of the Food Chain—Horizontal Method for the Detection and Enumeration of Clostridium spp.—Part 1: Enumeration of Sulfite-Reducing Clostridium spp. by Colony-Count Technique. International Organization for Standardization (ISO): Geneva, Switzerland, 2023.
  33. NF V 08-061:2009; Microbiology of Food and Animal Feeding Stuffs—Anaerobic Enumeration of Sulfite-Reducing Bacteria by Colony-Count Technique at 46 °C. Association Française de Normalisation (AFNOR): Paris, France, 2009.
  34. ISO 6579-1:2017/Amd 1:2020; Microbiology of the Food Chain—Horizontal Method for the Detection, Enumeration and Serotyping of Salmonella—Part 1: Detection of Salmonella spp.—Amendment 1. International Organization for Standardization (ISO): Geneva, Switzerland, 2017.
  35. ISO 7218:2024; Microbiology of the Food Chain—General Requirements and Guidance for Microbiological Examinations. International Organization for Standardization (ISO): Geneva, Switzerland, 2024.
  36. Vapnik, V.N. The Nature of Statistical Learning Theory, 2nd ed.; Springer: New York, NY, USA, 2000. [Google Scholar] [CrossRef]
  37. Bafitlhile, T.M.; Li, Z. Applicability of ε-Support Vector Machine and Artificial Neural Network for Flood Forecasting in Humid, Semi-Humid and Semi-Arid Basins in China. Water 2019, 11, 85. [Google Scholar] [CrossRef]
  38. Platt, J. Sequential minimal optimization: A fast algorithm for training support vector machines. Adv. Kernel Methods-Support Vector Learn. 1998, 208. [Google Scholar]
  39. Mirjalili, S. Dragonfly algorithm: A new meta-heuristic optimization technique for solving single-objective, discrete, and multi-objective problems. Neural Comput. Appl. 2016, 27, 1053–1073. [Google Scholar] [CrossRef]
  40. Abdelkader, M.; Laidi, M.; Hanini, S.; Hentabli, M.; Amrane, A. A Grey Wolf Optimizer-based Fractional Calculus in Studies on Solar Drying. Kem. Ind. 2021, 70, 39–47. [Google Scholar] [CrossRef]
  41. Wang, D.; Xiang, J.; Yang, B.; Ye, Y.; Xiao, J.; He, D. Machine learning in sludge treatment: Applications, mechanisms, and prospects. J. Clean. Prod. 2025, 514, 145710. [Google Scholar] [CrossRef]
  42. Hentabli, M.; Belhadj, A.E.; Benimam, H.; Dahmoune, F.; Keskes, S. Vacuum drying of the terbinafine HCl powder: A kinetics study and mathematical modeling. Powder Technol. 2021, 383, 220–232. [Google Scholar] [CrossRef]
  43. Mesllem, Y.; Abdallah, A.E.H.; Laidi, M.; Hanini, S.; Hentabli, M. Artificial neural network modelling of multi-system dynamic adsorption of organic pollutants on activated carbon. Kem. Ind. 2021, 70, 1–12. [Google Scholar] [CrossRef]
  44. Liu, Z.; Lv, X.; Liu, K.; Shi, S. Study on SVM compared with other text classification methods. In Proceedings of the 2010 Second International Workshop on Education Technology and Computer Science (ETCS), Wuhan, China, 6–7 March 2010; pp. 219–222. [Google Scholar] [CrossRef]
  45. Keskes, S.; Hentabli, M.; Laidi, M.; Hanini, S. Modelling Drying Time of Candesartan Cilexetil Powder Using Computational Intelligence Technique. Kem. Ind./J. Chem. Chem. Eng. 2021, 70, 137–144. [Google Scholar] [CrossRef]
  46. Hadjout-Krimat, L.; Belbahi, A.; Dahmoune, F.; Hentabli, M.; Boudria, A.; Achat, S.; Remini, H.; Oukhmanou-Bensidhoum, S.; Spigno, G.; Madani, K. Study of microwave and convective drying kinetics of pea pods (Pisum sativum L.): A new modeling approach using support vector regression methods optimized by dragonfly algorithm techniques. J. Food Process Eng. 2023, 46, e14232. [Google Scholar] [CrossRef]
  47. Huang, Y.W.; Chen, M.Q. Thin-layer isothermal drying kinetics of municipal sewage sludge based on two falling rate stages during hot-air-forced convection. J. Therm. Anal. Calorim. 2017, 129, 567–575. [Google Scholar] [CrossRef]
  48. Mugodo, K.; Workneh, T.S. The kinetics of thin-layer drying and modelling for mango slices and the influence of differing hot-air drying methods on quality. Heliyon 2021, 7, e07182. [Google Scholar] [CrossRef]
  49. Guo, J.; Zheng, L.; Li, Z. Microwave drying behavior, energy consumption, and mathematical modeling of sewage sludge in a novel pilot-scale microwave drying system. Sci. Total Environ. 2021, 777, 146109. [Google Scholar] [CrossRef] [PubMed]
  50. Pino-Jelcic, S.A.; Hong, S.M.; Park, J.K. Enhanced anaerobic biodegradability and inactivation of fecal coliforms and Salmonella spp. in wastewater sludge by using microwaves. Water Environ. Res. 2006, 78, 209–216. [Google Scholar] [CrossRef] [PubMed]
  51. Tyagi, V.K.; Lo, S.L. Microwave irradiation: A sustainable way for sludge treatment and resource recovery. Renew. Sustain. Energy Rev. 2013, 18, 288–305. [Google Scholar] [CrossRef]
  52. Kocbek, E.; Garcia, H.A.; Hooijmans, C.M.; Mijatović, I.; Kržišnik, D.; Humar, M.; Brdjanovic, D. Effects of the sludge physical-chemical properties on its microwave drying performance. Sci. Total Environ. 2022, 828, 154142. [Google Scholar] [CrossRef] [PubMed]
  53. Mihelič, E.; Klinar, D.; Rižnar, K.; Oprčkal, P. Analyzing and modeling the municipal sewage sludge drying process using Python. Processes 2023, 11, 3263. [Google Scholar] [CrossRef]
  54. Scott, D.W. Multivariate Density Estimation: Theory, Practice, and Visualization, 2nd ed.; Wiley: Hoboken, NJ, USA, 2015. [Google Scholar] [CrossRef]
  55. James, G.; Witten, D.; Hastie, T.; Tibishirani, R. Support Vector Machines. In An Introduction to Statistical Learning: With Applications in R; Springer: New York, NY, USA, 2021; pp. 337–372. [Google Scholar] [CrossRef]
  56. Cawley, G.; Talbot, N. On Over-fitting in Model Selection and Subsequent Selection Bias in Performance Evaluation. J. Mach. Learn. Res. 2010, 11, 2079–2107. [Google Scholar]
  57. Harrell, F.E., Jr. Regression Modelling Strategies: With Applications to Linear Models, Logistic and Ordinal Regression, and Survival Analysis; Springer: Cham, Switzerland, 2015. [Google Scholar] [CrossRef]
  58. Smola, A.J.; Schölkopf, B. A tutorial on support vector regression. Stat. Comput. 2004, 14, 199–222. [Google Scholar] [CrossRef]
  59. Guo, H.; Tan, Z.; Li, H.; Long, Y.; Ji, A.; Liu, L. Dynamic characteristics analysis of metallurgical waste heat radiative drying of thin layers of sewage sludge. Processes 2023, 11, 2535. [Google Scholar] [CrossRef]
  60. Wulyapash, W.; Phongphiphat, A.; Towprayoon, S. Comparative study of hot air drying and microwave drying for dewatered sludge. Clean Technol. Environ. Policy 2022, 24, 423–436. [Google Scholar] [CrossRef]
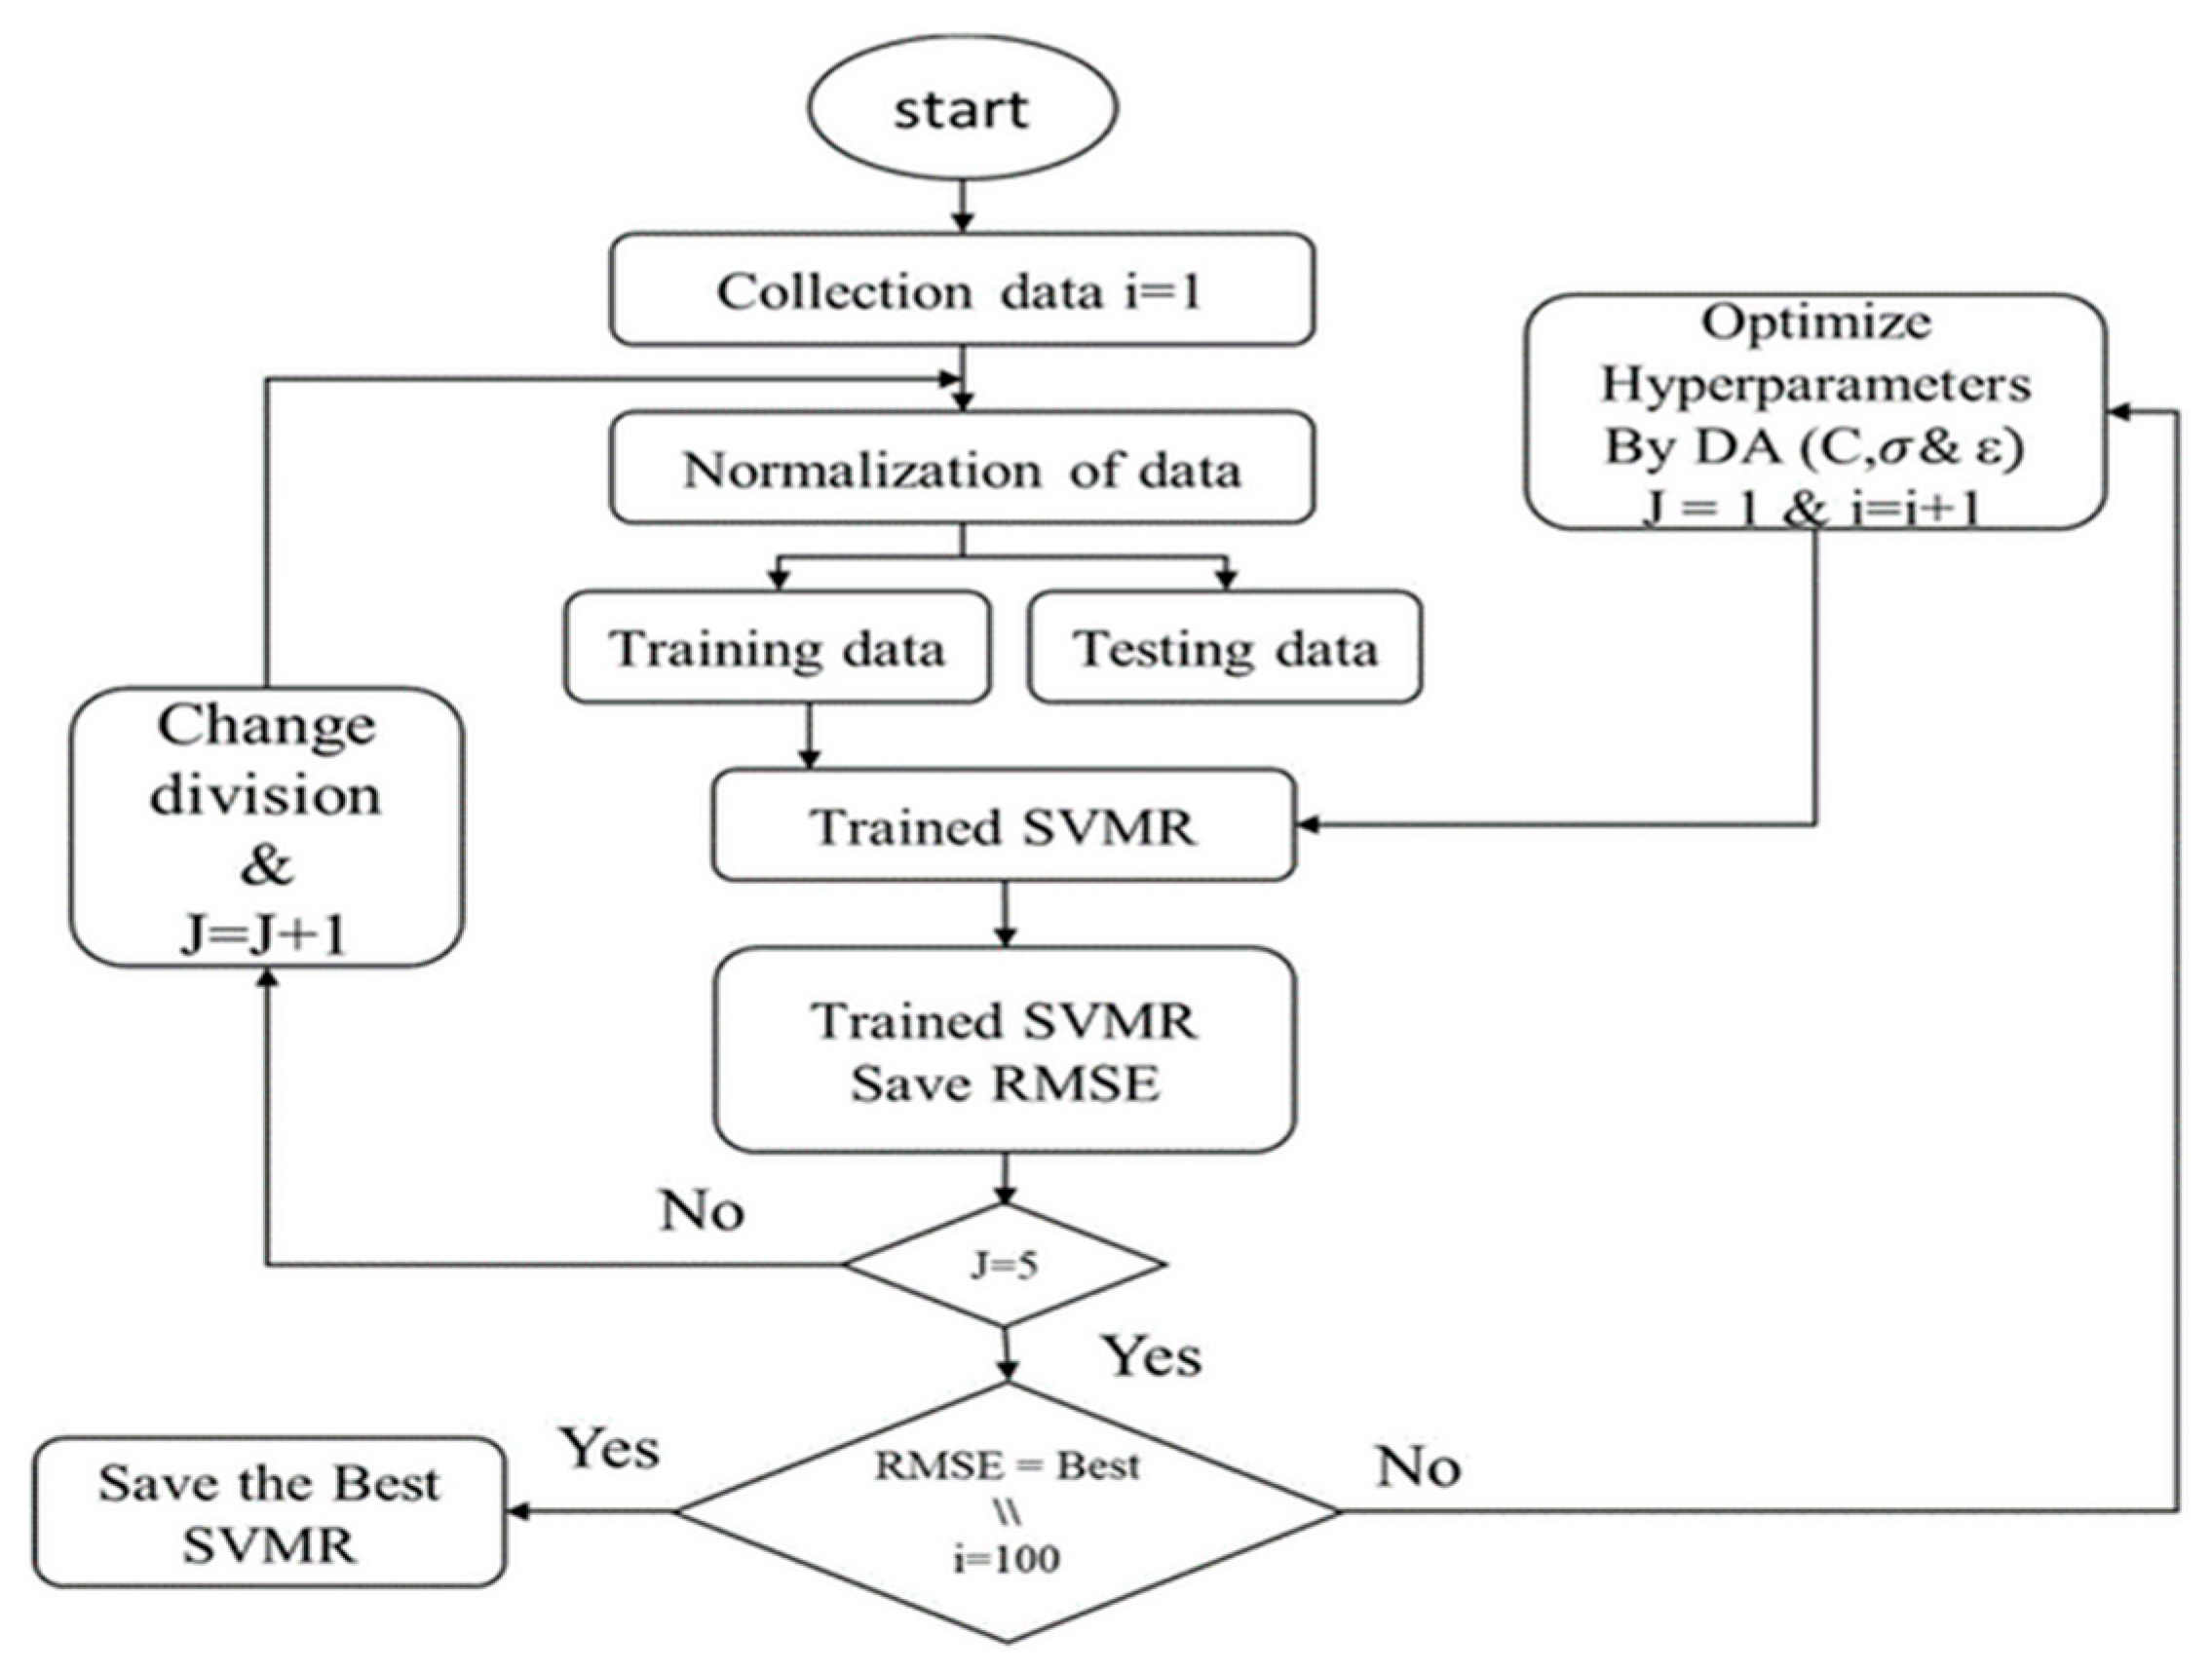
Figure 1. Workflow of the DA–SVR approach.
Water 18 00808 g001
Figure 2. Normalised mass remaining (wet basis; Mrel(t) = m(t)/mi × 100) as a function of time for microwave drying.
Water 18 00808 g002
Figure 3. Normalised mass remaining (wet basis; Mrel(t) = m(t)/mi × 100) as a function of time for convective oven drying. The terminal plateau corresponds to mdry/mi × 100 (≈44.5% for this sludge).
Water 18 00808 g003
Figure 4. Comparison of normalised mass remaining (wet basis; Mrel(t) = m(t)/mi × 100) over time for open-air drying, convective oven drying (40 °C), and microwave drying (70 W).
Water 18 00808 g004
Figure 5. Proportion of schedules with non-detect (ND) by indicator and heating mode.
Water 18 00808 g005
Figure 6. Aerobic and sulfite-reducing Clostridium spp. vs. oven temperature.
Water 18 00808 g006
Figure 7. Aerobic and sulfite-reducing Clostridium spp. vs. microwave power.
Water 18 00808 g007
Figure 8. Probability density of input parameters.
Water 18 00808 g008
Figure 9. Multicollinearity analyses of input parameters.
Water 18 00808 g009
Figure 10. Parity plot of experimental versus DA–SVR-predicted normalised mass remaining (Mrel, %) for training and test sets; the dashed line indicates the 1:1 relationship and the solid line shows the best linear fit.
Water 18 00808 g010
Table 1. Descriptive statistics of model inputs and output (normalised mass remaining).
TypeVariableAbbreviationUnitMin/MaxSDVarianceKurtosisSkewnessHarmonic Mean
InputDrying modeDM1.492.2233.7475.36380
TemperatureT°C015049.252425.82.62130.94650
PowerPW01200304.3092003.19941.30030
Timets0115,20020,4514.18 × 1088.53142.37290
OutputNormalised mass remainingMrel%44.510018.61346.282.04710.701257.90
Table 2. Optimised DA–SVR hyperparameters and dataset sizes.
CσεKernelnSVTraining Set (n)Test Set (n)Total (n)
46.81200.26559.26 × 10−5Gaussian (RBF)32132180401
Table 3. Predictive performance metrics for the DA–SVR model.
SubsetRMSE R2RbSlopeAARDMAPEMRPEMAESD
Train0.49990.99930.99960.23170.99660.47120.47123.49800.28230.7916
Test1.46850.99360.9971−1.12121.02211.38281.38286.76460.86042.4566
All0.79390.99820.9991−0.01171.00110.65310.65316.76460.39771.2692
Disclaimer/Publisher’s Note: The statements, opinions and data contained in all publications are solely those of the individual author(s) and contributor(s) and not of MDPI and/or the editor(s). MDPI and/or the editor(s) disclaim responsibility for any injury to people or property resulting from any ideas, methods, instructions or products referred to in the content.