Article

The Impact of Scientific Irrigation Scheduling on Water Use Efficiency, Energy Productivity and Economic Profitability: Analysis at the Farm Level in Tunisia


by
Hacib El Amami
1,*,
Alfonso Domínguez
2,
Charles Muanda
3,
Ángel Martínez-Romero
2,
José Antonio Martínez-López
2,
Nicolas R. Dalezios
4,
Nicholas Dercas
5,
Ioannis Faraslis
6,
Marios Spiliotopoulos
4,
Jean Robert Kompany
7,
Mariem Ben Sâada
1 and
Radhouan Nsiri
8
1
National Institute for Rural Engineering, Water and Forests, Carthage University, Ariana 2080, Tunisia
2
Regional Center of Water Research (CREA), University of Castilla—La Mancha, Campus Universitario, 02001 Albacete, Spain
3
Department of Hydraulic, National Institute of Buildings and Public Works, Ministry of Higher Education, Kinshasa B.P. 5429, Democratic Republic of the Congo
4
Department of Civil Engineering, University of Thessaly, 38221 Volos, Greece
5
Department of Natural Resources and Agricultural Engineering, Agricultural University of Athens, Iera Odos 75, 11855 Athens, Greece
6
Department of Environmental Sciences, University of Thessaly, 41500 Larisa, Greece
7
Department of Rural Engineering, National Institute of Agronomy, Tunis 1082, Tunisia
8
National Institute for Crops Fields, Ministry of Agriculture, Water Resources and Fisheries, Bousalem 8170, Tunisia
*
Author to whom correspondence should be addressed.
Water 2026, 18(6), 655; https://doi.org/10.3390/w18060655
Submission received: 23 December 2025 / Revised: 7 February 2026 / Accepted: 13 February 2026 / Published: 10 March 2026

Abstract

In water-limited areas, scientific irrigation scheduling is suggested as a valuable tool to optimize the amount and frequency of water required by crops. MOPECO, based on local data including soil texture, crop growth stages, climatic conditions, weather forecast and irrigation scheme characteristics, can be employed to define the optimal irrigation strategy. This tool was implemented within the SUPROMED project and tested in real farms managed by progressive farmers (leader farmers) who had been advised by the research team to monitor irrigation for seven major water-demanding crops (wheat, oat, onion, maize, olive, almond and pistachio). The obtained results were compared with conventional irrigation management as usually practiced by farmers (average farmers), based on their local experiences and knowledge, for the same crops growing in very similar conditions. Water use and energy efficiency use as well as irrigation cost and economic profitability were compared. The results showed that the advised irrigation scheduling provided an effective way to improve water and energy efficiency and increase yields and economic profitability with respect to current farm management. On average, the scientific method (MOPECO) reduced water consumption and energy use by 25.5% and 22%, respectively, achieving a 29% increase in yield and a reduction of 18% in water irrigation cost. The gross margin per hectare was also higher, increasing by 26%. The results also showed that, under advised management, the farmers’ income became more resilient to market price variability, allowing the farmers to have better economic viability. Based on these results, our study suggested that the adaptation of scientific models such as MOPECO to farmers’ requirements and their implementation through training activities could provide end users with a significant opportunity to improve the agronomic and economic efficiency of water and energy in arid regions.

1. Introduction

In the central and southern parts of Tunisia, where surface water is both scarce and unreliable, groundwater is the only source of irrigation. Over the last 40 years, favorable marketing opportunities for various crops and the heavily subsidized availability of water-pumping technology launched in these regions have led to very intensive groundwater withdrawal, involving the tapping of reserves that could not be reached with older technologies. Current estimates show that 100,000 wells were installed, and about 50 percent of the agricultural area (430,000 ha) is being irrigated by using groundwater. Consequently, this resource has transformed rural economies, improving crop productivity and the incomes of irrigated farms. This can therefore be considered an example of the success of agricultural policies in these regions.
However, such rapid growth has caused environmental implications that are mainly related to the sustainability of local aquifers since piezometric levels are falling quickly at a rate of 1–2 m per year [1]. In this context, to enable the use of groundwater by future generations and maintain the positive economic impact in the area, it is necessary to improve the management of water by using innovative techniques [2,3]. Conventional management applies irrigation water without considering the soil characteristics and the variations in weather conditions that may affect crop evapotranspiration [4]. Indeed, the majority of farmers rely on calendar-based methods and/or visual symptoms for irrigation [5]. This usually results in either under-irrigation or over-irrigation, both of which may cause significant yield losses [6]. Over-irrigation decreases water use efficiency due to deep percolation, waterlogging and runoff. It also leads to an increase in the use of energy for pumping, which indirectly decreases the grower’s profit, while inadequate irrigation may lead to plant stress and a consequent reduction in the yield and even in the quality of the crop at harvest. Therefore, adopting proper irrigation management should eliminate or at least mitigate the negative impact of over- or under-irrigation and provide a better balance between the crop’s water requirement and available water.
In this sense, the use of scientifically validated and contrasted techniques for irrigation scheduling based on soil characteristics, crop properties and weather conditions is widely suggested as a valuable approach to increase crop yields and decrease costs while contributing to saving water and improving energy use [7,8]. Improving water use efficiency (WUE) has therefore become an important strategy in dealing with drought in zones with limited water resources, where modern technologies and innovative management can help to achieve this objective [9,10]. In this regard, Karasekreter et al. [11] demonstrated energy and water savings up to 23.9% and 20.5%, respectively, by implementing a smart irrigation management system in Antalya (Turkey). Zhou et al. [12] demonstrated 35% savings of irrigation water by using soil moisture sensors under micro-irrigation conditions. In addition, a positive impact on crop growth and quality was noted by Nam et al. [13] as a result of maintaining the root-zone moisture at a certain level using soil moisture sensors. In Austria, empirical studies revealed that the adoption of smart irrigation technologies resulted in up to 38% water savings over conventional irrigation [14]. In Tunisia, soil moisture sensor controllers, evapotranspiration controllers and rain sensors allowed for water savings of 20–92% while maintaining crop growth and quality [15].
Scientific irrigation management can be classified as weather-based and soil-based. Weather-based irrigation management uses local climatic data (temperature, wind, insolation, etc.) to determine the crop water requirements, which implies gaining access to the data generated by a local weather station and having specific knowledge of converting the climatic data into crop evapotranspiration [16]. Soil-based irrigation uses soil moisture data gathered by sensors attached to the ground to make decisions regarding irrigation.
Soil moisture sensors estimate the soil volumetric water content, which represents the portion of the total volume of soil occupied by water. The appropriate threshold values for maintaining crops under well-watered conditions depend on soil and vegetation type, and maximum depletion usually ranges from about 10 percent to 40 percent [17]. Sensors are widely used in monitoring crop water status to determine the irrigation timing and amount.
Compared to conventional irrigation management, the use of soil moisture sensors has led to water savings ranging between 72 percent and 34 percent [18,19,20]. Ref. [21] revealed that the use of soil sensors to schedule irrigation in corn fields resulted in 26% less irrigation water being applied compared to conventional uniform irrigation. However, due to field variability and lack of irrigation uniformity, the information relative to soil moisture gathered from sensors is very site-specific. Farmers should therefore select locations that are representative of the field when installing sensors. Although sensors can help farmers to monitor moisture, their use has remained somewhat limited. The most recent survey conducted by the U.S. Department of Agriculture shows that across the U.S., soil moisture sensors are utilized in only 12% of farms [22]. This may be because their implantation is still expensive and difficult to manage, particularly for small farmers.
To address this situation, several Decision Support Systems for Irrigation Scheduling (DSSISs) have been developed and used in the agriculture sector to schedule irrigation and improve water use efficiency [23,24]. These systems rely on information including weather, crop type, soil water status, irrigation method and application efficiency [25,26]. The use of DSSISs to schedule irrigation can increase irrigation efficiency as they provide farmers with information about when and how much to irrigate. They provide an irrigation schedule not only for the current day but also for forecasting irrigation events for future days. However, most of these models generated by researchers require many input variables and parameter values that are not easily available to end users and involve advanced levels of training [27]. Dealing with these variables is arguably the main handicap when transferring a research model to end users because they may initially feel overwhelmed [28]. In this sense, the lack of knowledge of farmers about how to manage models as well as determine the value of many parameters required by the models is one of the main problems to be solved when these kinds of tools are planned to be introduced to the productive sector. Other handicaps to be solved include encouraging end users to trust the results offered by the model and apply its recommendations to farms.
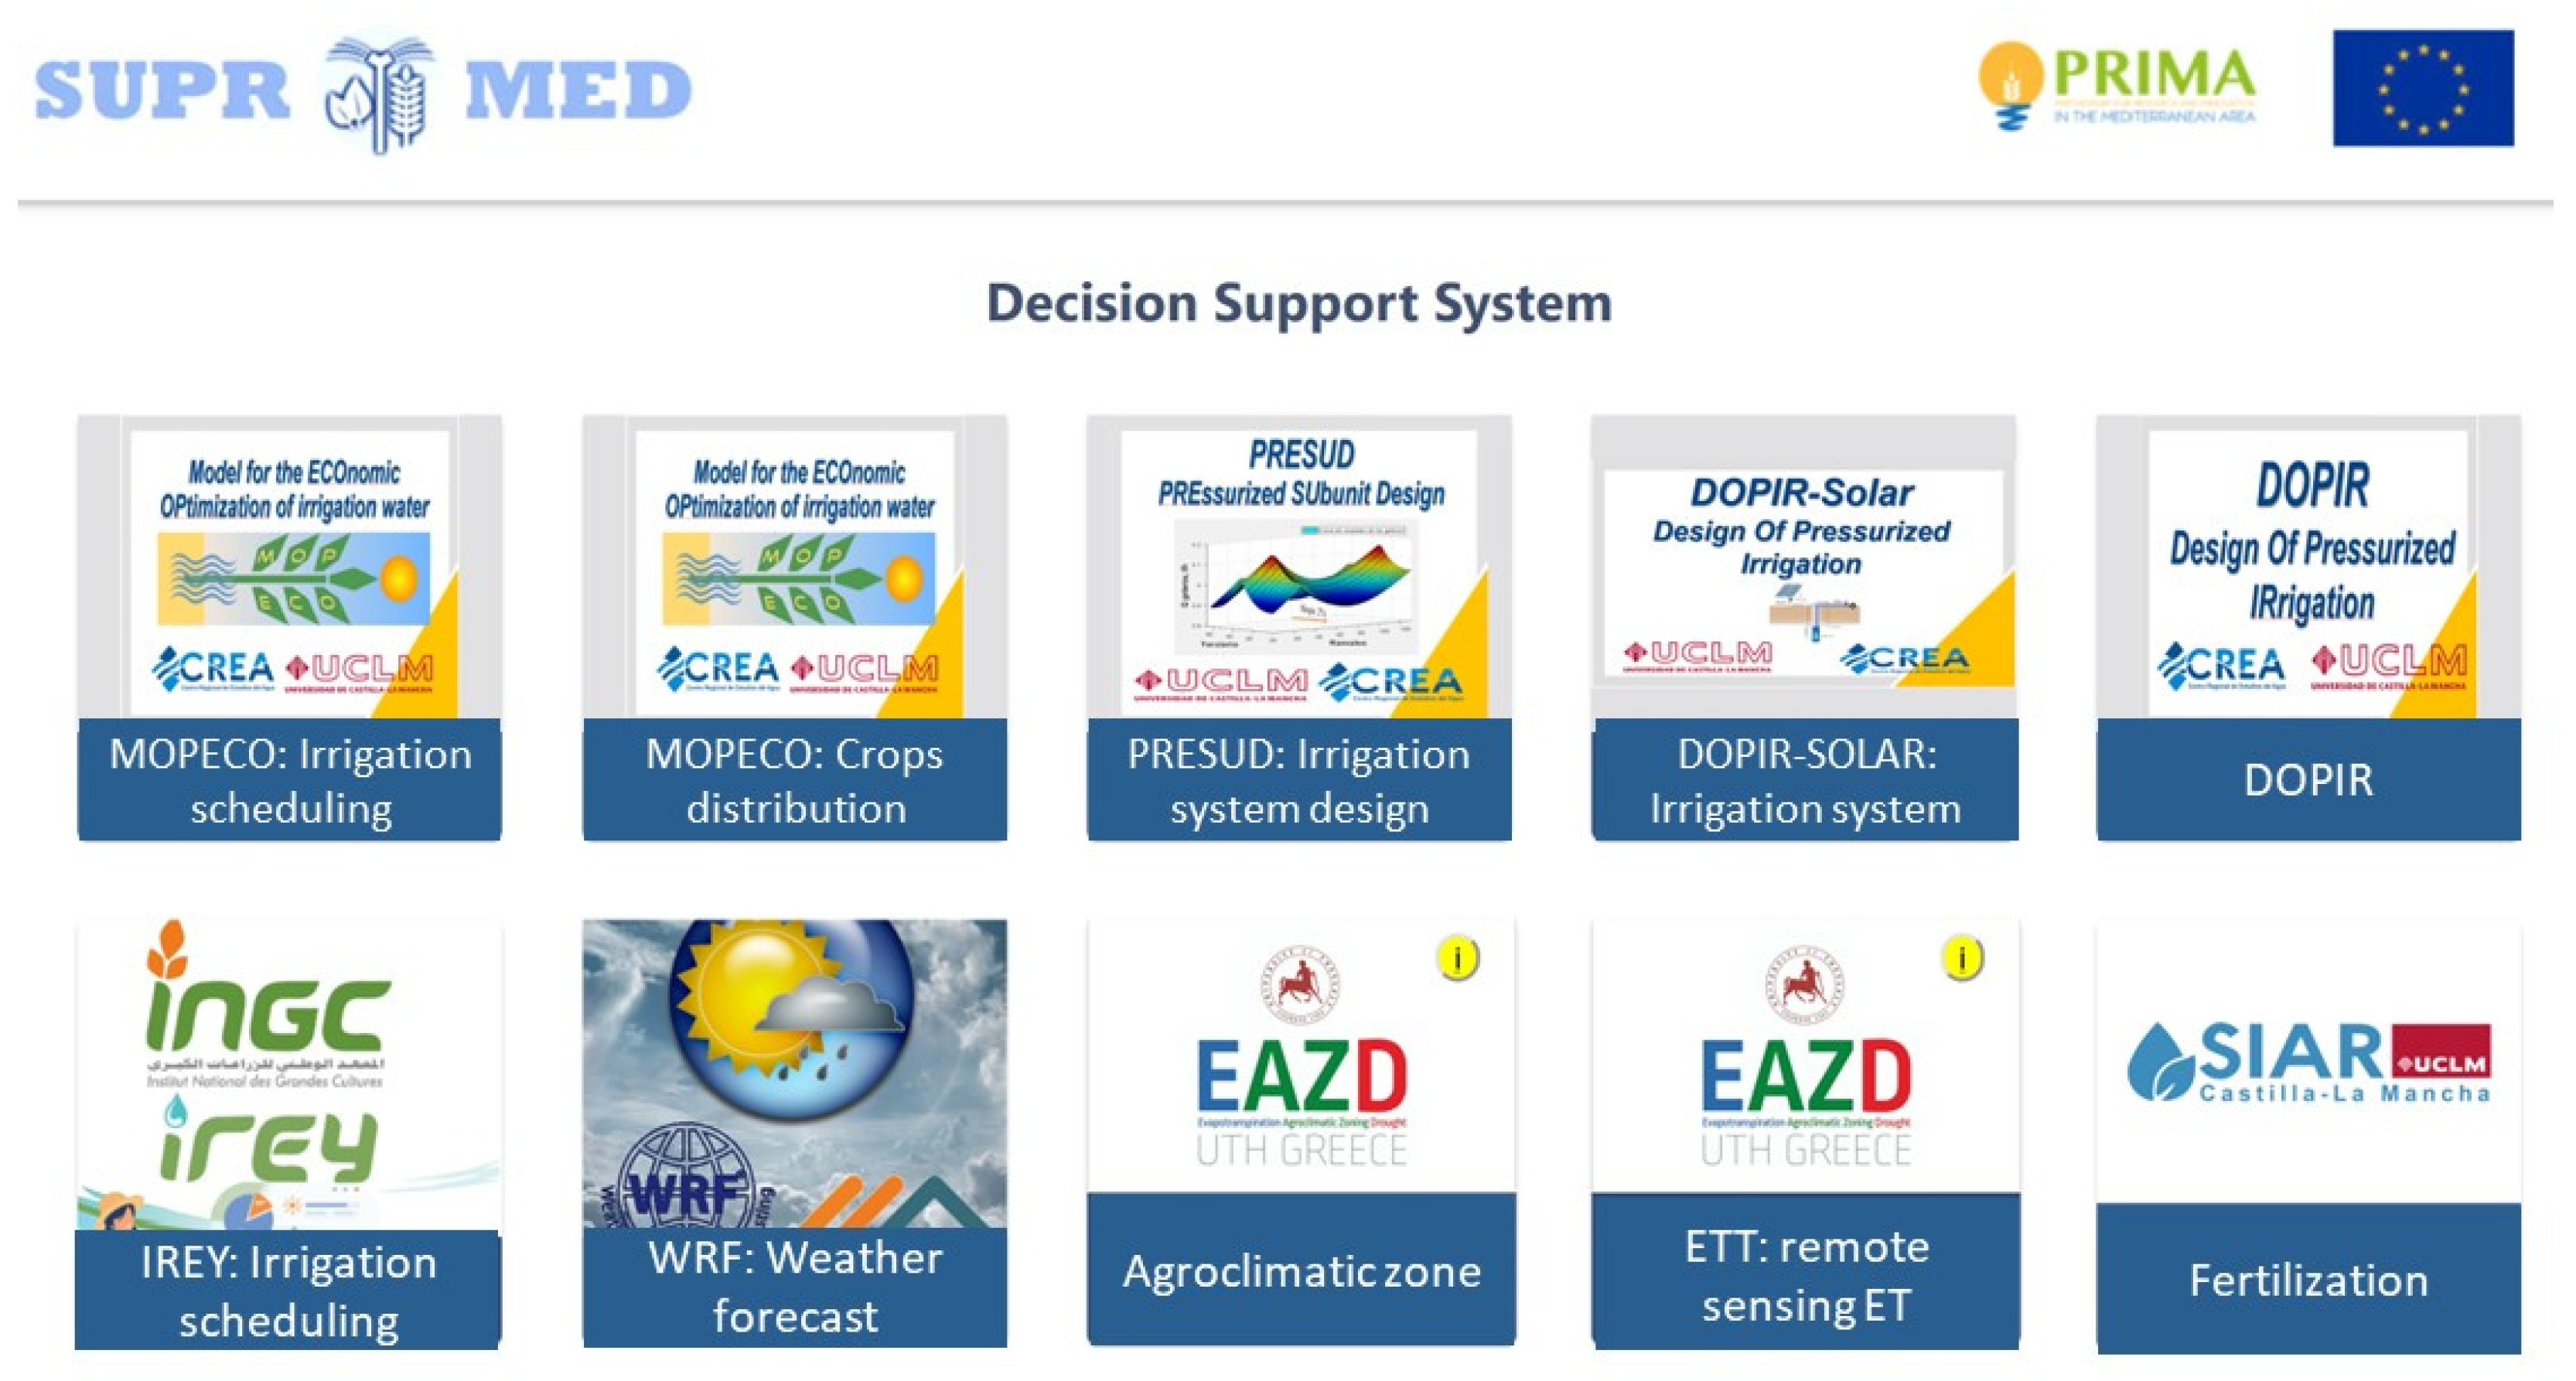
The SUPROMED project (Sustainable Production in Water-Limited Environments of Mediterranean Agro-Ecosystems) involved ten partners from five different nations (Spain, France, Greece, Lebanon and Tunisia) for three years (2019–2022) developing an online end-user platform composed of several models and tools (irrigation scheduling, optimal crop distribution at farm level, agroclimatic classification, fertilization, design of irrigation systems and remote sensing for crop monitoring) to improve the economic and environmental sustainability of Mediterranean agricultural systems. This project was funded by the PRIMA foundation, and one of the models included in the platform was MOPECO (Model for the Economic Optimization of Irrigation Water at Farm Level) [29]. The objective was to generate and validate a simplified version of the irrigation scheduling module of MOPECO (MOPECO: Irrigation scheduling) (Figure 1) that was also adapted to the requirements of farmers and technicians. MOPECO determines irrigation events for the current day as well as forecast irrigation for the future by using the weather information for the next 7 days and the rest of the growing season by using the typical meteorological year methodology. This model has been previously calibrated and validated for several crops in Spain [30,31,32,33,34,35] and other parts of the world [36,37,38].
From an economic point of view, the decision by farmers to use DSSIS models to plan irrigation may be interpreted as dependent upon agronomic and economic performance, i.e., the expected increased benefits against investment costs [39]. Most farmers would decide to adopt new management practices if they expected to increase both yields and profitability. However, there are a few studies in Tunisia that have looked into the economic benefits of carrying out proper irrigation scheduling by using DSSISs and/or scientific equipment (i.e., soil moisture sensors) instead of traditional management.
The main objective of this study was to compare the scientific irrigation management proposed by the SUPROMED project and included in the end-user platform with the conventional irrigation method used by farmers. The comparison was carried out in terms of agronomic, economic and energy differences between the two methods of water irrigation management. Particular attention was given to the impact on saving water and energy and reducing farming cost, as well as the impact on the economic profitability of crops.

2. Materials and Methods

2.1. Experimental Plots and Farms Selection

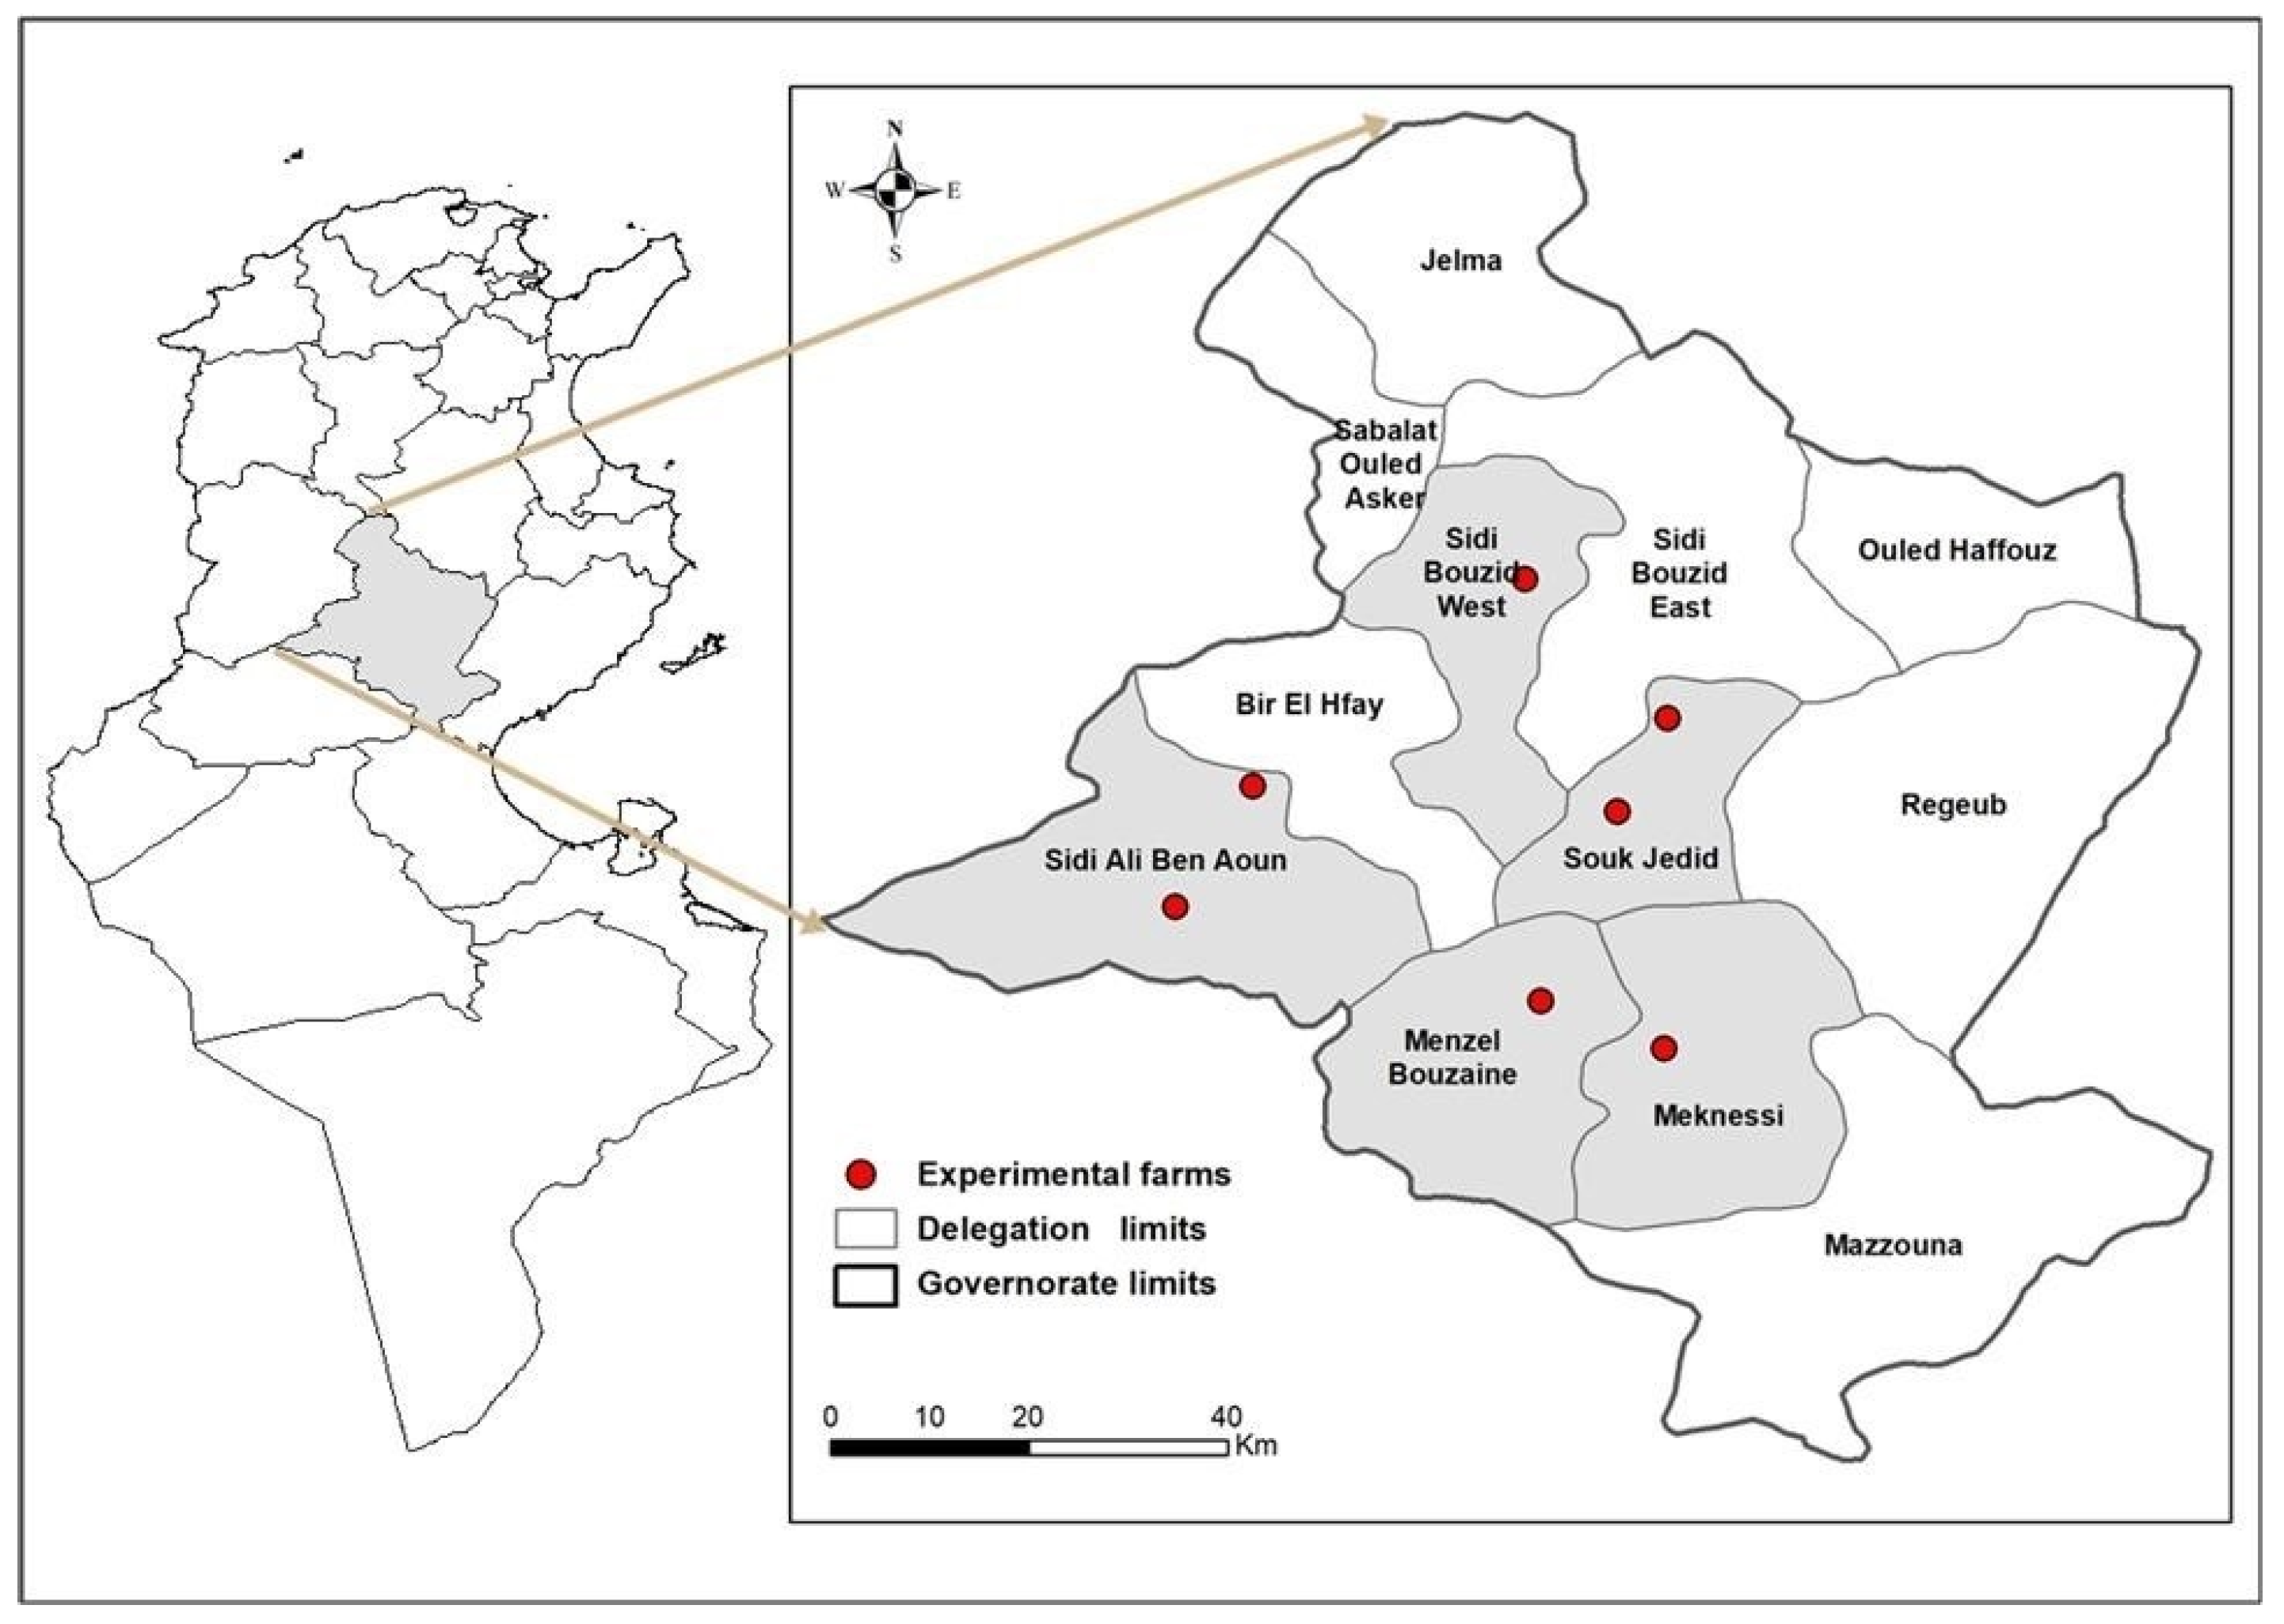
The demo site was located in Sidi Bouzid Governorate in the center of Tunisia (Figure 2). The irrigated area covers more than 62,000 ha, where 89% (55,000 ha) of the land belongs to private farmers, while the rest (7000 ha) is managed by the government through public irrigation schemes [40]. This region is classified as arid, with an average annual precipitation of 250 mm [41,42]. The main growing crops in the region are vegetables, fodder and cereals [43,44,45]. Tree crops include olive, pistachio, almond and citrus on limited surfaces [46].
Due to the aridity of the climate and rainfall stochasticity, the agriculture of the region is primarily based on intensive irrigation by using groundwater, which is the only source of irrigation in the region as surface water is scarce and random. The rapid development of irrigated areas has introduced the challenge of groundwater sustainability, as this resource is overexploited (15%) and falling quickly at a rate of 1–2 m per year [42,46,47]. Consequently, water pumping costs have increased, and the economic viability of irrigated agriculture is threatened [48]. In this context, the use of water for agricultural production requires innovative and sustainable practices to increase its efficiency as well as crop productivity and economic farm profitability.
The SUPROMED project proposed a set of experiments to compare innovative irrigation scheduling with the prevailing irrigation practices in the region. The shaded areas in Figure 2 represent the geographic distribution of farms within the Governorate, where the experimental plots are located and farmer’s monitoring was carried out. For this purpose, two groups of farms with similar characteristics were identified; both of which were growing the same crops and using the same irrigation technologies. The first group (GI) of farms belonged to “leader farmers”, in other words, those that were managed by well-trained and high-producing farmers in the area. The irrigation of each monitored crop in GI farms was scheduled through the advice provided by MOPECO, which was based on local data (climatic data, soil type, crops Kc, phenological stages, irrigation system, etc.). In parallel, soil water sensors, flowmeters and pressure transducers were installed in these demonstrative plots to validate the irrigation scheduling provided by MOPECO. We targeted the “leader farmers” to test and validate MOPECO for each crop because these farmers are innovative, possess high technical skills and management, and act as key community contact points for testing new practices, making them ideal for adopting, validating and disseminating new approach of irrigation scheduling.
The second group (GII) of farms belonged to “average farmers”, which were selected among other farms located in the same area (neighboring leader farmers). Average farmers often have limited access to tailored training and possess low technical skills. However, they are open to adopting any technologies if their benefit is proven and they assist them in increasing their income and yields. The training level and the method of managing crops of this group were considered as representative of the rest of farmers in the region. This group did not receive advice about water irrigation management. They were left to perform the prevailing type of water management in this area. However, they participated in the training sessions organized by the project team as well as in the various field days. The monitoring of these farms was similar to that carried out in the “leader farms”.
Two methods of water irrigation management were compared. The first one was considered innovative and incorporated advanced instruments (such as local weather stations, soil moisture sensors and agronomic models) to estimate and forecast crop water requirements during the irrigation season. The second, which followed a “prevailing irrigation method”, was considered the benchmark strategy adopted by farmers, whereby irrigation was performed by relying on the conditions of crops or the feel of soil, sometimes with recourse to additional information such as rainfall forecasting provided by regional meteorological stations.
During the three years of the project, 7 different crops (annual crops and fruit trees) cultivated in 27 plots located in 27 different farms were monitored weekly. The monitored crops, representing the major crops grown in the region, included wheat, oat and onion for annual crops and almond, olive and pistachio for fruit trees. Although it is not a main cultivated crop, maize was also monitored for one year 2020–2021.

2.2. Description of MOPECO

MOPECO, developed by the University of Castilla La Mancha (Spain), is a decision-making tool for selecting the optimal crop pattern that maximizes the gross margin of an irrigation farm through the efficient use of irrigation water and available irrigable land. It assumes that the highest economic return often comes from irrigation depths that are lower than those needed for maximum physical yield. The model is optimized for the management of irrigated areas with water supply scarcity, allowing for deficit irrigation strategies to maximize water productivity. MOPECO assumes known market prices for crops and water to optimize the total gross margin, typically finding that the optimal economic strategy uses less water than maximum production. This model is a useful tool. A set of data is required for the simulation of the optimal water use and yield. Daily actual evapotranspiration ETa is derived using the equation proposed in [16], which calls for a daily soil water balance, whereas daily maximum evapotranspiration ETm is produced by multiplying daily crop coefficient (Kc) by daily reference evapotranspiration (ETo) [49]. The length of the different crop growth stages is required for the simulation of crop growth cycle in terms of Cumulative Growing Degree Days (CGDDs) calculated according to [50]. The phenological scale used is the Biologische Bundesanstalt, Bundessortenamt und CHemische Industrie (BBCH) [51], which assigns a number to each stage. Further data were also required: texture and soil depth, uniformity coefficient of irrigation, the maximum available volume for irrigation, etc. MOPECO can be employed to predict irrigation events for the current day as well as forecast irrigation for the future by using the weather information for the next 7 days and the typical meteorological year to estimate the irrigation requirements for the rest of the growing period [33].
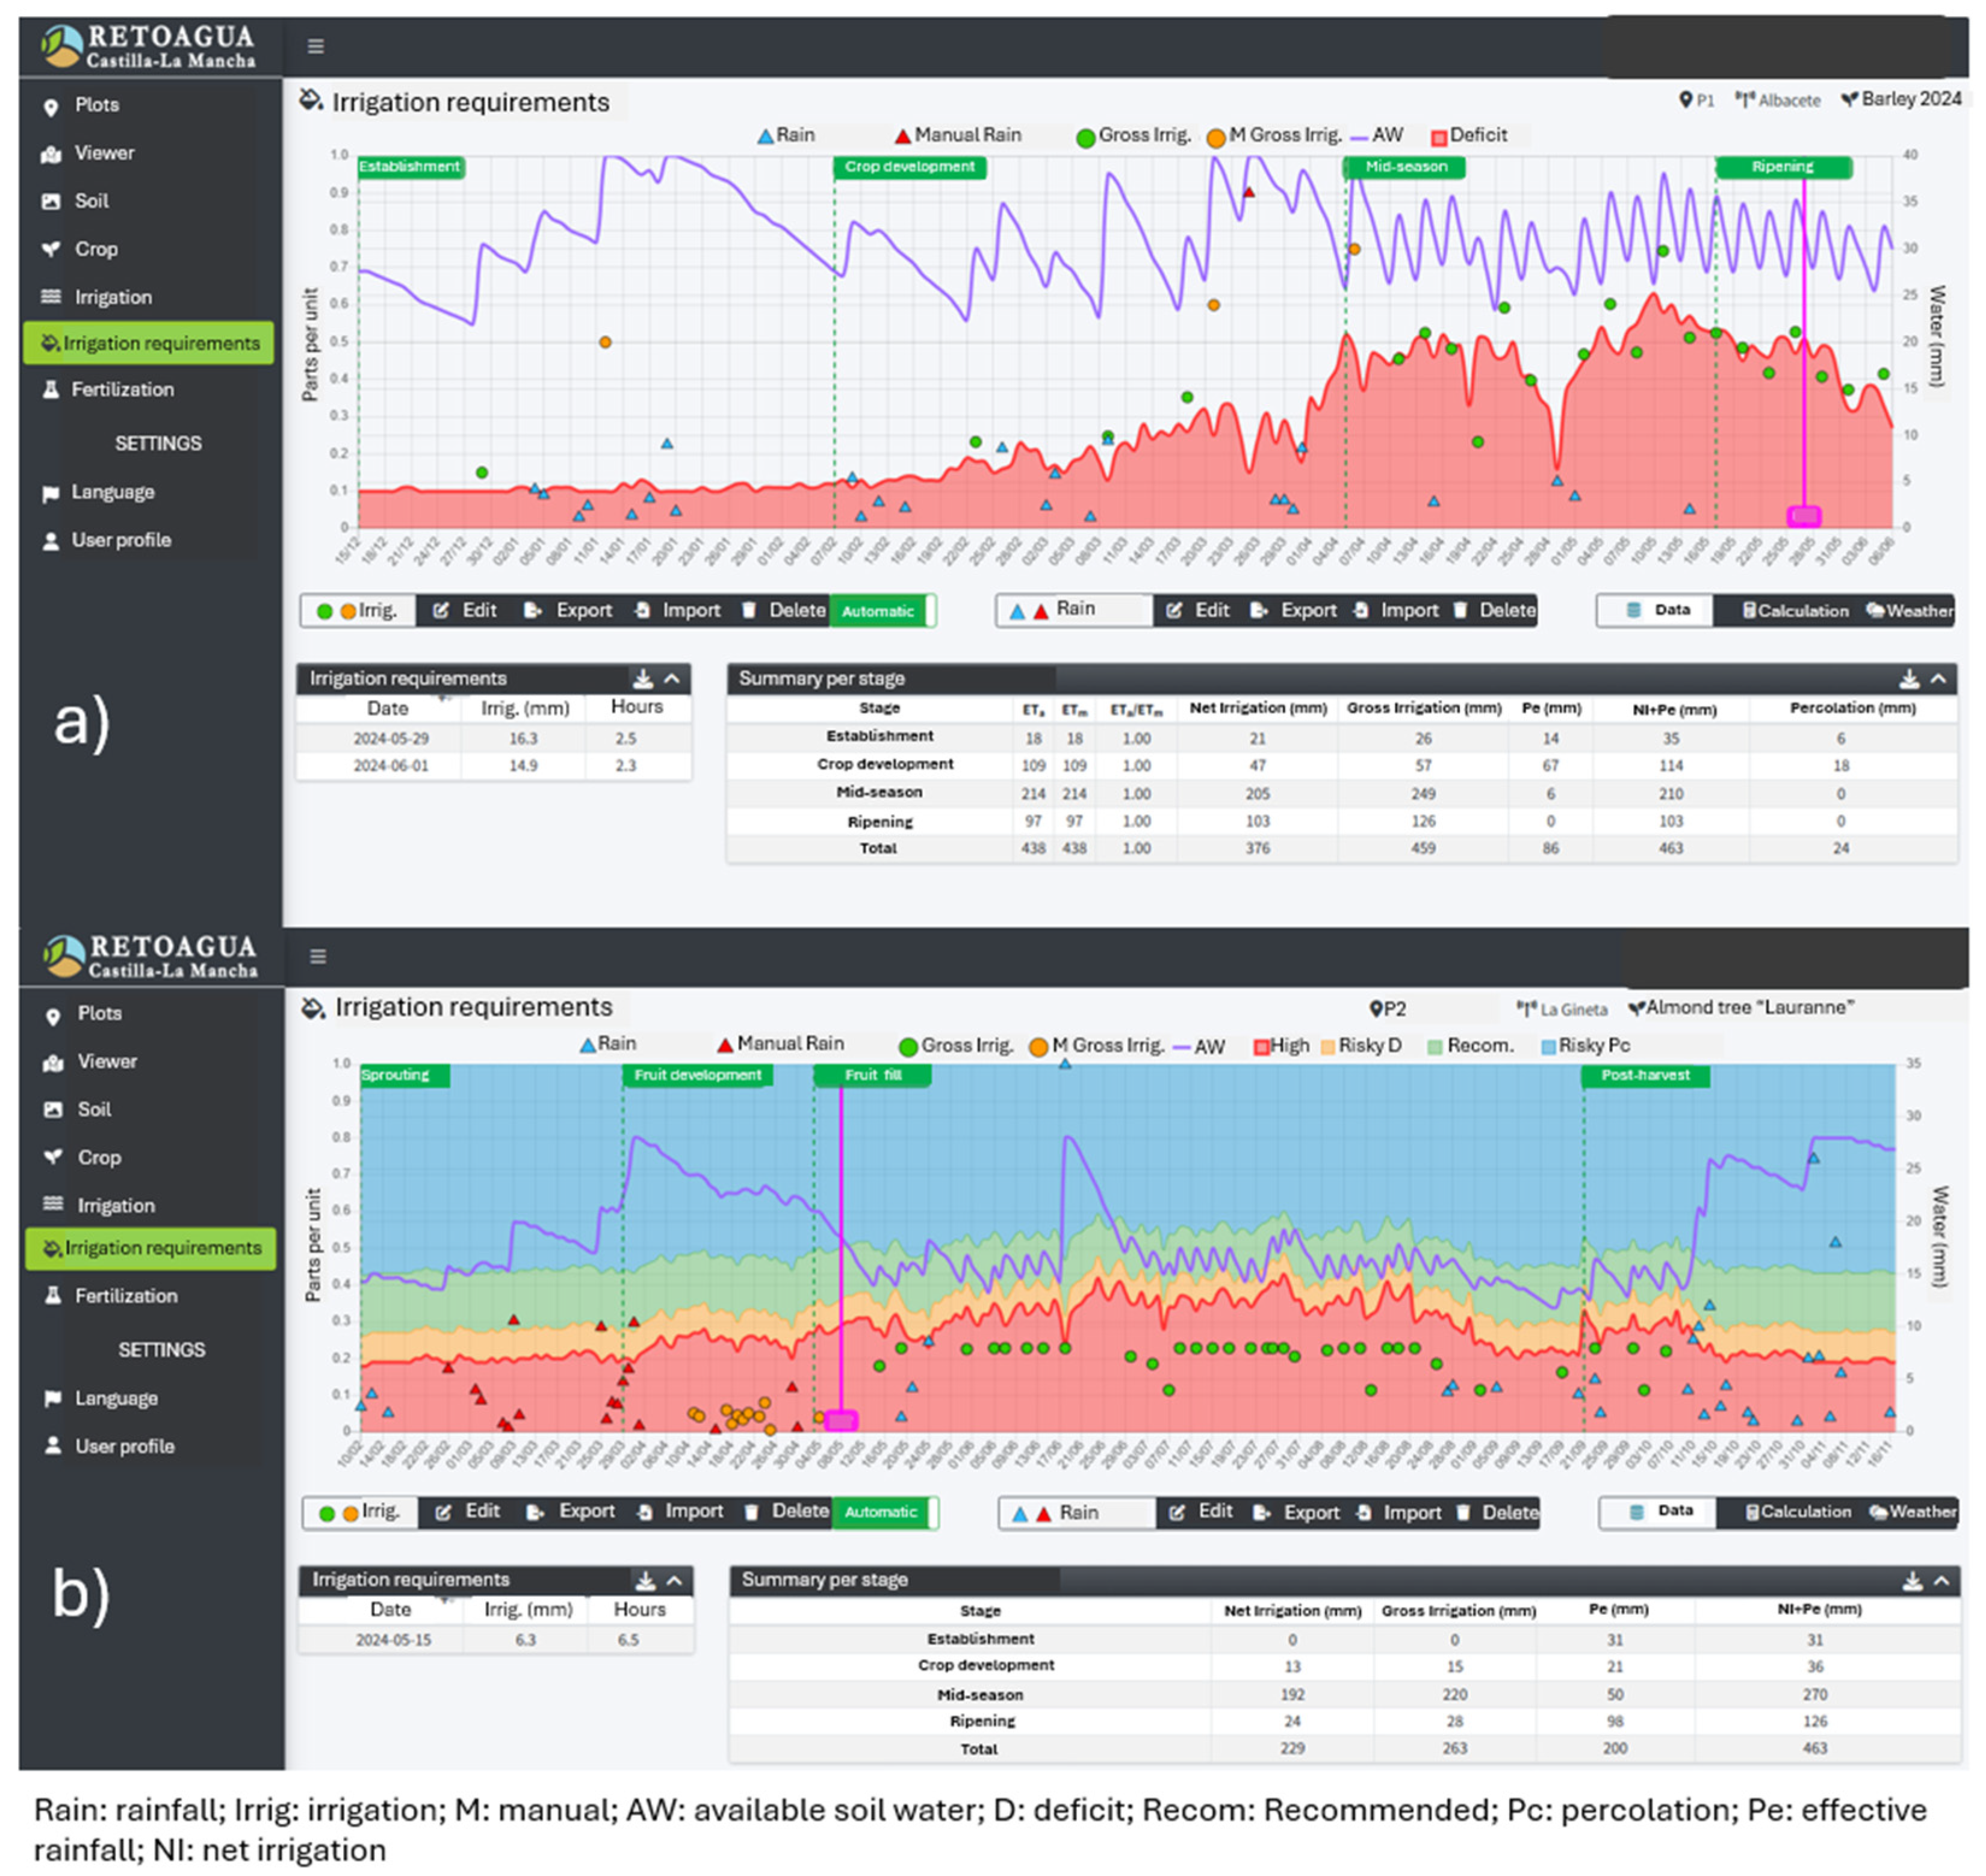
The simplified version of this model that was adapted to farmers and technicians during the SUPROMED project [28] was used for determining the irrigation scheduling in the “leader farms” and for simulating the soil moisture progression in the “average farms”. An improved version of this model, called RETOAGUA, is currently being implemented in Castilla-La Mancha region (https://retoagua.uclm.es, accessed on 1 March 2022) (Spain) following the positive results obtained during SUPROMED. This tool determines well-watered irrigation schedules for annual crops (Figure 3a) and deficit irrigation schedules based on the availability of irrigation water on the farm for tree crops and vineyards (Figure 3b). In the first case, the model determines the irrigation scheduling that maintains the available water (purple line) over the maximum allowable depletion level (1-p; red line) for the next seven days to avoid water stress conditions caused by water deficit. In the second case, the model tries to maintain the available water line inside of the green area, which means the crops are suffering a suitable level of deficit for the amount of irrigation water available for the whole growing period. The green area varies depending on the amount of water available at the beginning of the irrigation season. Irrigation events are represented by circles and rainfall by triangles.
The version used during SUPROMED was very similar (MOPECO irrigation scheduling, Figure 3), but it was available only in the three experimental areas and for a restricted number of farmers and technicians. This tool can be adapted to any irrigable area in the world if climatic data are available and a solvent institution provides the necessary parameters for simulating the irrigation requirements of the crops [28].

2.3. Data Collection and Analysis

Detailed information was collected on water use for each monitored plot by installing water meters for monitoring the entire season in such a way as to obtain the precise number of irrigation events and the amount of water applied at each one of them. Previously, the irrigation systems were evaluated to determine the real amount of water discharged by the system and the uniformity of the irrigation. In addition to irrigation, detailed information related to soil properties (analysis at laboratory) and all inputs used from soil preparation to harvesting was collected as well as the obtained yields. These inputs included seeds, water irrigation, fertilizers, insecticides, pesticides, labor mechanization and other costs. Efforts were made to value purchased and non-purchased inputs, such as family labor. Economic information on products and input prices, such as labor, fertilizers, energy, etc., were collected using official statistical information when available from local statistical sources or otherwise from the Regional Department of Agriculture (CRDA). Input prices in Tunisia generally exhibit an upward trend due to inflation. Consequently, the prices used are those corresponding to the season 2022–2023 study. Product prices generally fluctuate due to shifting supply and demand, mainly for horticultural crops. Therefore, the prices used in this study were based on the most recent three-year average for the region (2022–2024).
Using the gathered data, several indicators were employed to assess the agronomic, economic and environmental impacts of using SUPROMED irrigation management recommendation:
-
Agronomic indicators include crop yield, water use and water productivity. Using only the amount of irrigation water supplied to the crop as an indicator may cause some miscalculations because it does not definitively reveal the water productivity or the effectiveness of water management as it does not link the water use to the yields. Water productivity (WP) is broadly used as an indicator to measure a success of policy or method aiming at efficient water management [52] because it ”describes the relationship between water (input) and agricultural product (output)” [53]. It is often used to express the effectiveness of irrigation water use and delivery. The water productivity is estimated as the ratio between the obtained yield (kg/m3) and the irrigation water supplied to the crop (m3.ha−1). A value of the ratio exceeding 1 indicates over-irrigation with regard to scientific recommendations based on the MOPECO method, whereas a value lower than 1 indicates under-irrigation. Water productivity is an important indicator in scarce water areas as it helps decision makers (farmers, planners, etc.) to allocate water or to recommend the appropriate practices to ensure the best valorization of this resource. In the present study, only applied water irrigation (blue water) was considered to estimate WP since rainfall was presumed to be distributed uniformly across all farms.
-
Economic indicators include gross margin (GM), total production cost (TC) and the share of water in total production cost. Gross margin was used as a proxy for profitability of an enterprise, and it is defined as the difference between gross income of production and total variable costs before taxes. The gross income is estimated by multiplying the total production with the market price of the output. Total variable cost includes all inputs incurred by a given producer. The economic water use efficiency (EWUE) indicator was also calculated. It is defined as the benefit of a unit of water to its users and is established as the relationship between gross margins and the total water applied with respect to single crops. An economic sensitivity analysis was also carried out. Break-even price analysis is a technique for studying, for a given level of yield, the relationship between farming cost and gross margin at different levels of prices. It estimates the point at which the gross margin of a given crop is equal to its farming cost, that is, the point (price) below which continuing to grow the crop will not be profitable. It is a useful tool to assist farmers in selecting crop and agricultural practices in the context of price variability.
-
Environmental indicators include energy productivity and the specific energy required to produce a given quantity of output. The term energy productivity used in this study denotes the ratio between yields, expressed in terms of kg, and the energy input, expressed in terms of kilowatt-hours (kWh). It should be noted that the term “energy” refers to the electric energy used to pump water. Specific energy productivity shows the amount of energy spent to produce one unit of marketable product (kWh/kg).
All impacts were calculated on a per-hectare and per-year basis. In order to quantify the impact of smart irrigation technologies, a comparative analysis between the indicators, relative to each form of crop management, was conducted.

3. Results

3.1. Agronomic and Water Use Indicators

The irrigation water use (per ha) and water productivity (output per unit of water) for the seven crops managed under MOPECO recommendations and prevailing practices were analyzed for the two monitored growing seasons 2020–2021 and 2021–2022 (Table 1). The value for each indicator represents the average value for both seasons. As can be seen, the highest yields were obtained at the level of the plots of leader farmers, advised by MOPECO. The difference is more significant for annual than perennial crops.
In the case of wheat, Farmer 4 obtained almost half of the yield observed on the leader farmers’ plots, thus indicating great variability in yields in the region.
The average yield obtained at the level of the five “average farmers” plots in the two seasons was 4370 kg ha−1. If this yield is compared with that obtained in the leader farmers’ plots (6200 kg.ha−1), it can be concluded that there is potential to increase wheat by 42% in many of the farms located in the studied area. When analyzing the amount of irrigation water supplied to the crop at each farm, there is also great variability. However, a higher irrigation depth did not imply a higher yield. Leader farms supplied an amount lower than the average (6158 m3 ha−1) but reached the highest yield. Therefore, not only was difference observed in the amount of water supplied to the crop but also when that water was supplied. The lack of uniformity of the irrigation systems caused high heterogeneity in the yield obtained within the irrigated plot. The same results were observed for the onion crop, where differences were even more significant. The yield at the leaders’ plot was 2.1 times higher than the average yield obtained by the “average farms”. It should be noted that the regional average yield of onion is 39,000 kg ha−1 [54], very similar to the average yield obtained by the average farms (31,085 kg ha−1), while the leader farms reached a 67% higher yield by applying a 11% lower volume of irrigation water. The cultivation of oats showed high variability. One of the average farmers reached even a slightly higher yield than the leader farmers’ yield for a similar amount of irrigation water supplied to the crop. In the rest of the cases, the average farmers reached a lower ratio between irrigation water and yield. Maize was the only annual crop in which the average farmers obtained a higher yield than the leader farmers. The leader farmers provided a lower volume of irrigation water to the crop, and this could be the cause of the difference. As the objective was to keep the crop well-watered, this result may indicate that the Kc values used for determining the irrigation requirements were slightly underestimated. In this sense, the soil moisture sensors did not indicate high depletion of the water content. It is worth noting that research on maize in Tunisia is often limited, with scarce local studies on specific crop coefficients (Kc). Most research studies, including the one conducted within the SUPROMED project, has used FAO-56 standard values rather than locally determined values tailored to the Tunisian climate. These values seem to be underestimated in the arid Sidi Bouzid context. This might explain the lower volume recommended by MOPECO, which led to lower yield than that obtained by the “average farmers”. Further local studies are needed to refine Kc and irrigation requirements.
With regard to tree crops, pistachio growers supplied broadly similar amounts of water to the crop to those provided by the leader farmers. The yield was nevertheless significantly higher in the case of the leader farmers. As pistachio was irrigated under deficit irrigation conditions, in which growers only applied 3–4 irrigations during the season, the irrigation scheduling proposed by MOPECO was more efficient than the strategies adopted by the average farmers. This is a relevant result concerning how the use of these types of models may improve yields without increasing the amount of water supplied to this crop. The results for the olive tree crop were not as evident due to two of the average farmers reaching a higher yield but with a higher amount of water supplied to the crop. In the case of the last farmer, the conclusion is similar to that of pistachio growers. Finally, it is necessary to highlight that almond is a more yield-sensitive crop than the previous two with respect to the amount of irrigation water received. We observed that its ratio ranges between 1.30 and 1.74, meaning that “average farmers” used a volume of water ranging between 30% and 74% higher than that applied on the leader farmers’ plot even though they are located in the same region under the same climatic conditions (temperature, ETP, etc.) and have received similar rainfall. It is worth noting that the variation in the applied volume was not only observed between the experimental plots (leader farmers) and the average farmers’ plots but also among the average farmers’ plots. Consequently, it is justified that a higher amount of water supplied to the crop led to a higher yield.
This great variation in the amount of water applied (Table 1) clearly revealed that a precise irrigation scheduling method could prevent growers from under- or over-irrigating their crops. Irrigation scheduling is the process of determining the appropriate amount and timing of water application to achieve desired crop yield and quality, maximize water conservation and minimize possible negative effects on the environment, such as nutrient leaching below the crop root zone [55].
A survey we conducted at the beginning of the project (2019) on a sample of 96 monitored farmers in the study area with the question “on what you rely to decide irrigation” revealed that 45% of farmers said they base their decisions on the soil surface conditions: if the weather becomes dry, they irrigate, while 29% apply irrigation when they observe signs of crops wilting. Finally, 26% reported relying on established practices where irrigation frequency is fixed depending on the crop type. However, they adjust their practices according to the prevailing climatic conditions by reducing the interval of irrigation when temperature increases and delaying it when it rains. Overall, farmers do not rely on robust information for their irrigation decision-making. This is in line with many studies conducted in Tunisia which stated that farmers generally lack knowledge on aspects of soil–water–plant relationships and they apply water to the crop regardless of the plant needs [56,57]. This might explain why there is wide variation in the water applied in the monitored plots, except for pistachio. Indeed, in the study area, pistachio cultivation is primarily conducted under rainfed conditions with supplementary irrigation during the sensitive growth stages, well known by farmers based on their experiences [58]. The volume of water applied is therefore low, and there is no significant difference between leaders’ plots and average farmers’ plots in term of season water use as the volume ranges between 1800 m3 and 2400 m3 ha−1.
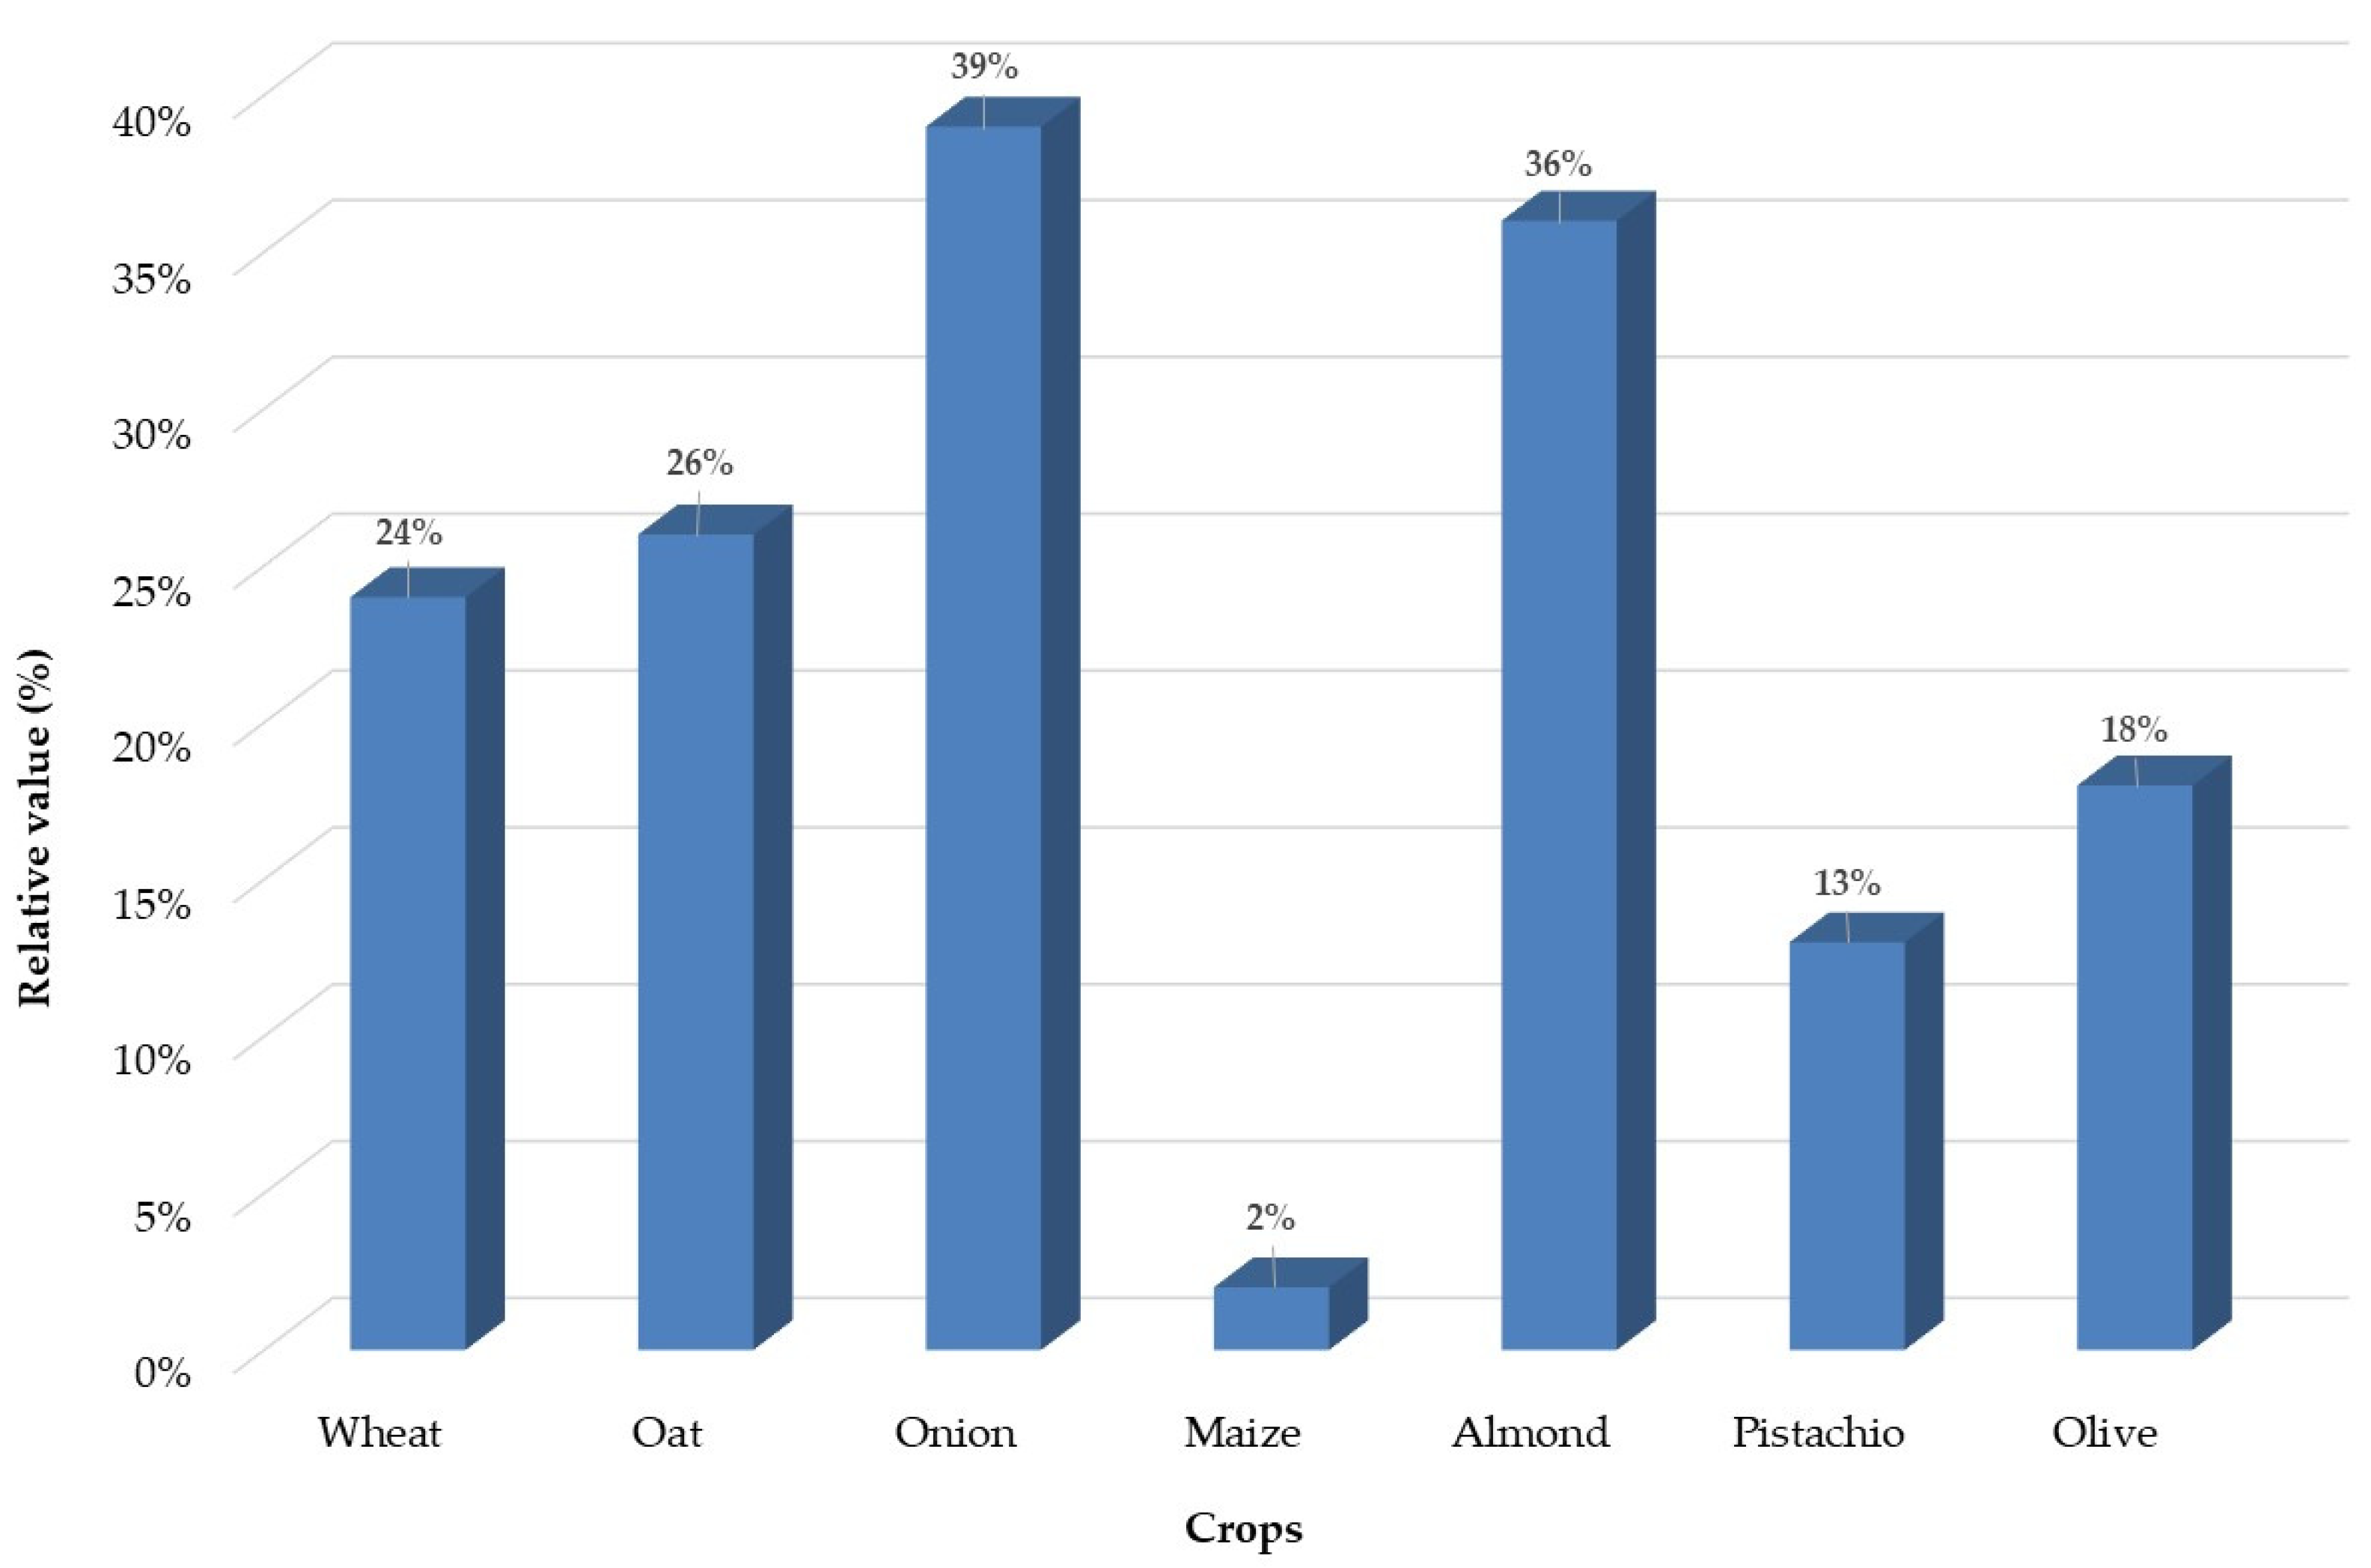
In all crops, except for one average farm in the case of oats, higher WPs were observed at the level of leader farmers’ plots managed with MOPECO advice (Table 1). The differences between “leader farms” and “average farms” were more significant for annual crops, such as wheat and onion, than for perennial crops: almonds, olive and pistachio trees. Regarding maize crop, no significant WP differences between leaders’ and average farmers’ plots were found (Table 1) since the gain of water productivity relative to conventional management was the lowest among all crops, specifically 2%. This might be explained by the fact that the leader farmer has already grown maize in the past to feed his livestock. Therefore, he has good knowledge about water requirements of maize and its critical growth stages. Although he applied more water than the leader, he also obtained higher yield. The water productivity for both water management methods (leader and conventional) were, therefore, similar. In general, the results revealed that the use of the scientific irrigation method would generate a gain of 26% in water productivity with respect to existing irrigation practices. The best gain (39%) was observed for onion production followed by almond trees (36%) (Figure 4). In the study area, farmers grow foreign cultivars for almond, including Mazetto and Barlaise, which are very sensitive to water [59]. To achieve higher yields, farmers usually rely on a calendar or fixed-amount approach to satisfy water requirements, and therefore they apply water regardless of the real plant needs.
As an example, the WP on the leader farmers’ onion plot was 9.21 kg m−3, which was much higher than those obtained on the average farmers’ plots with an average water productivity of 3.9 kg m−3 only. This demonstrates that the scientific irrigation management saved water—in this case, by 20%—and led to a 65% higher yield compared to that of conventional irrigation management on the average farmers’ plots. It should be noted that some “average” farmers obtained higher yields than those obtained on the leader farmers’ plots through the use of a much higher quantity of water. As a result, the WP was always higher in the SUPROMED plots. This is the case for almond trees, for which farmer 3 obtained a higher yield, but the WP was much lower than that obtained on the leader farmer’s plot as he used 1.74 times more water. Farmer 3 needed a reduction of 40% in water consumption to improve his crop’s water productivity and achieve the same level as that observed on the leader farmer’s plot.
Overall, the use of scientific irrigation methods based on local data (soil characteristics, local phenological stages of crops and local weather conditions) combined with best agricultural practices allows farmers to reduce water consumption compared to the conventional irrigation approach, which increases WP without decreasing the yield (Table 1). In the case of tree crops, the WP improvement is caused by the better allocation of irrigation water during the growing season, taking into account the different sensitivity of the crop to water deficit. This result is very relevant in water-scarce areas such as the study location, where the objective should be to reach the maximum amount of yield per unit of water used (i.e., WP), instead of the maximum yield per unit of cropped area. Of course, an economic study is required to recommend this strategy, but it must be also highlighted that the saved water can be used to increase the irrigated area and/or irrigate other more profitable crops with this method. If the saved water did not cause percolation, as was the case in tree crops, it also could be used to recover the piezometric levels of overexploited aquifers without decreasing the total production in the area.

3.2. Economic Indicators

When comparing the average gross margin (GM) obtained in the leader and average farms, the results were more positive for the former in all cases except for maize (Table 2). The highest difference was found for wheat (133.0%) and oats (119.9%), while the GM of maize of the average farmers was 35.8% higher than that of the leader due to the differences in yield and irrigation water supplied to the crop (Table 1). Therefore, the combination of high yields with moderated amounts of irrigation water in the case of annual crops clearly resulted in a higher profitability. High yields were reached in these crops when they did not suffer stress caused by water deficit, while the simulation of the daily soil water balance allowed only the amount of irrigation water required by the crops to be supplied, thus decreasing the percolation losses. In the case of tree crops in which regulated deficit irrigation techniques are applied, the irrigation scheduling must take into account the different sensitivity of the phenological stages to water deficit. Thus, achieving a high yield is a necessary but not a sufficient condition to reach high gross margin due to this economic indicator also being affected by the production costs. The cost of irrigation water in the study area accounts for around 30% of the total production cost, and, consequently, the reduction in the amount of water supplied to these crops may significantly affect the profitability (Table 2).
As an example, the yields observed on the average farms for almond trees were higher than those observed for the leader farmers (Table 1). The gross margin obtained by the latter was nevertheless higher, mainly due to the lower quantity of water applied which decreased the total costs (Table 2).
In Table 2, higher economic valorization is observed at the level of leader farms, where irrigation was scheduled according to MOPECO advice. As expected, maize was the exception, while the highest EWUE difference between the leader and average farms was for oats (220%). This result is interesting due to annual crops showing higher EWUE differences between leader and average farms than tree crops, which implies that regulated deficit irrigation was better managed by farmers than full irrigation. This result can be conditioned by the way that crops under deficit conditions increase water use efficiency [60,61,62] and because the water is supplied to the crops by drip irrigation systems. These systems usually have a higher uniformity of application than other irrigation methods, such as sprinkler systems [63], and decrease percolation losses due to the amount of water supplied being lower than the requirements of the crops.
In general, the results reveal that the use of alternative technology leads to a 12% decrease in water cost with respect to existing irrigation practices adopted by farmers, meaning that the adoption of innovative irrigation management not only increases water productivity and improves yields but also decreases the farming cost. As a consequence, farmers’ income will significantly increase.
The economic sensitivity analysis revealed that, except for almond, the break-even price was significantly lower for all crops under innovative irrigation management than that observed for the same crops managed by the “average farmers” group (Table 3). According to economic theory, to lower the break-even price for a given crop, farmers should focus on decreasing the farming cost while simultaneously working to increase yields. A lower cost of production per unit and a higher production volume lower the break-even price, leading to greater profitability as more revenue is generated beyond the break-even point. In water-scarce areas, the cost of irrigation represents the major component of farming cost; it accounts for 25% to 27% of the total operating costs [43,64]. Such a high irrigation cost share in total farming cost indicates that any decrease in the volume of water applied, combined with a relative increase in yields lead to a lower point of break-even price and could have a considerable impact on the profitability of irrigated crops. The onion crop managed by the leader farmers showed higher resilience with regard to the same crop managed by the average farmers. Among perennial crops, pistachio trees managed by the leader farmers based on SUPROMED advice showed higher resilience relative to the same crop managed by the average farmers. It is worth noting that pistachio, considered one of the most drought tolerant species trees adapted to arid climates [65], is characterized by a low production cost, whereas its market price has considerably increased over the last decade. Such low production cost per unit of product (kg), might tolerate a fall in market price, relative to current one, up to 80%, while still maintaining a positive gross margin. Similar to pistachio trees, olive trees showed also higher resilience to market price fluctuations due to low production cost per unit and high market prices, particularly during the last 5 years when there was a considerable increase in world olive oil demand. The best resilience against market price fluctuations was observed at the level of leaders’ plots, where the irrigation was managed according to scientific considerations (MOPECO). Therefore, crops under innovative irrigation management can better tolerate a fall in market prices than those under conventional management.

3.3. Environmental Indicators

It was found that the leader farmers’ plots used considerably fewer units of electricity to produce the same quantity of product for each crop compared to the average farmers’ plots (Table 4). This is due to the adequate quantity of water used on the leader farmers’ plots, thus avoiding excessive irrigation (Table 1). The obtained yield (Table 1) thereby corresponds to the applied water. The maximum value of energy productivity was obtained at the level of the plots managed under the MOPECO recommendations.
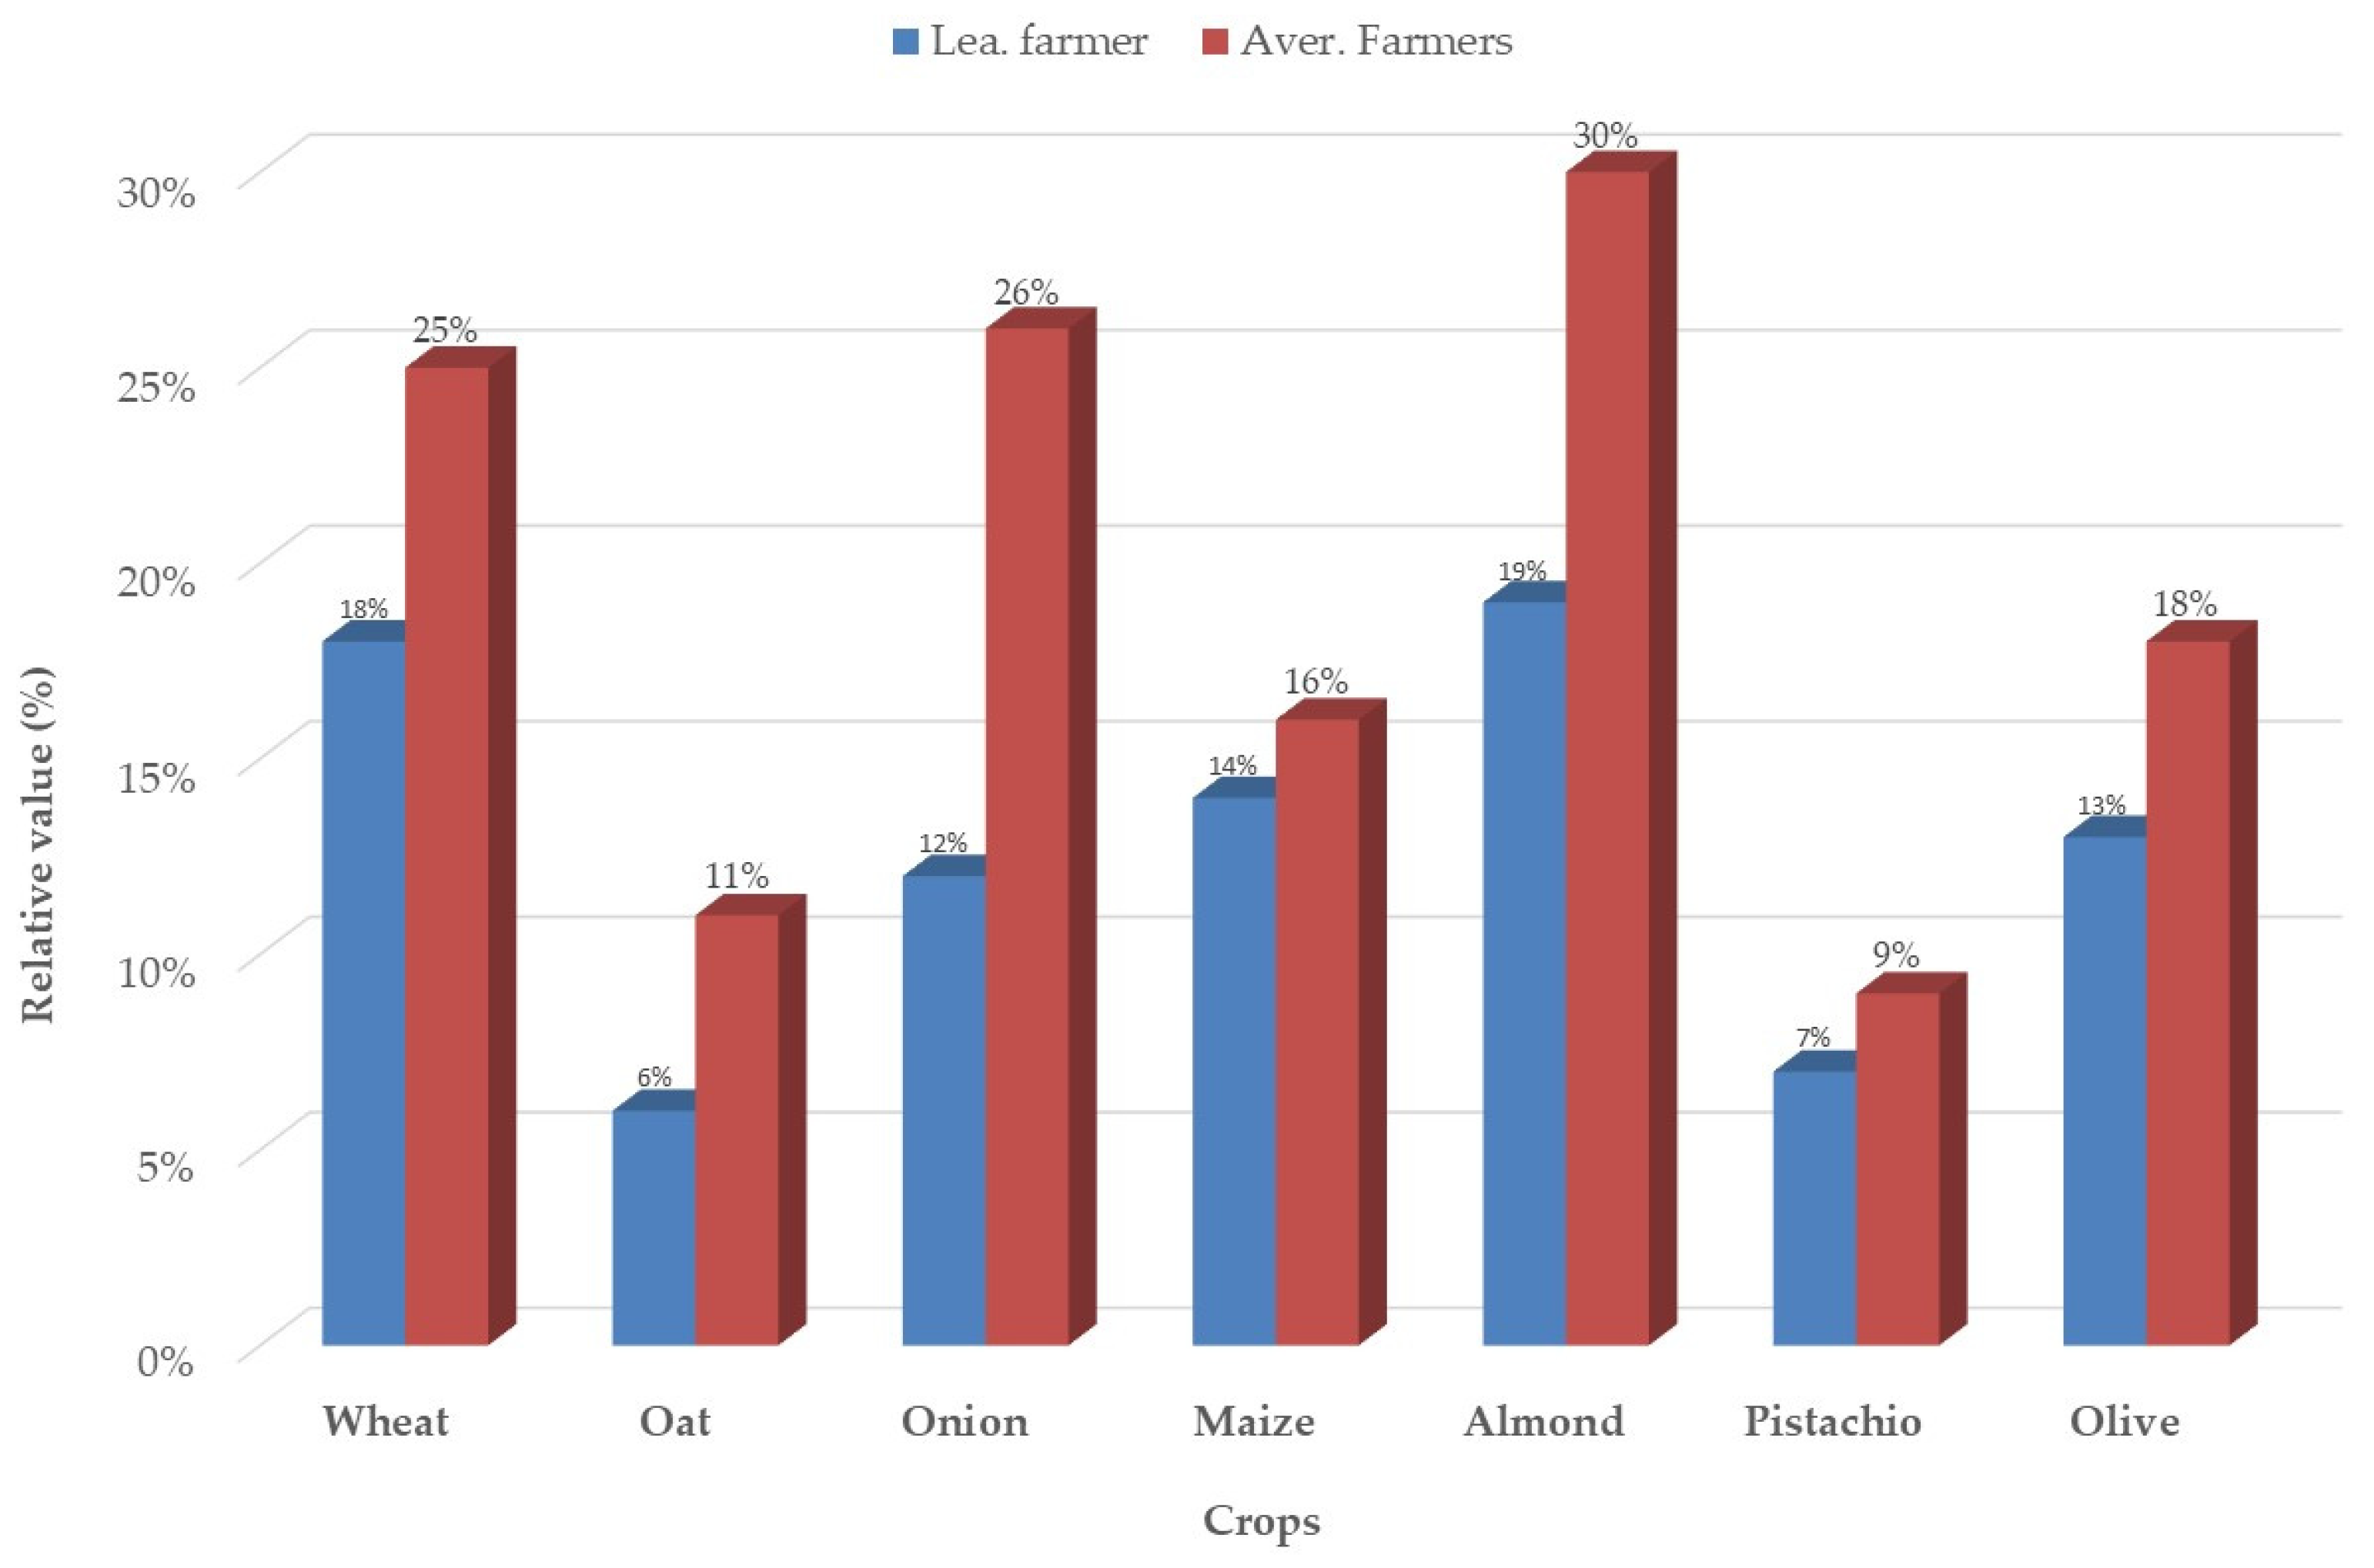
The specific energy productivity indicator for all crops was much lower for the leader farmers’ plots than for the average farmers’ plots, except for olive, indicating that the average farmers used more energy to produce the same quantity of product (Table 4). As an example, the specific energy relative to the onion crop was found to be 0.06 kWh and 0.04 kWh per kg yield for the average farmers’ plots and leader farmers’ plots, respectively, indicating savings of 33% in electricity using the scientific method. The total electricity saved was therefore about 20 kWh for each produced ton of onion. Figure 5 shows the share of energy expenses in the total output value on the “leader” and “average” plots for some annual crops and fruit trees.
In terms of energy expenses per monetary unit of output value (Figure 5), there is a significant difference between the SUPROMED plots and average farmers’ plots. In the case of olive trees, for example, around 5% of total output value obtained on the SUPROMED plot was spent on energy input, which is 0.05 TND for each Dinar of product sold. This value is 12 for the average farmers’ plots, conducted using the prevailing irrigation method. Regarding onion and almond trees, the difference between the two methods of irrigation scheduling (scientific and prevailing) in terms of share of energy expenses was more significant.
We notice slightly smaller use of energy for oat crops and pistachio trees, whereas onion and almond are the highest energy users. According to Figure 5, onion and almond production, conducted under conventional management, spent 26% and 30% of energy per TND output, respectively. These shares were reduced to 12% and 19% with scientific management.

4. Discussion

Taking the overall average, the results showed substantial advantages in performance of the scientific method compared to existing ones. The results obtained in this paper align with the conclusions of some of the previous studies on advanced irrigation scheduling methods and confirm that such approaches decrease energy and water usage while improving profitability [63,64,65,66]. Adendorff et al. [67] found that substantially less water was applied when irrigation was scheduled using weather and soil moisture data compared to a fixed schedule, without negatively affecting the cane yield or quality.
Increases in WUE were observed in all scheduling methods with the highest cost savings. Ref. [45] compared two irrigation scheduling methods, a smart irrigation cotton app and calendar-based method, in cotton fields in Georgia (USA) over 5 years. Data related to water use and net return per acre for each irrigation scheduling methods were collected. The results revealed benefits for growers from using irrigation scheduling methods since they increased yield and profitability. The authors concluded that it was more profitable for farmers to use advanced irrigation scheduling methods than the calendar-based method. By comparing three irrigation scheduling methods (DSSISs, soil moisture sensor-based and conventional experience-based) through a cotton field experiment in China during 2016 and 2017, Chen et al. [68], found that the DSSIS significantly increased water productivity by 26% and 65% compared to sensor-based and experience-based irrigation scheduling methods, respectively. Ref. [69] reported significant savings in applied water using smart irrigation management for winter wheat in Saudi Arabia. Indeed, the use of such a method conserved 12% of irrigation water compared to the conventional method while leading to better economical results. In another study, Ref. [70] argued that smart irrigation scheduling provided significant advantages in both water savings and crop yields by utilizing up to 26% less water than the conventional approach and simultaneously generated higher total yields. The authors concluded that the smart irrigation method may be a valuable tool for conserving water and scheduling irrigation for wheat and tomato crops and may be extendable to other similar agricultural crops in water-limited areas.
Scientific irrigation management can save water and improve yield at the farm level, consequently leading to improved food security for the population [71]. In all the irrigation systems, it is possible to implement innovative strategies that can help in saving irrigation water and improve yields [3,4,7,10,15]. As agriculture water consumption accounts for more than 80% of the freshwater withdrawals in Tunisia [72], it will be imperative to promote the use of technologies such as soil water sensors and decision support tools for irrigation water management in order to increase efficiency and crop production.
However, it is important to recognize that MOPECO irrigation scheduling faces some constraints, including high input data needs (climate, soil and crop parameters) and accuracy limitations under extreme climate variability conditions. Intensive data related to climatic (ETo, precipitation and temperature), edaphic (soil texture/depth) and calibrated crop parameters is required. Such data is not always accessible, reliable or timely for farmers, particularly smallholders. Regarding adoption, MOPECO also faces some barriers that prevent its widespread use, including (a) cost and (b) ease of use. The initial investment cost associated with the use of the scientific irrigation method in farming is higher than the traditional method. Many authors revealed that the initial cost acts as one of the main barriers against adopting this system [73,74]. In the case of our study, the use of MOPECO to schedule irrigation requires the installation of weather stations in the irrigable area. The initial cost of this device ranges between 17,000 and 20,000 TND, with 1000 TND added per year for maintenance. Given the low socio-economic status of majority of the farmers in the region, it is obvious that individual farmers (mostly small farmers) cannot afford to invest in such structures. The barrier related to the high cost of the technology can be tackled through various investment approaches:
(a) The investment for the station can be shared by a community of farmers in the region through the possibility of jointly benefiting from the service, as this equipment can cover an irrigable area of around 6000 to 20,000 ha and may offer service for many hundreds of farmers, thus reducing the share of each farmer in the initial cost to 170–340 TND. (b) An individual wealthy farmer can buy the station and sell the licenses for access to data collected by the weather station to their neighbors and farmers, who only need to install manual pluviometers (17–34 TND per plot) in their plots to obtain the actual rainfall received by the crop. (c) Another suggested approach is for such a device to be paid for by a public institution or Water Users Association (WUA). It is also recommended to install soil moisture sensors Pessel Instruments equipment (Weather stations and soil moisture sensors). It is an Austrian Company based at Weiz (Austria). in certain control points of the plot for the proposed irrigation scheduling. These devices, including software and data transmitting services, are currently expensive, but they can be justified just for very highly profitable crops. Despite their prices, we suggest the use of sensors (in parallel to DSSISs) at least by leader or wealthy farmers to control irrigation because they provide valuable information about soil moisture evolution. Last but not least, less expensive equipment (e.g., sensors and weather stations) needs to be made more affordable for farmers. Within this context, we suggest subsidizing soil moisture sensors and weather stations as they align with national water conservation objectives, similar to the adoption of modern irrigation techniques (drip irrigation, pipe irrigation, sprinkler irrigation, etc.), which already benefit from subsidies of up to 60% for smallholders. Moreover, the accessibility of online historical and forecast weather data needs to be improved, especially in developing countries [75,76].
To overcome the barrier of “ease of use” and facilitate the more effective implementation of innovative irrigation management in Tunisia, farmers need to be better supported through the provision of advice and the increase in training sessions in order to improve their knowledge and build capacities in this field. Boosting the adoption of DSS models (such MOPECO) as a means to save water, mitigate the effects of climate change and promote sustainable production at the farm level requires the integration of how to use such tools into the agricultural extension program. Therefore, policy makers and regional departments of agriculture should invest in extension programs by providing logistics and the required funds and training quality agents. Indeed, investment in extension and awareness programs has the potential to improve farmers’ skills and knowledge and raise their awareness of the scarcity of water.
The use of precision irrigation methods in farming is gaining popularity, but high cost and model manipulation can prevent wide adoption. These scientific methods need to be cost-effective and feasible for farmers to adopt. Research should continue to produce simplified applications since producers do not have to deal with large amounts of data often generated using DSSIS methods. For example, the development of a cell phone version of MOPECO (RETOAGUA in Spain), in parallel with the computer version would likely provide incentives to producers for using the tool for simultaneously reducing the irrigation applications and producing suitable crop yields. Research could also continue to focus on developing lower-cost soil sensors to schedule irrigation that results in efficient irrigation.

5. Conclusions

The application of the scientific irrigation scheduling method combined with the adoption of best agricultural practices (new crops varieties, appropriate fertilizer management, etc.) could contribute to more water and energy savings while resulting in significant economic advantages and decreasing farming cost. Overall, the scientific method significantly increased water productivity and economic farmers’ income by 26% and 35%, respectively, compared to the conventional method.
Higher efficiency in terms of energy use was also observed. As pressurized irrigation systems are energy-intensive and the share of energy can reach 25–40% of total production cost for some crops, any reduction in energy cost would result in lower farming cost and, therefore, an increase in the profitability of crops and farmers’ income.
These findings imply that innovative irrigation management based on real local data, combined with the use of best agricultural practices, can help to sustain the economic profitability of irrigated farming systems in water-limited areas and decrease the impact on natural resources as water bodies.
This study suggests that DSSISs for scientific irrigation scheduling are promising tools for better irrigation management in water-limited areas. The results can provide guidelines to farmers, extension experts and agriculture water policymakers for optimizing the use of water resources and promoting precision agriculture in water-limited areas.

Author Contributions

Conceptualization, H.E.A.; Methodology, H.E.A.; Validation, H.E.A., Á.M.-R., J.A.M.-L., N.R.D., N.D., I.F., M.B.S. and R.N.; Formal analysis, H.E.A., C.M., Á.M.-R., J.A.M.-L., N.R.D., N.D., I.F., J.R.K., M.B.S. and R.N.; Data curation, M.B.S.; Visualization, M.S.; Project administration, J.R.K.; Funding acquisition, H.E.A., A.D. and M.S. All authors have read and agreed to the published version of the manuscript.

Funding

This research was carried out within the European project SUPROMED “GA-1813” funded by PRIMA and the “RETOAGUA” convention with the Regional Government of Castilla-La Mancha (Spain).

Data Availability Statement

The original contributions presented in this study are included in the article. Further inquiries can be directed to the corresponding author.

Acknowledgments

The authors thank the farmers and Engineers of Regional Department of Agriculture (CRDA) in Sidi Bouzid participating in this research for their support in the tasks and actions performed during the three years of the project.

Conflicts of Interest

The authors declare no conflicts of interest. The funders had no role in the design of the study; in the collection, analyses or interpretation of data; in the writing of the manuscript; or in the decision to publish the results.

References

  1. Hemdi, M. Situation des ressources en eau dans le Gouvernorat de Sidi Bouzid. In Proceedings of the Regional Seminar on: «Adoption of Smart Irrigation Technologies in Scheduling Irrigation in Water Limited Areas», Gafsa, Tunisia, 6–8 June 2022. [Google Scholar]
  2. Gleeson, T.; Wada, Y.; Bierkens, M.F.P.; van Beek, L.P.H. Water balance of global aquifers revealed by groundwater footprint. Nature 2012, 488, 197–200. [Google Scholar] [CrossRef] [Scilit] [PubMed]
  3. Vories, E.D.; Evett, S.R. Irrigation challenges in the sub-humid U.S. Mid-South. Int. J. Water 2014, 8, 259–274. [Google Scholar] [CrossRef] [Scilit]
  4. Vories, E.; Sudduth, K. Determining sensor-based field capacity for irrigation scheduling. Irrig. Water Manag. 2021, 250, 106860. [Google Scholar] [CrossRef] [Scilit]
  5. Bhattarai, A.; Liu, Y.; Smith, A.; Liakos, V.; Vellidis, G. Economic analysis of modern irrigation scheduling strategies on cotton production under different tillage systems in South Georgia. In Proceedings of the Southern Agricultural Economics Association (SAEA) Annual Meeting, Louisville, KY, USA, 1–4 February 2020. [Google Scholar]
  6. Zeeshan, A.; Gui, D.; Murtaza, G.; Yunfei, L.; Ali, S. Overview of Smart Irrigation Management for Improving Water Productivity under Climate Change in Drylands. Agronomy 2023, 13, 2113. [Google Scholar] [CrossRef] [Scilit]
  7. Kamienski, C.; Soininen, J.P.; Taumberger, M.; Dantas, R.; Toscano, A.; Cinotti, T.S.; Maia, R.F.; Torre Neto, A.T. Smart Water Management Platform: IoT-Based Precision Irrigation for Agriculture. Sensors 2019, 19, 276. [Google Scholar] [CrossRef] [Scilit] [PubMed]
  8. Boman, B.; Smith, S.; Tullos, B. Control and Automation in Citrus Micro Irrigation Systems; Agricultural and Biological Engineering Department, UF/IFAS Extension; University of Florida: Gainesville, FL, USA, 2015; pp. 1–15. [Google Scholar]
  9. Bwambale, E.; Abagale, K.F.; Anornu, G.K. Smart irrigation for climate change adaptation and improved food security. In Irrigation and Drainage; Sultan, M., Fiaz, A., Eds.; IntechOpen: London, UK, 2022; Volume 3, pp. 154–196. [Google Scholar]
  10. Bwambale, E.; Abagale, K.F.; Anornu, G.K. Smart irrigation monitoring and control strategies for improving water use efficiency in precision agriculture: A review. Agric. Water Manag. 2022, 260, 107324. [Google Scholar] [CrossRef] [Scilit]
  11. Karasekreter, N.; Basciftci, F.; Fidan, U. A new suggestion for an irrigation schedule with an artificial neural network. J. Exp. Theor. Artif. Intell. 2013, 25, 93–104. [Google Scholar] [CrossRef] [Scilit]
  12. Zhou, W.; Xu, Z.; Ross, D.; Dignan, J.J.; Fan, Y.; Huang, Y.; Wang, G.; Bagtzoglou, A.; Lei, Y.; Li, B. Towards Water-Saving Irrigation Methodology: Field Test of Soil 1 Moisture Profiling Flat Thin mm-Sized Soil Moisture Sensors (MSMSs). Available online: https://www.semanticscholar.org/paper/Towards-water-saving-irrigation-methodology%3A-Field-Zhou-Xu/8195410be13e6e8fc072e70f22c2386ea25f2616 (accessed on 30 September 2024).
  13. Nam, W.H.; Taegon, K.; Hong, E.M.; Choi, J.Y.; Kim, J.T. A Wireless Sensor Network (WSN) application for irrigation facilities management based on Information and Communication Technologies (ICTs). Comput. Electron. Agric. 2017, 143, 185–192. [Google Scholar] [CrossRef] [Scilit]
  14. Dassanayake, D.K.; Dassanayake, H.; Malano, G.M.; Dunn Douglas, P.; Langford, J. Water saving through smarter irrigation in Australian dairy farming: Use of intelligent irrigation controller and wireless sensor network. In Proceedings of the 18th World IMACS/MODSIM Congress, Cairns, Australia, 13–17 July 2009; pp. 4409–4417. [Google Scholar]
  15. Touil, S.; Richa, A.; Fizir, M.; Argente-Garcia, J.E.; Skarmeta, A.F. A review on smart irrigation management strategies and their effect on water saving and yield. Irrig. Drain. 2022, 71, 1396–1416. [Google Scholar] [CrossRef] [Scilit]
  16. Allen, R.G.; Pereira, L.S.; Raes, D.; Smith, M. Crop Evapotranspiration-Guidelines for Computing Crop Water Requirements-FAO Irrigation and Drainage Paper 56; FAO: Rome, Italy, 1998. [Google Scholar]
  17. Shaswata, R.; Deshmukh, R.; Lekha, C. Smart Irrigation System Using IoT. Int. J. Emerg. Technol. Innov. Res. 2018, 5, 497–501. [Google Scholar]
  18. Gotcher, M.; Taghvaeian, S.; Quetone Moss, J. The Smart Irrigation Technology: Controllers and Sensors. Oklahoma State University Extension, Division of Agriculture Sciences and Natural Resources, Id: HLA-6445. 2017. Available online: https://extension.okstate.edu/fact-sheets/smart-irrigation-technology-controllers-and-sensors.html (accessed on 16 November 2024).
  19. Cardenas-Lailhacar, B.; Dukes, M.D.; Miller, G.L. Sensor-based automation of irrigation on bermudagrass, during wet weather conditions. J. Irrig. Drain. Eng. 2008, 134, 120–128. [Google Scholar] [CrossRef] [Scilit]
  20. Cardenas-Lailhacar, B.; Dukes, M.D.; Miller, G.L. Sensor-based automation of irrigation on bermudagrass, during dry weather conditions. J. Irrig. Drain. Eng. 2010, 136, 184–193. [Google Scholar] [CrossRef] [Scilit]
  21. Mayer, P.W.; Deoreo, W.B. Improving urban irrigation efficiency by using weather-based “smart” controllers. Am. Water Work. Assoc. 2010, 102, 86. [Google Scholar] [CrossRef] [Scilit]
  22. Bondesan, L.; Ortiz, B.V.; Morlin, F.; Morata, G.; Duzy, L.; van Santen, E.; Lena, B.P.; Vellidis, G. A comparison of precision and conventional irrigation in corn production in Southeast Alabama. Precis. Agric. 2023, 24, 40–67. [Google Scholar] [CrossRef] [Scilit]
  23. Taghvaeian, S.; Porter, D.; Aguilar, J. Soil Moisture-Sensing Systems for Improving Irrigation Scheduling, Published Jun. 2021|Id: BAE-1543. Oklahoma State University Extension, Division of Agriculture Sciences and Natural Resources, Id: HLA-6445. 2021. Available online: https://extension.okstate.edu (accessed on 16 November 2024).
  24. Kropp, I.; Nejadhashemi, A.P.; Deb, K.; Abouali, M.; Roy, P.C.; Adhikari, U.; Hoogenboom, G. A multi-objective approach to water and nutrient efficiency for sustainable agricultural intensification. Agric. Syst. 2019, 173, 289–302. [Google Scholar] [CrossRef] [Scilit]
  25. Nawandar, N.; Satpute, V. IoT based low cost and intelligent module for smart irrigation system. Comput. Electron. Agric. 2019, 162, 979–990. [Google Scholar] [CrossRef] [Scilit]
  26. Dabach, S.; Lazarovitch, N.; Simunek, J.; Shani, U. Numerical investigation of irrigation scheduling based on soil water status. Irrig. Sci. 2013, 31, 27–36. [Google Scholar] [CrossRef] [Scilit]
  27. Vanuytrecht, E.; Raes, D.; Steduto, P.; Hsiao, T.C.; Fereres, E.; Heng, L.K.; Garcia Vila, M.; Mejias Moreno, P. AquaCrop: FAO’s CropWater Productivity and Yield Response Model. Environ. Model. Softw. 2014, 62, 351–360. [Google Scholar] [CrossRef] [Scilit]
  28. Pereira, L.S.; Teodoro, P.R.; Rodrigues, P.N.; Teixeira, J.L. Irrigation Scheduling Simulation: The Model Isareg. In Tools for Drought Mitigation in Mediterranean Regions; Springer: Dordrecht, The Netherlands, 2003; pp. 161–180. [Google Scholar]
  29. Domínguez, A.; Martinez-Lopez, J.A.; Amami, H.; Nsisr, R.; Karam, F.; Ouelati, M. Adaptation of a Scientific Decision Support System to the Productive Sector—A Case Study: MOPECO Irrigation Scheduling Model for Annual Crops. Water 2023, 15, 1691. [Google Scholar] [CrossRef] [Scilit]
  30. Domínguez, A.; Tarjuelo, J.M.; de Juan, J.A.; López-Mata, E.; Breidy, J.; Karam, F. Deficit Irrigation under Water Stress and Salinity Conditions: The MOPECO-Salt Model. Agric. Water Manag. 2011, 98, 1451–1461. [Google Scholar] [CrossRef] [Scilit]
  31. Domínguez, A.; Martínez, R.S.; de Juan, J.A.; Martínez-Romero, A.; Tarjuelo, J.M. Simulation of Maize Crop Behavior under Deficit Irrigation Using MOPECO Model in a Semi-Arid Environment. Agric. Water Manag. 2012, 107, 42–53. [Google Scholar] [CrossRef] [Scilit]
  32. Domínguez, A.; Jiménez, M.; Tarjuelo, J.M.; de Juan, J.A.; Martínez-Romero, A.; Leite, K.N. Simulation of Onion Crop Behavior under Optimized Regulated Deficit Irrigation Using MOPECO Model in a Semi-Arid Environment. Agric. Water Manag. 2012, 113, 64–75. [Google Scholar] [CrossRef] [Scilit]
  33. Domínguez, A.; Martínez-Romero, A.; Leite, K.N.; Tarjuelo, J.M.; de Juan, J.A.; López-Urrea, R. Combination of Typical Meteorological Year with Regulated Deficit Irrigation to Improve the Profitability of Garlic Growing in Central Spain. Agric. Water Manag. 2013, 130, 154–167. [Google Scholar] [CrossRef] [Scilit]
  34. Leite, K.N.; Cabello, M.J.; Valnir, M., Jr.; Tarjuelo, J.M.; Domínguez, A. Modelling Sustainable Salt Water Management under Deficit Irrigation Conditions for Melon in Spain and Brazil. J. Sci. Food Agric. 2015, 95, 2307–2318. [Google Scholar] [CrossRef] [Scilit]
  35. Martínez-Romero, A.; Domínguez, A.; Landeras, G. Regulated Deficit Irrigation Strategies for Different Potato Cultivars under Continental Mediterranean-Atlantic Conditions. Agric. Water Manag. 2019, 216, 164–176. [Google Scholar] [CrossRef] [Scilit]
  36. Carvalho, D.F.; Domínguez, A.; Neto, D.H.O.; Tarjuelo, J.M.; Martínez-Romero, A. Combination of Sowing Date with Deficit Irrigation for Improving the Profitability of Carrot in a Tropical Environment (Brazil). Sci. Hortic. 2014, 179, 112–121. [Google Scholar] [CrossRef] [Scilit]
  37. Léllis, B.C.; Carvalho, D.F.; Martínez-Romero, A.; Tarjuelo, J.M.; Domínguez, A. Effective Management of IrrigationWater for Carrot under Constant and Optimized Regulated Deficit Irrigation in Brazil. Agric. Water Manag. 2017, 192, 294–305. [Google Scholar] [CrossRef] [Scilit]
  38. Domínguez, A.; Schwartz, R.C.; Pardo, J.J.; Guerrero, B.; Bell, J.M.; Colaizzi, P.D.; Baumhardt, R.L. Center pivot Irrigation capacity effects on maize yield and profitability in the Texas High Plains. Agric. Water Manag. 2022, 261, 107335. [Google Scholar] [CrossRef] [Scilit]
  39. Galiotoa, F.; Chatzinikolaoua, P.; Raggi, M.; Viaggi, D. The value of information for the management of water resources in agriculture: Assessing the economic viability of new methods to schedule irrigation. Agric. Water Manag. 2020, 227, 105848. [Google Scholar] [CrossRef] [Scilit]
  40. MARHP. 2021. Répartition des Superficies Irriguées Selon les Délégations, Gouvernorat Sidi Bouzid. Available online: https://catalog.agridata.tn/dataset/repartition-des-superficies-irriguees-selon-les-delegation-gouvernorat-sidi-bouzid (accessed on 16 November 2024).
  41. Nciri, R.; Bouselmi, A.; Jarrahi, T.; Ghdifi, F. Determination of Growth Stage-Specific Crop Coefficients (Kc) of durum wheat and oat in the region of Sidi Bouzid—Tunisia. In Proceedings of the 2nd AGROECOINFO Symposium, Volos, Greece, 30 June–2 July 2022. [Google Scholar]
  42. Boughanmi, M.; Dridi, L.; Hemdi, M.; Majdoub, R.; Schäfer, G. Impact of floodwaters on vertical water fluxes in the deep vadose zone of an alluvial aquifer in a semi-arid region. Hydrol. Sci. J. 2018, 63, 136–153. [Google Scholar] [CrossRef] [Scilit]
  43. Chemak, F.; Nouiri, I.; Bellali, H.; Chahed, M.K. Irrigation practices, prevalence of leishmaniasis and sustainable development: Evidence from the Sidi Bouzid region in central Tunisia. Sci. Afr. 2022, 15. [Google Scholar] [CrossRef] [Scilit]
  44. Elloumi, M.; Alary, V.; Selmi, S. Policies and strategies of livestock farmers in Sidi Bouzid Governorate (central Tunisia). Afr. Contemp. 2006, 219, 63–79. [Google Scholar]
  45. Arraouadi, S.; Nasraoui, R.; Gharbi, W.; Sellami, M.H. Genetic Variation of Response to irrigation system of three durum wheat varieties (Triticum durum Desf.) cultivated in Sidi Bouzid, Tunisia. J. New Sci. 2015, 20, 2015. [Google Scholar]
  46. Hemdi, M. Exploitation des Ressources en Eau dans la région de Sidi-Bouzid: Etat actuel et perspectives. In Proceedings of the A Conference Paper Presented at the Kick-Off Meeting of SUPROMED Project, Sidi-Bouzid, Tunisian, 19 November 2019. [Google Scholar]
  47. Hamdi, M.; M’nassri, S.; Dridi, L.; Majdoub, R.; Abida, H. Epandage des eaux de crues sur les ressources en eaux souterraines dans les zones arides: Plaine de Sidi Bouzid (Tunisie Centrale). Eur. J. Sci. Res. 2015, 129, 33–42. [Google Scholar]
  48. El Amami, H.; Kompany, J.R.; Muanda, C. Rabattement des nappes et équité d’accès aux eaux souterraines: Analyse comparative des catégories d’exploitations agricoles dans le centre de la Tunisie. Cah. Agric. 2024, 33, 13. [Google Scholar] [CrossRef] [Scilit]
  49. Doorenbos, J.; Pruitt, W.O. Guidelines for Predicting Crop Water Requirements; FAO Irrigation and Drainage Paper; FAO: Rome, Italy, 1977; Volume 24, p. 144. [Google Scholar]
  50. Sevacherian, V.; Stern, V.M.; Mueller, A.J. HeatAccumulationforTimingLygu/ControlMeasuresinaSafflower-CottonComplex 2. J. Econ. Entomol. 1997, 70, 399–402. [Google Scholar] [CrossRef] [Scilit]
  51. Bleiholder, H.; Weber, E.; Lancashire, P.D.; Feller, C.; Buhr, L.; Hess, M.; Wicke, H.; Hack, H.; Meier, U.; Klose, R.; et al. Growth Stages of Mono and Dicotyledonous Plants BBCH Monograph, 2nd ed.; Meier, U., Ed.; Federal Biological Research Centre for Agriculture and Forestry: Braunschweig, Germany, 2001. [Google Scholar]
  52. Ozcelik, N.; Rodríguez, M.; Lutter, S.; Sartal, A. Indicating the wrong track? A critical appraisal of water productivity as an indicator to inform water efficiency policies. Resour. Conserv. Recycl. 2021, 168, 105452. [Google Scholar] [CrossRef] [Scilit]
  53. Razzaq, A.; Rehman, A.; Qureshi, A.H.; Javed, I.; Saqib, R.; Iqbal, M.N. An economic analysis of high efficiency irrigation systems in Punjab, Pakistan. Sarhad J. Agric. 2018, 34, 818–826. [Google Scholar] [CrossRef] [Scilit]
  54. MARHP. Superficie et Production des Cultures Maraîchères—Gouvernorat Sidi Bouzid. 2021. Available online: https://catalog.agridata.tn/dataset/production-et-superficie-des-cultures-maraicheres-gouvernorat-de-sidi-bouzid (accessed on 15 October 2025).
  55. Taghvaeian, S.; Andales, A.; Allen, L.N.; Kisekka, I. Irrigation Scheduling for Agriculture in the United States: The Progress Made and the Path Forward. Trans. ASABE (Am. Soc. Agric. Biol. Eng.) 2020, 63, 1603–1618. [Google Scholar] [CrossRef] [Scilit]
  56. Allani, M.; Frija, A.; Nemer, R.; Ribbe, L.; Sahli, A. Farmers’ Perceptions on an Irrigation Advisory Service: Evidence from Tunisia. Water 2022, 14, 3638. [Google Scholar] [CrossRef] [Scilit]
  57. Nagaz, K.; Masmoudi, M.M.; Ben Mechlia, N. Irrigation scheduling calendars development and validation under actual farmers conditions in arid regions of Tunisia. Option Méditerranéennes 2007, 56, 249–259. [Google Scholar]
  58. Chelli-Chaabouni, A.; Mansour, K.B.; Ouerghui, I.; Mkadmi, M.; Ayadi, M. Physico-chemical characteristics of pistachio kernel accessions growing under South Mediterranean conditions. J. Arid Arboric. Olive Grow. 2024, 3, 2811–6313. [Google Scholar]
  59. Maatallah, S.; Mounira, G.; Elloumi, O.; Ghrab, M. Phenological and Biochemical Characteristics of Almond Cultivars in Arid Climate of Central Tunisia. Environ. Sci. Proc. 2022, 16, 7. [Google Scholar] [CrossRef] [Scilit]
  60. Muroyiwa, G.; Mashonjowa, E.; Mhizha, T.; Muchuweti, M. The effects of deficit irrigation on water use efficiency, yield and quality of drip-irrigated tomatoes grown under field conditions in Zimbabwe. Water SA 2023, 49, 363–373. [Google Scholar] [CrossRef] [Scilit]
  61. Zairi, A.; Amami, H.; Slatni, A.; Pereira, L.S.; Rodrigues, P.N.; Machado, T. Cooping with drought: Deficit irrigation strategies for cereals and field horticultural crops in Central Tunisia. In Tools for Drought Mitigation in Mediterranean Regions; Rossi, G., Cancelliere, A., Pereira, L.S., Oweis, T., Shatanawi, M., Zairi, A., Eds.; Kluwer: Dordrecht, The Netherlands, 2003; pp. 181–201. [Google Scholar]
  62. Irkiso, A.; Muenzel, S.; Chemura, A.; Thieken, A.H. Deficit Irrigation and Soil Amendment as Drought Adaptation Strategies: Water Use Efficiency in Pot Experiments with Wheat. Irrig. Drain. 2025, 74, 1538–1552. [Google Scholar] [CrossRef] [Scilit]
  63. Rodrigues, G.C.; Paredes, P.; Gonçalves, J.M.; Alves, I.; Pereira, L.S. Comparing sprinkler and drip irrigation systems for full and deficit irrigated maize using multi-criteria analysis and simulation modelling: Ranking for water saving vs. farm economic returns. Agric. Water Manag. 2013, 126, 85–96. [Google Scholar] [CrossRef] [Scilit]
  64. Messaoudi, F.; Chebil, A.; Ben Noun, B. Analysis of water saving investment of agricultural sector in Tunisia. J. Oasis Agric. Sustain. Dev. 2025, 7, 1–9. [Google Scholar] [CrossRef] [Scilit]
  65. Lecina, S. Farmerless Profit-Oriented Irrigation Scheduling Strategy for Solid Sets. II: Assessment. J. Irrig. Drain. Eng. 2016, 142, 4015068. [Google Scholar] [CrossRef] [Scilit]
  66. Matteo, S.; Velasco-Cruz, C.; Friell, J.; Schiavon, M.; Sevostianova, E.; Beck, L.; Sallenave, R.; Leinauer, B. Irrigation scheduling technologies reduce water use and maintain turfgrass quality. Agron. J. 2020, 112, 3456–3469. [Google Scholar] [CrossRef] [Scilit]
  67. Anderdoff, M.W.; Jumman, A.; Olivier, F.C.; Paraskevopoulos, A. Irrigation scheduling demonstration trials are an effective means to promote adoption: Pongola case study. Proc. S. Afr. Sug. Technol. Assoc. 2017, 90, 191–195. [Google Scholar]
  68. Chen, X.; Qi, Z.; Gui, D.; Gu, Z.; Ma, L.; Zeng, F.; Li, L.; Sima, M.W. A Model-Based Real-Time Decision Support System for Irrigation Scheduling to Improve Water Productivity. Agronomy 2019, 9, 686. [Google Scholar] [CrossRef] [Scilit]
  69. Al-Ghobari, H.M.; El Marazky, M.S.A. Effect of smart sprinkler irrigation utilization on water use efficiency for wheat crops in arid regions. Int. J. Agric. Biol. Eng. 2014, 7, 26–35. [Google Scholar]
  70. Al-Ghobari, M.H.; Mohammad, F.S.; El Marazky, M.S.A.; Dewidar, A.Z. Automated irrigation systems for wheat and tomato crops in arid regions. Water SA 2017, 43, 354–364. [Google Scholar] [CrossRef] [Scilit]
  71. Vatta, K.; Sidhu, R.S.; Lall, U.; Birthal, P.S.; Taneja, G.; Kaur, B.; Devineni, N.; MacAlister, C. Assessing the economic impact of a low cost water-saving irrigation technology in Indian Punjab: The tensiometer. Water Int. 2018, 43, 305–321. [Google Scholar] [CrossRef] [Scilit]
  72. MARHP. Rapport Annuel du Secteur de l’eau 2023. Ministère de l’Agriculture, des Ressources Hydrauliques et la pêche: Tunis, Tunisie, 2023; 217p.
  73. ALabdali, S.A.; Pilleggi, S.F.; Cetindamar, D. The Influential Factors, Enablers, and Barriers to Adopting Smart Technology in Rural Regions: A Literature Review. Sustainability 2023, 15, 7908. [Google Scholar] [CrossRef] [Scilit]
  74. Hwang, B.G.; Ngo, J. Challenges and Strategies for the Adoption of Smart Technologies in the Construction Industry: The Case of Singapore. J. Manag. Eng. 2022, 38. [Google Scholar] [CrossRef] [Scilit]
  75. Sun, X.; Zhong, X.; Xu, X.; Huang, Y.; Li, H.; Neelin, J.D.; Chen, D.; Feng, J.; Han, W.; Wu, L. A data-to-forecast machine learning system for global weather. Nat. Commun. 2025, 16, 6658. [Google Scholar] [CrossRef] [Scilit] [PubMed]
  76. Lawal, Y.; Adebisi, O. AI and IoT-Based Smart Irrigation: A Review of Challenges and Future Trends. In Proceedings of the 4th International Congress of the Turkish Journal of Agriculture-Food Science and Technology, Niğde, Türkiye, 28–30 April 2025; pp. 936–942. [Google Scholar]
Figure 1. End users’ platform developed by SUPROMED project (http://supromed.semide.net/ accessed on 1 March 2026).
Water 18 00655 g001
Figure 2. The study area.
Water 18 00655 g002
Figure 3. Progression of the soil moisture content (purple line), irrigation scheduling (circles), rainfall events (triangles) and irrigation schedule proposed for the next seven days (box at the bottom on the left) in (a) a barley crop and (b) an almond tree crop by using the RETOAGUA tool.
Water 18 00655 g003
Figure 4. Average gain of water use productivity per crop relative to conventional irrigation management (%).
Water 18 00655 g004
Figure 5. The share of energy expenses in the total value output on leader farmers’ plots and average farmers’ plots.
Water 18 00655 g005
Table 1. Average irrigation, average yields and water use productivity of crops for both methods of irrigation scheduling (Lea. farm = leader farm, SUPROMED management; Ave. Farm: average farm, conventional management; WP: water productivity) in the 2020–2021 and 2021–2022 growing seasons.
Irrigation ManagementAverage Irrigation
m3 ha−1
Ratio
Average Irrigation/Leader Irrigation
Average Yield
kg ha−1
WP
kg m−3
Wheat
Lea. farm58001.0062001.08
Ave. farm 148500.8451501.01
Ave. farm 248000.8342000.88
Ave. farm 388501.5345000.50
Ave. farm 467501.1634000.50
Ave. farm 559001.0246000.78
Onion
Lea. farm71001.0065,3009.21
Ave. farm 193001.3136,5003.91
Ave. farm 272501.0234,3004.72
Ave. farm 366000.9334,8005.33
Ave. farm 449000.6922,8004.61
Ave. farm 544000.6227,2006.23
Ave. farm 613,1001.8530,0002.32
Ave. farm 710,2501.4432,0003.11
Oat
Lea. farm36001.0082002.28
Ave. farm 175002.0862000.82
Ave. farm 232000.8985002.68
Ave. farm 327000.7549001.84
Ave. farm 459001.6480001.34
Maize
Lea. farm76301.0065000.85
Ave. farm 185701.1271000.83
Pistachio
Lea. farm22001.008000.36
Ave. farm 122001.007200.33
Ave. farm 218500.842800.15
Ave. farm 324001.094200.17
Olive
Lea. farm45001.0063001.42
Ave. farm 155501.2365001.17
Ave. farm 262501.3972501.16
Ave. farm 342000.9337500.89
Almond
Lea. farm55501.0014000.25
Ave. farm 196701.7418000.19
Ave. farm 272001.3017500.24
Table 2. Main economic indicators (Lea.: leader farm; Ave.: average farm; EWUE: economic water use efficiency; TND: Tunisian Dinar ≈ 0.295 € in 2025).
CropsWater Scheduling MethodGross Margin (TND ha−1)EWUE
(TND m−3)
Production Cost (PC) (TND/ha)Share of Water Cost in PC (%)
WheatLea. farm.57901.00273022%
Ave. farm24850.40193032%
OnionLea. farm.11,1401.57688012%
Ave. farm62000.78588016%
OatLea. farm.32330.96210023%
Ave. farm14700.30243028%
MaizeLea. farm.31880.42301035%
Ave. farm43300.50332038%
PistachioLea. farm.12,2654.31345022%
Ave. farm81403.77210031%
OliveLea. farm.25170.56379027%
Ave. farm22000.41415032%
AlmondLea. farm.54570.98700019%
Ave. farm50760.53659546%
Table 3. Resilience of crops profitability to market price variability according to water irrigation scheduling method (%).
CropsWater Scheduling MethodBreak-Even Price
(TND kg−1)
Fall Relative to Current Price
WheatLea. farm0.43−64%
Ave. farm0.59−51%
OnionLea. farm0.11−70%
Ave. farm0.17−50%
OatLea. farm0.22−41%
Ave. farm0.34−11%
MaizeLea. farm0.58−54%
Ave. farm0.83−34%
PistachioLea. farm4.31−78%
Ave. farm4.39−78%
OliveLea. farm0.59−80%
Ave. farm0.71−76%
AlmondLea. farm5.00−10%
Ave. farm3.66−33%
Table 4. The energy productivity and specific energy for monitored crops relative to each irrigation scheduling method: scientific (leader farm) and conventional (average farm).
CropsWater Scheduling MethodEnergy Productivity
kg kWh−1
Specific Energy
kWh kg−1
WheatLea. farm3.990.25
Ave. farm2.930.37
OnionLea. farm34.080.04
Ave. farm15.780.06
OatLea. farm10.440.17
Ave. farm5.780.17
MaizeLea. farm1.690.59
Ave. farm1.540.64
PistachioLea. farm0.711.40
Ave. farm0.432.32
OliveLea. farm2.760.36
Ave. farm4.060.25
AlmondLea. farm0.492.02
Ave. farm0.412.12
Disclaimer/Publisher’s Note: The statements, opinions and data contained in all publications are solely those of the individual author(s) and contributor(s) and not of MDPI and/or the editor(s). MDPI and/or the editor(s) disclaim responsibility for any injury to people or property resulting from any ideas, methods, instructions or products referred to in the content.