Article

Study on the Delayed Hydraulic Response and Instability Mechanism of Low-Permeability Soil Slopes Under Heavy Rainfall and Snowmelt Conditions


1
School of Civil Engineering and Transportation, Northeast Forestry University, Harbin 150040, China
2
Institute of Cold Regions Science and Engineering, Northeast Forestry University, Harbin 150050, China
*
Author to whom correspondence should be addressed.
Water 2026, 18(5), 594; https://doi.org/10.3390/w18050594
Submission received: 14 January 2026 / Revised: 25 February 2026 / Accepted: 26 February 2026 / Published: 28 February 2026

Abstract

Rain-on-snow events in cold regions frequently trigger slope failures. This study elucidates the instability mechanism of low-permeability silty clay slopes under combined rainfall and snowmelt conditions. A refined numerical model was established based on the sequential coupling of SEEP/W and SLOPE/W, utilizing the Morgenstern-Price method for stability analysis. A rigorous mesh sensitivity analysis confirmed that a locally refined mesh of 0.2 m with exponential time-stepping is essential to eliminate numerical dispersion at the wetting front. Simulation results indicate a significant time-lag effect in stability response; the critical failure time lags behind rainfall cessation (e.g., ~8 h for moderate rain) due to gravity-driven moisture redistribution. Spatially, the slope toe reaches saturation first, generating excess pore-water pressure and suggesting a tendency toward retrogressive instability. Furthermore, snowmelt superposition functions as a continuous hydraulic load, creating a base flow effect that advances the acceleration phase of failure by 1–2 h and further reduces the minimum safety factor. These findings highlight the critical role of the slope toe saturation and the necessity of considering snowmelt intensity in landslide early warning systems for cold regions.

1. Introduction

Soil slopes constitute fundamental components of modern transportation infrastructure and civil engineering systems; therefore, their stability is vital for ensuring the safe and long-term operation of these facilities. Among various triggering factors, rainfall is recognized as the primary cause of slope instability, resulting in significant casualties and economic losses globally each year [1,2,3]. Theoretical studies and engineering practice indicate that the loss of matric suction in the unsaturated zone and the formation of transient saturated zones due to rainfall infiltration are key mechanisms leading to slope failure [4,5]. Consequently, rainfall-induced slope instability has long been a critical research topic in geological hazard prevention [6,7]. This issue is particularly pronounced in high-latitude cold regions, such as northeastern China. In these areas, heavy seasonal rainfall often coincides with spring snowmelt—a phenomenon known as “Rain-on-Snow” (ROS)—leading to frequent shallow and deep landslide hazards due to deep winter snow accumulation [8]. Therefore, an in-depth investigation into the seepage field evolution and stability response mechanisms of unsaturated soil slopes under such complex hydrological conditions holds significant theoretical and engineering importance for disaster mitigation in cold regions [9].
Regarding the mechanisms of rainfall infiltration and slope stability, numerous scholars worldwide have conducted extensive research. For example, Liu et al. [10] conducted a case study on the Hongyacun landslide in Qinghai Province, China. By combining field surveys, high-density electrical resistivity tomography, and numerical simulation, they systematically analyzed the spatiotemporal distribution of pore water pressure, volumetric water content, and shear strain within the landslide mass. Their results indicated that rainfall infiltration significantly altered seepage characteristics, leading to a sharp rise in pore water pressure and a substantial decrease in shear strength, thereby reducing overall stability. Yi et al. [11] utilized multi-source monitoring equipment to track real-time slope displacement and internal stress variations, analyzing macroscopic deformation characteristics under different rainfall conditions and validating the results using GeoStudio numerical simulations. Fang et al. [12] proposed a stability analysis method for unsaturated slopes based on the principle of minimum potential energy, revealing the influence of rainfall intensity and slope angle. Gu et al. [13] evaluated failure mechanisms through red clay column infiltration experiments, identifying prolonged heavy rainfall as a key condition for landslide formation. Recently, researchers have further explored the coupling effects of rainfall characteristics and soil permeability. For instance, Qu et al. [14] conducted model tests and revealed that the slope failure mode transitions from retrogressive failure to flow slide as rainfall intensity increases. Regarding low-permeability soils, Kim et al. [15] analyzed historical rainfall records in Singapore and found that the stability of such slopes is primarily controlled by long-duration cumulative rainfall rather than peak daily intensity, implying a significant time-dependent response. Furthermore, Zhang et al. [16] investigated the instability mechanism of low-permeability clay slopes in Anhui, China. They emphasized that while intact clay impedes infiltration, structural defects like desiccation cracks can create preferential flow pathways, significantly accelerating infiltration and inducing slope failure.
Despite these advancements, existing studies still exhibit certain limitations. First, the majority of research focuses primarily on stability variations during rainfall events [17], often overlooking the time-lag effect in pore water pressure response caused by moisture redistribution after rainfall ceases. Engineering practice indicates that a significant number of landslides occur hours or even days after rainfall has stopped [18,19,20]. Neglecting this time-lag effect may lead to an overestimation of slope stability, creating blind spots in early warning systems. Second, most existing models consider only single rainfall scenarios or focus on temperate regions, lacking quantitative analysis of the superimposed “rainfall plus snowmelt” effect unique to cold regions [21,22]. This makes it difficult to accurately reflect the hydraulic response characteristics of slopes in alpine or high-latitude areas.
In light of this, this study takes a typical low-permeability silty clay slope as an example to bridge these gaps. Using the finite element software GeoStudio 2023.1 (Seequent, Christchurch, New Zealand), a refined numerical model is established based on unsaturated soil theory. Following rigorous mesh sensitivity verification, the slope response under different rainfall intensities and the combined “rainfall plus snowmelt” scenario is systematically simulated. The principal conclusions of this work highlight that: (1) A refined mesh of 0.2 m is essential to eliminate numerical dispersion and capture the wetting front; (2) A significant time-lag effect exists where the minimum safety factor lags behind rainfall cessation due to moisture redistribution; (3) The slope toe reaches saturation first, indicating a high potential for retrogressive instability; and (4) Snowmelt superposition accelerates the instability process and reduces the safety margin, which must be considered in early warning systems for cold regions.

2. Materials and Methods

2.1. Numerical Model Construction

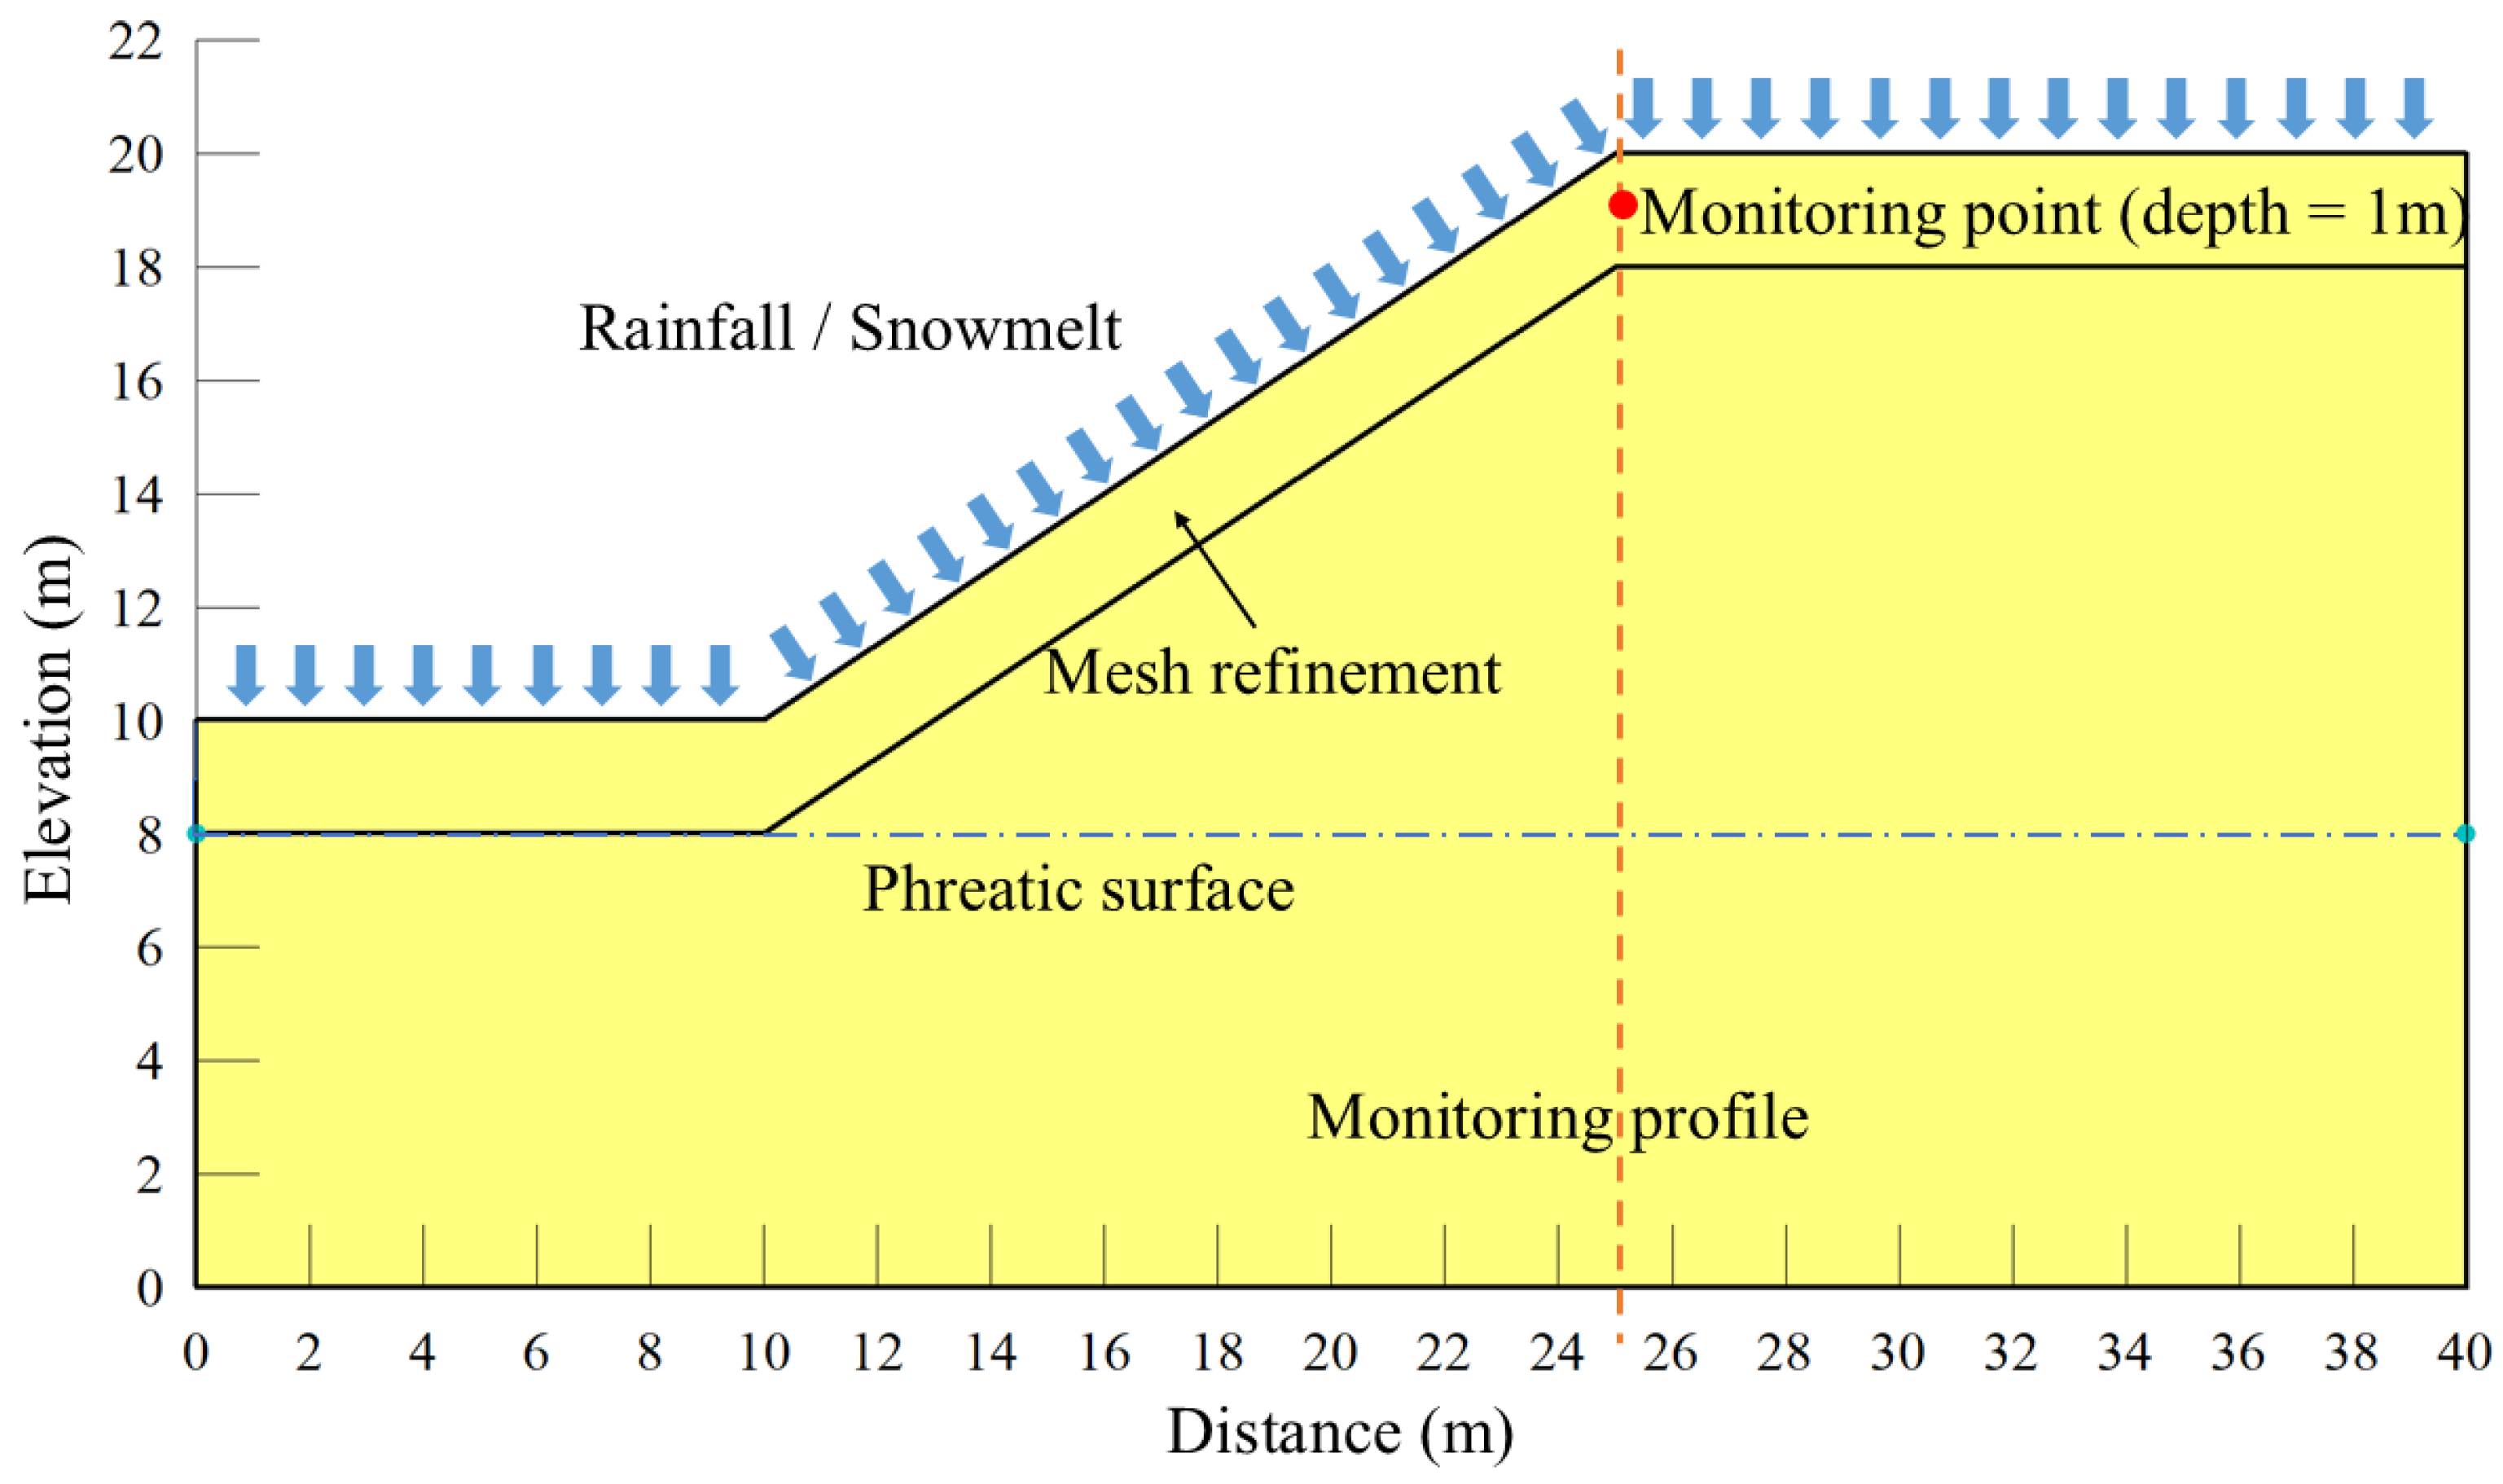
Based on a typical highway slope in Heilongjiang Province, China, a two-dimensional generalized numerical model was established (as shown in Figure 1). The slope consists of homogeneous silty clay. This soil type was selected because it is widely distributed in the seasonally frozen regions of Northeast China. Furthermore, its low permeability characteristics make it an ideal medium for investigating the time-lag effect caused by moisture redistribution, which is less significant in high-permeability soils. The adoption of a homogeneous soil model aims to isolate the specific impacts of rainfall intensity and snowmelt on slope stability, which is consistent with the methodology applied in previous studies [1,15]. The specific geometric dimensions are as follows: the slope height is 10 m with a slope ratio of 1:1.5, the crest width is 15 m, and the foundation soil thickness is 10 m. The initial groundwater table was set at 8 m above the slope toe.
To accurately simulate the transient infiltration process in unsaturated soil and the dynamic response of slope stability, the numerical analysis was performed using the GeoStudio software suite. First, a transient saturated-unsaturated seepage analysis was conducted using the SEEP/W module. Subsequently, the computed transient pore-water pressure distribution was directly coupled to the SLOPE/W module, serving as the input condition for the stability analysis [23,24].
The Factor of Safety (FOS) was calculated using the Morgenstern-Price limit equilibrium method [25,26]. This method satisfies both force and moment equilibrium conditions and is capable of analyzing slip surfaces of arbitrary shapes to accurately determine the minimum FOS and the critical slip surface location. Through the sequential coupling of SEEP/W and SLOPE/W, the entire process—from rainfall infiltration and pore-water pressure evolution to shear strength degradation and dynamic FOS variation—was simulated. This systematically reveals the dynamic decay characteristics and time-lag response of slope stability during and after rainfall events.

2.2. Soil Hydraulic and Mechanical Properties

The slope material consists of homogeneous silty clay. The mechanical behavior of the soil was simulated using the elastoplastic Mohr-Coulomb constitutive model. The specific physical and mechanical parameters, including unit weight, effective cohesion, and internal friction angle, are summarized in Table 1.
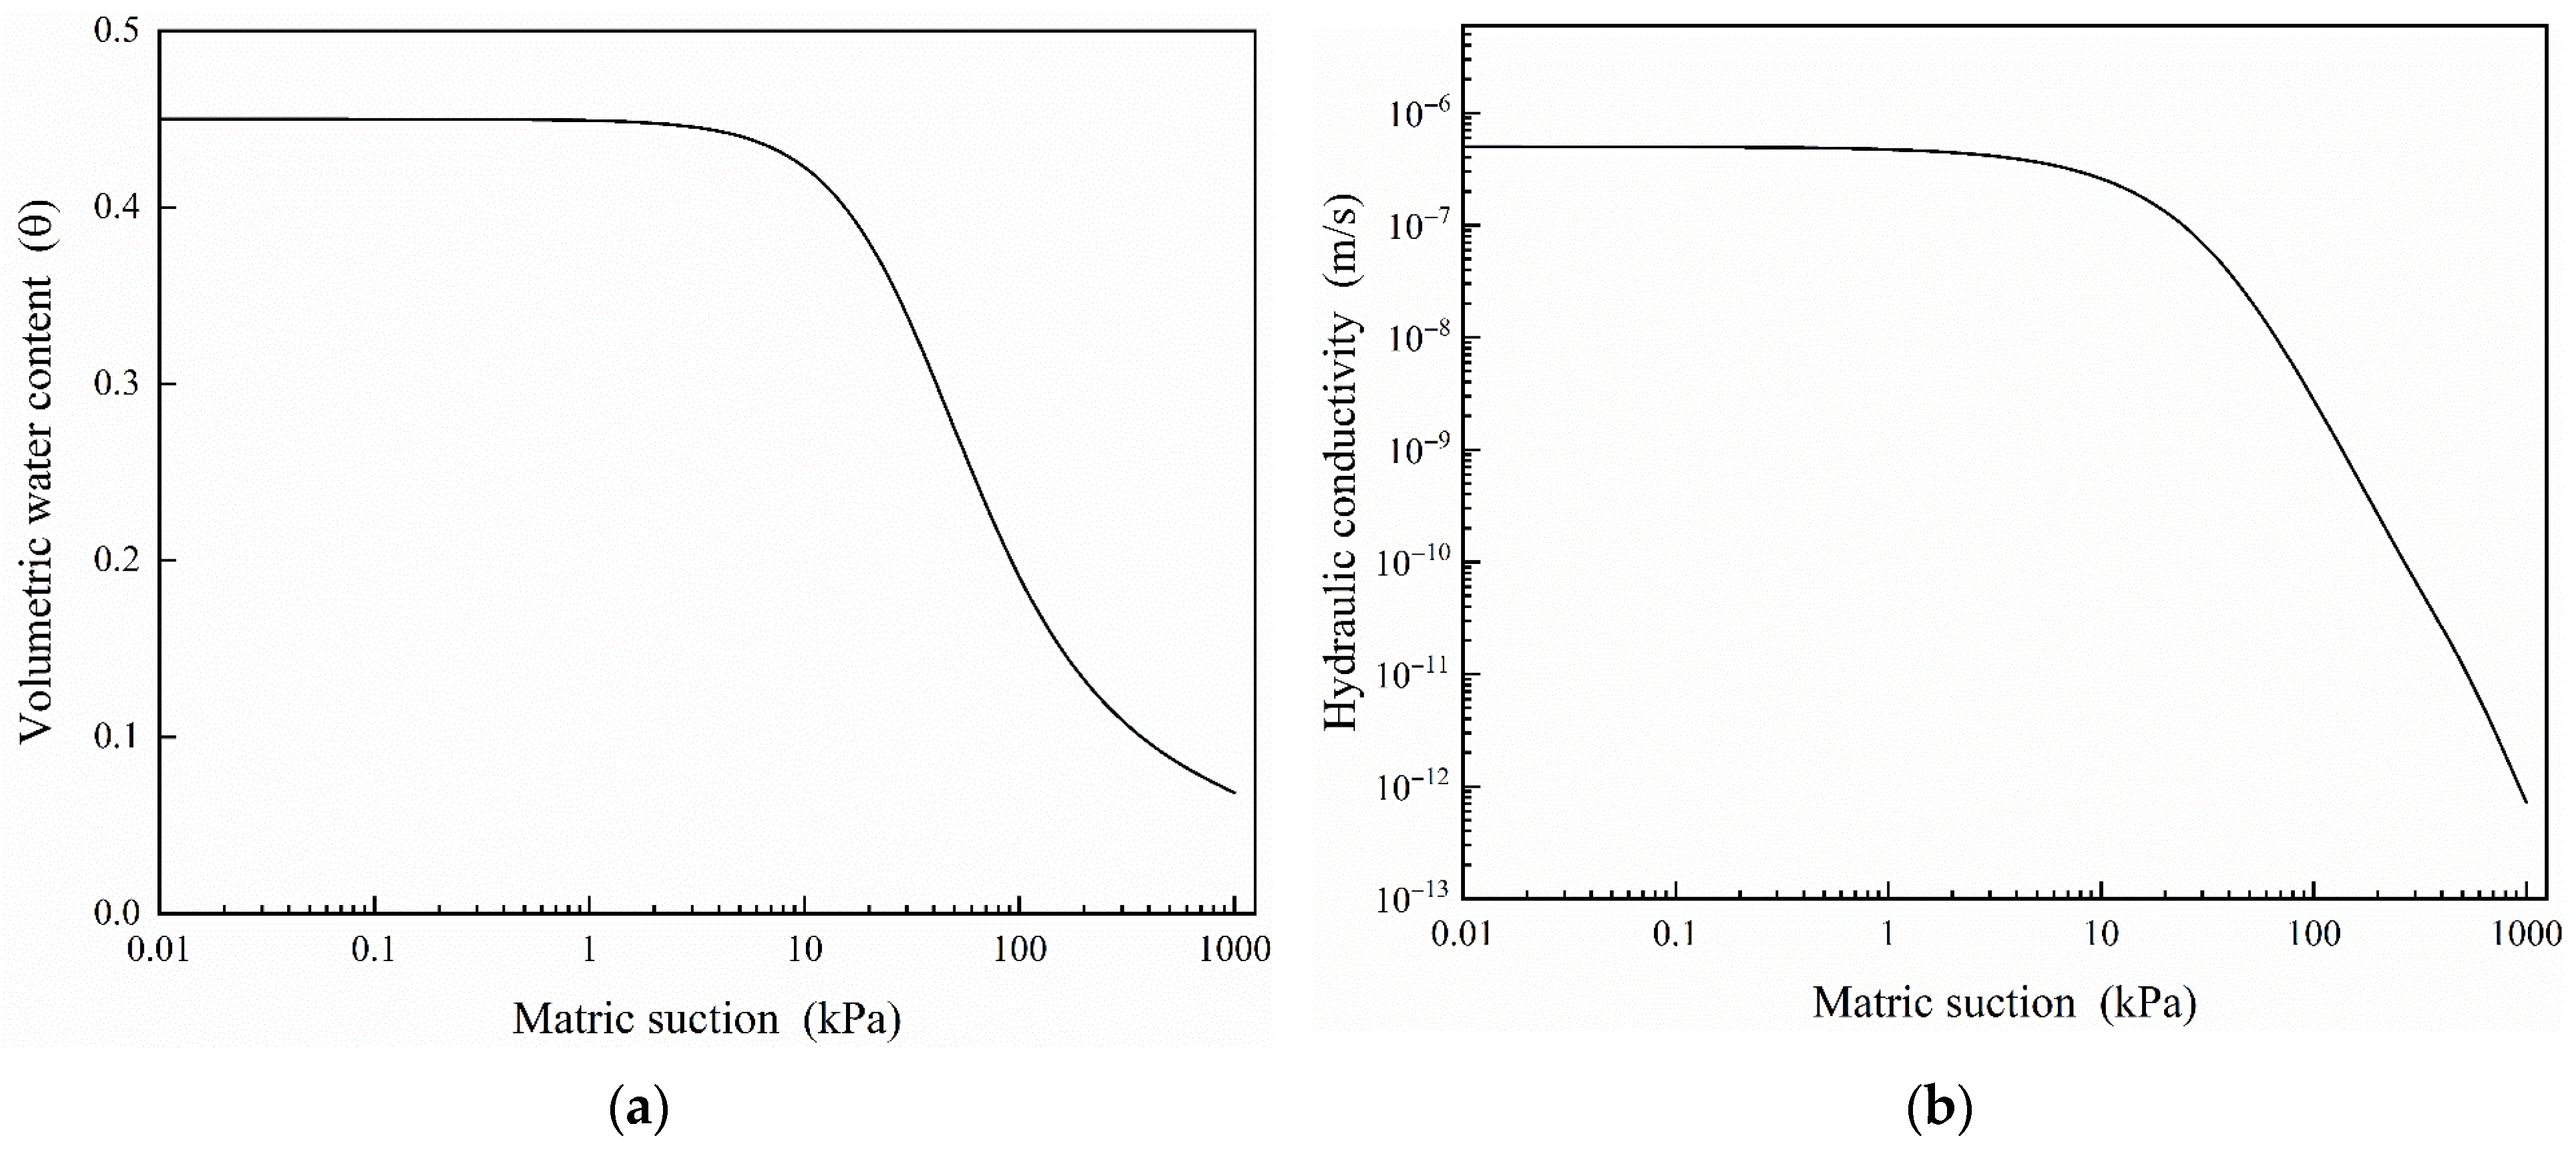
To accurately characterize the hydraulic properties of the unsaturated soil, the estimation method based on sample functions built into SEEP/W was employed. First, the Soil-Water Characteristic Curve (SWCC) was estimated using the Van Genuchten model based on the saturated volumetric water content (as shown in Figure 2a). It should be noted that the hydraulic hysteresis of the SWCC was not considered in this numerical model. A single representative SWCC was adopted to simplify the analysis and focus on the hydrodynamic time-lag effect of the slope system. Subsequently, the hydraulic conductivity function was predicted using the Fredlund–Xing model [27,28,29] based on the obtained SWCC and the saturated hydraulic conductivity (as shown in Figure 2b).

2.3. Mesh Sensitivity Verification

In finite element analysis, the accuracy of mesh discretization determines the reliability of numerical results. Since rainfall infiltration primarily affects the shallow slope layer, where extremely steep matric suction gradients exist at the wetting front, coarse meshing can induce significant numerical dispersion errors. Therefore, a rigorous mesh sensitivity analysis was conducted prior to the parametric study.
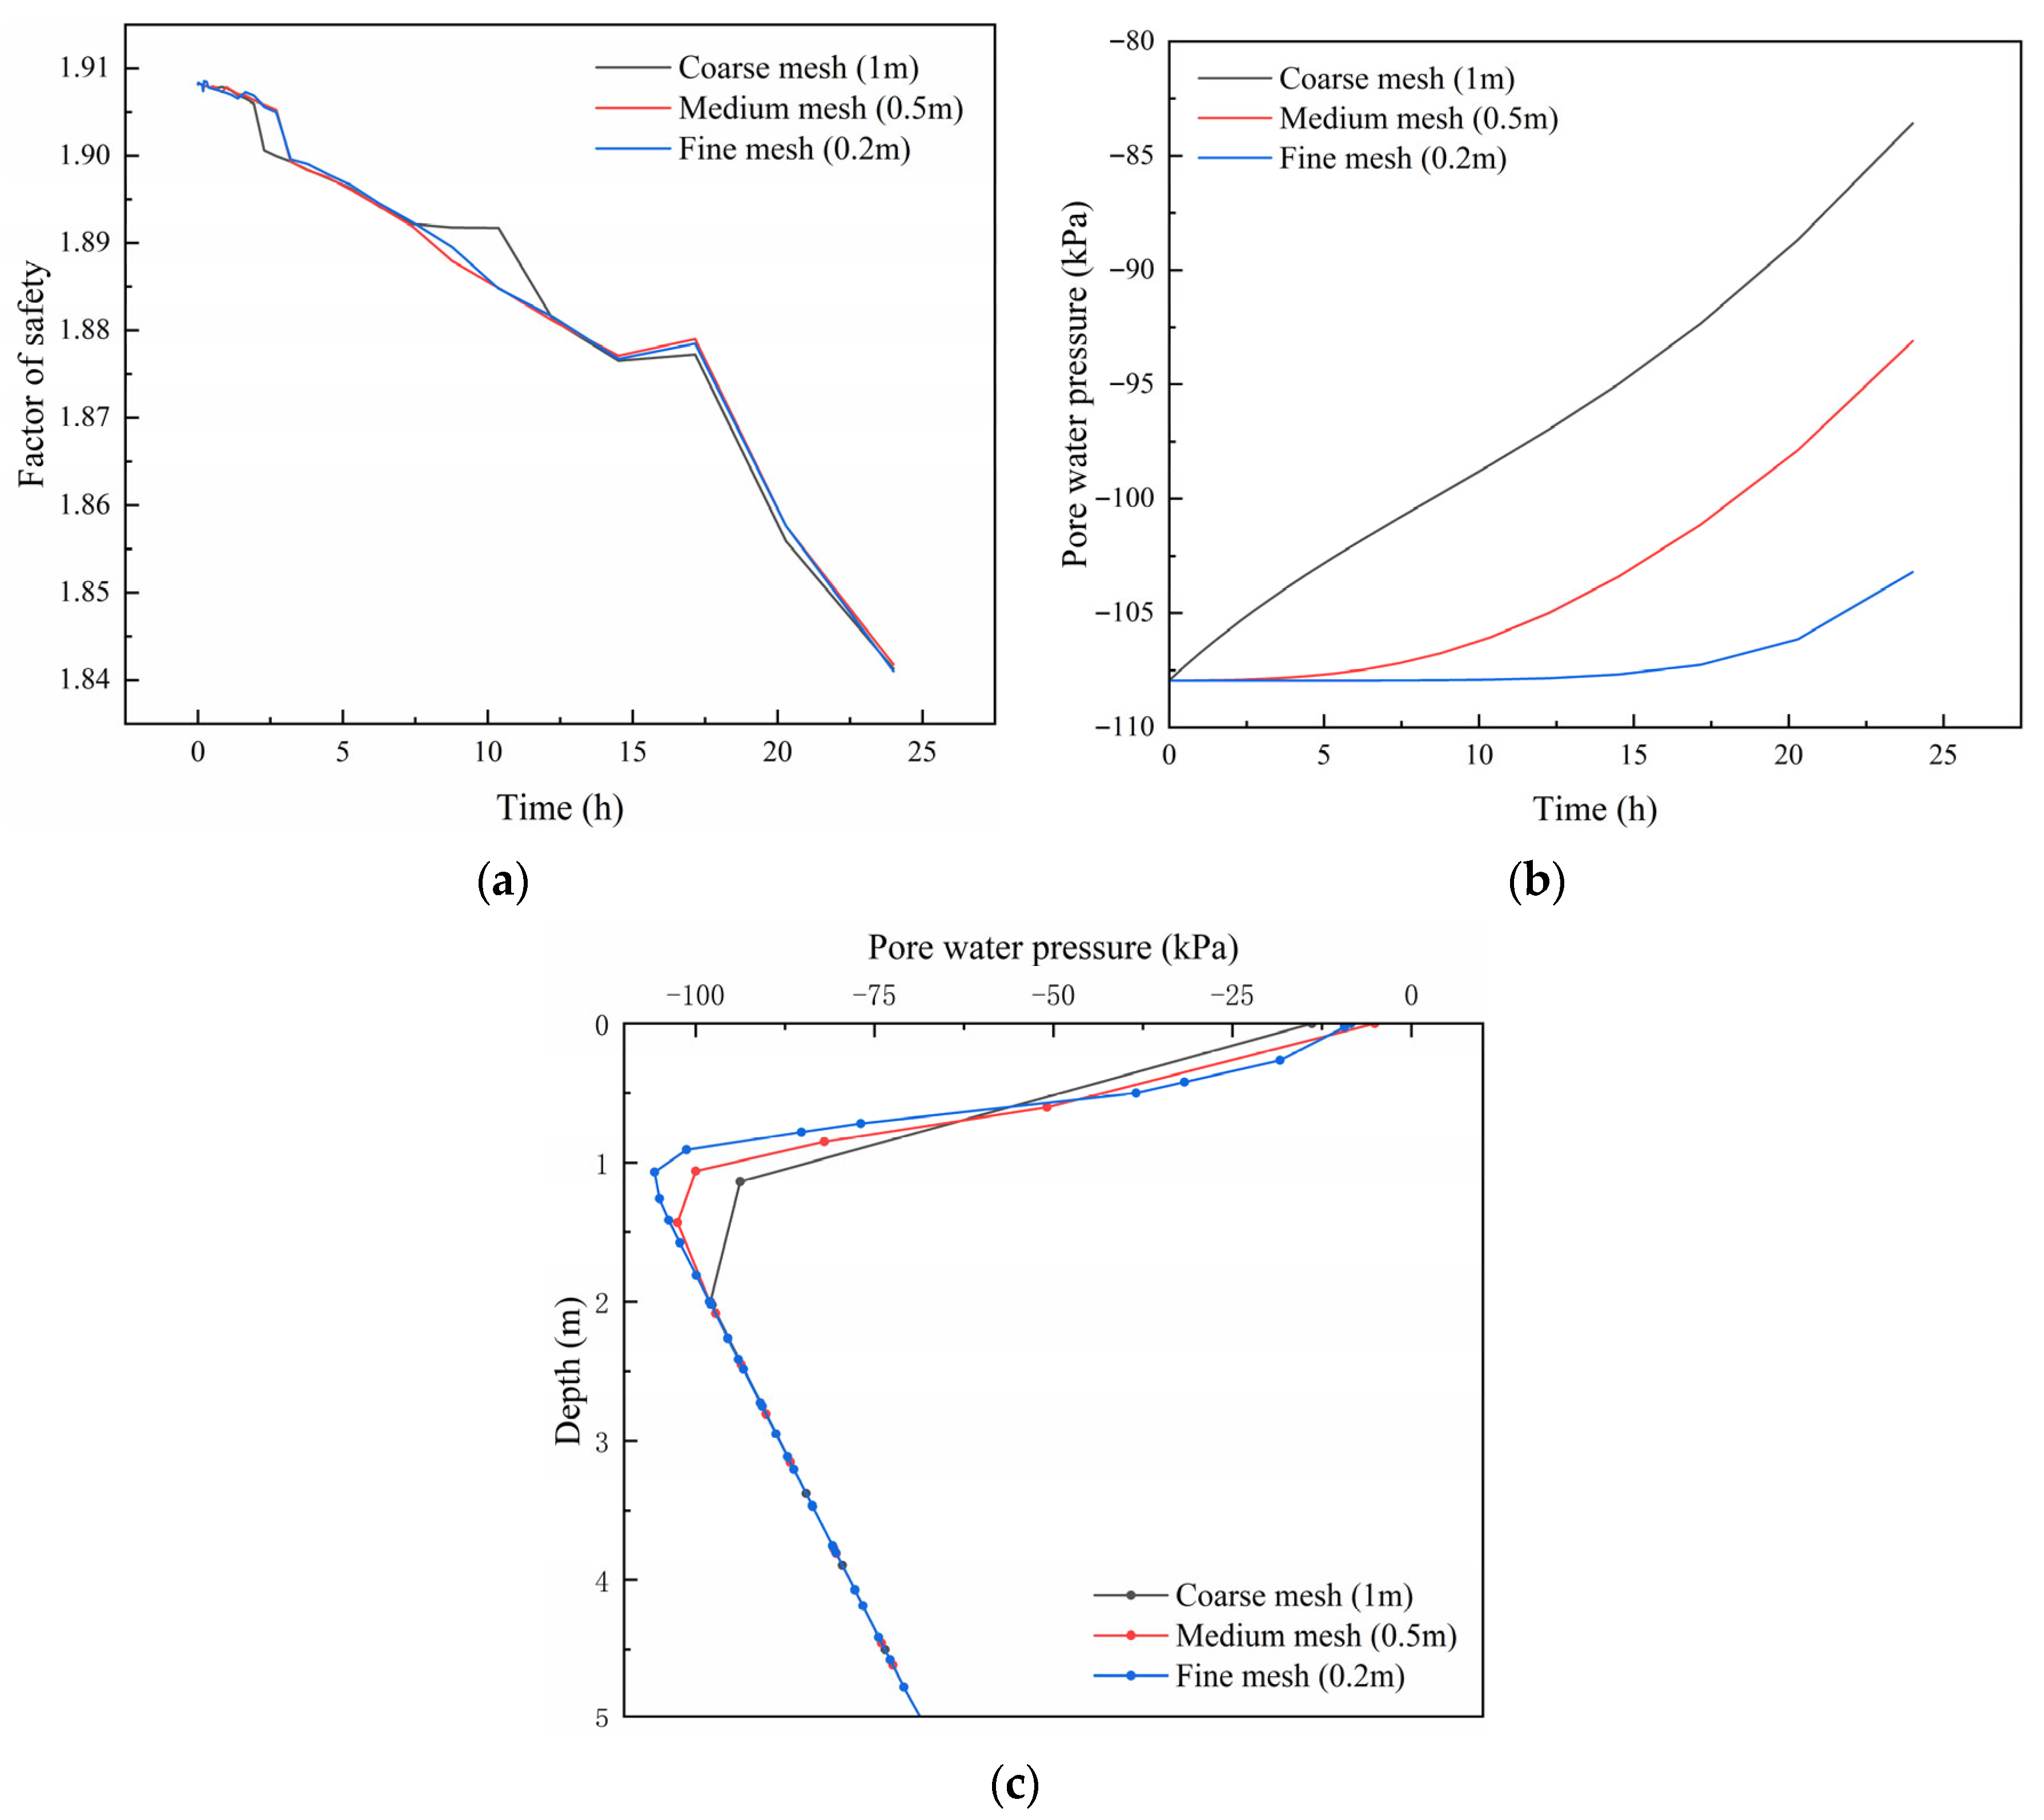
Three comparative models with different mesh densities were established using GeoStudio: coarse (1.0 m), medium (0.5 m), and fine (0.2 m). A local refinement strategy was applied to the surface infiltration zone (as shown in Figure 3), while the deep soil maintained a 1.0 m mesh. Transition elements between regions were automatically generated. The analysis was performed under a consistent violent rainfall scenario (90 mm/d for 24 h). To evaluate mesh performance, key monitoring points and sections were defined to record the temporal evolution and spatial distribution of pore-water pressure (PWP). The comparison results are shown in Figure 4.
(1)
Convergence of Factor of Safety (Figure 4a)
Figure 4a illustrates the time-history evolution of the Factor of Safety (FOS). The overall declining trends are highly consistent across the three mesh sizes. At the end of rainfall (t = 24 h), the maximum deviation between the coarse and fine meshes is only 0.001, indicating that numerical convergence has been achieved for global stability analysis. However, the curve for the coarse mesh (1.0 m) exhibits localized stepped fluctuations, which are numerical artifacts caused by the wetting front crossing large element boundaries. In contrast, the fine mesh (0.2 m) yields a smooth and continuous decline, capturing the progressive degradation of slope stability.
(2)
Temporal Accuracy of PWP Response (Figure 4b)
Figure 4b depicts the PWP time-history at the monitoring point (1.0 m depth). The coarse mesh predicts a significant pressure rise during the early stage (0–5 h). Given the low permeability of the silty clay, it is physically unrealistic for moisture to infiltrate to this depth so quickly. This “premature response” is a numerical artifact caused by excessive element size. Conversely, the fine mesh maintains a stable suction for the first 15 h, demonstrating a distinct response lag consistent with the physical arrival of the wetting front. Quantitatively, the coarse mesh overestimates the PWP increase (25 kPa), whereas the fine mesh yields a more accurate increase (5 kPa). This confirms that the refined mesh effectively eliminates numerical dispersion
(3)
Spatial Capture of Wetting Front (Figure 4c)
Figure 4c compares the PWP profiles along the vertical section at the slope crest at rainfall cessation (t = 24 h). The coarse mesh results display a distinct jagged pattern near the wetting front due to numerical averaging, failing to describe the nonlinear suction decay. In contrast, the fine mesh presents a smooth, continuous, nonlinear curve, accurately capturing the spatial position and steep hydraulic gradient of the wetting front
Based on the above analysis, this study ultimately selected 0.2 m as the size for the surface-refined mesh. Simultaneously, to ensure the convergence and accuracy of the numerical calculations, an exponential growth mode was adopted for the time step settings. The initial time step was set to 0.001 h, with a total of 72 steps.

2.4. Boundary Conditions and Simulation Scenarios

2.4.1. Boundary Conditions

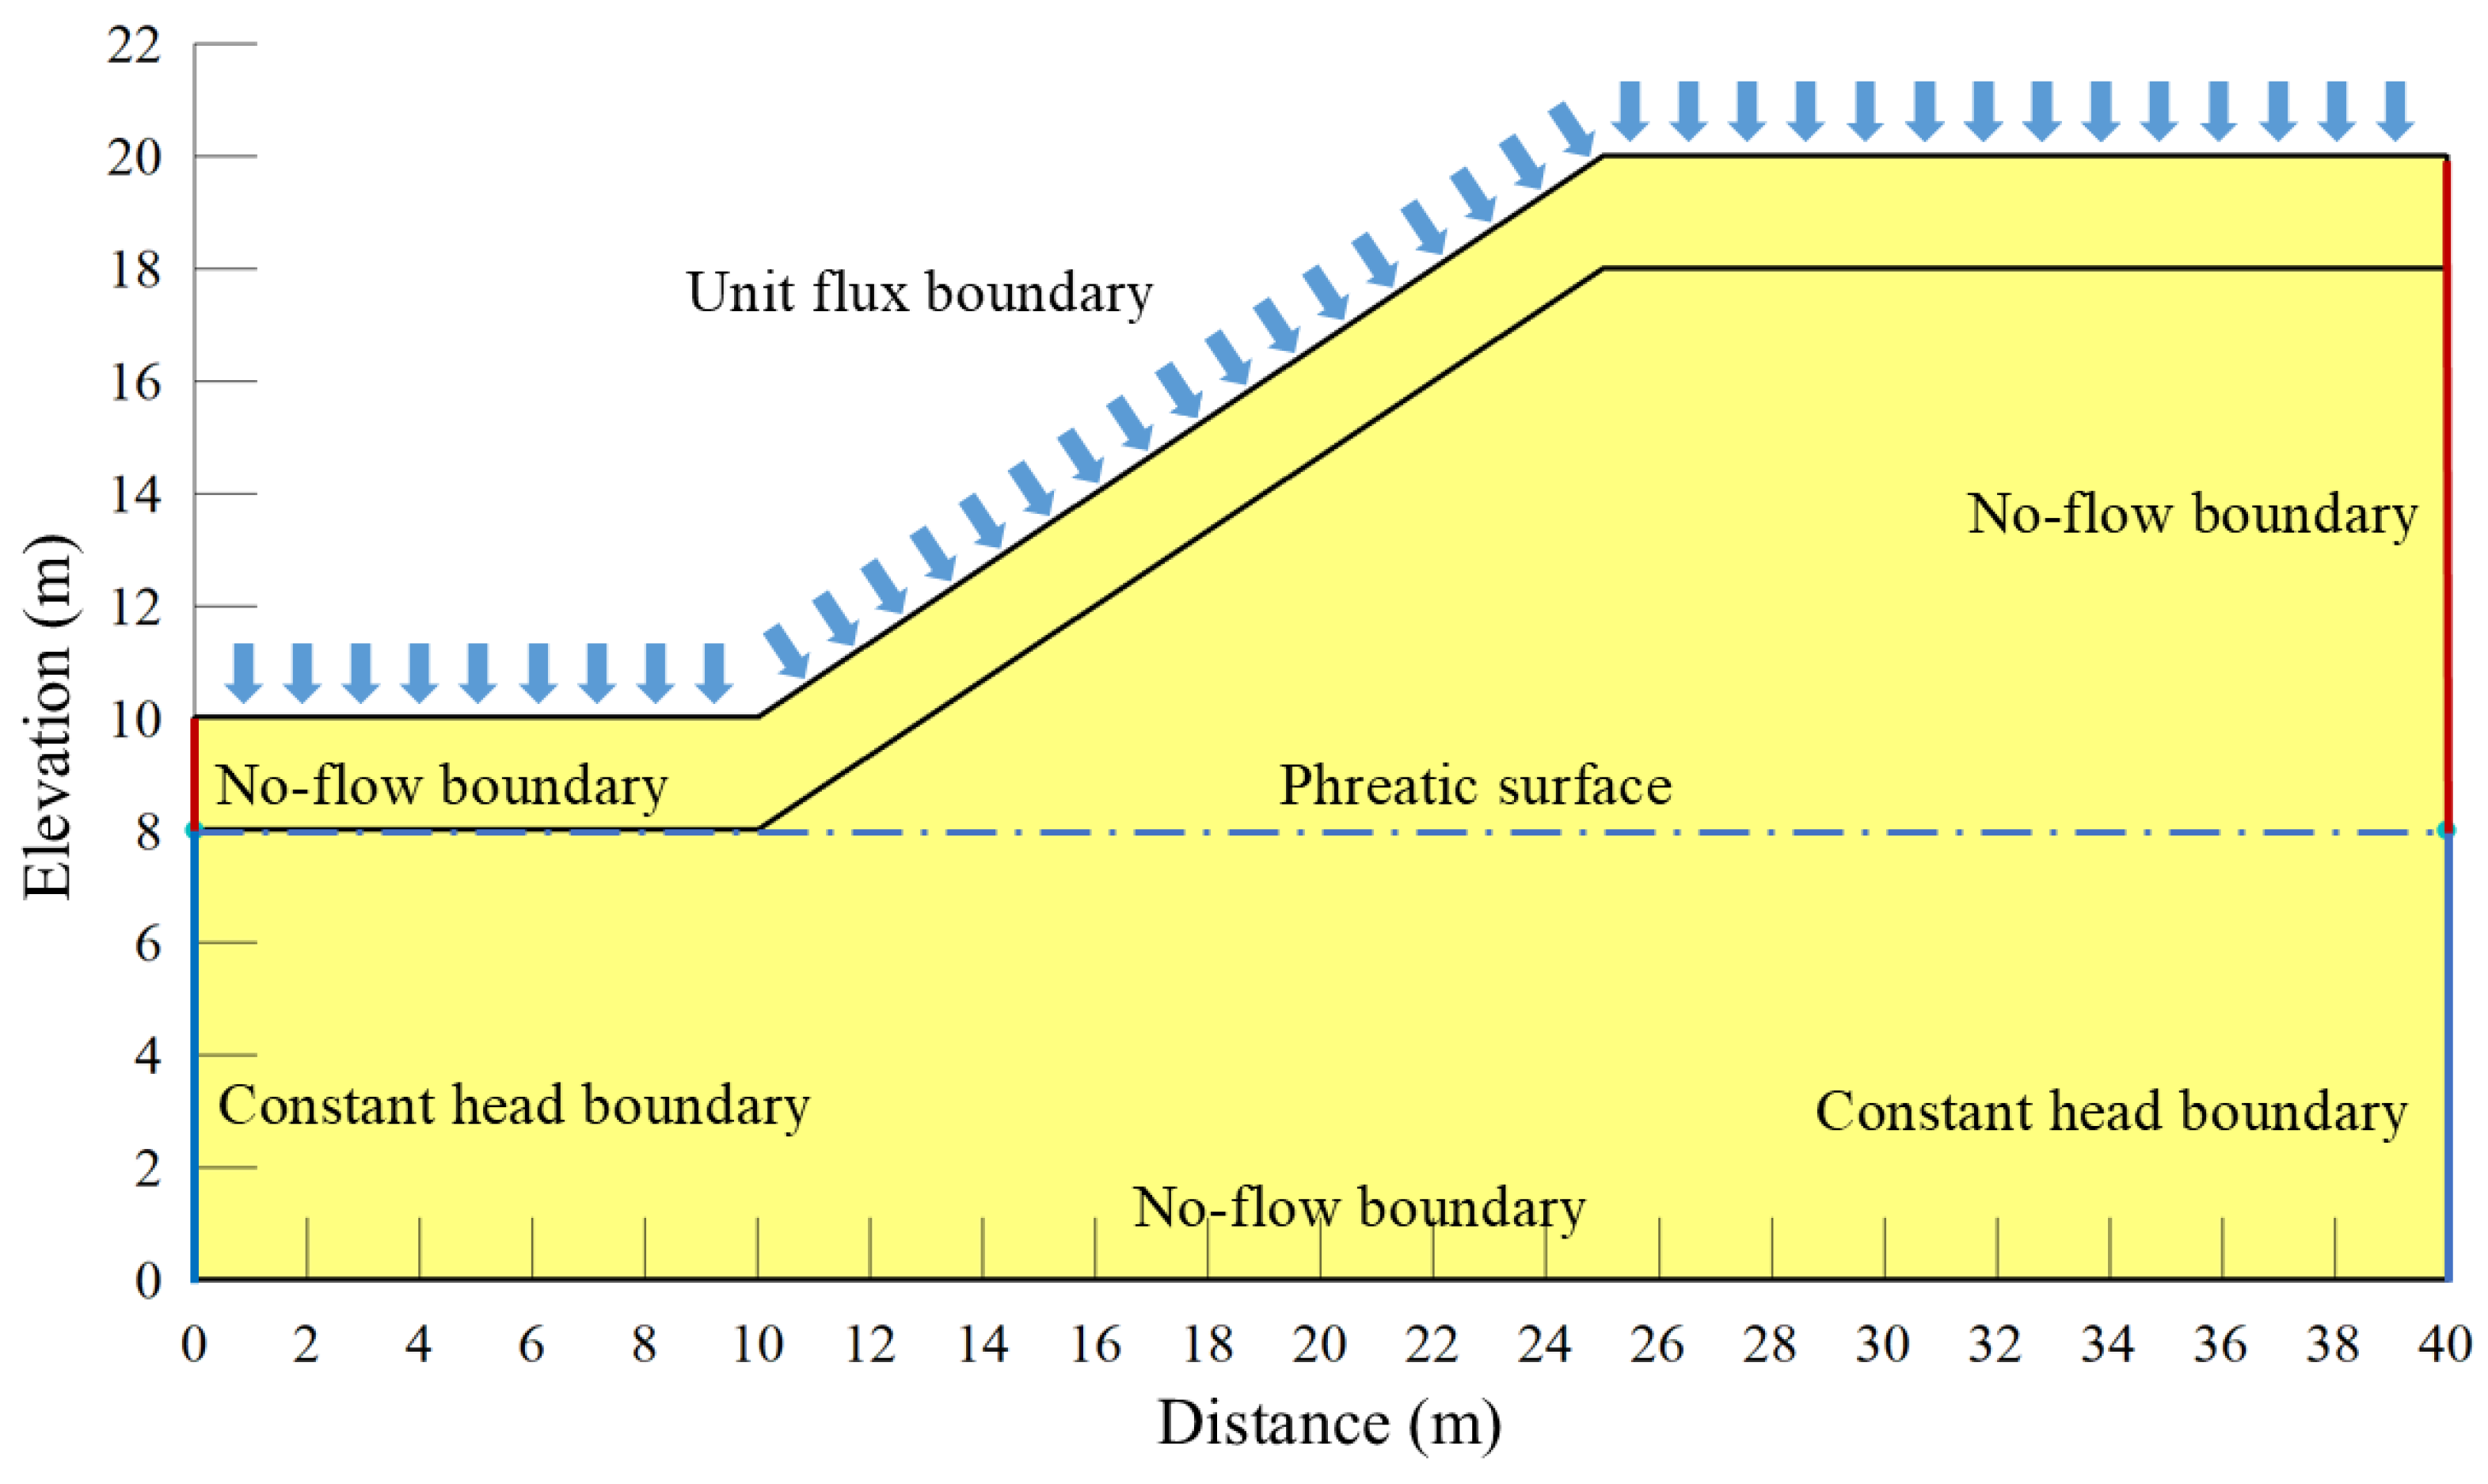
Figure 5 illustrates the boundary conditions configured for the simulations in this study.
Initial Steady-State Seepage Field
Based on the generalized model, the initial groundwater level (phreatic surface) was located 8 m above the slope toe. It is important to note that this relatively high phreatic surface was specifically selected to represent the “worst-case hydrogeological scenario” characteristic of the spring thaw period in Northeast China. During this season, the infiltration of accumulated snowmelt significantly recharges the groundwater system, leading to a seasonal peak in the water table.
  • Lateral Boundaries: The lateral boundaries below the water table were set as Constant Head boundaries, with the total head equal to the nodal elevation, simulating steady recharge from distant groundwater. The boundaries above the water table were defined as No-flow boundaries.
  • Bottom Boundary: The bottom of the model was assumed to be impermeable bedrock and was set as a No-flow boundary.
  • Initial Condition: The pore-water pressure distribution (matric suction) obtained from the steady-state analysis was directly imported as the Parent Analysis result for the subsequent transient analysis [30,31].
Transient Rainfall and Infiltration Boundary
In the transient analysis, a Unit Flux boundary was applied to the slope crest and surface layer to simulate atmospheric rainfall and snowmelt infiltration [32]. A time-dependent flux function: q t , was defined to simulate the entire event.
  • Potential Seepage Face: A “Potential Seepage Face” review option was enabled along the surface boundary. This allows excess water to drain as surface runoff when the infiltration capacity is exceeded (i.e., pore-water pressure ≥ 0).
  • Simulation Phases: The total simulation duration was 36 h, divided into two phases: Infiltration Phase (0–24 h): A constant or variable rainfall/snowmelt intensity was applied.
  • Drainage/Redistribution Phase (24–36 h): The flux abruptly dropped to 0, simulating moisture dissipation and redistribution after rainfall cessation to observe time-lag effect.
Snowmelt Superposition
To address the specific influence of snowmelt in cold regions, a comparative superposition scenario was designed. Using the principle of superposition, snowmelt was conceptualized as a constant background base flow added to the rainfall intensity simultaneously. The total infiltration intensity, q t o t a l , is defined as the sum of the rainfall intensity, q r a i n , and the snowmelt intensity, q s n o w .

2.4.2. Simulation Scenarios

To investigate the mechanism of rainfall intensity on slope stability, representative simulation scenarios were designed based on the national standard “Grade of Precipitation” (GB/T 28592-2012) [33]. The classification criteria for rainfall intensity are listed in Table 2.
Based on the aforementioned criteria, this study selected three typical constant rainfall intensities for simulation: moderate rain, heavy rain, and violent rain (details provided in Table 2). For each scenario, the effective rainfall duration was set to 24 h, and the intensity remained constant during the infiltration phase. This experimental design aims to systematically reveal the dynamic evolution patterns of the internal seepage field and the safety factor under long-duration, uniform rainfall of different magnitudes [34,35].
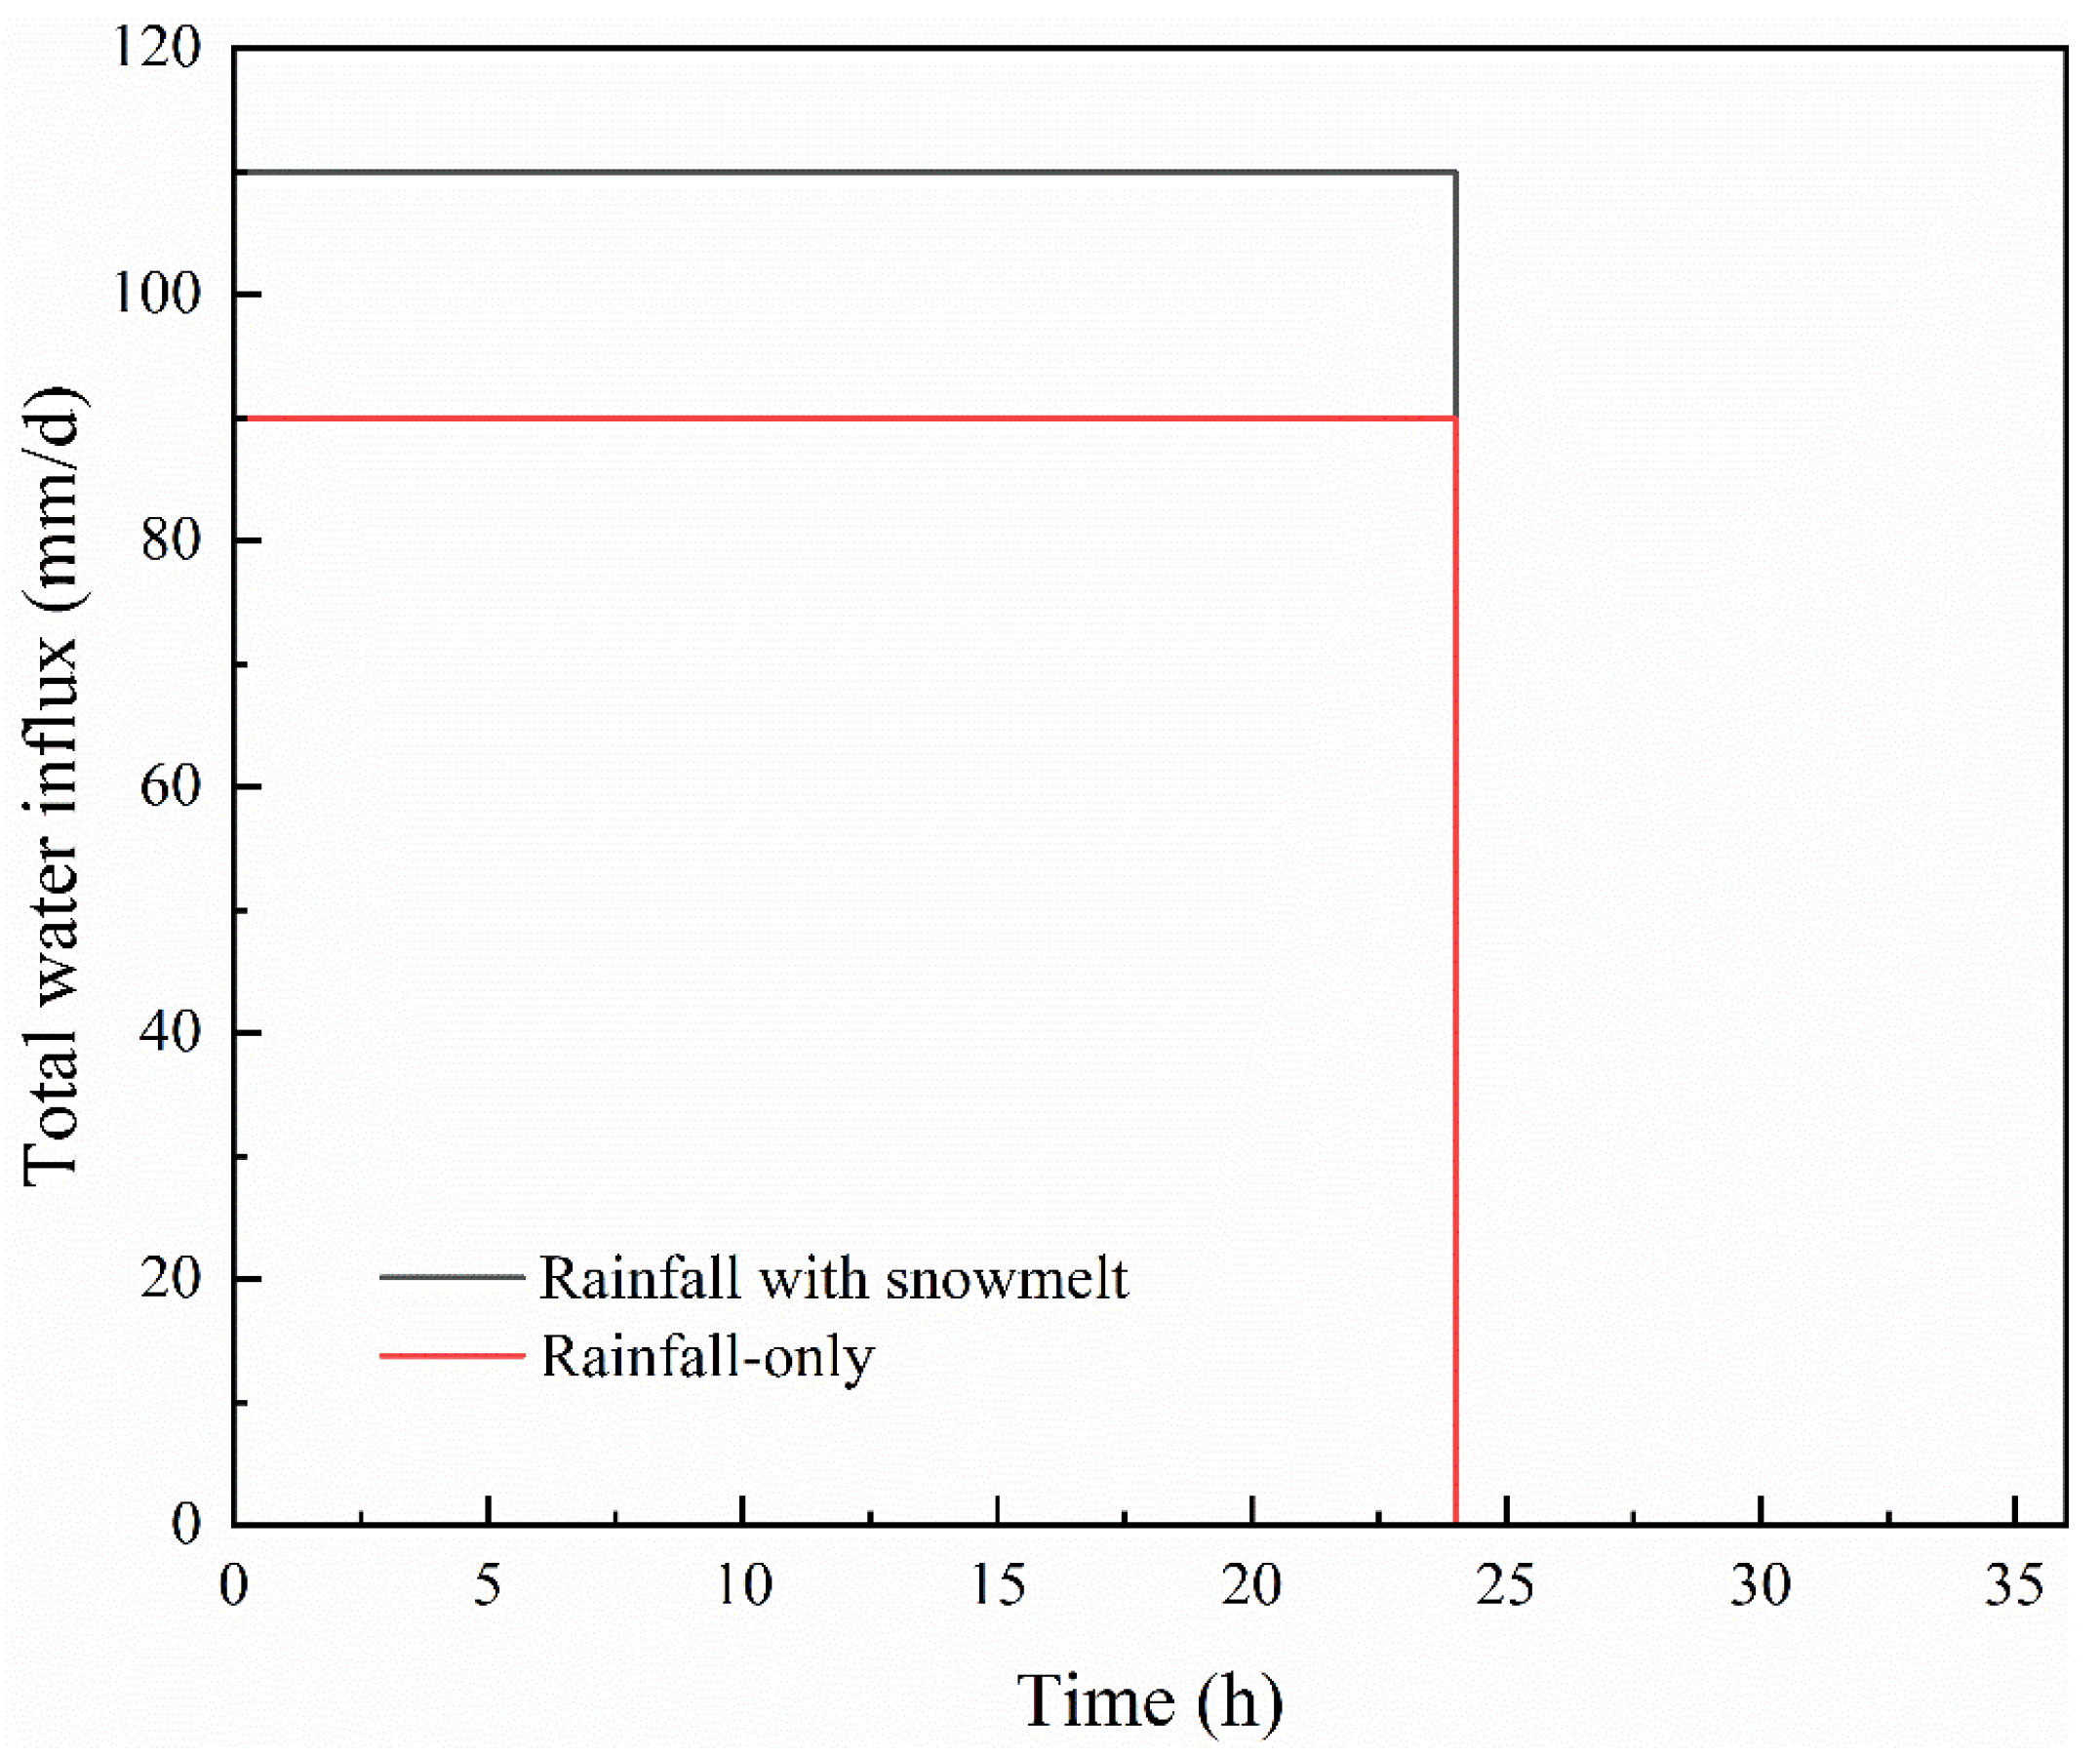
Furthermore, to quantify the impact of snowmelt in cold regions, a comparative study was designed based on the superposition principle. Snowmelt was generalized as a constant background base flow (20 mm/d) added to the violent rainfall intensity (90 mm/d). This simplification assumes that the active layer of the slope is fully thawed and permeable during the spring melting period, representing a worst-case hydraulic scenario where infiltration is not impeded by frozen soil. Figure 6 illustrates the time-history of the total water influx for both scenarios. It can be seen that the input flux for the snowmelt scenario is consistently higher during the infiltration phase (0–24 h), while both scenarios cease input simultaneously at t = 24 h to ensure comparable durations. The detailed simulation parameters for these scenarios are summarized in Table 2.

3. Results

3.1. Influence of Rainfall Intensity on Slope Stability

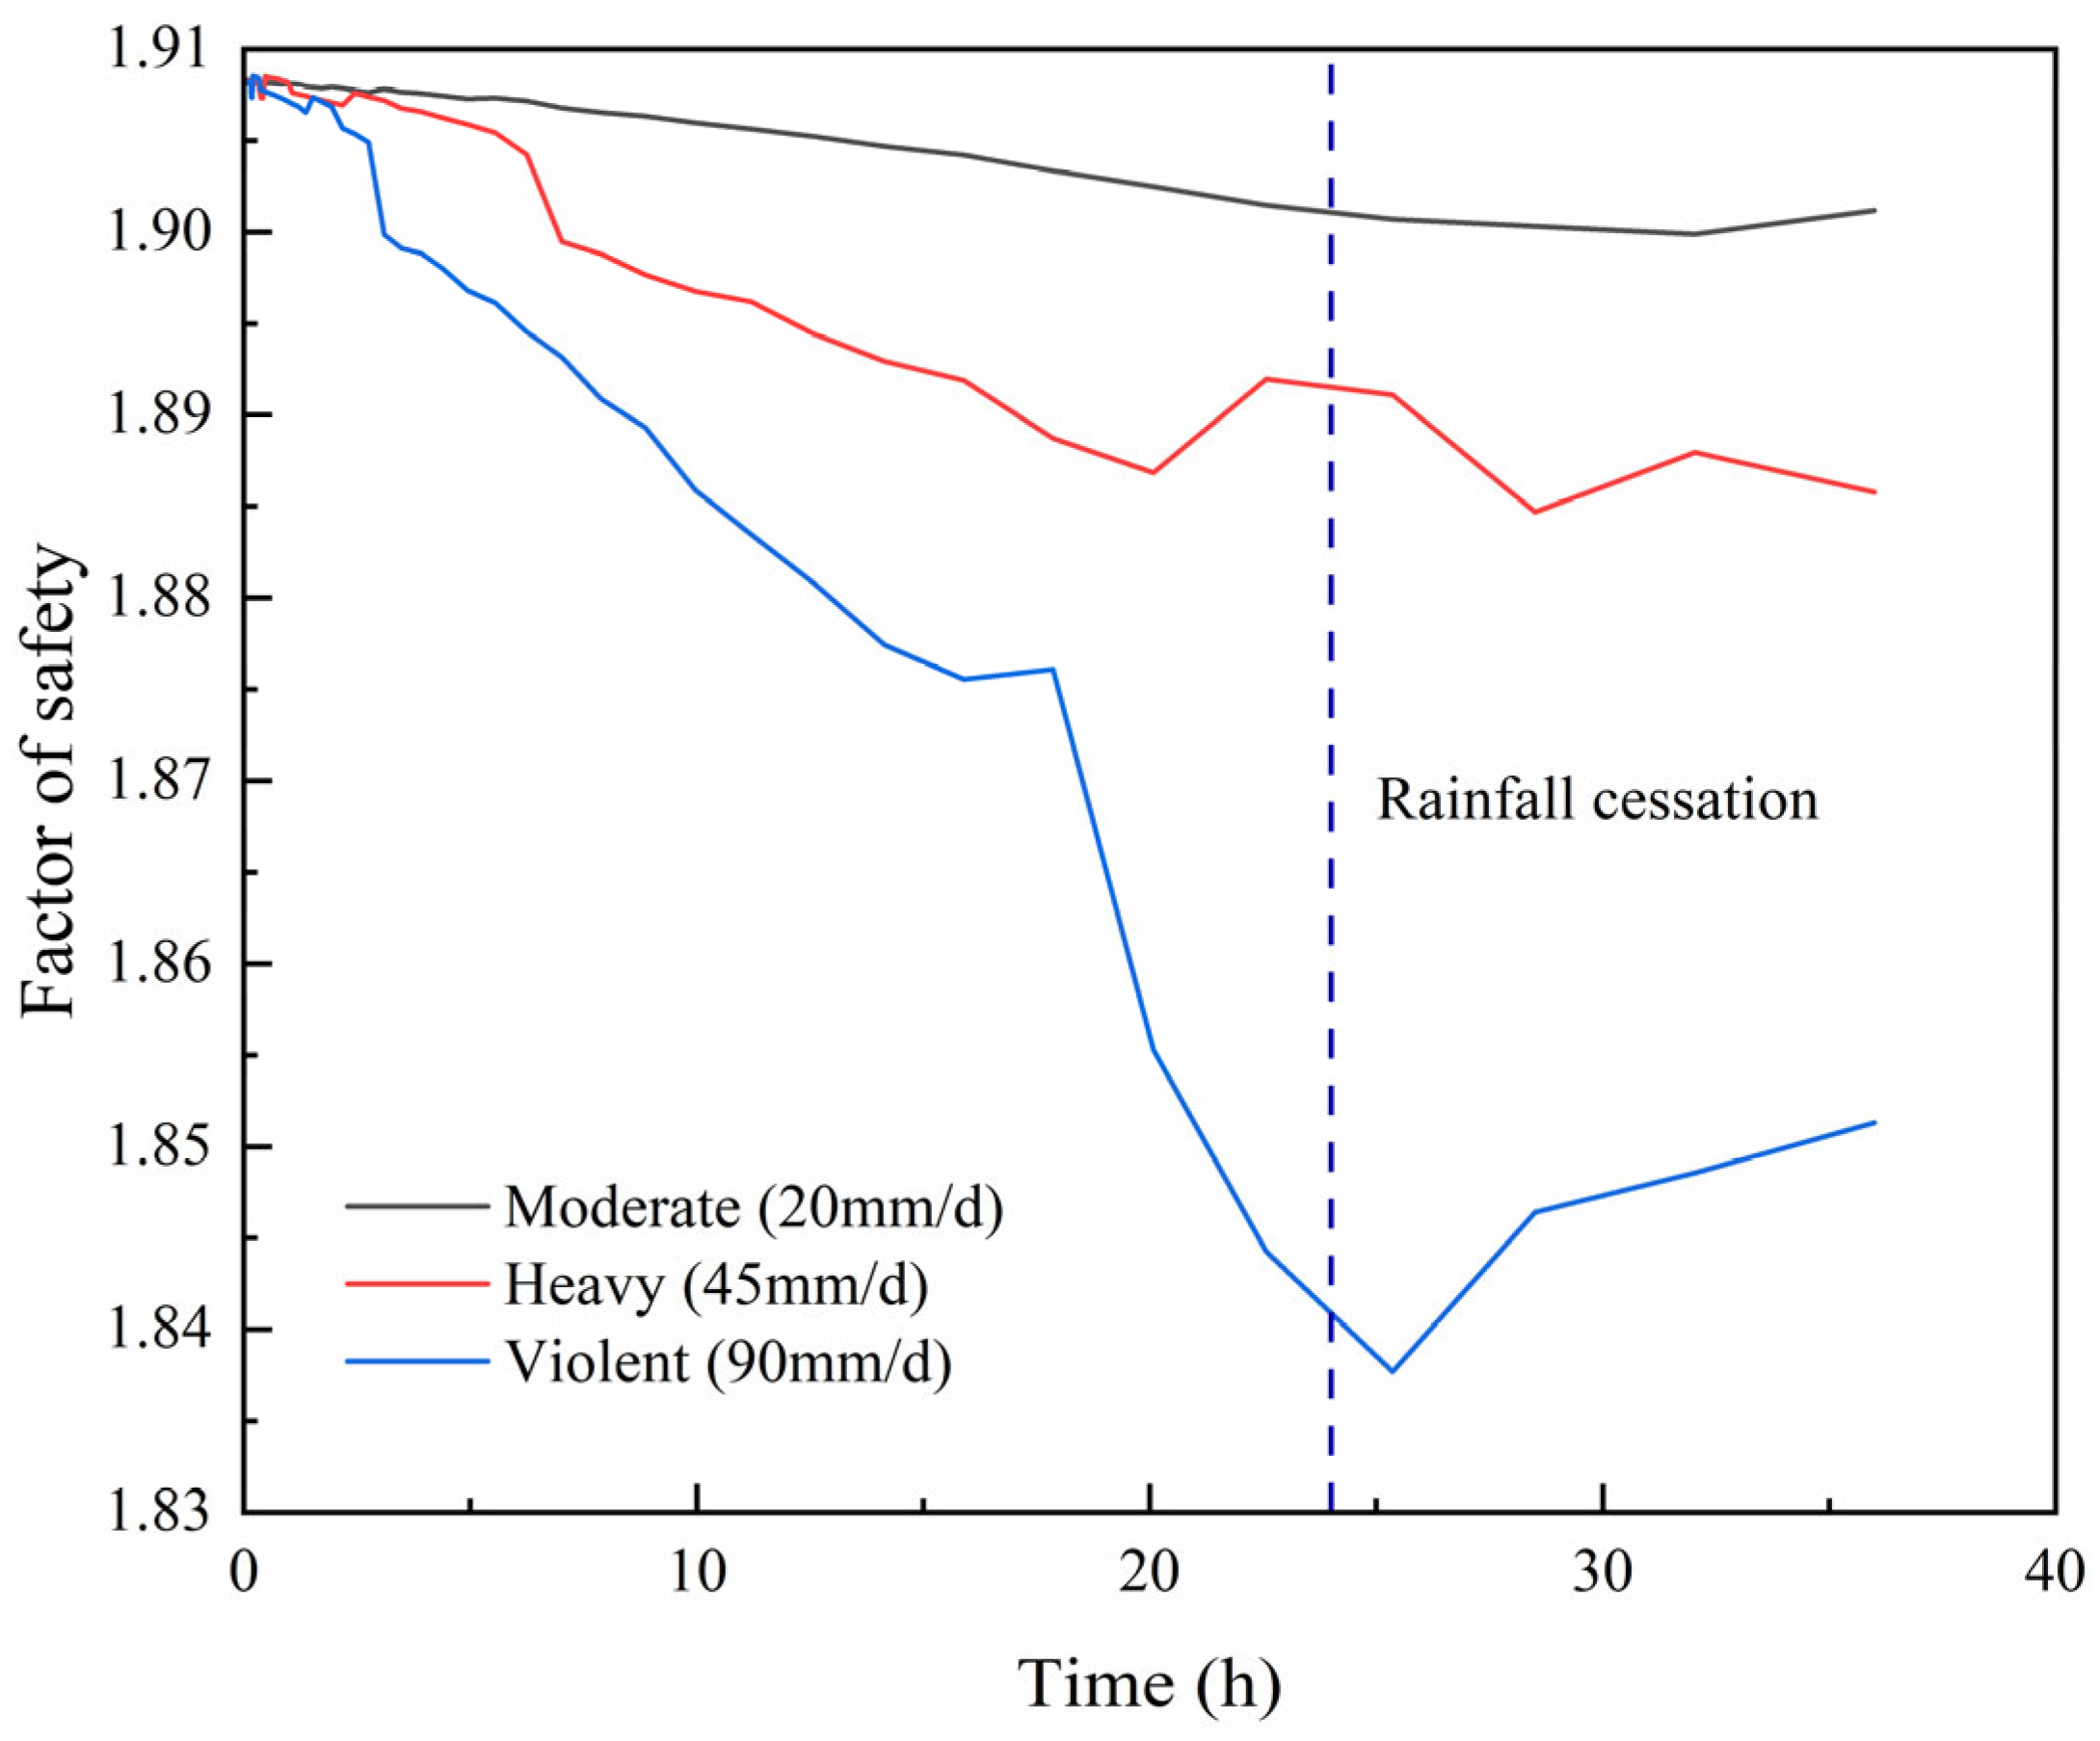
The temporal evolution of the Factor of Safety (FOS) under Moderate (20 mm/d), Heavy (45 mm/d), and Violent (90 mm/d) rainfall intensities is presented in Figure 7. As shown in the figure, the degradation of FOS exhibits a non-linear relationship with rainfall intensity. During the rainfall period (0–24 h), the FOS under the Violent scenario shows a precipitous drop, whereas the decline is minimal under the Moderate scenario.
Notably, a significant time-lag effect is observed in the post-rainfall period (24–36 h). The FOS does not recover immediately after rainfall cessation (indicated by the dashed line) but continues to decrease. Table 3 summarizes the minimum FOS and the corresponding lag times for each scenario. The quantitative data reveals an inverse relationship: the lag time is as long as 8.03 h for the Moderate case but shortens to 1.36 h for the Violent case, indicating that high-intensity rainfall triggers a more immediate instability response.

3.2. Spatiotemporal Evolution of Pore-Water Pressure

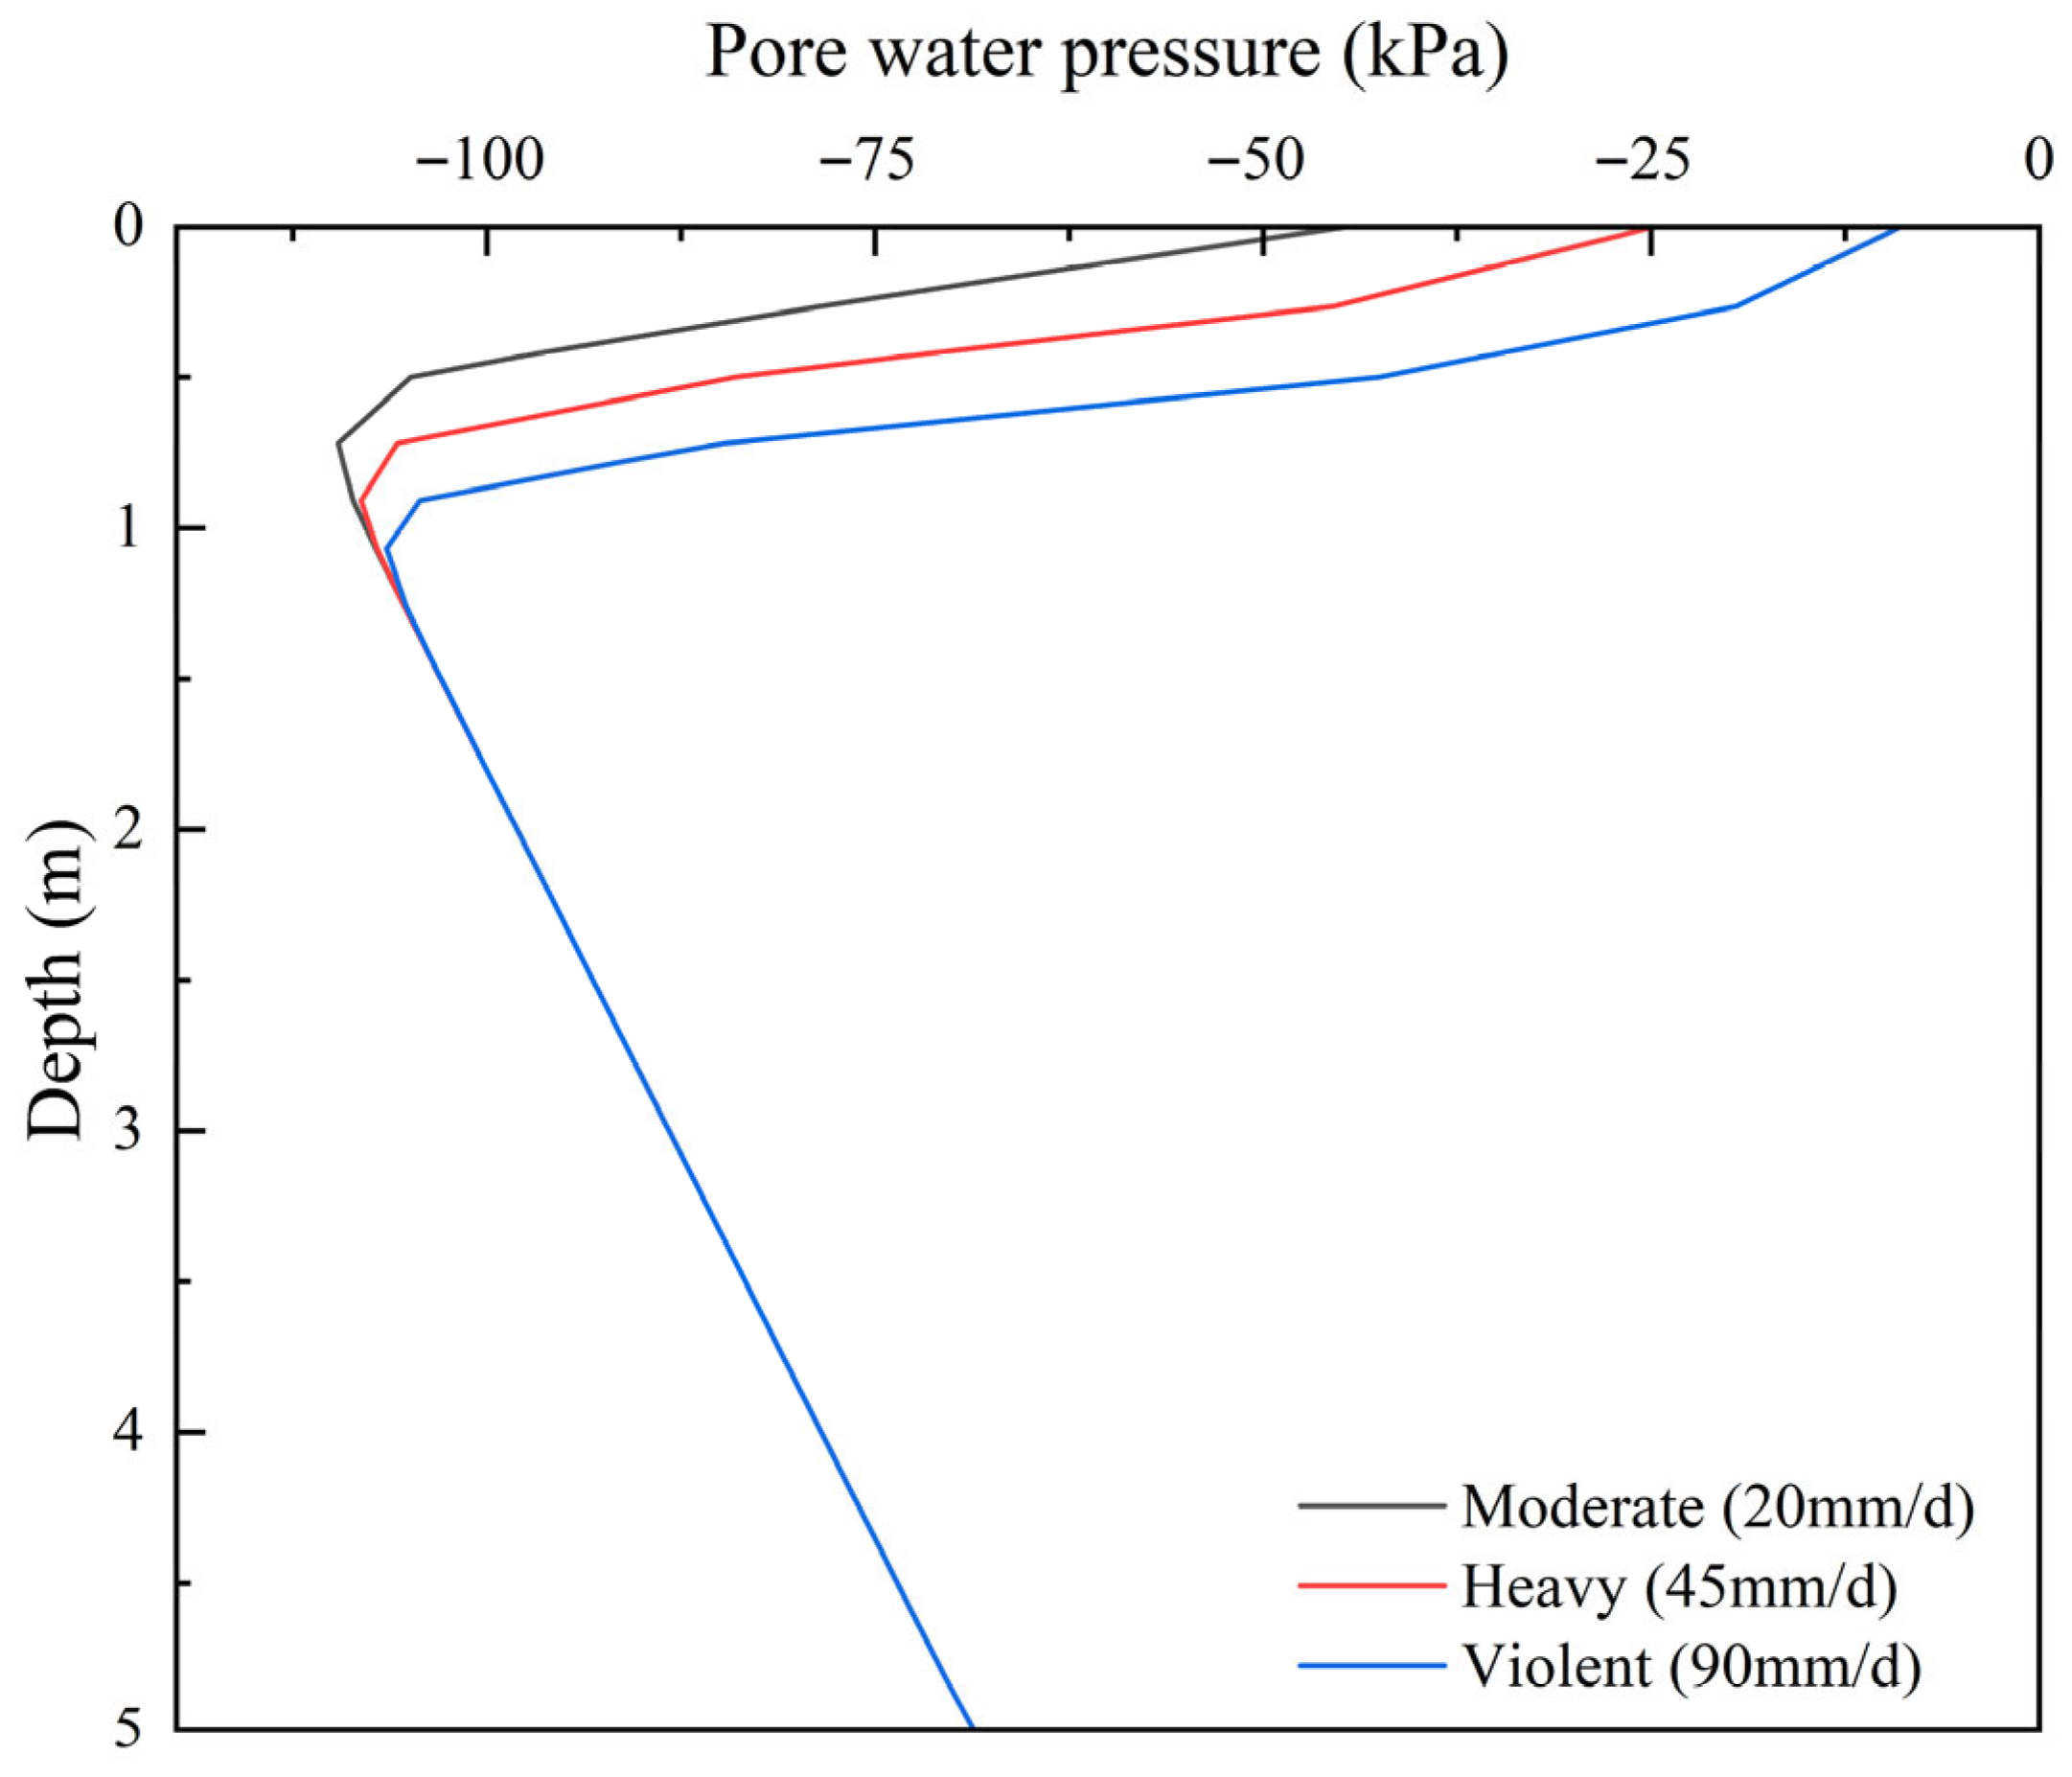
Figure 8 compares the pore-water pressure (PWP) profiles along the vertical monitoring section at the slope crest near the end of the rainfall event (t = 22.4 h). It is observed that below a depth of 1.5 m, the PWP profiles for all three rainfall intensities overlap completely, indicating no change in the deep soil. However, significant differences are evident in the shallow layer (0–1.5 m). For the Moderate case (20 mm/d), the surface PWP increases to approximately −50 kPa. In contrast, for the Violent case (90 mm/d), the surface PWP rises significantly to −10 kPa, while the deep soil remains at the initial state.
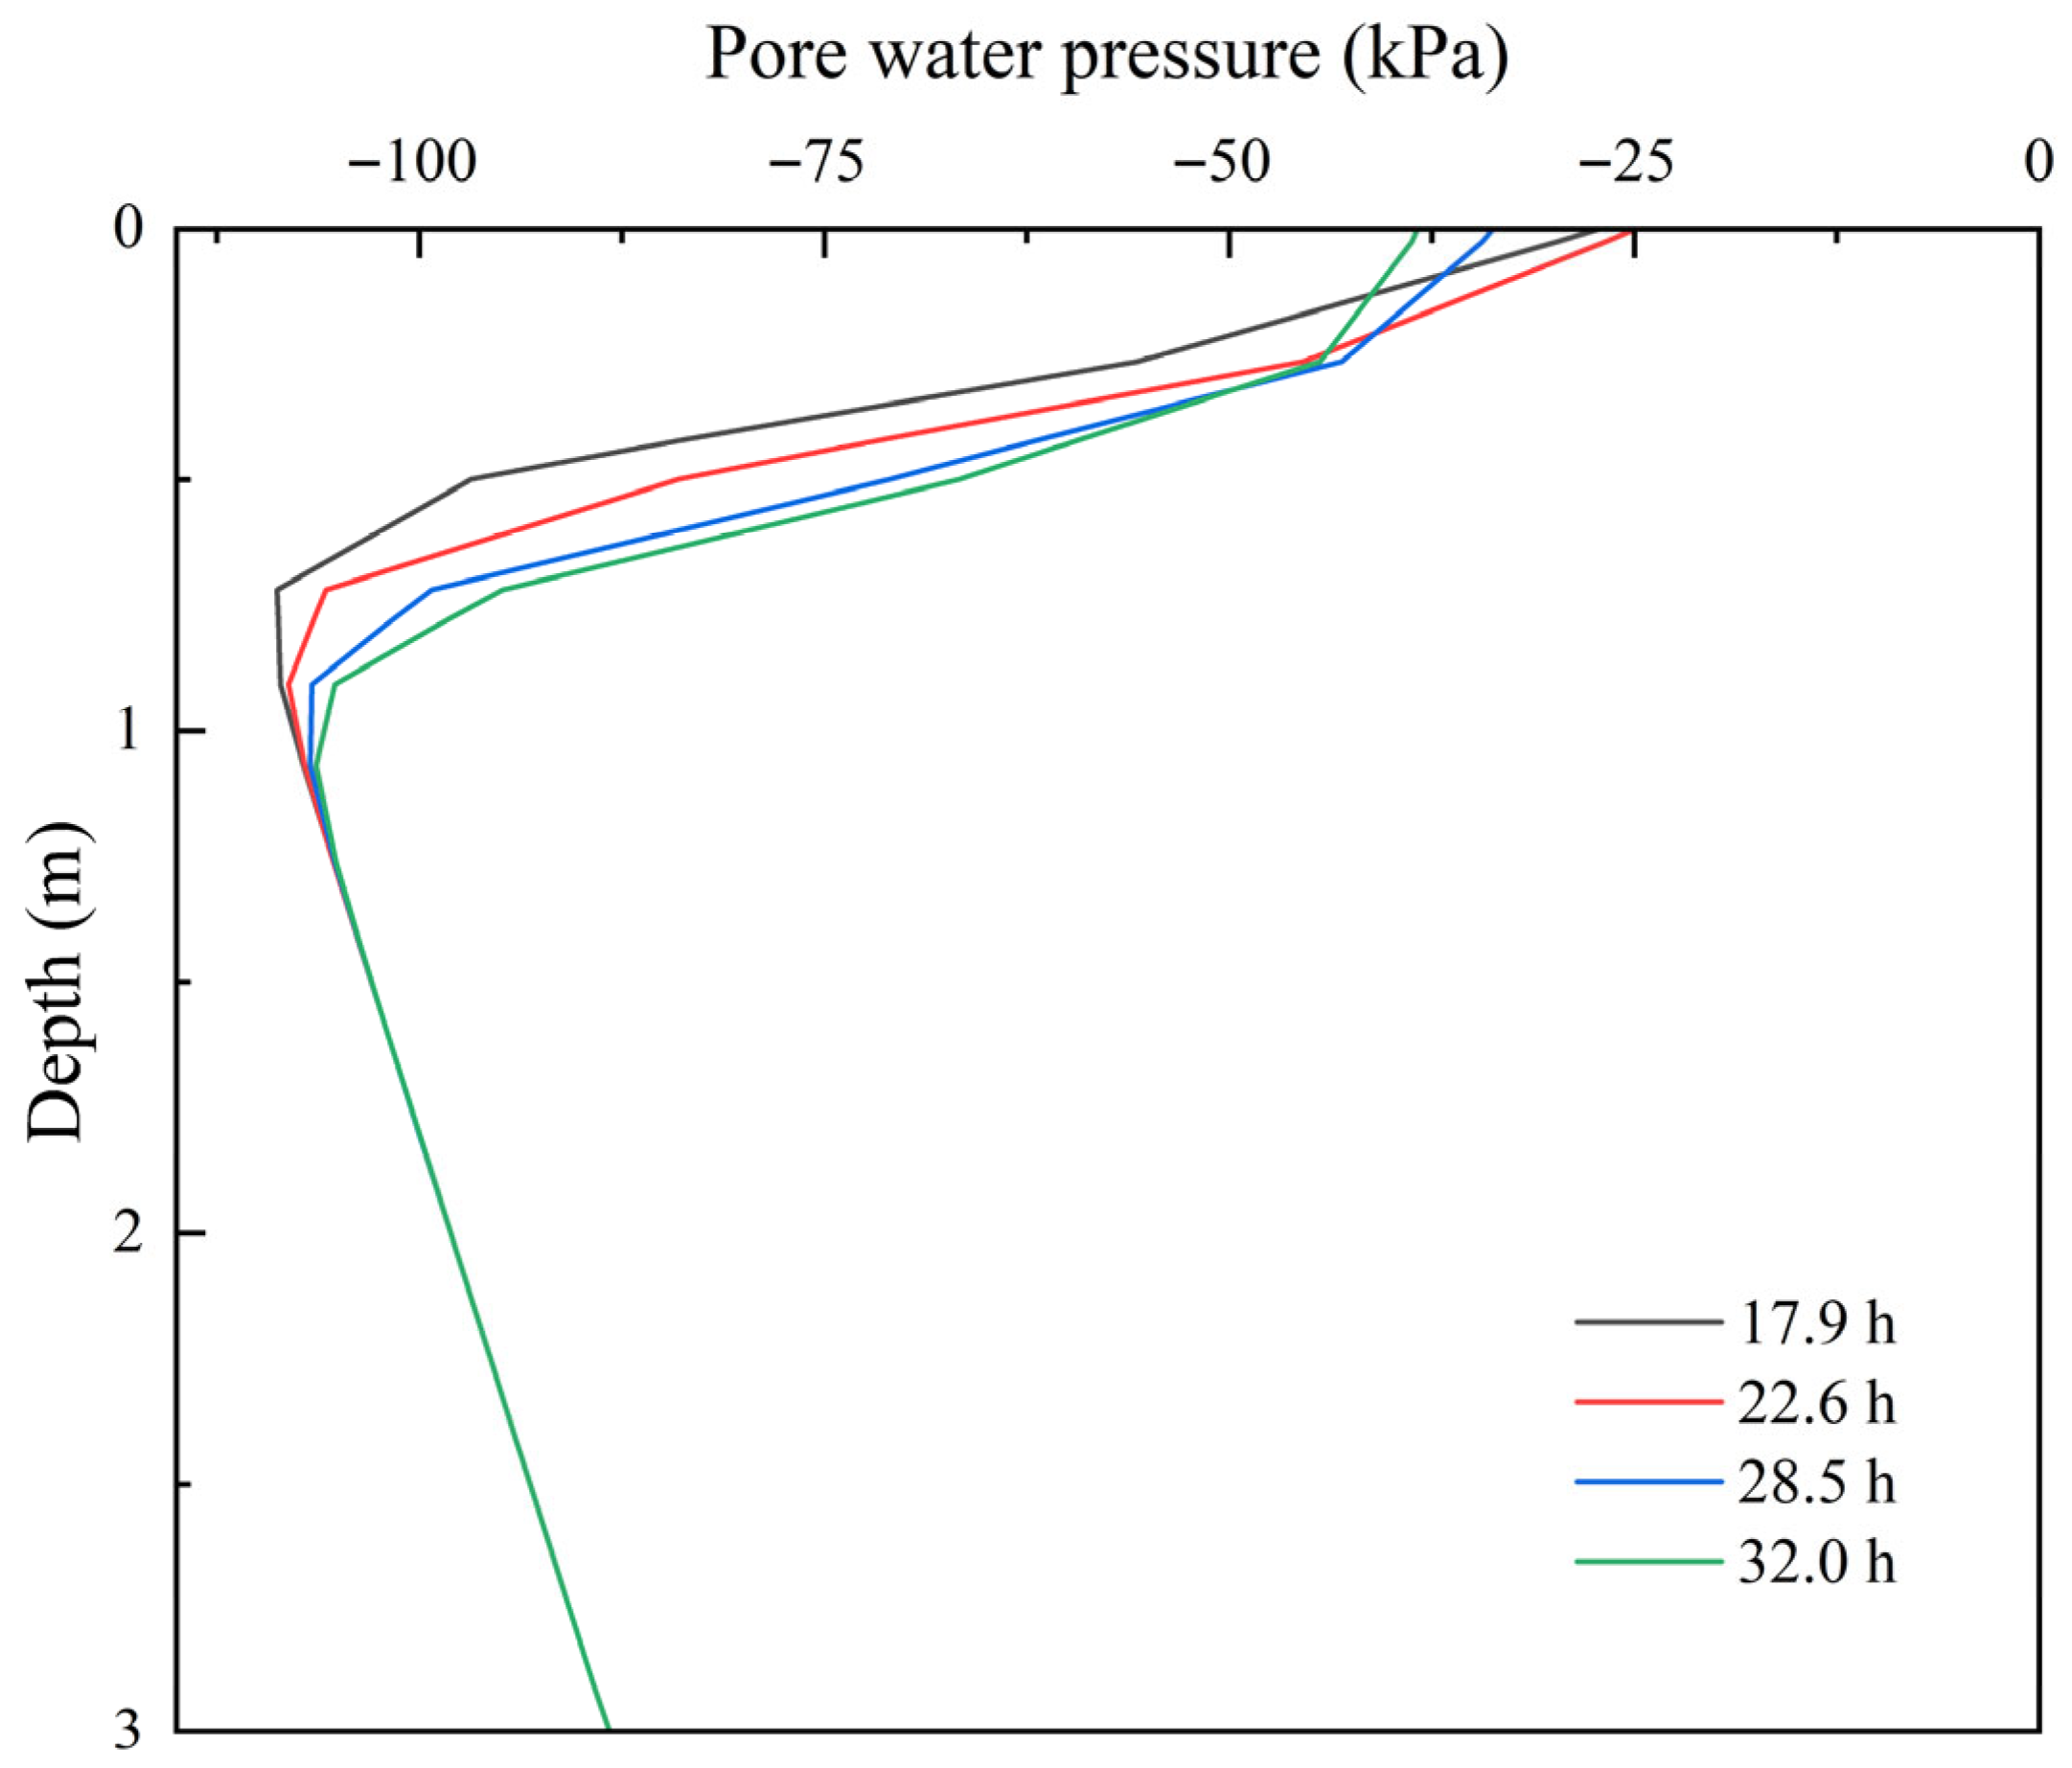
The temporal evolution of PWP profiles under the Violent scenario, covering both the rainfall stage (17.9 h, 22.6 h) and the drainage stage (28.5 h, 32.0 h), is illustrated in Figure 9. After rainfall cessation (t > 24 h), the PWP curves in the shallow layer (0–0.5 m) shift to the left, with the surface PWP dropping from −10 kPa at 22.6 h to lower values at 32.0 h. Conversely, in the deeper zone (0.5 m–1.2 m), the post-rainfall curves shift to the right compared to the profile at the end of rainfall, indicating a continued increase in pore pressure. Correspondingly, the inflection point of the wetting front moves downward over time, advancing from a depth of approximately 0.5 m at t = 22.6 h to 0.8 m at t = 32 h.

3.3. Spatial Heterogeneity of Hydraulic Response

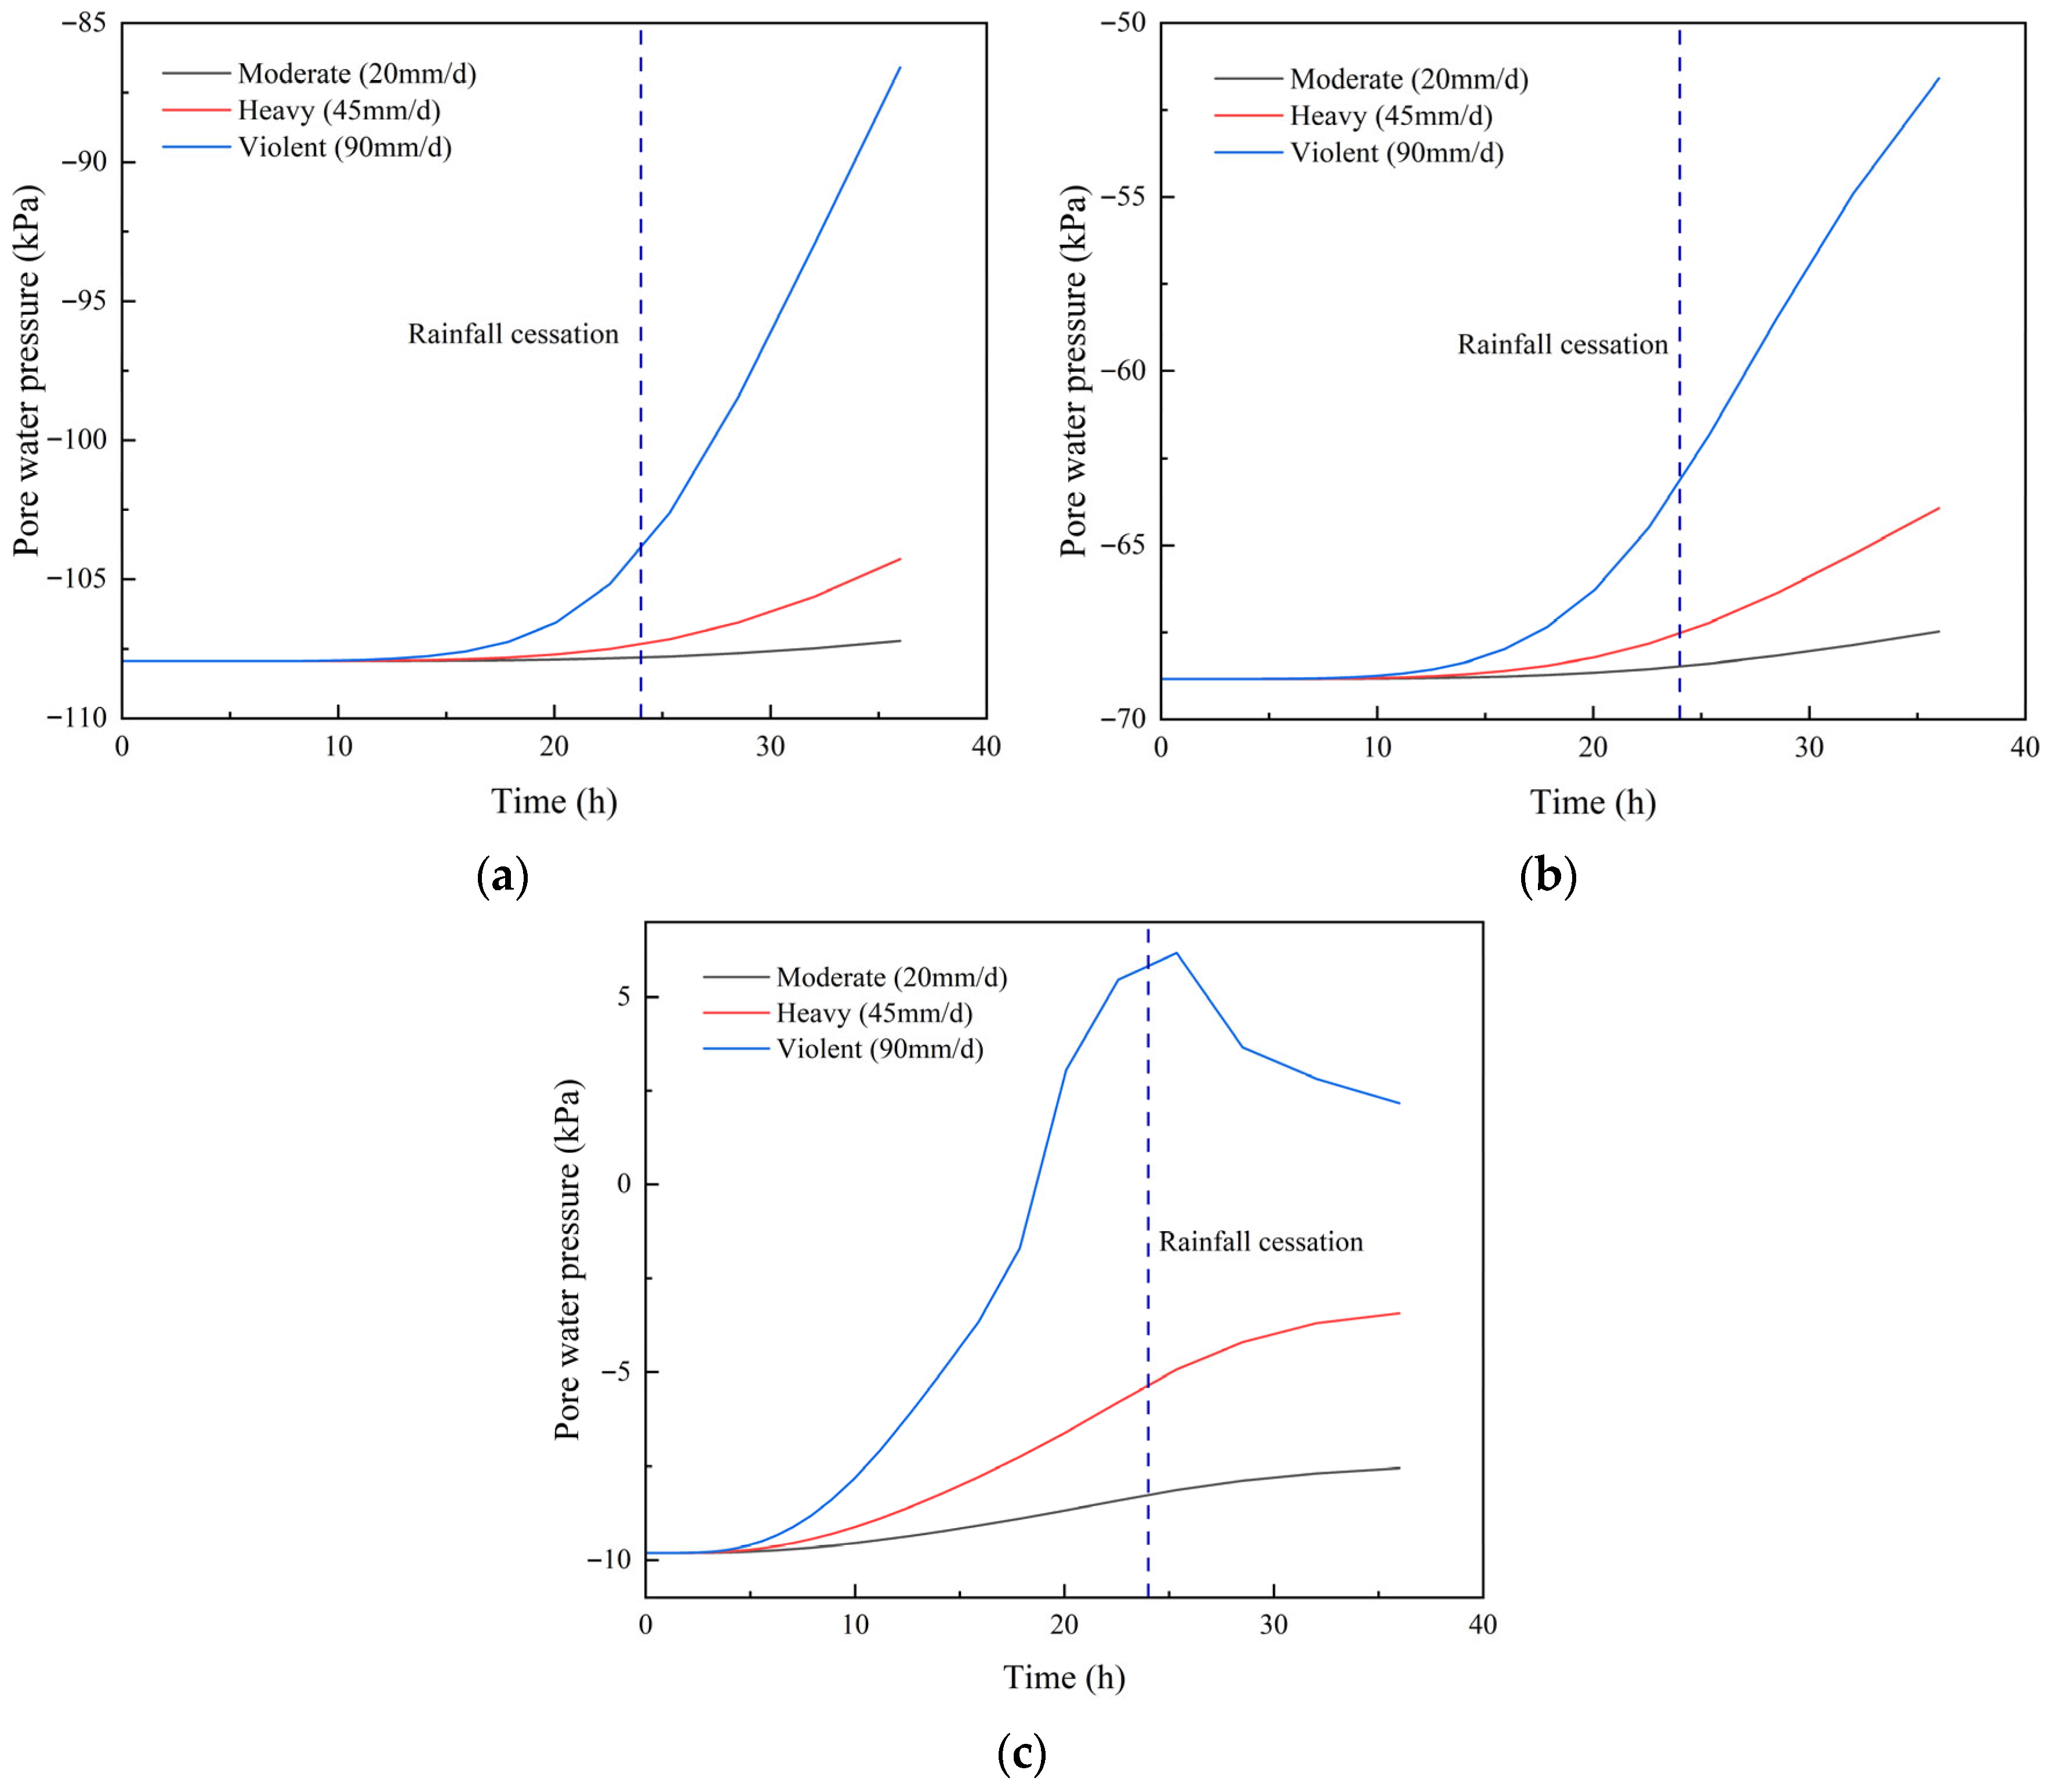
Figure 10 compares the time-history curves of pore-water pressure at the slope crest (Point A), middle (Point B), and toe (Point C) under the violent rainfall scenario. Table 4 summarizes the quantitative response indices for these locations.
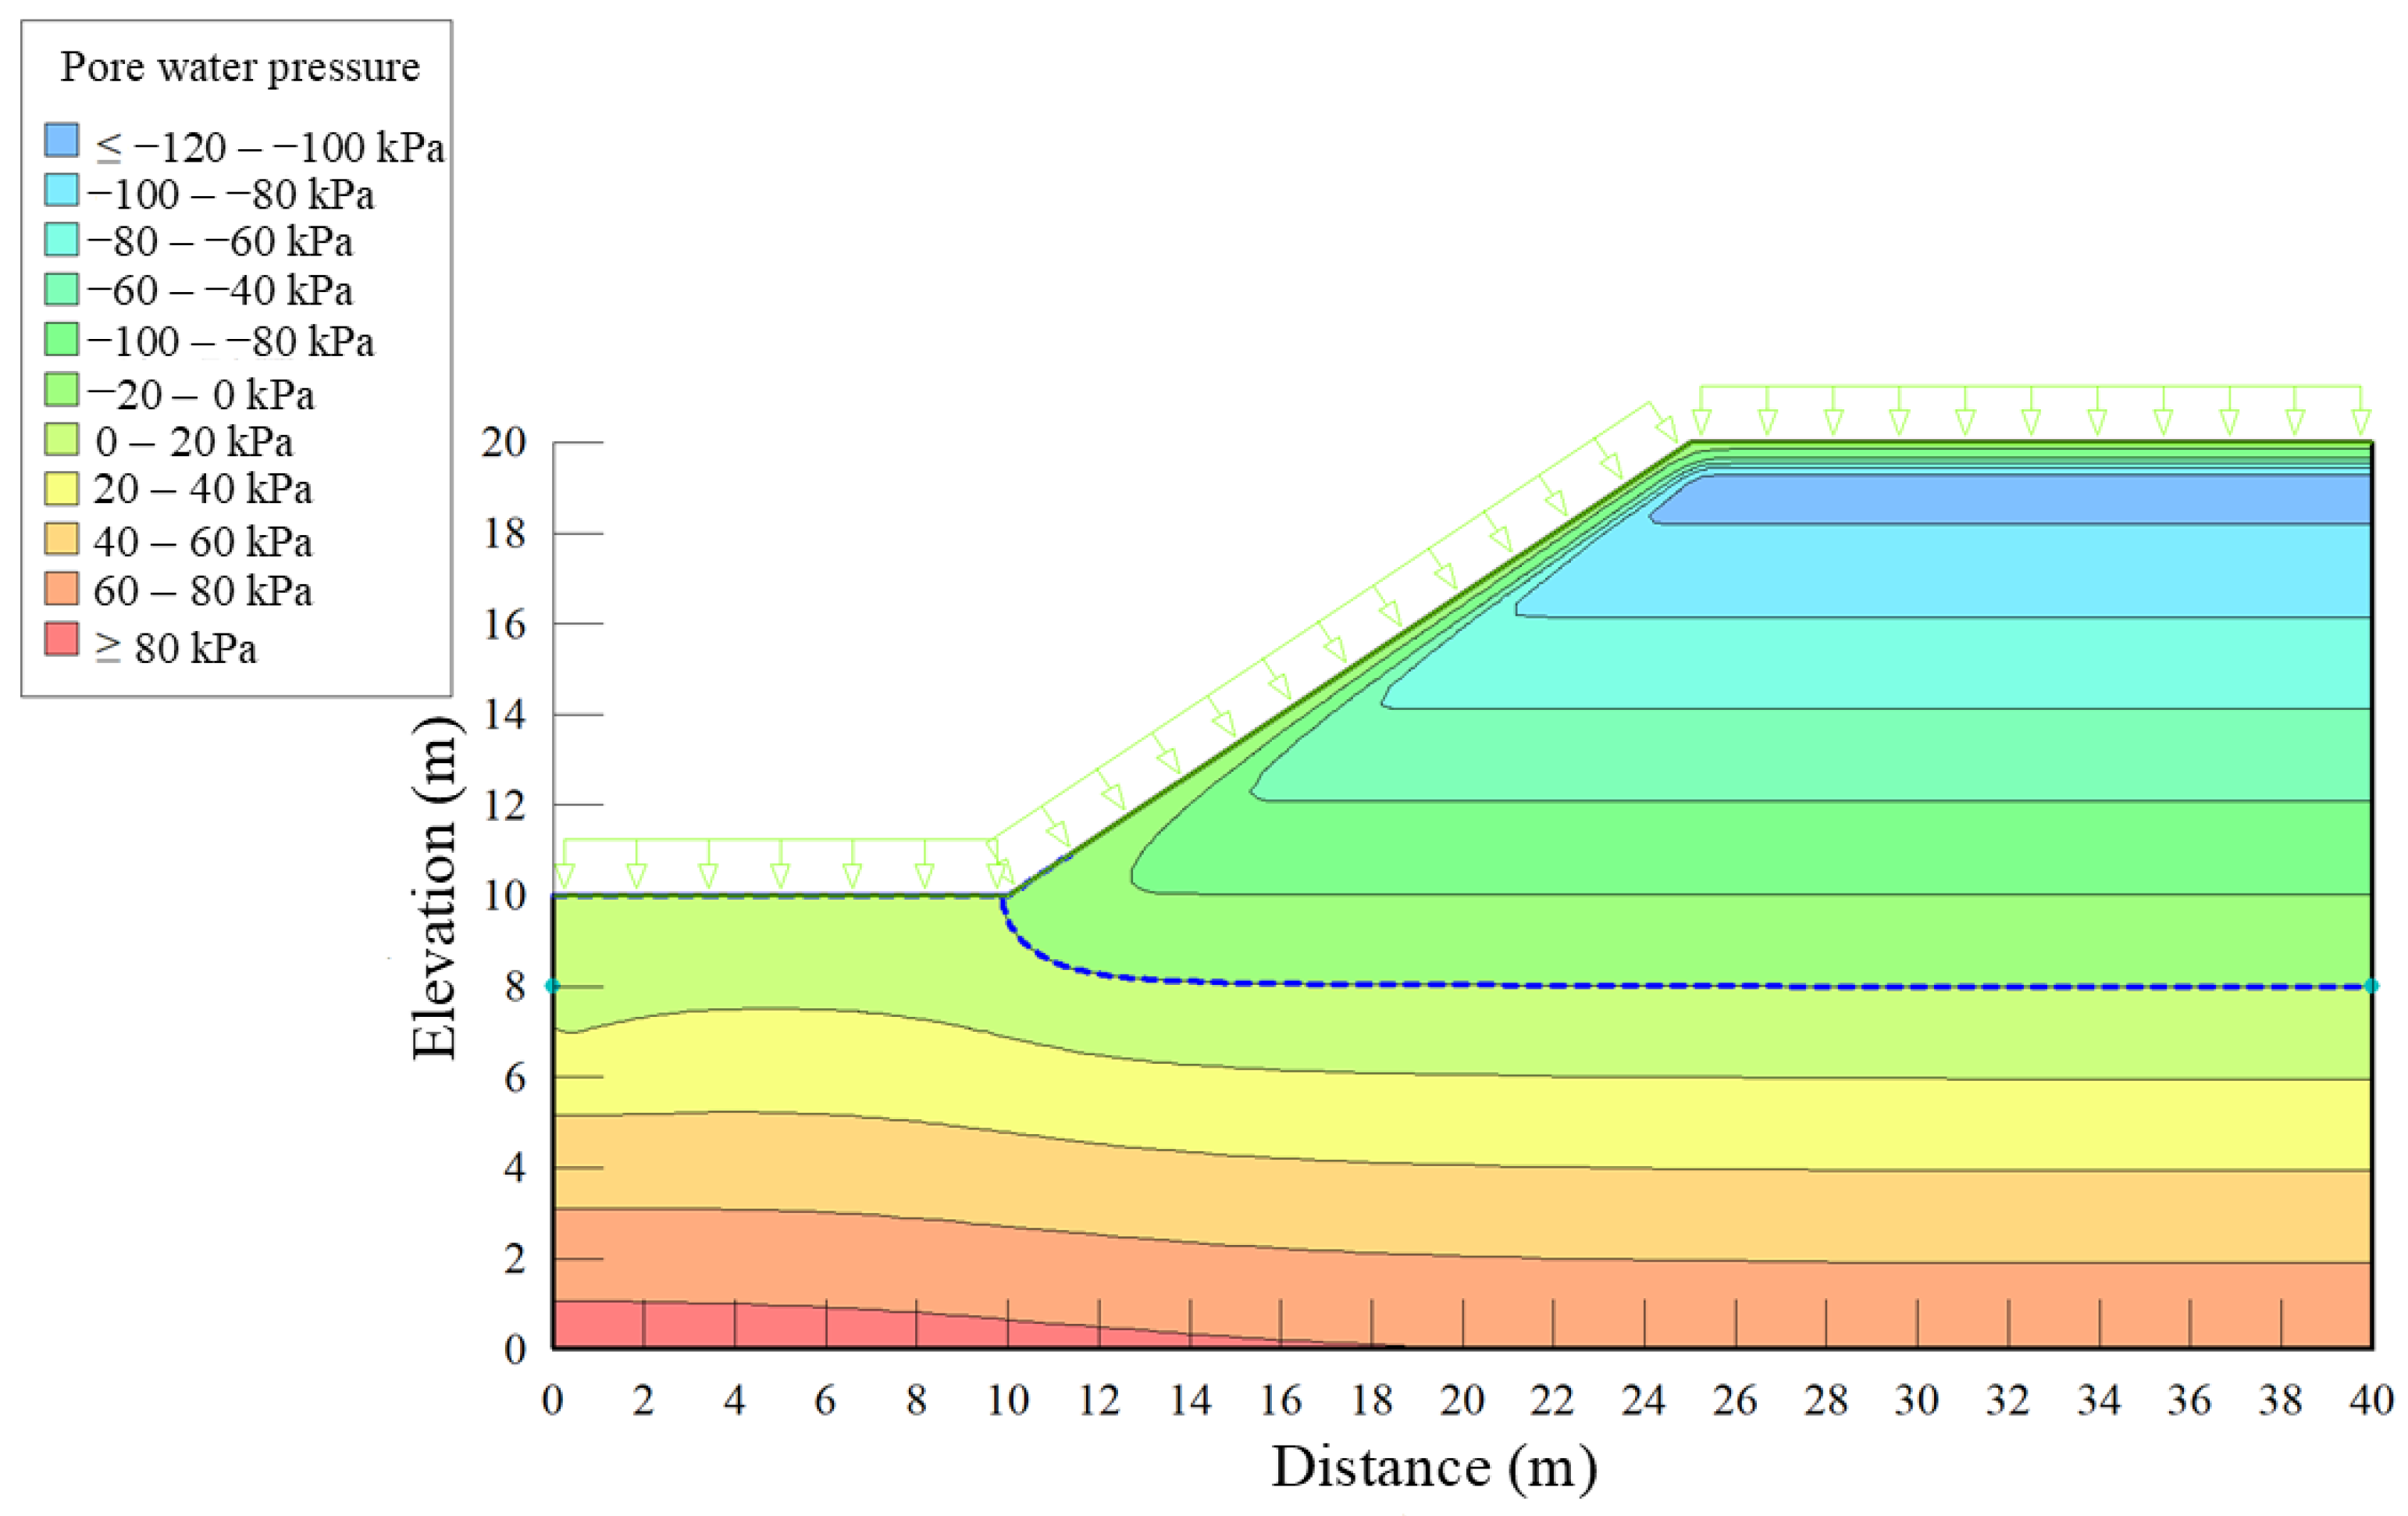
Significant spatial heterogeneity is observed in the hydraulic response across the slope. For the slope crest and middle sections, the PWP increases during the rainfall event but remains negative (unsaturated) throughout the entire simulation; specifically, Table 4 indicates that the peak PWP at Point A is −101.38 kPa. Moreover, the PWP at these upper slope locations continues to rise even after rainfall cessation (t > 24 h), with peak values occurring at the end of the simulation (t = 36.00 h), demonstrating a distinct delayed response. In contrast, Point C at the slope toe exhibits a different behavior, where the PWP rises rapidly and breaks through 0 kPa at approximately t ≈ 18 h. It reaches a positive peak of +6.18 kPa at t = 25.36 h, indicating the formation of a transient saturated zone. Unlike the upper slope, the pressure at the toe dissipates immediately after reaching its peak. This spatial distribution is further visualized in the PWP contours at t = 22.4 h (Figure 11), which clearly show a localized saturated zone (indicated by PWP ≥ 0) formed at the slope toe, while the upper parts of the slope remain unsaturated.

3.4. Effect of Snowmelt Superposition

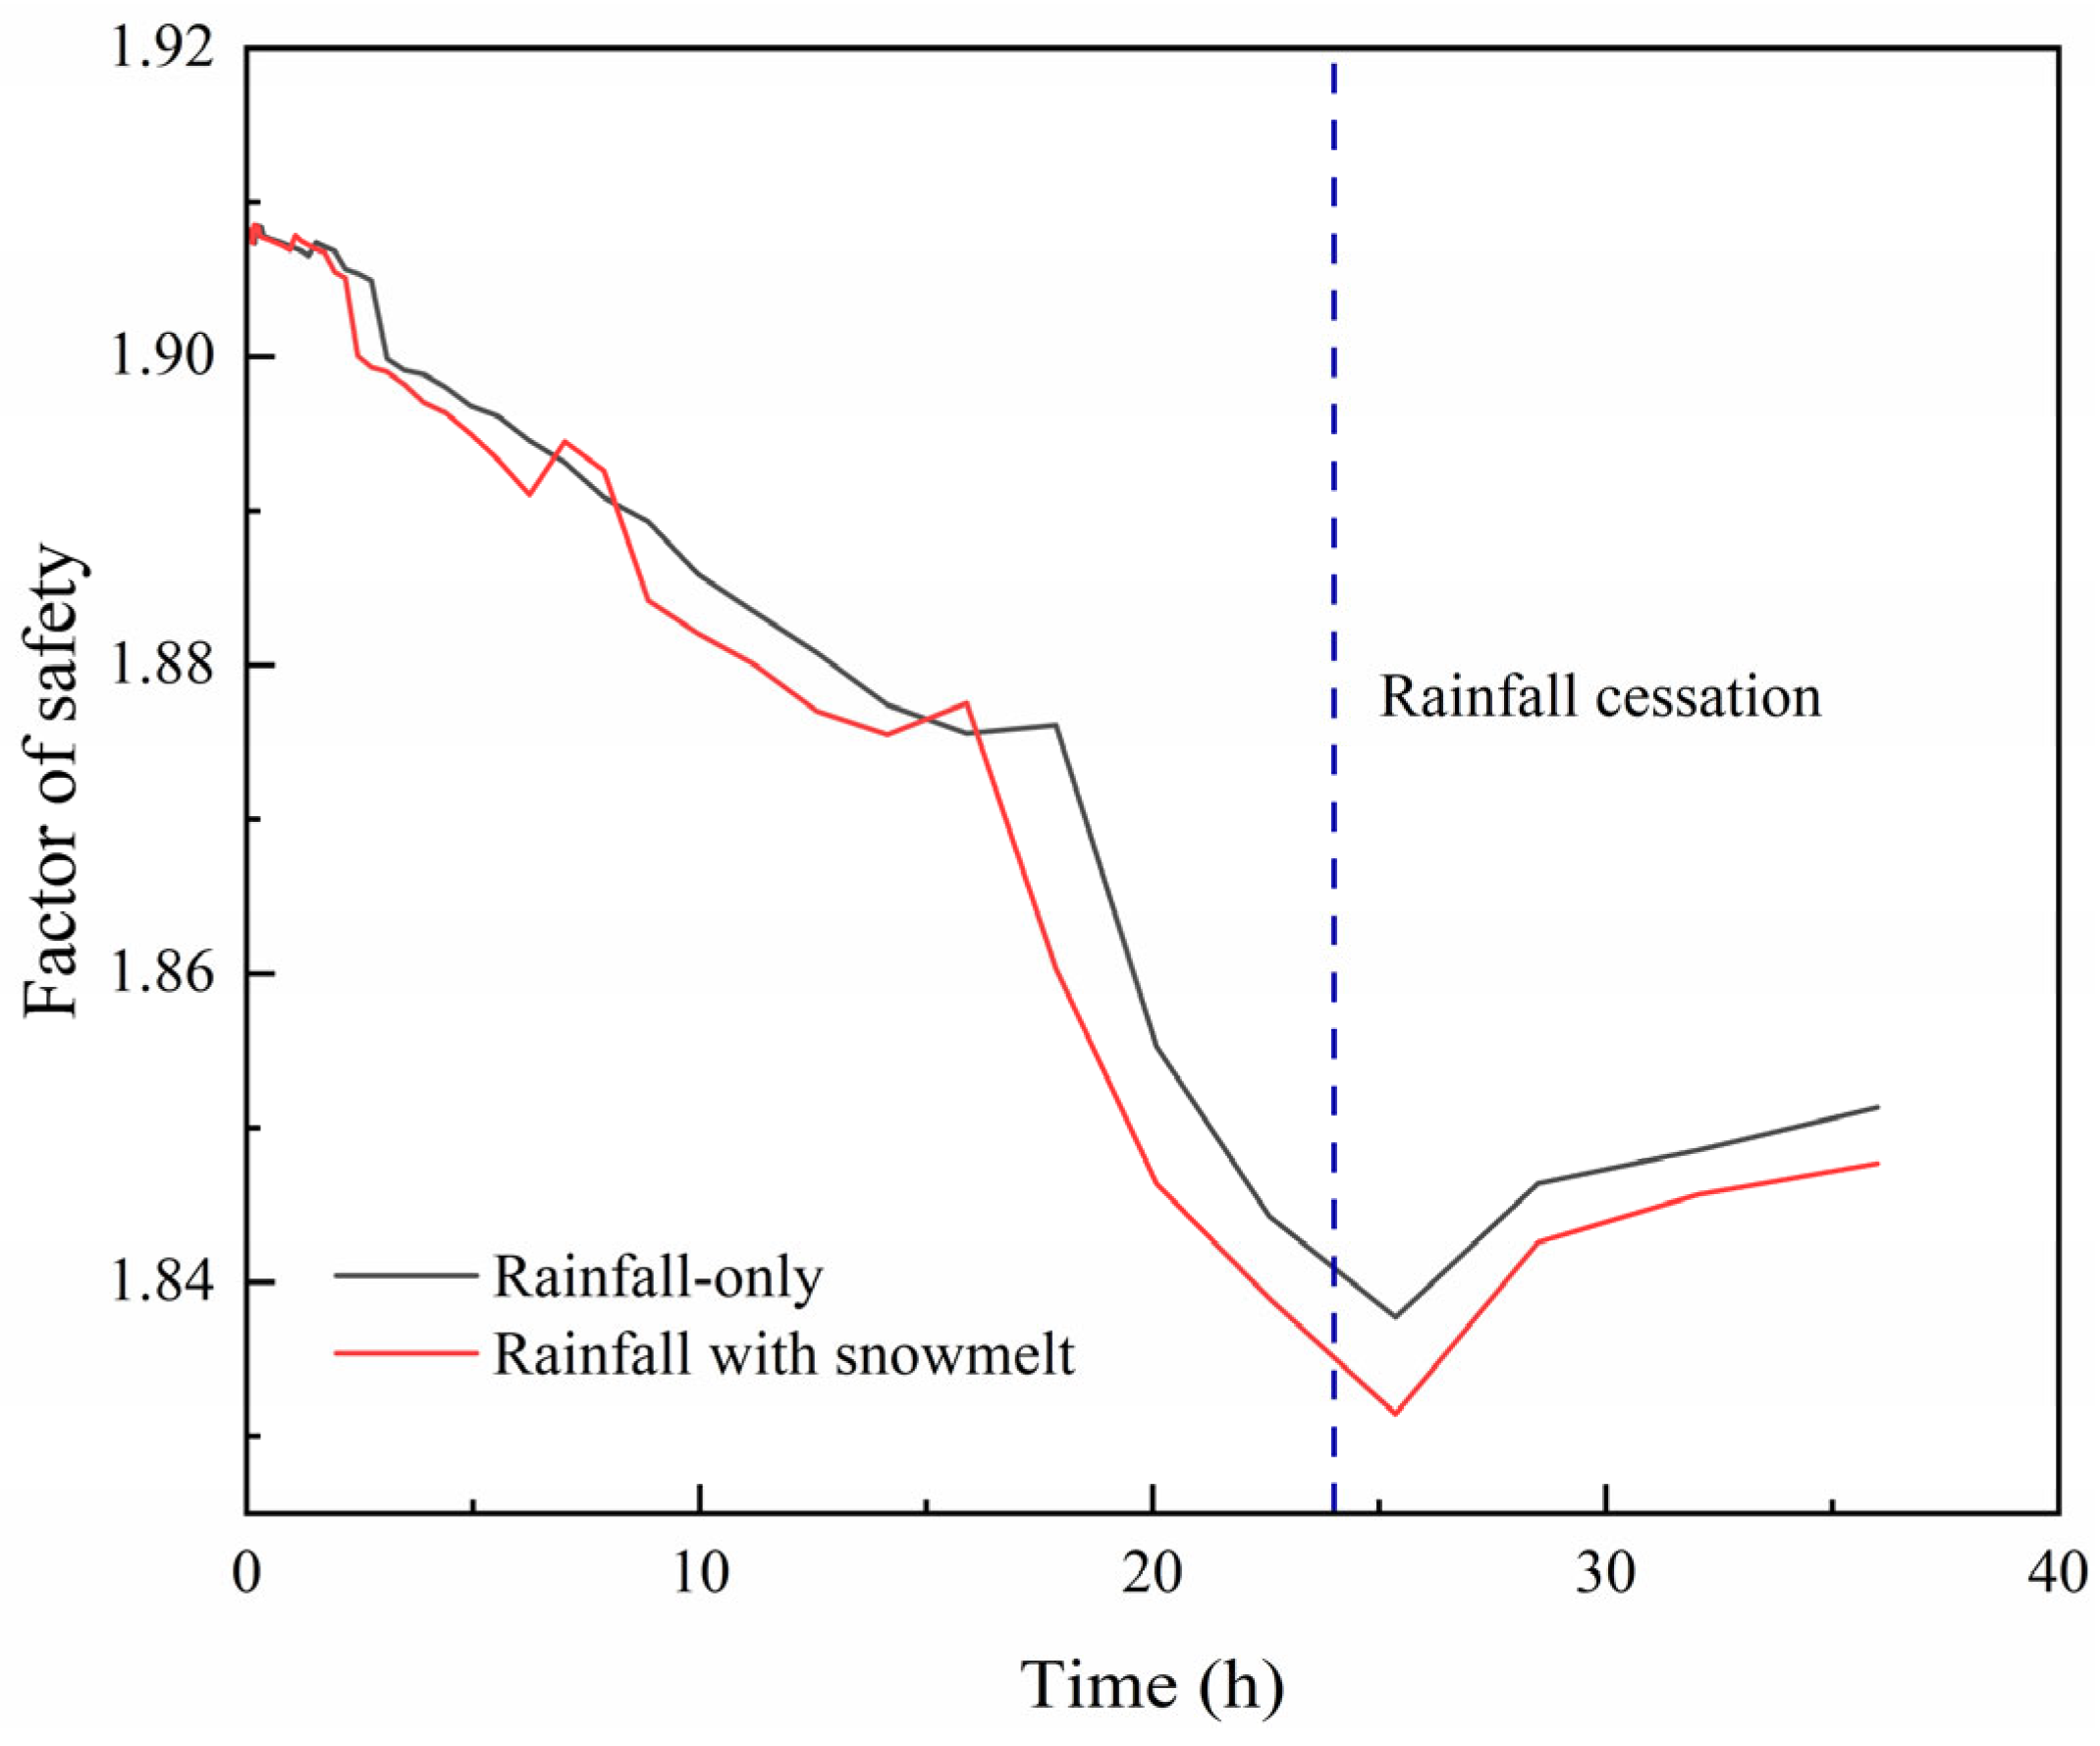
Figure 12 compares the time-histories of the Factor of Safety (FOS) between the “Rainfall-Only” (90 mm/d) and the “Rainfall with Snowmelt” (90 mm/d + 20 mm/d) scenarios. It is observed that the FOS curve for the scenario with snowmelt is consistently located below that of the rainfall-only scenario throughout the entire simulation period. Specifically, the superposition of snowmelt leads to an acceleration of the instability process; the onset of the steep decline phase in FOS is advanced by approximately 1–2 h. Furthermore, the minimum safety factor is reduced from 1.838 in the pure rainfall case to 1.831 in the combined case, indicating a quantifiable reduction in the safety margin due to the additional snowmelt water flux.

4. Discussion

4.1. Threshold Effect of Rainfall Intensity on Stability

The non-linear relationship between rainfall intensity and slope stability degradation observed in Figure 7 is fundamentally governed by the infiltration threshold mechanism. To quantify this effect, the ratio of rainfall intensity ( I ) to the soil’s saturated hydraulic conductivity ( k s a t ≈ 43.2 mm/d) is a critical indicator. For the Moderate rainfall scenario (20 mm/d), the intensity ratio is I / k s a t ≈ 0.46. Since the water supply is significantly lower than the infiltration capacity ( I / k s a t < 1), rainwater infiltrates fully but slowly under a unit gradient. As evidenced by the PWP profiles in Figure 8, the surface pore-water pressure only increases to approximately −50 kPa, retaining significant matric suction to maintain shear strength; consequently, the FOS exhibits only a marginal decline. In sharp contrast, for the Violent rainfall scenario (90 mm/d), the intensity ratio reaches I / k s a t ≈ 2.07, indicating that the water supply is more than double the soil’s drainage capacity. This excess flux leads to the rapid saturation of the slope surface (Figure 8) and the generation of surface runoff. The formation of a transient saturated zone establishes a high hydraulic gradient, forcing the wetting front to penetrate deeper and faster, which directly triggers the “precipitous drop” in FOS between 18 h and 24 h. These findings confirm that soil permeability acts as a physical threshold; once exceeded ( I / k s a t > 1), the landslide risk escalates disproportionately.

4.2. Mechanism of Time-Lag and Moisture Redistribution

The significant time-lag effect observed in Figure 7, where the minimum Factor of Safety lags behind rainfall cessation, can be fundamentally attributed to the mechanism of moisture redistribution.
Although surface infiltration ceases at t = 24 h, the pore-water pressure profiles in Figure 9 reveal that the wetting front continues to migrate downward under the influence of gravitational potential. While the surficial soil (0–0.5 m) begins to drain and recover suction, the deeper soil (0.5–1.2 m) exhibits a continuous increase in pore-water pressure after the rain stops. This phenomenon is corroborated by the time-history data in Figure 10. Specifically, at the slope crest (Point A) and middle slope (Point B), the pore-water pressure does not peak at the cessation of rainfall but continues to rise until the end of the simulation (t = 36 h). This delayed hydraulic response confirms that moisture is still redistributing to the deeper potential slip zone.
This mechanism also rationalizes the intensity-dependent lag times summarized in Table 3. Under the Moderate rainfall scenario, the soil remains unsaturated with low hydraulic conductivity, causing the wetting front to migrate slowly; consequently, the critical failure moment is delayed by as much as 8.03 h. In contrast, under the Violent scenario, the rapid formation of a saturated zone accelerates the downward flux, significantly shortening the lag time to 1.36 h.
Comparison with Existing Studies: These findings are consistent with previous studies. For instance, Guo et al. [19] reported a stability stagnation time (lag time) of 5 h under a rainfall intensity of 80 mm/d in mudstone slopes. This aligns remarkably well with our result for the ‘Heavy’ rainfall scenario (45 mm/d), which exhibited a lag time of 4.5 h. Furthermore, Kim et al. [15] concluded that low-permeability slopes are governed by antecedent rainfall over a longer duration due to delayed saturation, which supports our observation of the longest lag time occurring under the lowest rainfall intensity.

4.3. Failure Mode and Triggering Mechanism

The spatial heterogeneity analysis presented in Figure 10 and Table 4 highlights the slope toe as the most vulnerable zone during heavy rainfall. Unlike the slope crest and middle sections, which remain unsaturated, the pore-water pressure at the toe (Point C) rises rapidly and becomes positive at t ≈ 18 h.
This rapid saturation is attributed to the combined effect of surface runoff accumulation and the local rise in the groundwater table (as visualized by the saturated zone in Figure 11). Crucially, the activation of the “Potential Seepage Face” boundary condition at the saturated toe indicates the occurrence of groundwater exfiltration (discharge). The interaction between the downward infiltration from the upper slope and the outward discharge at the toe creates complex seepage forces. According to the principle of effective stress, the generation of positive pore-water pressure reduces the effective stress to near zero, causing a localized loss of shear strength at the toe. While the Limit Equilibrium Method (LEM) analyzes global stability, this localized strength loss at the toe removes the support for the upslope soil mass, indicating a high potential for retrogressive instability. This failure pattern is consistent with the findings of Guo et al. [19], who reported that the “front slope toe is the first unstable part” in rainfall-induced landslides. Furthermore, large-scale physical model tests by Qu et al. [14] also confirmed that high-intensity rainfall tends to trigger retrogressive instability initiated at the slope toe. This mechanism perfectly explains the precipitous drop in FOS observed in the violent rainfall scenario (Figure 7), suggesting that drainage measures at the slope toe are critical for landslide prevention.

4.4. Implications for Early Warning in Cold Regions

The comparative study on the snowmelt effect (Figure 12) demonstrates that the superposition of snowmelt accelerates the instability process by approximately 1–2 h. Mechanistically, the continuous base flow generated by snowmelt creates a base flow effect, which increases the initial volumetric water content and unsaturated hydraulic conductivity before the peak rainfall arrives. This process effectively eliminates the suction barrier of the dry surface soil, allowing the subsequent heavy rainfall to infiltrate more rapidly to the deep sliding zone. It is acknowledged that actual snowmelt involves complex thermo-hydro-mechanical interactions. However, this study adopts a simplified constant flux approach to represent the “worst-case hydraulic scenario” during the active thaw period. At this critical stage, the surficial soil has thawed and regained permeability. By assuming full permeability and neglecting the impedance of frozen soil, this approach isolates the pure hydraulic contribution of snowmelt, providing a conservative estimate of the maximum destabilizing potential. Consequently, in cold regions like Northeast China, current early warning thresholds based solely on rainfall intensity may overestimate the safety margin during the spring thaw. Therefore, an integrated warning system considering the equivalent water content of snowmelt is recommended, and the warning response time should be advanced to account for this acceleration effect.

4.5. Limitations

While this study provides valuable insights into the time-lag mechanism and snowmelt effects in cold regions, certain limitations should be acknowledged. First, regarding the snowmelt process, complex thermo-hydro-mechanical (THM) coupling effects—specifically the phase change of water and the impedance of frozen soil layers—were not explicitly modeled. Instead, the active layer was assumed to be fully thawed and permeable to represent the “worst-case hydraulic scenario” where maximum infiltration occurs. Second, the numerical model assumes a homogeneous and isotropic soil medium, potentially overlooking preferential flow paths caused by geological complexities such as fissures or macropores. Third, this research is primarily a numerical parametric study. Although the results were validated against existing literature and physical model tests [14,15,19], site-specific monitoring data from the prototype slope were not available for direct calibration. Future research will focus on incorporating fully coupled THM models to simulate freeze–thaw cycles, considering soil heterogeneity, and collecting field monitoring data to further refine landslide early warning criteria.

5. Conclusions

  • Mesh Sensitivity and Numerical Accuracy: Coarse meshing (e.g., 1.0 m) leads to significant numerical dispersion and overestimation of infiltration depth. Adopting a locally refined mesh of 0.2 m combined with an exponential time-stepping scheme is essential to accurately capture the steep suction gradients at the wetting front and ensure calculation convergence.
  • Time-Lag Effect and Moisture Redistribution: A significant time-lag exists between rainfall cessation and the minimum Factor of Safety. This is driven by moisture redistribution, where the wetting front continues to migrate downward under gravity after the rain stops, reducing the shear strength in the deep sliding zone. The lag time is negatively correlated with rainfall intensity (e.g., ~8.03 h for moderate rain vs. ~1.36 h for violent rain).
  • Spatial Failure Mechanism: The hydraulic response exhibits strong spatial heterogeneity. The slope toe is identified as the most critical zone, which reaches saturation first due to runoff accumulation and groundwater interaction. This localized saturation acts as a primary trigger indicating a high potential for retrogressive instability, while the slope crest remains unsaturated.
  • Impact of Snowmelt Superposition: In cold regions, snowmelt acts as a constant base flow that creates a base flow effect. This superposition accelerates the instability process by advancing the failure time by 1–2 h and further reducing the safety margin. Therefore, snowmelt intensity must be integrated into landslide early warning systems for the spring thaw period.

Author Contributions

Conceptualization, W.T. and H.W.; methodology, W.T.; software, W.T.; validation, W.T.; formal analysis, W.T.; investigation, W.T.; resources, H.W. and C.M.; data curation, W.T.; writing—original draft preparation, W.T.; writing—review and editing, W.T. and S.Z.; visualization, W.T.; supervision, H.W.; project administration, W.T. and H.W. All authors have read and agreed to the published version of the manuscript.

Funding

This research received no external funding.

Data Availability Statement

The original contributions presented in this study are included in the article. Further inquiries can be directed to the corresponding author.

Acknowledgments

The authors would like to thank the editors and the anonymous reviewers for their constructive comments and suggestions, which greatly improved the quality of this manuscript. The authors also appreciate the resources provided by Northeast Forestry University.

Conflicts of Interest

The authors declare no conflicts of interest.

Abbreviations

The following abbreviations are used in this manuscript:
FOSFactor of Safety
PWPPore-Water Pressure
SWCCSoil-Water Characteristic Curve

References

  1. Rahardjo, H.; Ong, T.; Rezaur, R.; Leong, E. Factors Controlling Instability of Homogeneous Soil Slopes under Rainfall. J. Geotech. Geoenviron. Eng. 2007, 133, 1532–1543. [Google Scholar] [CrossRef]
  2. Abu Mansor Maturidi, A.M.; Kasim, N.; Abu Taib, K.; Wan Azahar, W.N.A. Rainfall-Induced Landslide Thresholds Development by Considering Different Rainfall Parameters: A Review. J. Ecol. Eng. 2021, 22, 85–97. [Google Scholar] [CrossRef]
  3. Singh, K.; Sharma, A. Road Cut Slope Stability Analysis at Kotropi Landslide Zone Along NH-154 in Himachal Pradesh, India. J. Geol. Soc. India 2022, 98, 379–386. [Google Scholar] [CrossRef]
  4. Dias, A.S.; Pirone, M.; Nicotera, M.; Urciuoli, G. Hydraulic characterization of an unsaturated vegetated soil: The role of plant roots and hydraulic hysteresis. Geomech. Energy Environ. 2021, 30, 100235. [Google Scholar] [CrossRef]
  5. Sun, Y.; Yang, K.; Hu, R.; Wang, G.; Lv, J. Model Test and Numerical Simulation of Slope Instability Process Induced by Rainfall. Water 2022, 14, 3997. [Google Scholar] [CrossRef]
  6. Amarasinghe, M.; Kulathilaka, A.; Robert, D.; Zhou, A.; Jayathissa, H. Risk assessment and management of rainfall-induced landslides in tropical regions: A review. Nat. Hazard. 2023, 120, 2179–2231. [Google Scholar] [CrossRef]
  7. Yang, B.; Zhou, C.; Li, S.; Wang, Y. A Chinese named entity recognition method for landslide geological disasters based on deep learning. Eng. Appl. Artif. Intell. 2025, 139, 109537. [Google Scholar] [CrossRef]
  8. Ohba, M.; Kawase, H. Rain-on-Snow events in Japan as projected by a large ensemble of regional climate simulations. Clim. Dyn. 2020, 55, 2785–2800. [Google Scholar] [CrossRef]
  9. Houston, S. Unsaturated Soil Mechanics Topics for All Geotechnical Engineers. Indian Geotech. J. 2024, 55, 3537–3553. [Google Scholar] [CrossRef]
  10. Liu, X.; Dong, J.; Tang, C.; Pan, Y.; Zhao, J.; Wei, Z. Instability mechanism of loess-mudstone landslides under rainfall infiltration conditions. Sci. Rep. 2025, 15, 17591. [Google Scholar] [CrossRef]
  11. Yi, W.; Luo, H.; Huang, X.; Zhu, X.; Wang, Z.; Li, Y. Research on the deformation mechanisms of accumulated landslides induced by different rain patterns based on flume model tests. PLoS ONE 2025, 20, e0329728. [Google Scholar] [CrossRef]
  12. Fang, W.; You, R.; Hou, H.; Sun, J.; Yu, T. Slope stability analysis under rainfall infiltration condition using the minimum potential energy method. Arch. Civ. Mech. Eng. 2023, 23, 117. [Google Scholar] [CrossRef]
  13. Gu, C.; Chen, L.; Zuo, W.; Li, W.; Man, H.; Lu, H.; Ji, F. Study on rainfall infiltration characteristics and instability mechanism of a lateritic soil landslide in Yunnan, China. Front. Earth Sci. 2024, 12, 1478570. [Google Scholar] [CrossRef]
  14. Qu, L.; Du, Q.; Xue, J. Model Test Study of the Influence of Rainfall Intensity and Soil Permeability on Slope Instability. KSCE J. Civ. Eng. 2024, 28, 2722–2737. [Google Scholar] [CrossRef]
  15. Kim, Y.; Rahardjo, H.; Nistor, M.M.; Satyanaga, A.; Leong, E.-C.; Sham, A.W.L. Assessment of critical rainfall scenarios for slope stability analyses based on historical rainfall records in Singapore. Environ. Earth Sci. 2022, 81, 39. [Google Scholar] [CrossRef]
  16. Zhang, J.M.; Luo, Y.; Zhou, Z.; Victor, C.; Duan, M.D. Research on the rainfall-induced regional slope failures along the Yangtze River of Anhui, China. Landslides 2021, 18, 1801–1821. [Google Scholar] [CrossRef]
  17. Tan, Y.-l.; Cao, J.-j.; Xiang, W.-x.; Xu, W.-z.; Tian, J.-w.; Gou, Y. Slope stability analysis of saturated–unsaturated based on the GEO-studio: A case study of Xinchang slope in Lanping County, Yunnan Province, China. Environ. Earth Sci. 2023, 82, 322. [Google Scholar] [CrossRef]
  18. Ren, G.M.; Xia, M.; Lv, S.M. Stability Analysis of a Landslide Influenced by Rainfall. Soil Mech. Found. Eng. 2023, 60, 55–62. [Google Scholar] [CrossRef]
  19. Guo, Y.; Du, Y.; Shan, W.; Liu, M.; Zhang, C. Numerical Analysis on the Stability of Sandstone-Covered Mudstone Cutting Slopes Considering Rainfall Infiltration. Appl. Sci. 2023, 13, 1802. [Google Scholar] [CrossRef]
  20. Wu, T.; Jia, J.; Jiang, N.; Zhou, C.; Luo, X.; Xia, Y. Model Test of Deformation Evolution and Multi Factor Prediction of Anchorage Slope Stability under Rainfall Condition. J. Earth Sci. 2020, 31, 1109–1120. [Google Scholar] [CrossRef]
  21. Siva Subramanian, S.; Fan, X.; Yunus, A.P.; van Asch, T.; Scaringi, G.; Xu, Q.; Dai, L.; Ishikawa, T.; Huang, R. A Sequentially Coupled Catchment-Scale Numerical Model for Snowmelt-Induced Soil Slope Instabilities. J. Geophys. Res. 2020, 125, e2019JF005468. [Google Scholar] [CrossRef]
  22. Zhu, Y.L.; Ishikawa, T.; Subramanian, S.S.; Luo, B. Early warning system for rainfall- and snowmelt-induced slope failure in seasonally cold regions. Soils Found. 2021, 61, 198–217. [Google Scholar] [CrossRef]
  23. Yan, T.; Xiong, J.; Ye, L.; Gao, J.; Xu, H. Field Investigation and Finite Element Analysis of Landslide-Triggering Factors of a Cut Slope Composed of Granite Residual Soil: A Case Study of Chongtou Town, Lishui City, China. Sustainability 2023, 15, 6999. [Google Scholar] [CrossRef]
  24. Zhang, C.L.; Qin, M.D.; Hong, L.; Qi, Y.F. Seepage and stability analysis of fractured soil slope considering permeability anisotropy. Sci. Rep. 2025, 15, 11. [Google Scholar] [CrossRef] [PubMed]
  25. Danoosh, A.; Al-Hadidi, M. Numerical simulation to the effect of applying rationing system on the stability of the Earth canal: Birmana canal in Iraq as a case study. J. Mech. Behav. Mater. 2022, 31, 729–738. [Google Scholar] [CrossRef]
  26. Zhu, J.-f.; Chen, C.-f.; Zhao, H.-y. An Approach to Assess the Stability of Unsaturated Multilayered Coastal-Embankment Slope during Rainfall Infiltration. J. Mar. Sci. Eng. 2019, 7, 165. [Google Scholar] [CrossRef]
  27. Fredlund, D.; Xing, A. Equations for the Soil–Water Characteristic Curve. Can. Geotech. J. 1994, 31, 521–532. [Google Scholar] [CrossRef]
  28. Tran, T.P.A.; Fredlund, D. Relationship of “Fredlund–Xing (1994) Fitting Parameters” to “Anchor Points” on Soil–Water Characteristic Curve. Indian Geotech. J. 2022, 53, 583–592. [Google Scholar] [CrossRef]
  29. Liao, Y.; Le, J.; Hu, L.; Gu, W.; Xu, J. Application of seepage analyses based on Fredlund & Xing model in red beds terrace landslides in eastern Sichuan. Hydrogeol. Eng. Geol. 2023, 50, 104–114. [Google Scholar]
  30. Sun, Z.; Wang, S.; Yang, T.; Liu, H. Infiltration Mechanism and Stability Analysis of Multilayer Soil Slope Under Rainfall Conditions. J. Northeast. Univ. Nat. Sci. 2020, 41, 1201–1208. [Google Scholar]
  31. Wang, L.; Shang, Y.; Zheng, J.; Zhang, Y. Temporary Confined Water-Induced Landslide in the Binary Structure of a Gentle Slope: A Case Study of the Fanshantou Landslide. Water 2021, 13, 596. [Google Scholar] [CrossRef]
  32. Zhou, Y.; He, Q.; Li, M.; Sun, Z.; He, F. Stability Analysis of Unsaturated Soil Slope Considering Seepage-Stress Coupling under Different Rainfall Conditions. J. Chongqing Jiaotong Univ. Nat. Sci. 2023, 42, 57–63. [Google Scholar]
  33. GB/T 28592-2012; Grade of Precipitation. China Standards Press: Beijing, China, 2012.
  34. Huang, F.; Liu, K.; Li, Z.; Zhou, X.; Zeng, Z.; Li, W.; Huang, J.; Catani, F.; Chang, Z. Single landslide risk assessment considering rainfall-induced landslide hazard and the vulnerability of disaster-bearing body. Geol. J. 2024, 59, 2549–2565. [Google Scholar] [CrossRef]
  35. Song, K.; Han, L.Y.; Ruan, D.; Li, H.; Ma, B.H.; Dunkerley, D. Stability Prediction of Rainfall-Induced Shallow Landslides: A Case Study of Mountainous Area in China. Water 2023, 15, 2938. [Google Scholar] [CrossRef]
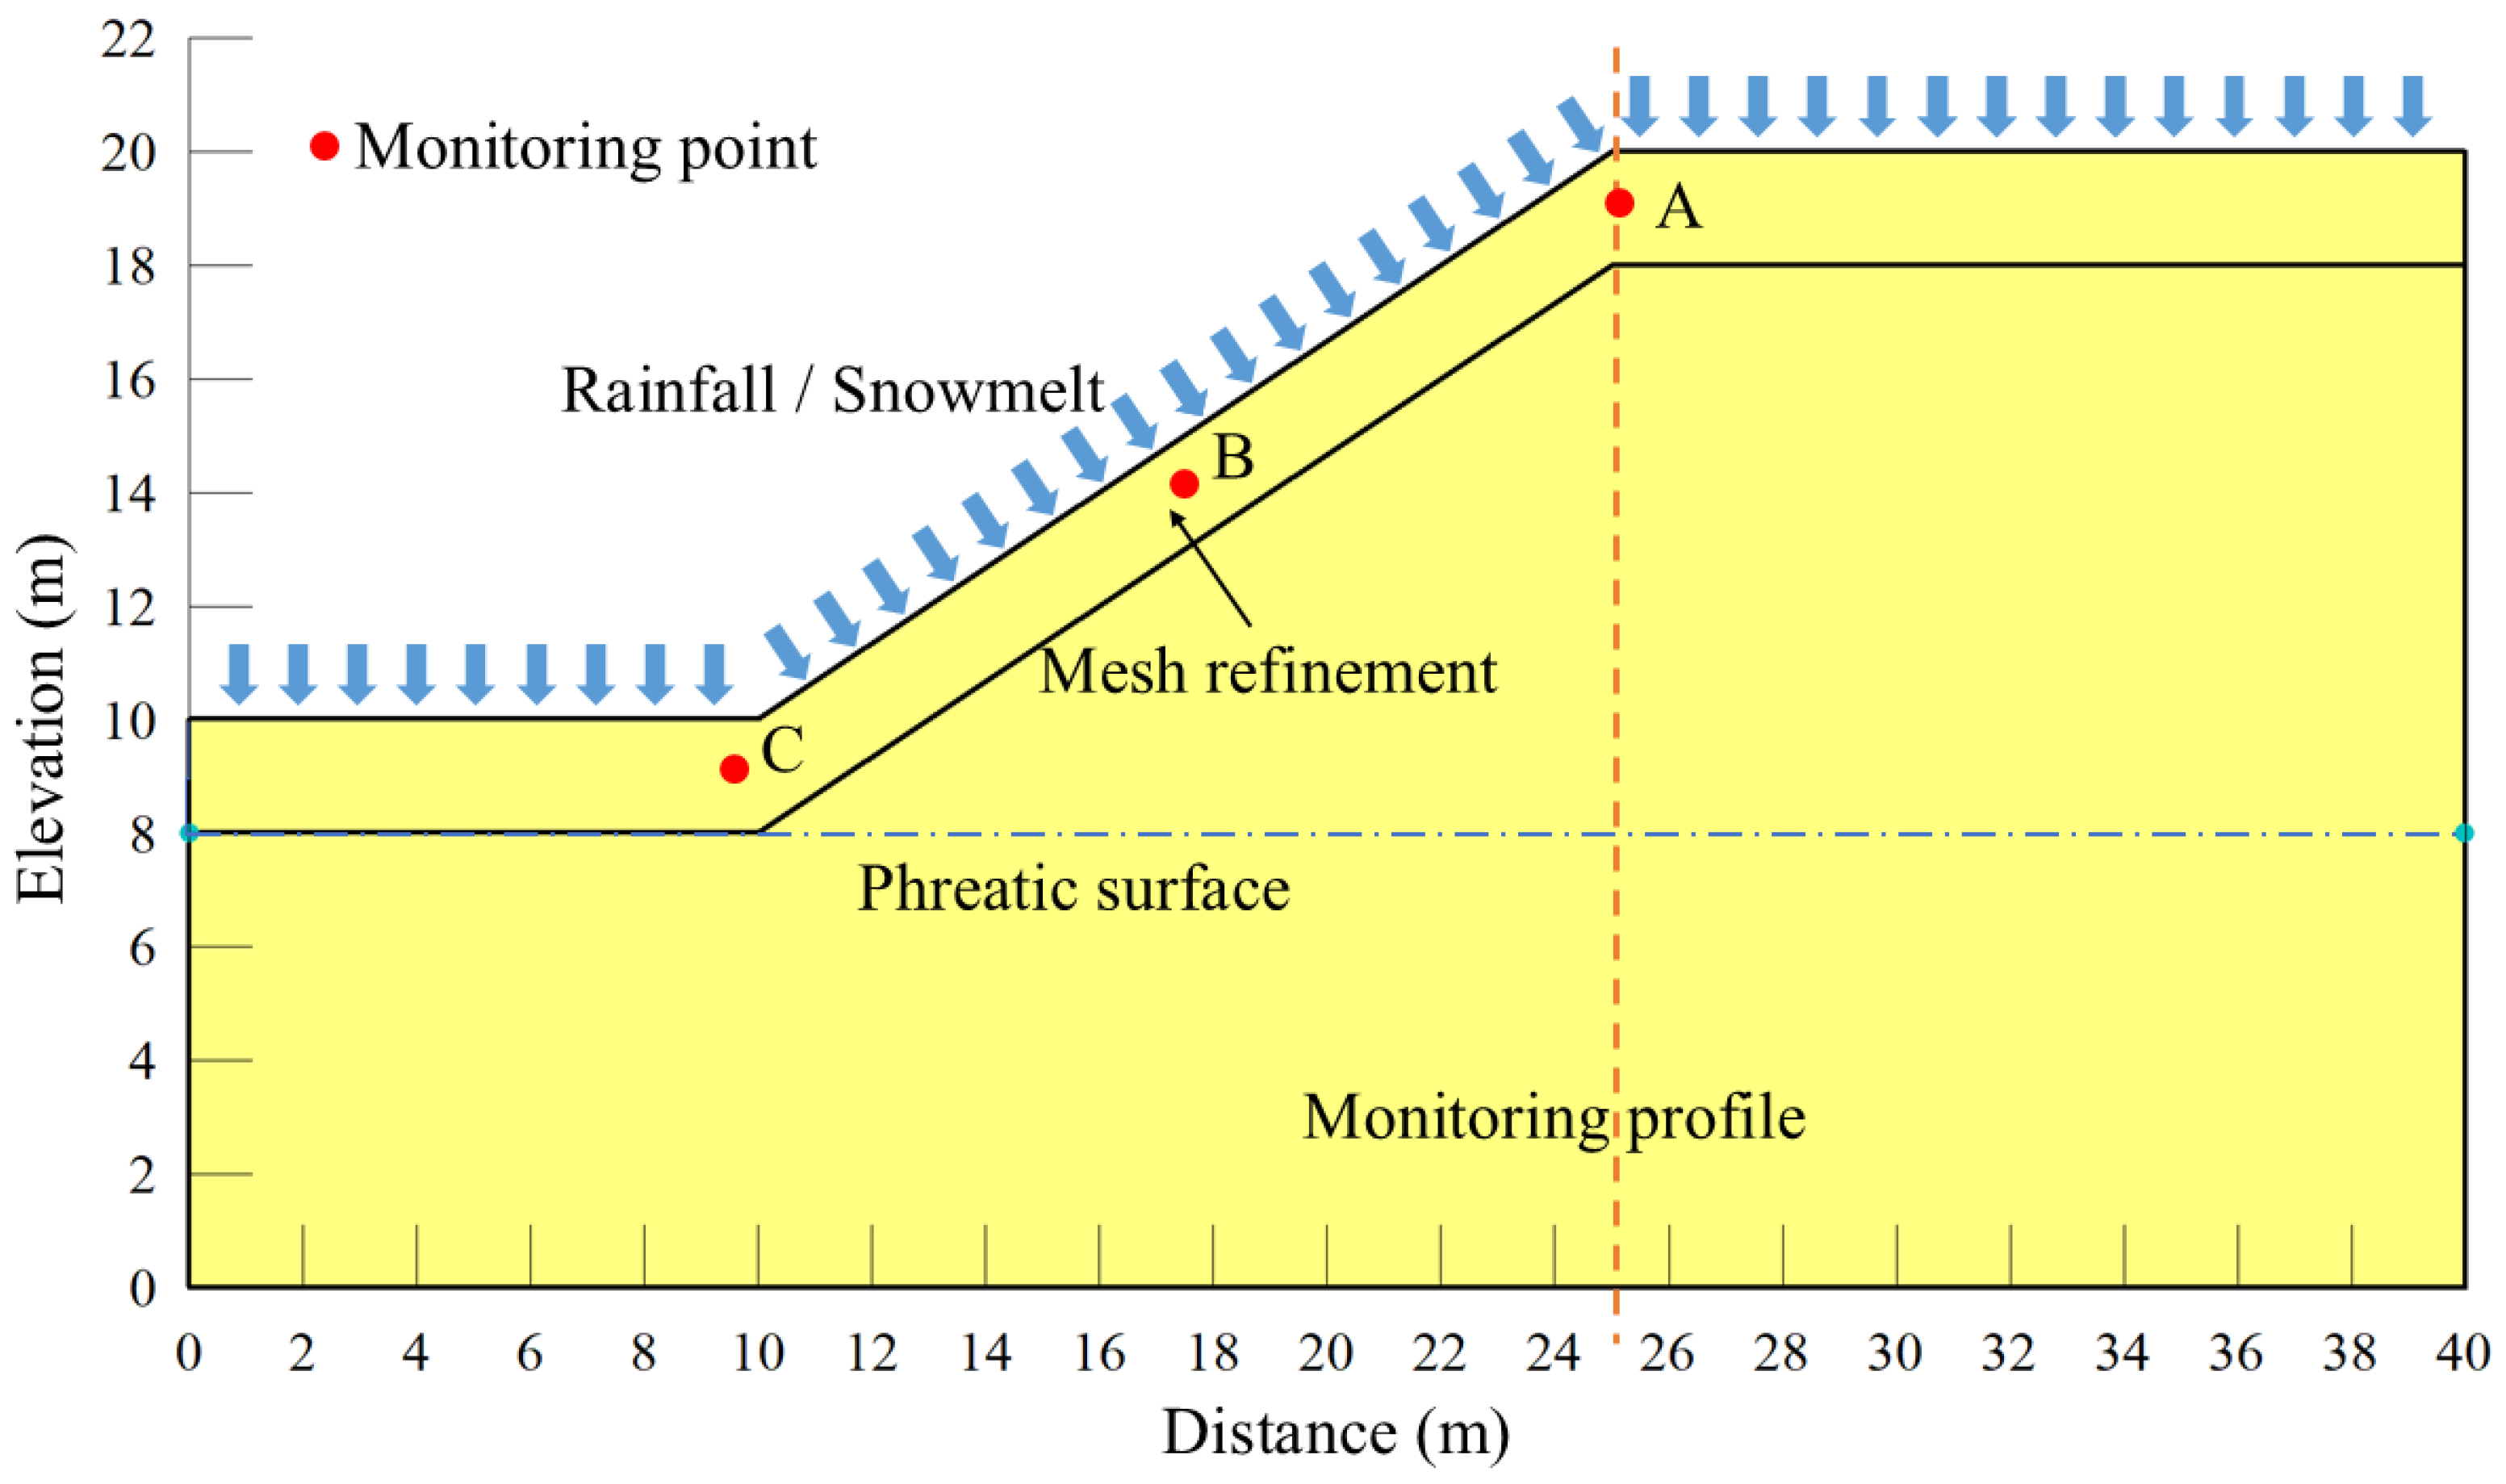
Figure 1. Schematic diagram of the numerical model and monitoring locations. Points A, B, and C indicate the observation points at 1.0 m depth along the slope surface.
Water 18 00594 g001
Figure 2. Hydraulic properties of the silty clay: (a) Soil-water characteristic curve; (b) Hydraulic conductivity function.
Water 18 00594 g002
Figure 3. Mesh configuration.
Water 18 00594 g003
Figure 4. (a) Soil-water characteristic curve; (b) Hydraulic conductivity function; (c) Hydraulic conductivity function.
Water 18 00594 g004
Figure 5. Boundary conditions of the seepage model.
Water 18 00594 g005
Figure 6. Comparison of total water influx intensity between rainfall-only and rainfall-with-snowmelt scenarios.
Water 18 00594 g006
Figure 7. Temporal evolution of the factor of safety (FOS) under different rainfall intensities during and after rainfall.
Water 18 00594 g007
Figure 8. Pore-water pressure profiles at the slope crest under different rainfall intensities (t = 22.4 h).
Water 18 00594 g008
Figure 9. Spatiotemporal evolution of pore-water pressure profiles at the slope crest monitoring section, illustrating the moisture redistribution process.
Water 18 00594 g009
Figure 10. (a) Monitoring Point A; (b) Monitoring Point B; (c) Monitoring Point C.
Water 18 00594 g010
Figure 11. Distribution of pore-water pressure contours at the monitoring section under violent rainfall (t = 22.4 h). The dashed line represents the zero pore-water pressure line (phreatic surface).
Water 18 00594 g011
Figure 12. Comparison of the time-histories of FOS between rainfall-only and rainfall-with-snowmelt scenarios.
Water 18 00594 g012
Table 1. Material parameters and basic parameters defined in GeoStudio.
Parameter CategoryParameter Name in GeoStudioSymbolValueUnit
PhysicalSoil Classification-Silty Clay-
Unit Weight γ 17.53kN/m3
Hydraulic (SEEP/W)Material Model-Saturated/Unsaturated-
Vol. Water Content Function-Van Genuchten-
Hydraulic Conductivity Function-Fredlund-Xing-
Saturated hydraulic
conductivity
k s a t 5.02   × 10−7m/s
Saturated water content θ s 0.35-
Mechanical (SLOPE/W)Material Model-Mohr-Coulomb-
Effective cohesion c 10.35kPa
Effective friction angle ϕ 26(°)
Table 2. Summary of simulation scenarios and hydraulic boundary conditions.
Scenario IDRainfall
Classification
Rainfall
Intensity
q r a i n  (mm/d)
Snowmelt
Intensity
q s n o w  (mm/d)
Total Influx
q t o t a l  (mm/d)
Duration
(h)
ModerateModerate Rain (10–25 mm/d)2002024
HeavyHeavy Rain (25–50 mm/d)4504524
ViolentViolent Rain (50–100 mm/d)9009024
Rain + SnowViolent Rain902011024
Note: The classification is based on the national standard GB/T 28592-2012.
Table 3. Summary of minimum FOS and lag time under different rainfall intensities.
Rainfall IntensityMinimum FOSTime of Minimum FOS (h)Lag Time (h)
Moderate1.9032.038.03
Heavy1.8828.504.50
Violent1.8425.361.36
Table 4. Summary of pore-water pressure response characteristics and saturation status at different monitoring points.
Monitoring PointPoint A (Crest)Point B (Middle)Point C (Toe)
Elevation (m)19159
Initial PWP (kPa)−104.04−68.84−9.81
PWP at end of rainfall (t = 22.4) (kPa)−103.87−64.505.46
Maximum PWP (kPa)−101.38−51.596.18
Time to Peak (h)363625.36
Saturation StatusUnsaturatedUnsaturatedSaturated
Disclaimer/Publisher’s Note: The statements, opinions and data contained in all publications are solely those of the individual author(s) and contributor(s) and not of MDPI and/or the editor(s). MDPI and/or the editor(s) disclaim responsibility for any injury to people or property resulting from any ideas, methods, instructions or products referred to in the content.