Project Report

Socioeconomic Dimensions of Dynamic Urban Flood Risk, Migration, Vulnerability, and Coping Capacity: The Case of Peri-Urban Phnom Penh, Cambodia

Department of Civil and Environmental Engineering, Graduate School of Urban Environmental Sciences, Tokyo Metropolitan University, Hachioji City 192-0397, Japan
*
Author to whom correspondence should be addressed.
Water 2026, 18(5), 583; https://doi.org/10.3390/w18050583
Submission received: 21 January 2026 / Revised: 18 February 2026 / Accepted: 25 February 2026 / Published: 28 February 2026

Abstract

Urban flooding increasingly challenges rapidly expanding cities in developing countries. Migration, weak urban planning, and unregulated land use collectively intensify flood risk. Effective flood mitigation requires understanding the dynamic interactions between physical and social processes that shape urban vulnerability. This study examines how migrant households in flood-prone areas adapt over time to enhance resilience. The study applies a dynamic flood risk framework using settlement-duration cohorts from 560 peri-urban households in Phnom Penh. Findings show that rapid in-migration into flood-prone zones has increased physical exposure to flood hazards. Migrants’ adaptation and resilience, however, develop gradually, reducing vulnerability only over time. Newer migrants remain highly vulnerable due to insecure housing, limited renovation, and restricted access to flood information. Long-term migrants face structural and economic challenges, including low income, limited access to credit, and deteriorating housing conditions. Mid-term migrants demonstrate the strongest adaptive capacity, supported by stable income, housing investment, and access to flood information. Overall, the study contributes to more dynamic urban risk frameworks that incorporate demographic and socioeconomic transitions. These insights are relevant for other rapidly growing cities, particularly those in Southeast Asia.

1. Introduction

Urban floods are among the most disruptive and costly natural disasters, causing widespread social and economic losses [1,2]. In Southeast Asia, rapid and unplanned urbanisation has intensified these impacts, particularly in cities with weak land-use regulation and delayed flood mitigation [3]. Major regional cities such as Jakarta, Manila, and Bangkok have suffered increasingly severe floods over the past two decades, illustrating the escalating intersection of urban growth and hydrological stress [4,5].
Flood risk is shaped not only by physical hazards but also by exposure, vulnerability, and coping capacity. These components interact dynamically as cities expand and populations migrate. This study adopts a multi-dimensional model based on the Methods for the Improvement of vulnerability Assessment in Europe (MOVE) framework [6] and subsequent refinements by Imamura (2022) [7]:
Flood Risk (R) = f (H, E, V, C)
where:
H = Flood Hazard (frequency, depth, duration),
E = Exposure (population and asset concentration in flood-prone zones),
V = Vulnerability (physical and socioeconomic susceptibility),
C = Coping Capacity (financial, institutional, and social adaptive resources).
Hazard (H) represents flood frequency and intensity. Exposure (E) refers to the concentration of people and assets in flood-prone zones. Vulnerability (V) reflects physical and socioeconomic fragility, and Coping Capacity (C) captures the ability to anticipate, withstand, and recover from floods. Higher coping capacity reduces overall risk [8,9].
Existing Southeast Asian studies rely heavily on hydrological or spatial modelling and treat social dynamics as static [3,10]. While informative, these approaches often overlook the socio-spatial dimensions of vulnerability [10]. Few studies integrate rapid urbanisation, growth in informal settlements, or migration into flood risk assessment [3,11,12]. It limits understanding of how flood risk evolves alongside migration and urban transformation. In Phnom Penh, the rapid expansion of informal settlements into low-lying wetlands has magnified flood exposure. However, temporal changes in vulnerability and coping capacity remain underexplored. Addressing this gap, this paper introduces a dynamic flood risk concept that links urbanisation, migration, and socioeconomic differentiation through an empirical household survey. The study contributes conceptually by operationalising flood risk as a dynamic and evolving process. It also contributes practically by generating policy-relevant evidence to inform resilience planning and adaptive management.
Most studies rely on hydrological modelling or spatial exposure mapping and treat vulnerability as a static attribute. Despite extensive scholarship on urban flood risk in Southeast Asia, few studies empirically examine how migration-driven settlement dynamics reshape exposure, vulnerability, and coping capacity over time. In particular, the temporal interaction between settlement duration, socioeconomic differentiation, and adaptive capacity remains underexplored. This study addresses that gap by operationalising settlement duration as a dynamic proxy for urban transformation.
It examines how migrant groups experience varying levels of vulnerability and coping capacity, contributing to debates on inclusive disaster risk reduction. By analysing uneven access to land, infrastructure, and institutional support, the study advances understanding of stratified resilience outcomes. The research therefore informs community-based adaptation, equitable urban planning, and governance strategies to reduce structural inequalities in peri-urban risk environments.
The study analyses how migration and settlement duration influence flood risk in Phnom Penh’s peri-urban areas. It investigates the temporal evolution of Exposure (E), Vulnerability (V), and Coping Capacity (C) across settlement-duration cohorts (1–10, 11–30, and >30 years). This approach identifies how socioeconomic differentiation shapes resilience and risk under rapid urbanisation.

2. Materials and Methods

2.1. Framework for Dynamic Flood Risk

Flood hazard (H) is captured through household reports of flood frequency, depth, and duration [13]. Exposure (E) arises from urban expansion and population concentration in flood-prone zones, where housing investment often precedes drainage infrastructure [6,14]. In this study, exposure is proxied by population growth within the target peri-urban areas, which have expanded predominantly into low-lying floodplain zones.
For analytical clarity, hazard (H) is treated as relatively constant across settlement-duration cohorts over the past 30 years, excluding long-term climate change effects. This assumption enables the isolation of socioeconomic and spatial drivers of flood risk. By holding hazard conditions constant for comparison, the analysis examines how migration, land-use change, and settlement consolidation reshape exposure, vulnerability, and coping capacity.
Incorporating climate variability or long-term hydrological change would introduce additional interacting variables and potentially obscure the relative contribution of demographic and urban restructuring processes. Therefore, the findings should be interpreted within a short- to medium-term hazard stability framework. Future research integrating downscaled climate projections could examine how evolving hazard regimes interact with migration dynamics.
Vulnerability (V) reflects physical fragility and socioeconomic insecurity. Poor housing quality, rental tenure, and proximity to waterways increase susceptibility [15,16]. Coping capacity (C) refers to the adaptive resources available to households. These include financial, educational, and institutional assets that enable them to mitigate flood impacts [17]. Over time, coping capacity improves through housing investment, social learning, and institutional support [18,19].
To operationalise temporal change, settlement duration serves as a proxy for urban dynamics. New migrants (1–10 years) constitute a rapid influx into informal or transitional zones, with high exposure and low coping capacity. Mid-term migrants (11–30 years) occupy maturing areas with mixed risks and growing resilience. Old migrants (>30 years) often face physical vulnerabilities due to aging housing and infrastructure. This temporal approach captures the evolution of flood risk as urban communities consolidate over time. It extends the MOVE model by incorporating demographic transitions and social learning processes, providing a basis for dynamic flood risk assessment in rapidly growing cities. The MOVE framework conceptualises vulnerability and risk as multidimensional and interrelated. However, it does not explicitly operationalise temporal transitions associated with migration and settlement consolidation.
This study extends MOVE by introducing settlement duration as a measurable proxy for urban transformation. Settlement duration captures shifts in exposure, vulnerability, and coping capacity across migration phases. Rather than treating risk components as static, the framework conceptualises flood risk as a temporally evolving process. This approach links demographic transitions and spatial restructuring to dynamic risk production. The migrant cohorts include both male and female respondents across multiple age categories. The survey did not stratify the analysis by gender or age group. Settlement duration served as the primary cohort classification variable. Demographic characteristics were recorded but not used for subgroup analysis. While gender and age may influence patterns of vulnerability, this study isolates temporal dynamics of settlement. Future research should incorporate gender-disaggregated and age-specific vulnerability assessments.
Settlement duration serves as a proxy for temporal urban dynamics. It reflects cumulative exposure to environmental risk, infrastructure change, and social integration processes. However, it does not capture intra-cohort heterogeneity or non-linear life-course trajectories. Households with similar residence duration may differ in income, housing tenure, and mobility history. Settlement duration, therefore, approximates, rather than precisely measures, dynamic change. It is employed as a pragmatic indicator of temporal differentiation within rapidly evolving peri-urban contexts.

2.2. Study Area and Spatial Data

Phnom Penh was selected because it typifies rapid, uneven urbanisation and rising flood exposure. The city’s built-up area expanded from 3000 ha in 1973 to 25,000 ha in 2015 [20]. Much of this growth occurred through wetland infill and settlement on low-lying land. In 2022, floods affected 85,000 households and caused 15 deaths [21]. Although smaller than Bangkok, Jakarta, or Manila, Phnom Penh has urbanised more rapidly over the past two decades [20]. Between 2000 and 2020, its population grew by over 80% [22], compared with 72% in Bangkok, 29% in Jakarta, and 39% in Manila [23,24,25]. Weak regulation and land speculation have driven settlement expansion into flood-prone areas [21,26]. These trends make Phnom Penh an ideal case for analysing dynamic flood risk under rapid urbanisation. Four Sangkats (communes), the sub-district administrative units within Phnom Penh, were selected for the study.
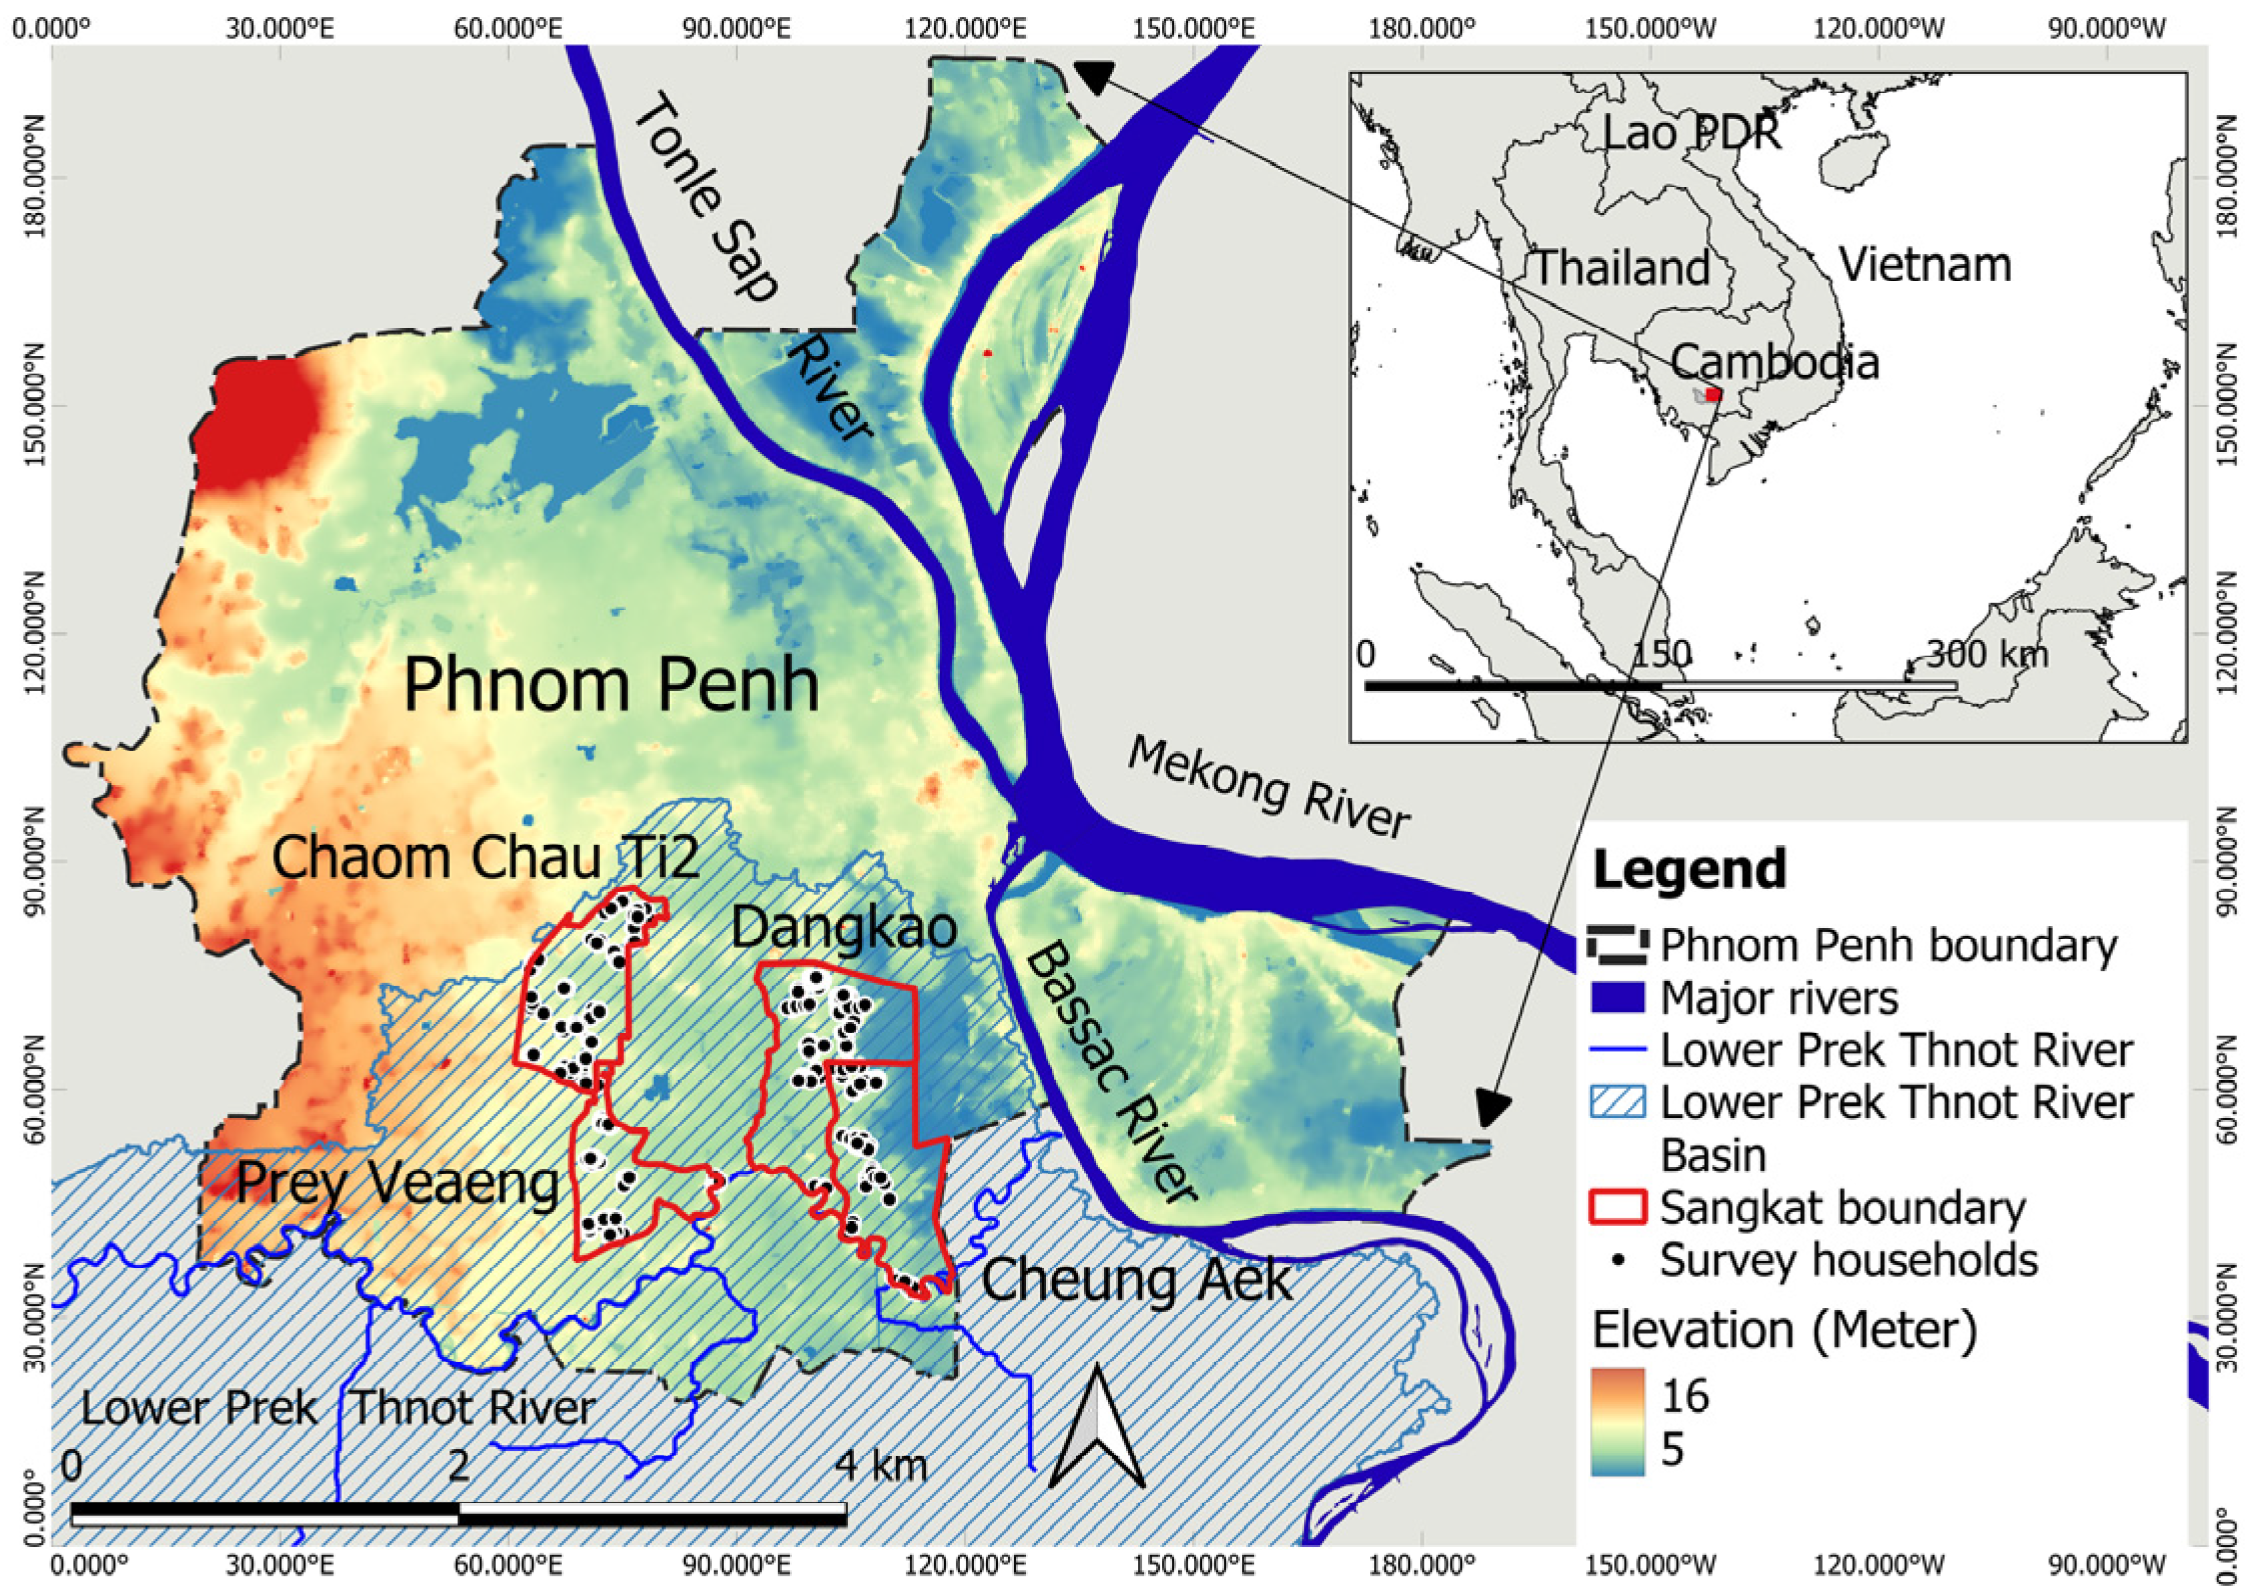
Phnom Penh is located at the confluence of the Mekong, Tonle Sap, and Bassac rivers. The city occupies a low-lying alluvial floodplain. Elevation ranges between approximately 5 and 16 m above sea level. Among the four study sites, Dangkao and Cheung Aek exhibit the lowest mean elevations (9.82 m and 9.87 m, respectively), while Prey Veaeng is comparatively higher (13.71 m). We obtained elevation data from GIS-referenced KoBoToolbox field survey records. Field-based elevation coordinates were cross-validated using the FABDEM V1-2 digital elevation model. FABDEM provides high-resolution, bias-corrected terrain data for urban environments [27]. Relief shading covers the entire Phnom Penh metropolitan area, ensuring consistent topographic representation. The Lower Prek Thnot River Basin overlay provides only a hydrological context. The overlay does not modify underlying elevation values.
Peri-urban expansion occurs predominantly in lower-elevation zones. These areas historically functioned as wetlands and seasonal retention zones. Rapid land infill has reduced natural drainage capacity. These topographic conditions increase susceptibility to pluvial and fluvial flooding. Figure 1 illustrates the spatial distribution of the four study sites. Dangkao is fully urbanised, with 1034 ha of residential land and minimal flood buffers. Chaom Chau Ti2 remains partly transitional, with 1115 of 1605 ha urbanised and 480 ha of wetlands retained. Cheung Aek, with 1389 ha of residential land, has lost most of its wetlands, resulting in worse drainage and increased hazard intensity. Prey Veaeng is still semi-rural, with 639 ha of farmland and 290 ha of housing, and faces lower exposure but higher vulnerability due to weak infrastructure and reliance on farming [28].

2.3. Methodology and Data Collection

The study employs a mixed-methods approach combining quantitative and descriptive analyses. Flood risk is evaluated through differentiated analysis of its components—Hazard (H), Exposure (E), Vulnerability (V), and Coping Capacity (C)—without constructing a composite index.

2.3.1. Secondary Data and Exposure Analysis

Exposure (E) is derived from secondary spatial and demographic data. First, peri-urban population trends in Phnom Penh between 2005 and 2025 are analysed as a proxy for urban exposure. Population data for 2005, 2015, and 2025 were obtained from commune databases and the councils of Sangkats [28,29].
Second, the study examines the relationship between annual population growth rates and the flood hazard index across Phnom Penh’s districts. District-level population data were obtained from the 2008 and 2019 population censuses [30,31]. The district-level flood hazard index quantifies the relative frequency of flooding. Flood frequency data were derived from the Global Flood Database for the period 2000–2018 [32]. The total number of flood events was aggregated for each district and standardised using Min–Max normalisation to produce values between 0 and 1. Higher values indicate greater relative flood frequency. The index enables inter-district comparison rather than absolute hazard measurement (see Supplementary S1 for methodology).

2.3.2. Sampling Strategy

The four selected Sangkats represent varying levels of urbanisation, elevation, wetland retention, and drainage capacity. These characteristics correspond to differing flood hazard and exposure conditions. The survey sample was proportionally distributed across sites and settlement-duration categories to capture variation across high-hazard floodplains, transitional peri-urban zones, and semi-rural areas. This design ensures representation across diverse hazard, exposure, and vulnerability contexts.
Primary data were collected from 560 households selected through stratified random sampling based on Yamane’s (1973) formula [33]. The sample comprises households with varying lengths of residence, including long-term residents and recent migrants. In this study, “migrant group” refers to households relocating to the study areas at different times over the past three decades. Although some long-term residents were locally born, classification is based on duration of residence rather than place of birth. The sample was proportionally distributed across settlement-duration categories and flood-risk zones (see Supplementary S2 for details and Appendix A for survey questionnaire).

2.3.3. Survey Variables and Measurement

Flood hazard intensity is measured using frequency, duration, and depth, adapted from Rana and Routray (2018) [13]. Categories were simplified to fit local flood conditions and sample distribution: frequency (0, 1–5, >5 events/year), duration (<1 day, 1 day–1 week, >1 week), and depth (<0.5 m, 0.5–1 m, >1 m). These thresholds reflect increasing severity while maintaining consistency with established urban flood risk classifications.
Because these measures rely on self-reported household data, they may be subject to recall or perception bias. To enhance reliability, village-level authority interviews were conducted to cross-check reported events. Nevertheless, some measurement error may persist, particularly for events that occurred many years ago.
Vulnerability (V) and coping capacity (C) are assessed through structured household survey questions capturing physical housing conditions, tenure status, preparedness, socioeconomic characteristics, and adaptive behaviour.
The survey examined household demographics, assets, flood experience, relocation history, and coping strategies. Data were collected digitally using KoBoToolbox, with GPS validation and skip-logic checks to ensure accuracy. KoboToolbox is an online platform (https://kobotoolbox.org), a cloud-based data collection system maintained under a rolling production update model. Oversampling (target = 535, achieved = 560) compensated for non-response and ensured subgroup representation.

2.3.4. Statistical Analysis

Descriptive statistics and cross-tabulations were conducted using Stata 18. Pearson’s Chi-square (χ2) tests at the 95% confidence level were applied to assess associations between migrant groups and socioeconomic indicators. χ2 values and significance levels are reported in Section 3.2.3 and Section 3.2.4 and Supplementary S3.
The analysis prioritises descriptive and exploratory statistical techniques. Because most variables are categorical, chi-square tests are appropriate for identifying statistically significant differences between groups. The study does not aim to estimate predictive or causal models, but rather to explore dynamic patterns of risk differentiation across settlement-duration cohorts while maintaining interpretability for policy-oriented applications.

3. Results

3.1. Exposure Dynamics and Urban Growth

3.1.1. Peri-Urban Population Trends in Phnom Penh (2005–2025)

Population growth patterns vary sharply across peri-urban Sangkats. Chaom Chau Ti2 grew rapidly between 2005 and 2015, averaging 12.9% annually, then slowed to 3.2%. Dangkao and Cheung Aek accelerated after 2015, reflecting sustained in-migration and continued development. Prey Veaeng remained stable, growing around 4% per year. These trends show uneven urban expansion driven by land availability, infrastructure, and settlement preference (Table 1). Population growth in peri-urban districts results from both natural increase and in-migration. However, demographic statistics indicate that migration accounts for the most recent growth in Sangkats’ expansion, particularly since 2010. This migration-driven expansion has concentrated settlement in flood-prone peri-urban zones.

3.1.2. Flood Hazard Context and Urban Growth

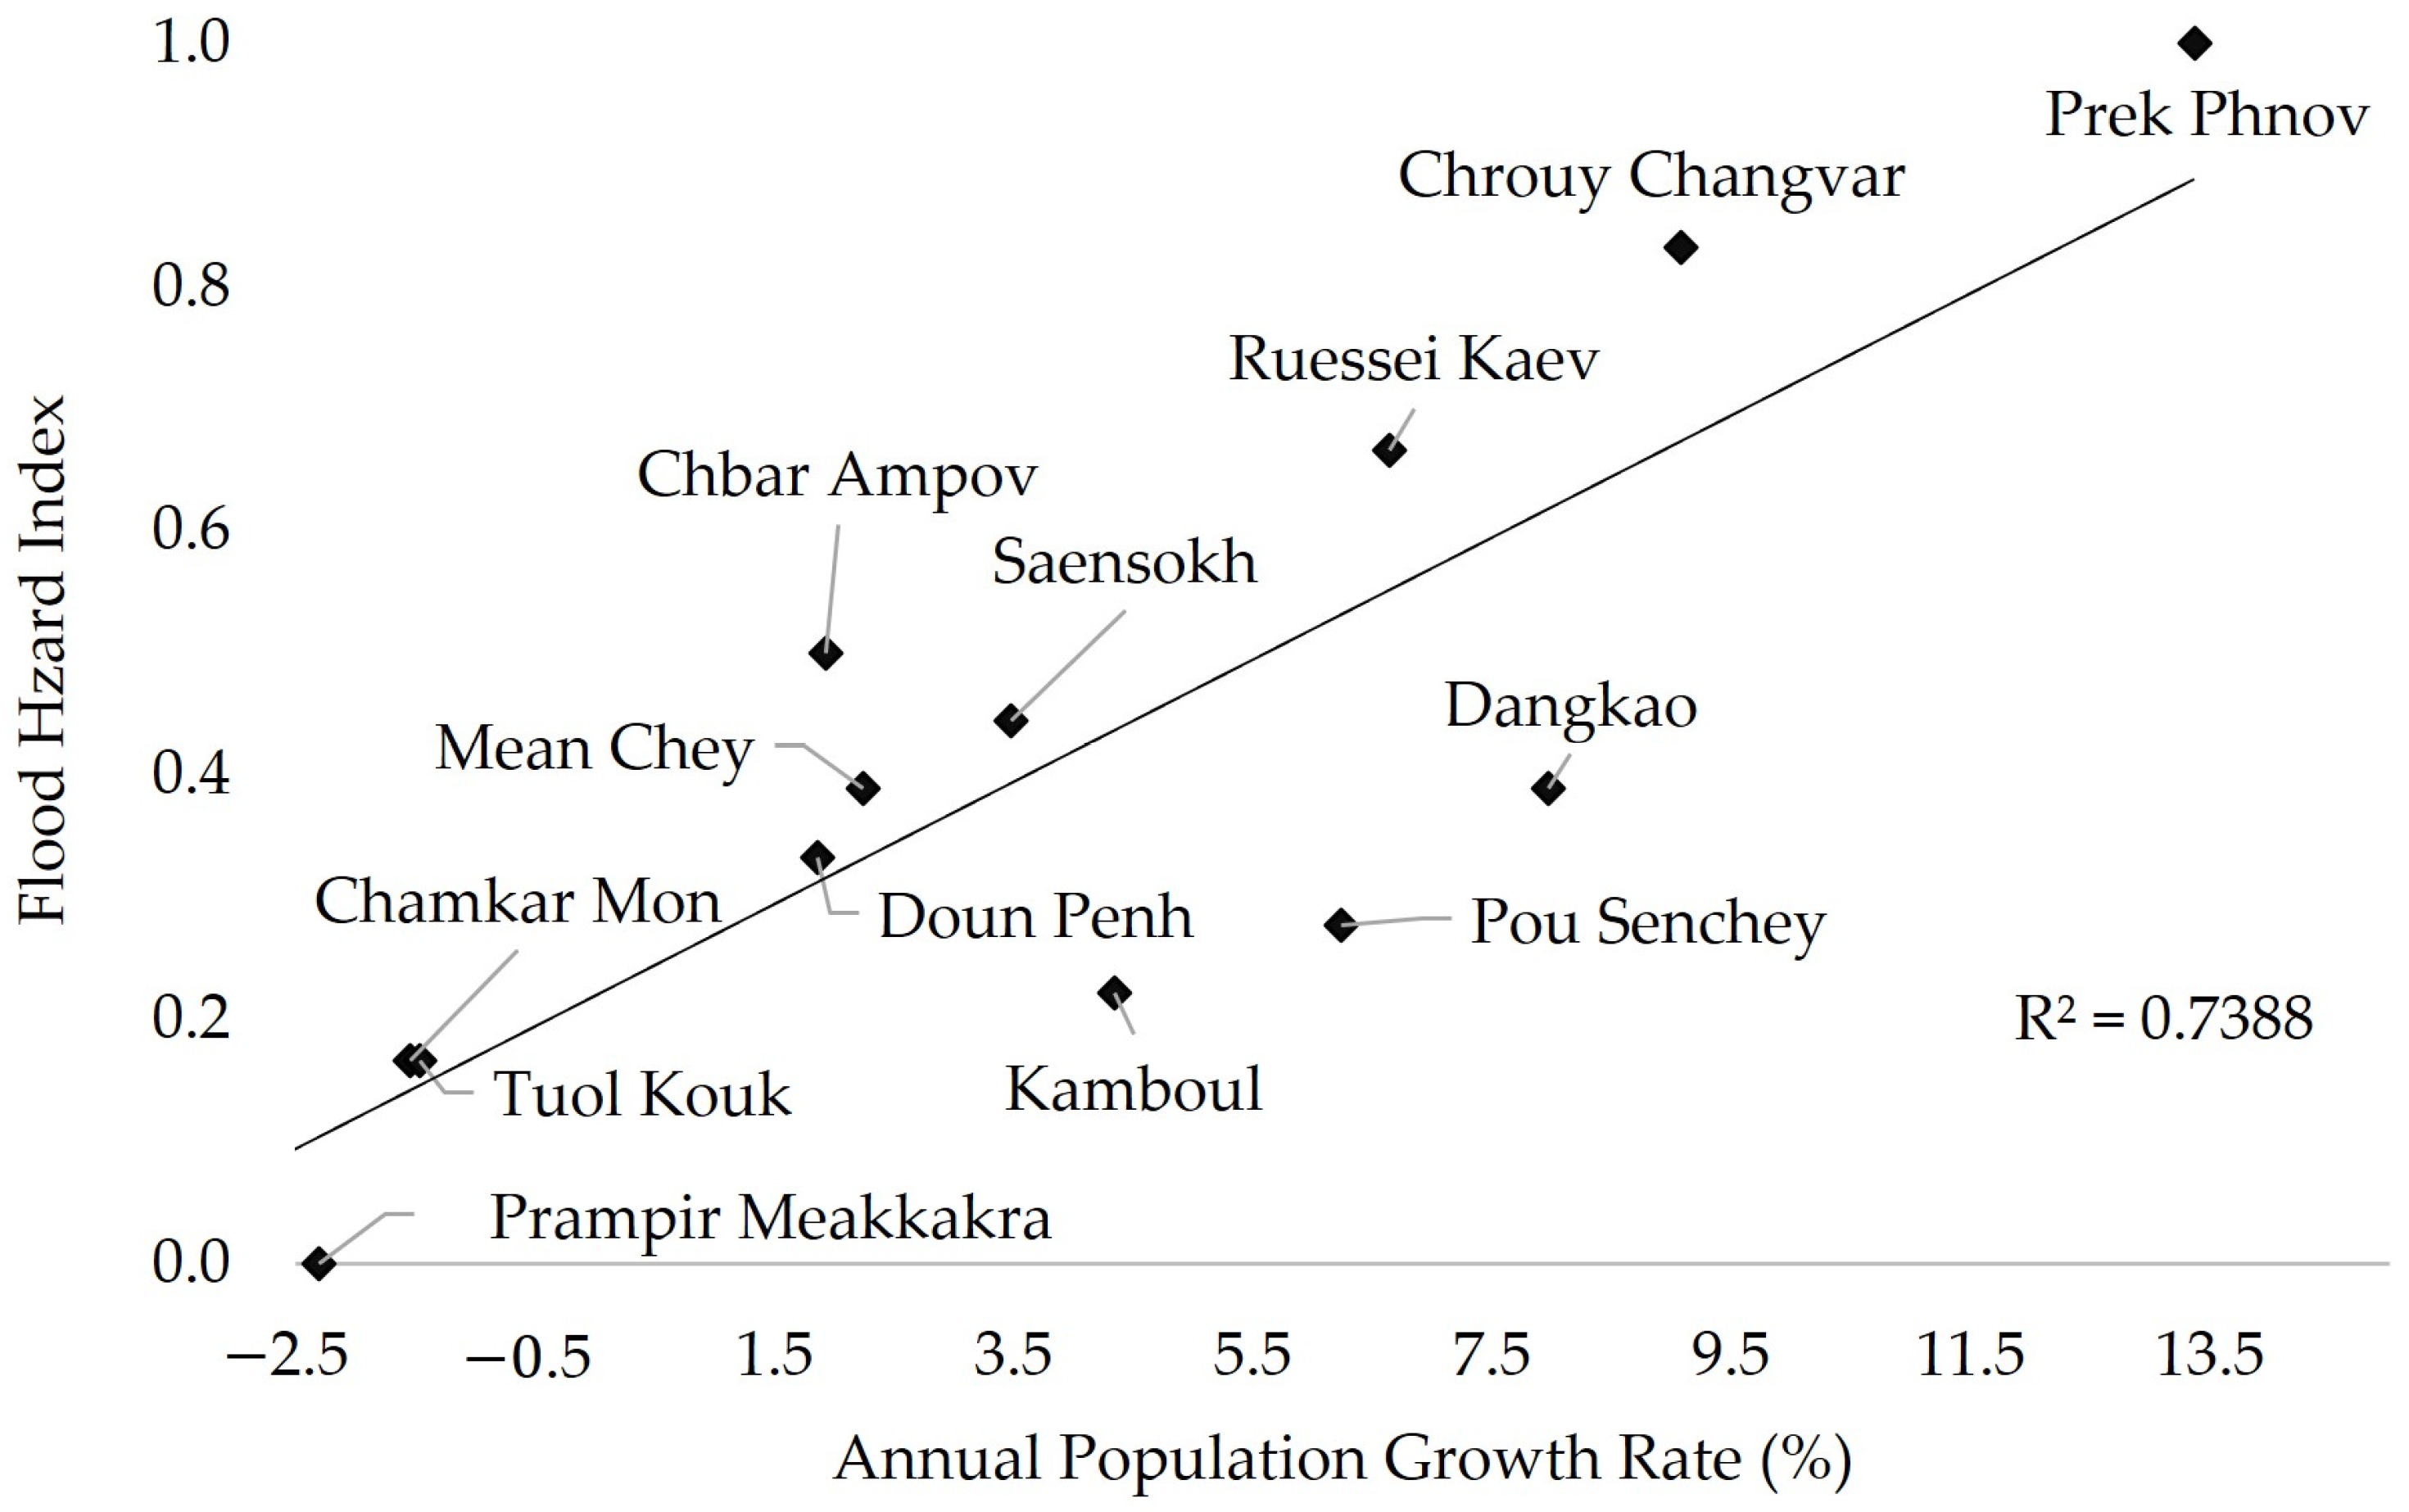
Detailed household surveys were conducted in four peri-urban Sangkats. However, Figure 2 includes all 14 districts of Phnom Penh to illustrate city-wide correlations between urban growth and flood hazard. This broader district-level analysis provides contextual comparison beyond the four core study sites. This section examines the relationship between district-level urban growth and flood hazard in Phnom Penh. The analysis uses annual population growth rates from census data from 2008 and 2019. Flood-hazard indices are derived from the total flood frequency between 2000 and 2018 to assess their relationship. A Pearson correlation analysis reveals a strong positive association (r = 0.86, p < 0.001), accounting for approximately 74% of the variance (R2 = 0.7388). Prek Phnov, Chrouy Changvar, and Dangkao, which are experiencing the most rapid urban expansion, also exhibit the highest flood hazard levels. This pattern indicates that urban growth is occurring in newly urbanized areas, particularly in low-lying, poorly drained zones. Figure 2 visualises this relationship. The scatter plot with a fitted regression line illustrates a proportional increase in flood hazard intensity with increasing population growth. Chamkar Mon represents a partial deviation from this trend. The district exhibits declining population growth yet maintains a positive flood hazard index. This pattern may reflect legacy drainage constraints and high impervious surface coverage. Limited retention areas persist despite slower demographic expansion. Thus, hazard intensity depends not only on growth rates but also on historical urban morphology and infrastructure capacity. (see Supplementary S4 and S5 for hazard index calculation and correlation analysis).

3.1.3. Implications for Exposure

These results demonstrate that population growth is increasingly concentrated in districts with existing hazard potential, thereby raising the exposure (E) component of the dynamic flood risk in Equation 1. The steady influx of residents into peri-urban Sangkats directly amplifies overall flood risk, unless offset by corresponding gains in coping capacity (C). In particular, the acceleration of growth in Dangkao and Cheung Aek suggests that exposure is not only increasing but also spatially clustered, intensifying the E term and raising total risk potential. Chaom Chau Ti2 illustrates how absolute population size alone can elevate exposure. These findings confirm that exposure (E) is a dynamic process shaped by migration and land-use change, and must therefore be incorporated into flood risk modelling as a temporal variable rather than a static condition.

3.2. Flood Hazard, Vulnerability, and Coping Capacity Dynamics

3.2.1. Temporal Pattern of Severe Flooding

Severe floods in Phnom Penh’s peri-urban areas have intensified over the past 34 years (1990–2024). The interviews with 36 village authorities from four Sangkats indicate that floods were infrequent before 2010, averaging one to two events per year. Since 2020, both flood frequency and severity have increased sharply, peaking in 2023 with eight events, or 22% of all cases. This escalation reflects rapid urban expansion, wetland infill, and inadequate drainage capacity. These processes mark a transition from occasional flooding to chronic, urban-induced hydrological stress in Phnom Penh’s growing periphery. The hazard assumption applies to inter-cohort comparison rather than inter-annual trend analysis.

3.2.2. Flood Hazard

Flood Frequency indicators differ significantly across settlement groups (χ2 = 9.81, p = 0.044). New and mid-term migrants experience more frequent and prolonged floods, with nearly one-quarter reporting more than five events annually. Flood duration exceeds one week for 23% of new and 14.4% of mid-term migrants. Long-term migrants (>30 years) report fewer events and are less affected by floods in recent years (Table 2). At the Sangkat scale, Chaom Chau Ti2 and Dangkao are recently urbanised floodplains. They record the most severe flooding. Prey Veaeng and Cheung Aek, located on higher terrain, experience comparatively lower hazard levels. The concentration of new migrants in Dangkao and Cheung Aek—areas characterised by wetland infill, low elevation, and limited drainage infrastructure—helps explain the higher reported frequency of flooding among these cohorts.

3.2.3. Physical Vulnerability

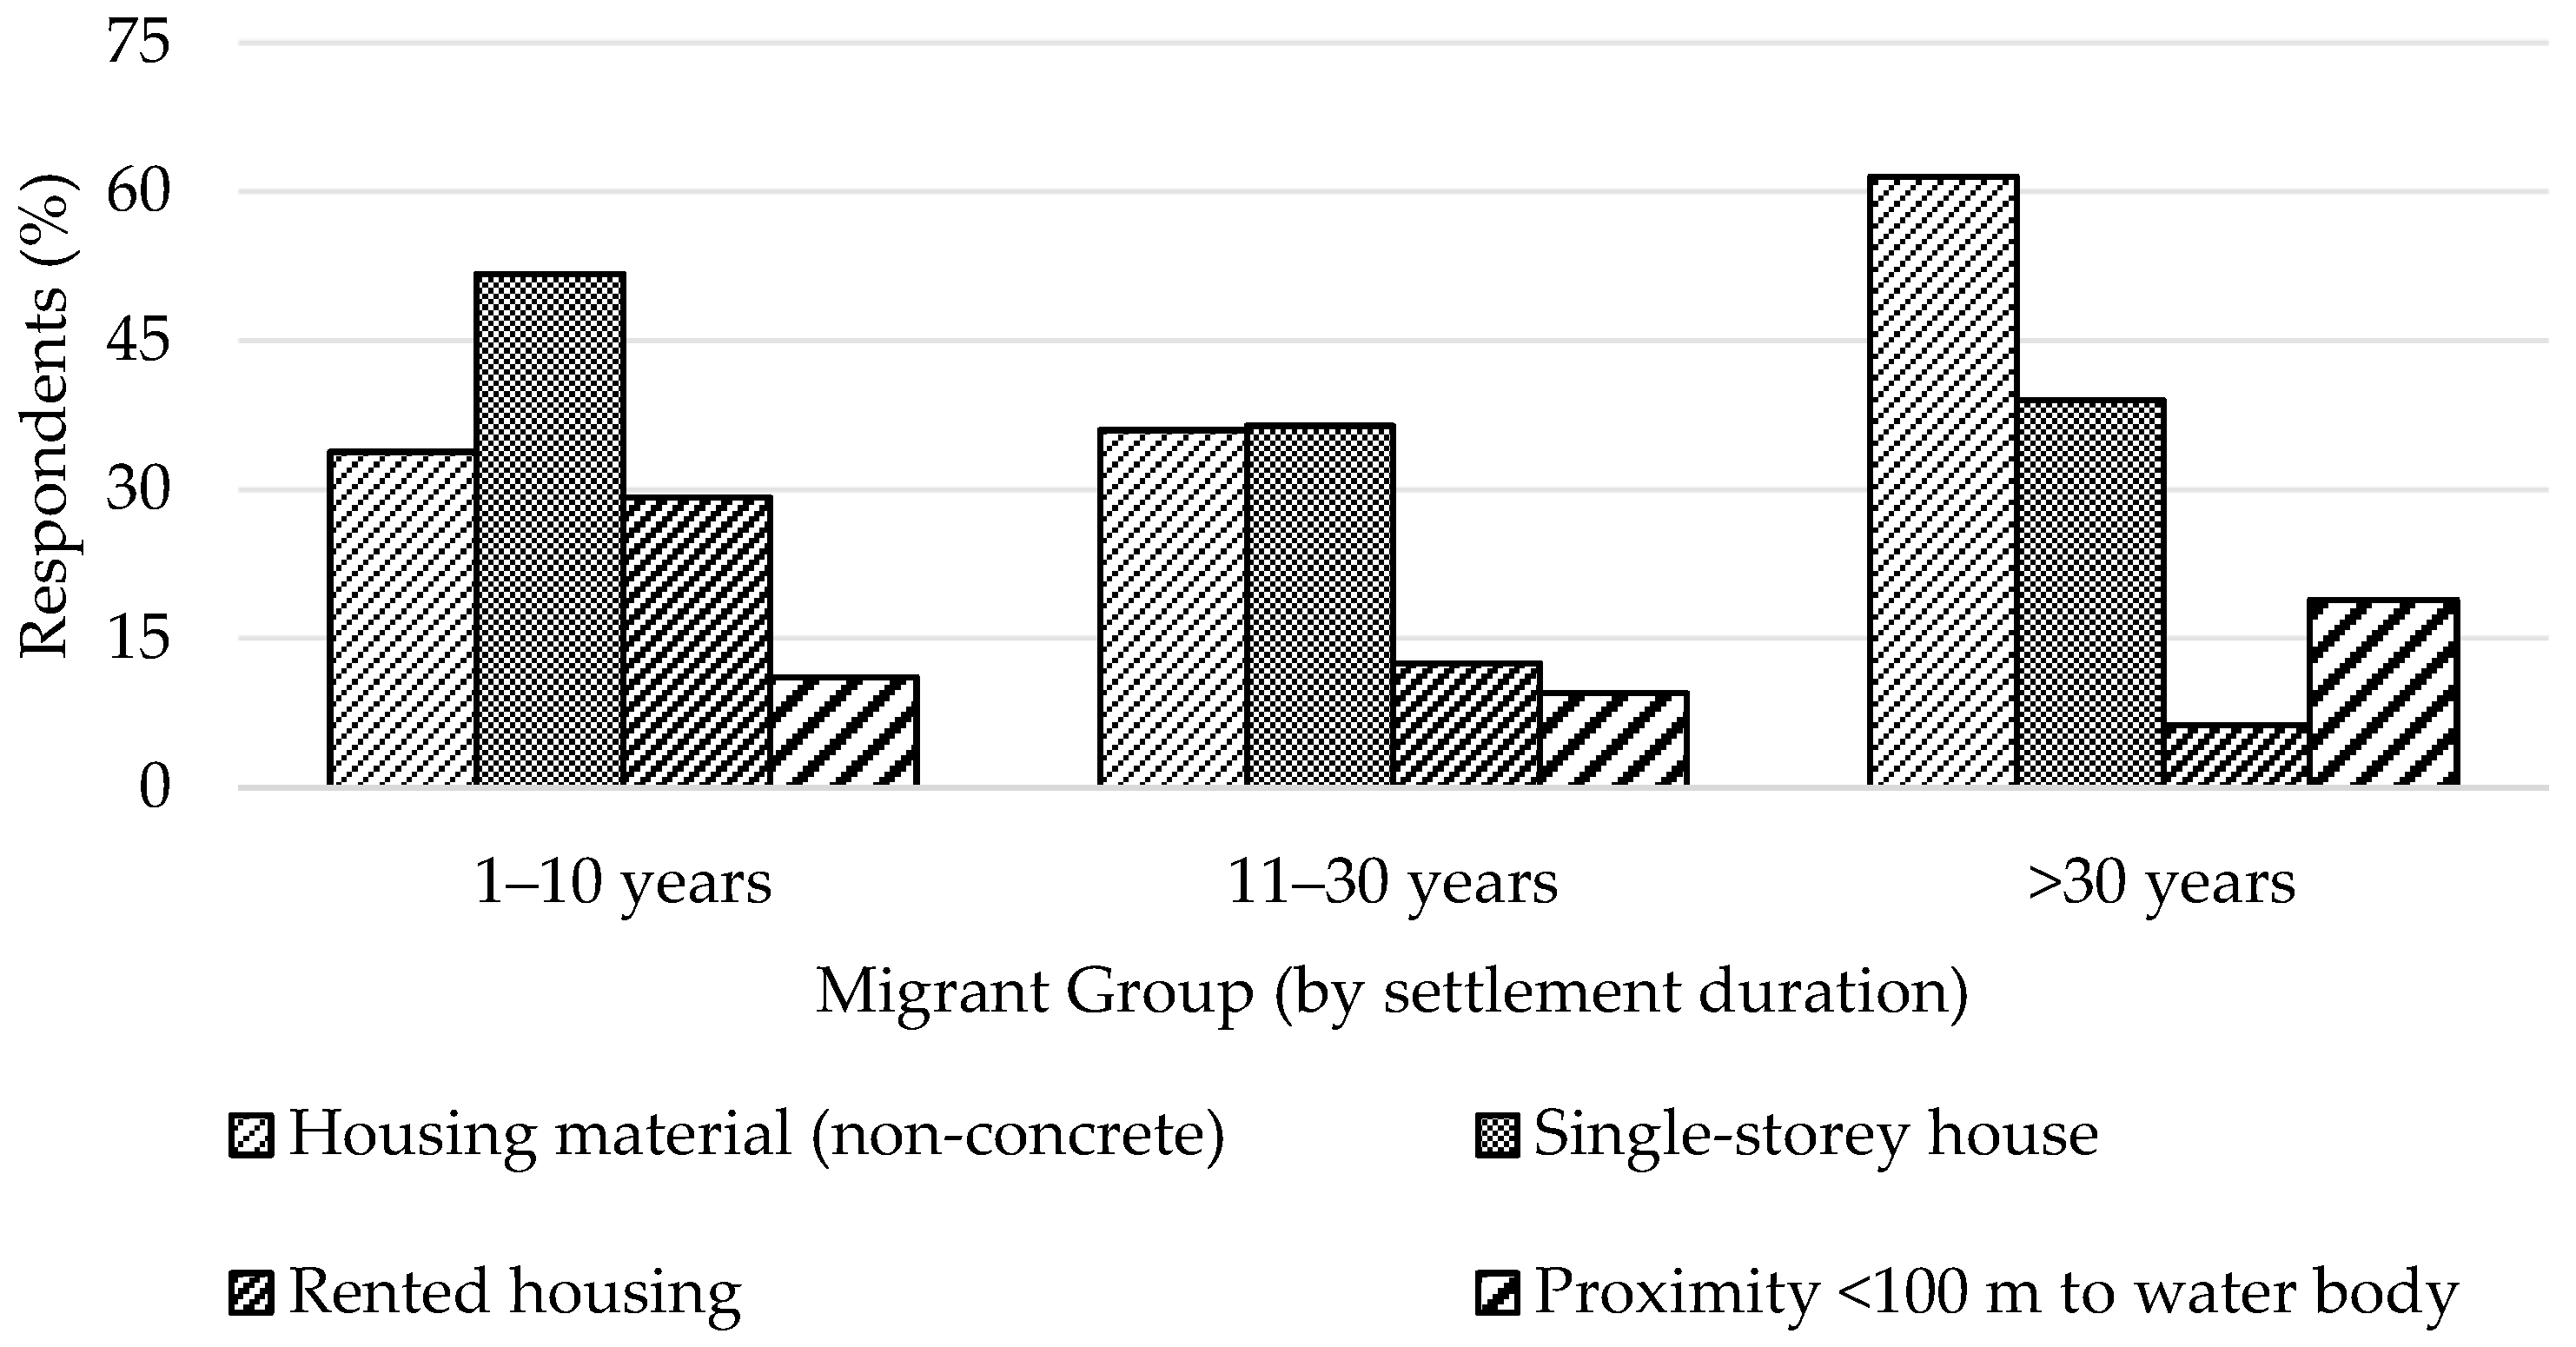
Physical vulnerability indicators differ significantly across settlement-duration cohorts. Housing wall material also varies significantly across groups (χ2 = 43.06, p < 0.001). Long-term residents are more likely to live in mixed-material dwellings (43.9%), whereas new and mid-term migrants are more likely to live in reinforced concrete houses (66.2% and 64.0%, respectively). House storey level differs significantly by settlement duration (χ2 = 10.13, p = 0.038). New migrants are more likely to live in single-storey houses (51.7%), limiting vertical evacuation options. Mid- and long-term migrants are more commonly found in two-storey structures (54.6%). Housing rental status is strongly associated with settlement duration (χ2 = 37.96, p < 0.001). Rental occupancy is highest among new migrants (29.2%) and declines among mid-term (12.5%) and long-term residents (6.3%), indicating greater tenure insecurity among recent arrivals. Proximity to water bodies is also significantly associated (χ2 = 16.43, p = 0.037). Long-term residents are more likely to live within 11–50 m of waterways (10.7%), reflecting earlier settlement near agricultural or fishing zones. These results demonstrate differentiated physical vulnerability patterns. New migrants face tenure insecurity and limited vertical protection. Long-term residents experience aging housing and proximity-related risk. Mid-term migrants live in stronger concrete houses but often in densely built-up areas characterised by inadequate drainage and a high risk of flash floods (Figure 3).

3.2.4. Adaptive Resources and Institutional Linkages

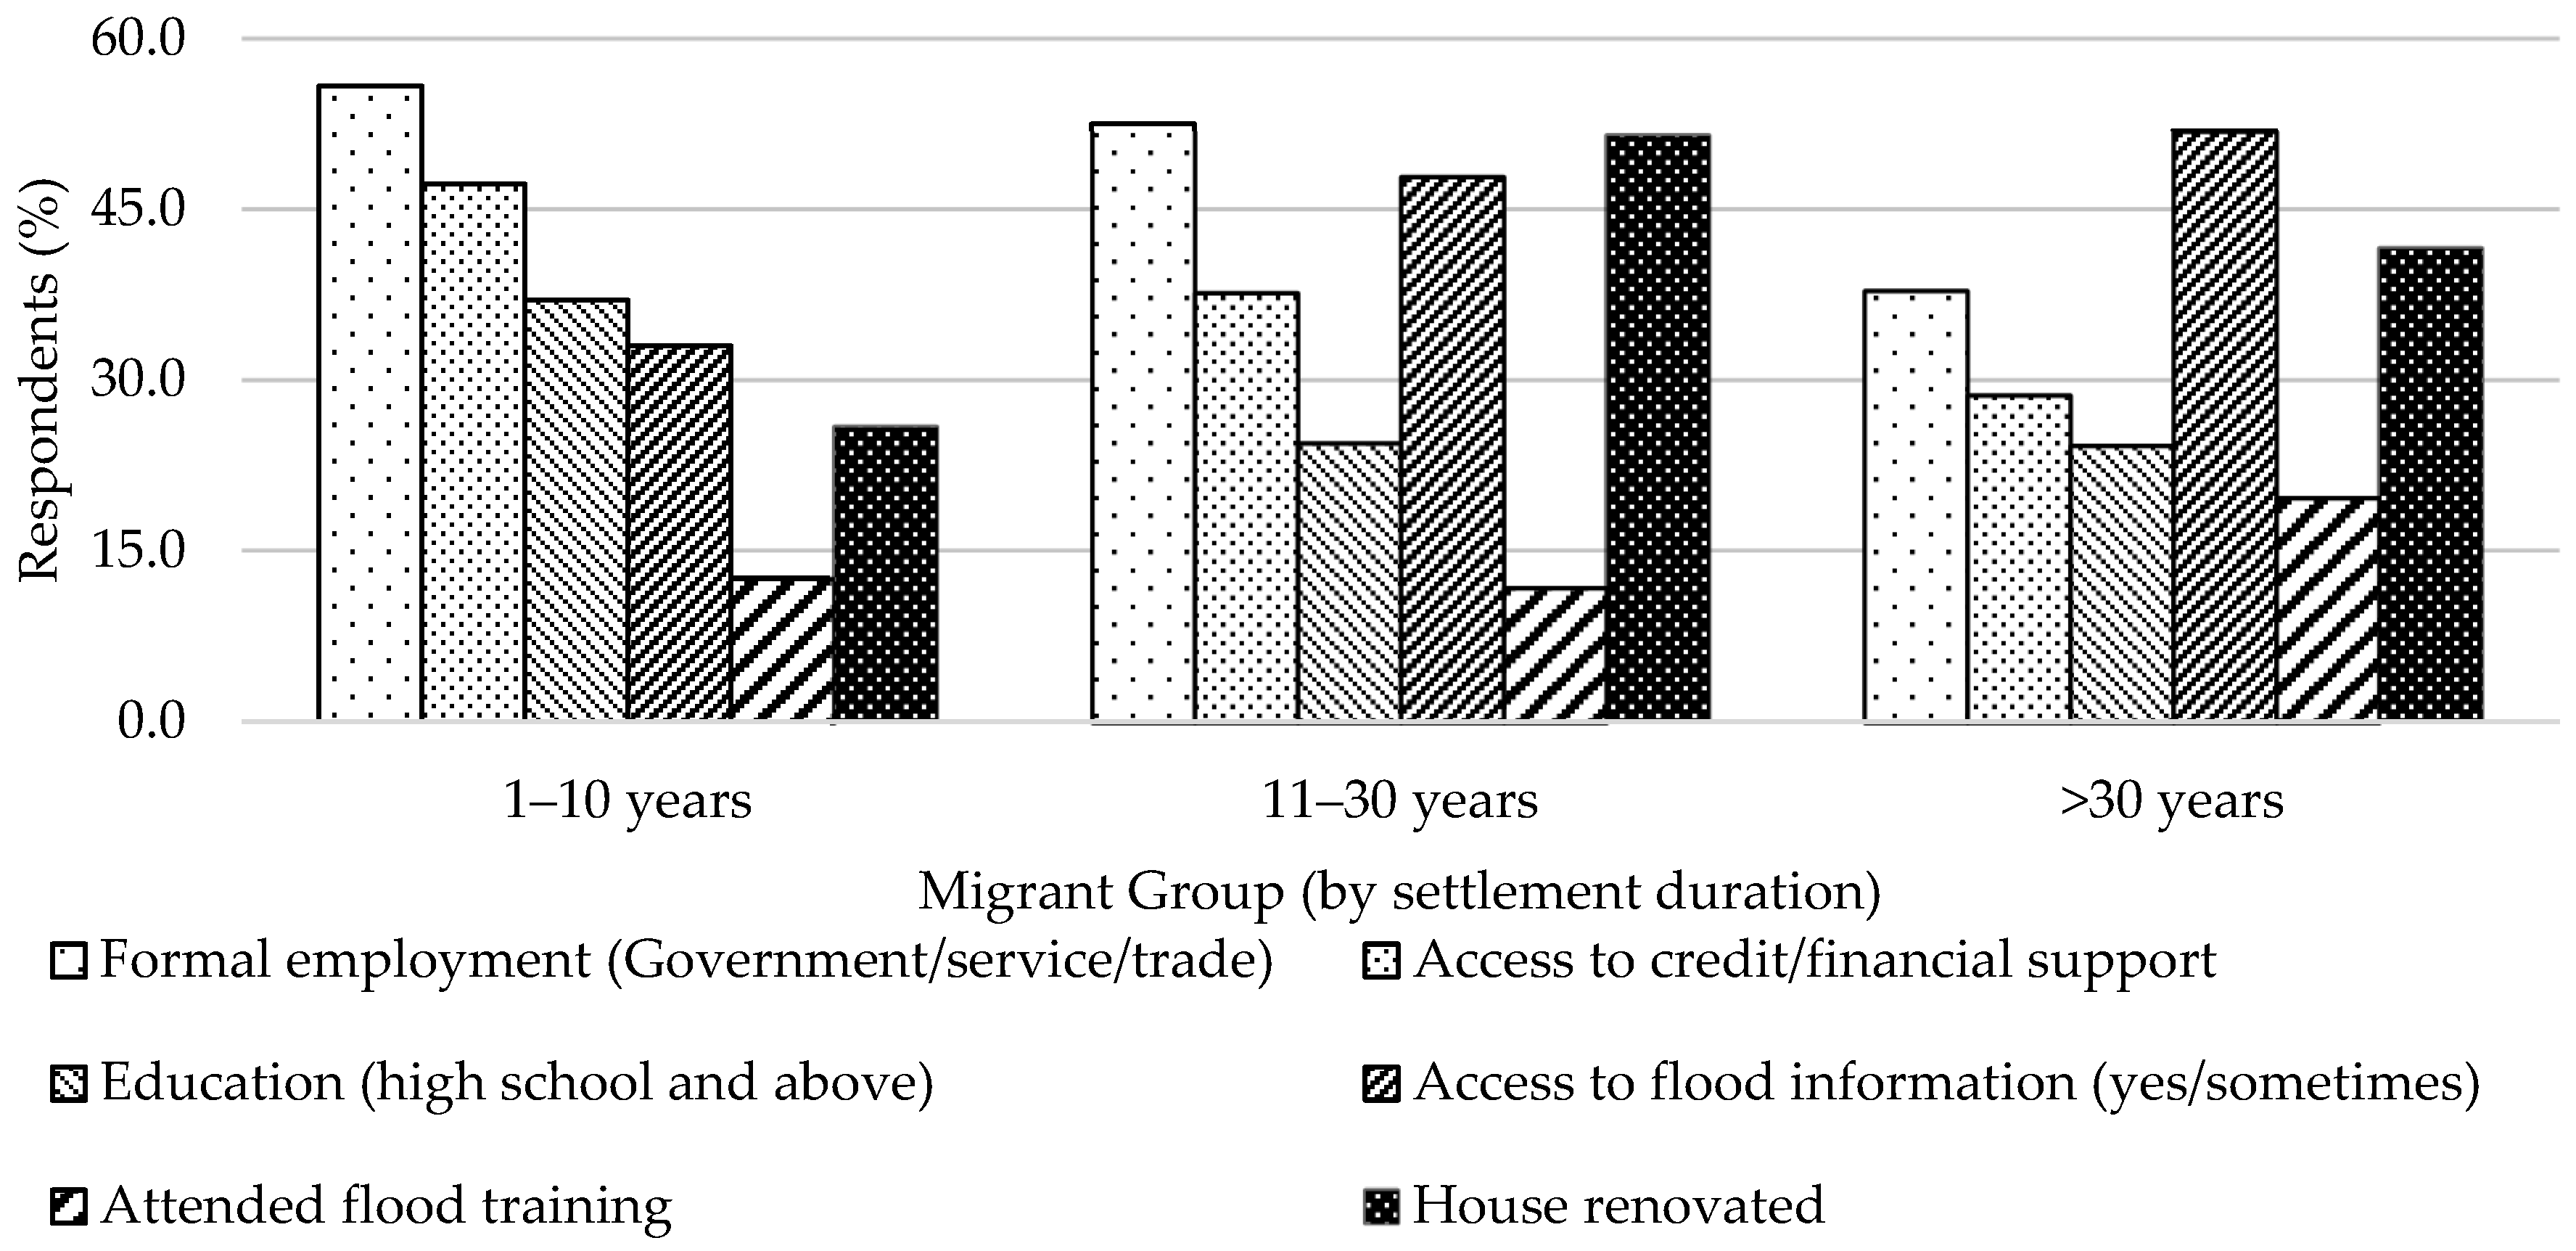
Formal employment as the primary income source differs significantly across settlement groups (χ2 = 26.99, p = 0.001). It is highest among new migrants (55.8%), moderate among mid-term migrants (52.5%), and lowest among long-term migrants (37.9%). New migrants report greater access to credit (47.2%) and to education (37% with secondary education or higher). These factors indicate latent adaptive potential, supported by financial and human capital, but low access to flood information and training (Figure 4).
Financial stability and housing adaptation measures—such as renovation, elevation, or structural improvements—are the most influential coping dimensions in reducing vulnerability. Financial stability is measured through formal employment and access to credit. Institutional linkages, including access to flood information and training, remain limited across all groups. This pattern indicates a governance gap rather than solely household-level adaptive constraints.
As illustrated in Figure 4, mid-term migrants demonstrate a relatively stronger adaptive capacity than other cohorts. Over half (51.5%) have upgraded or elevated their houses, and 47.9% regularly access flood information. Their adaptation combines experience, financial stability, and stronger community integration, reflecting a balance between resources and learning.
Long-term migrants rely on experiential adaptation. Nearly one-fifth (19.7%) have attended flood training and depend on neighbourhood networks. However, aging infrastructure and limited finances constrain their resilience.
Across indicators, statistically significant differences reveal structured differentiation in hazard exposure, physical vulnerability, and adaptive resources across settlement cohorts. These findings imply that flood risk reduction strategies cannot adopt a uniform approach. Newly arrived migrants may require improved access to institutional support and secure housing options, while long-term residents may benefit from infrastructure upgrading and housing retrofitting programmes. Differentiated policy interventions are therefore necessary to address cohort-specific risk profiles.

4. Discussion

4.1. Dynamic Differentiation of Urban Flood Risk

The findings reveal that flood risk in Phnom Penh’s peri-urban areas is spatially, socially, and temporally differentiated. Flood hazards are most severe in recently urbanised zones with poor drainage and reduced natural retention. Exposure peaks in newly urbanised areas, while vulnerability exhibits a dual pattern—social for new migrants and structural for long-term migrants.
Coping capacity follows a nonlinear trajectory across settlement phases. It strengthens with experience in settlement but weakens under economic and infrastructure constraints. It is strongest among mid-term migrants who combine economic stability, social integration, and adaptive experience. New migrants have higher levels of education and greater access to credit, but lack formal institutional support. Older migrants rely on experiential learning but face constraints from aging infrastructure and declining physical assets. Mid-term migrants demonstrate the most effective adaptation, whereas new migrants and long-term residents face distinct resource limitations. This confirms that adaptive capacity evolves with demographic consolidation and repeated flood exposure.
Physical vulnerability arises from housing materials, elevation levels, tenure security, and infrastructure degradation. New migrants face insecure and low-lying housing conditions, while long-term migrants experience aging structures and declining infrastructure quality. These patterns indicate that peri-urban flood vulnerability in Phnom Penh remains predominantly physical and structural.
These differentiated vulnerability patterns reflect spatial restructuring across peri-urban Phnom Penh, including wetland loss, infill development, uneven elevation, and constrained drainage capacity.
Overall, the results confirm that urban flood risk is dynamic rather than static. Hazard, exposure, and vulnerability interact differently across settlement phases, producing varied resilience outcomes. Newly developed areas experience frequent floods due to weak infrastructure, whereas older communities face chronic risks from environmental degradation and aging infrastructure.
This differentiation reinforces the study’s central argument that flood risk is co-produced by urbanisation dynamics and institutional constraints. Rapid urban growth, unequal land access, and delayed infrastructure provision collectively intensify vulnerability in peri-urban areas. Phnom Penh’s “perturbation zones” illustrate a fallacy of composition, where improved housing conditions coexist with heightened flood exposure. Effective mitigation requires integrated land-use planning, community-based adaptation, and inclusive governance to narrow emerging resilience disparities.
Flood hazard establishes the physical baseline of risk. Socioeconomic conditions shape vulnerability and coping capacity. Housing quality, housing tenure security, and financial resources significantly influence flood impacts. These factors mediate exposure rather than operate independently.
The relationship between urbanisation and institutional constraints is context-dependent. It is most evident in rapidly urbanising floodplain cities with weak infrastructure governance. In highly regulated cities, infrastructure provision may decouple growth from risk escalation. Therefore, the thesis must be interpreted within specific governance contexts.
Differentiated migrant trajectories show that flood risk evolves through demographic and spatial restructuring. Risk does not decline linearly over time. Instead, it follows a nonlinear pathway shaped by concentrated exposure and infrastructure lag. Uneven institutional support reinforces differentiated vulnerability outcomes. These dynamics strengthen the study’s contribution to dynamic flood risk assessment frameworks.

4.2. Integrating Migration and Urbanisation into Flood Risk

Flood risk in Phnom Penh’s peri-urban areas evolves through the process of urbanisation and migration. While hazard remains relatively constant due to stable monsoonal patterns, exposure, vulnerability, and coping capacity change over time as settlements age. Comparing migrant cohorts reveals how social and spatial dynamics shape this evolution.
In the early phase, exposure was relatively low due to limited population and housing density. However, vulnerability remained moderate. Migrants often lived close to rivers, lakes, and canals to support farming and fishing livelihoods. Housing was typically constructed from weak, wooden, or mixed materials, but moderately elevated. Coping capacity was also low as many early migrants had limited education, unstable incomes, and insecure livelihoods. Even minor floods generated significant hardship.
Over time, long-term residence and land ownership enabled incremental investment in housing. Older migrants renovated homes, raised floors, and added concrete extensions. Vertical adaptation became more common, with many households relocating living spaces to upper floors to reduce exposure. Although these measures reduced risk, they did not eliminate it. During this phase, flood impacts were shaped more by limited coping capacity than by exposure alone, but gradual adaptations reduced vulnerability over time.
During the mid-term phase, exposure increased sharply as the peri-urban population and housing density grew. Mid-term migrants often settled in affordable but hazard-prone locations, particularly in Chaom Chau Ti2. Housing quality improved, with many families investing in concrete structures and elevated designs. Mid-term migrants reported the lowest proportion of first-floor dwellings and greater use of upper floors, reducing direct impacts. However, vulnerability persisted because settlements were concentrated in areas prone to frequent flooding. Coping capacity improved moderately as households secured more stable employment and income.
In this phase, overall risk remains moderate because exposure increases while vulnerability is partially offset by structural improvements. Structural improvements and rising incomes reduced vulnerability, but not enough to offset growing exposure. The result was recurrent flooding that continued to disrupt daily life.
In the most recent phase, exposure reached its highest level amid rapid urban expansion and sustained migrant inflows. Many new arrivals settled in Dangkao and Cheung Aek, where land remained available, but drainage infrastructure was weak.
New migrants often lived in rental housing or developer-built flats with limited renovation options. Many occupied ground floors, leaving them highly exposed. Vulnerability was mixed: while housing was structurally newer, locational choices placed migrants at heightened risk.
Unlike earlier cohorts, new migrants possessed greater coping capacity, supported by higher levels of education, more formal employment, and higher incomes. These resources enhanced their ability to recover from flood impacts. Coping capacity was stronger, supported by higher levels of education and income. Risk, therefore, remained high primarily because exposure continued to increase despite stronger coping.
These patterns reflect not only household adaptation but also uneven municipal governance. Drainage expansion has lagged behind rapid settlement growth. Wetland infill has proceeded without proportional infrastructure upgrading. Land-use regulation, therefore, plays a central role in shaping peri-urban exposure. Persistent vulnerability among specific cohorts highlights the institutional production of flood risk.

4.3. Methodological Limitations

This study has several methodological limitations. First, hazard intensity partly relies on self-reported flood experiences, which may introduce recall bias. Second, the analysis does not include longitudinal household tracking, limiting the ability to observe adaptation trajectories over time. Third, hazard is assumed constant over 30 years, excluding climate variability and long-term hydrological change. Fourth, the study does not construct a composite numerical flood risk index; instead, it analyses hazard, exposure, vulnerability, and coping capacity separately to preserve conceptual clarity. Finally, the analysis focuses on four peri-urban sites rather than metropolitan-scale modelling.
Future research could develop a composite flood risk index to enable quantitative comparison across districts and time periods. Integrating spatial hydrological modelling and climate projections would improve representation of hazard variability. Longitudinal household tracking could better capture dynamic adaptation processes. Comparative studies across Southeast Asian cities would clarify the generalisability of settlement-duration-based risk assessment.

5. Conclusions

This study applied a combined framework of urbanisation dynamics, migrant settlement patterns and household-level survey data to examine peri-urban flood risk in Phnom Penh. The analysis confirms a dynamic risk pathway shaped not only by hazard but by evolving interactions between exposure, vulnerability and coping capacity. Results show that absolute flood risk is rising, primarily because new migrants are settling in high-exposure zones. Yet the pace of increase is moderating: improvements in housing quality, income stability and education among longer-established migrant households partly offset the risks created by continuing in-migration.
Overall, peri-urban flood risk in Phnom Penh is dynamic, layered, and path-dependent. Exposure grows faster than coping capacity improves, resulting in rising aggregate risk despite household-level adaptation. Effective flood management must therefore extend beyond individual adaptation strategies and integrate migrant settlement dynamics into urban planning, land-use regulation, and infrastructure investment. Without structural interventions that directly address exposure, resilience gains at the household level will not alter the broader risk trajectory. Policy responses should prioritise regulating settlement expansion into high-exposure wetland areas. Incentives for vertical physical housing adaptation, supported by microfinance and structural upgrading schemes, are needed. Strengthening local flood early-warning dissemination systems would enhance institutional preparedness. Systematic monitoring of migrant settlement patterns should be embedded within urban land-use planning frameworks. Coordinated governance interventions are essential to prevent the continued accumulation of risk.
This study does not explicitly model the effects of governmental flood protection measures or drainage expansion. Infrastructure investment and non-structural interventions could substantially reshape vulnerability and coping capacity. Future research should examine how governance reforms interact with settlement dynamics to alter exposure trajectories. Integrating climate change projections would further clarify how evolving hazard regimes intersect with urbanisation processes.
The findings are most transferable to rapidly urbanising secondary cities in Southeast Asia. Such cities commonly experience peri-urban wetland conversion, high in-migration, informal land development, and limited drainage capacity. In contexts where flood hazard is primarily climate-driven rather than urbanisation-driven, settlement duration may play a different role in shaping risk dynamics.

Supplementary Materials

The following supporting information can be downloaded at: https://www.mdpi.com/article/10.3390/w18050583/s1, S1: Methodology for Deriving Flood Frequency by District (2000–2018); S2: Sampling design and data collection; S3: Summary Tables of Results; S4: Hazard Index Using Min–Max Normalization; S5: Correlation Between Flood Hazard Index and Population Growth Rate (2008–2019).

Author Contributions

Conceptualization, T.K. (Toru Konishi) and M.N.; methodology, T.K. (Toru Konishi) and M.N.; validation, T.K. (Toru Konishi), M.N. and Y.I.; formal analysis, M.N.; investigation, H.A., and T.K. (Takuto Kumagae); resources, Y.I.; data curation, M.N., H.A. and T.K. (Takuto Kumagae); writing—original draft preparation, M.N.; writing—review and editing, T.K. (Toru Konishi) and Y.I.; visualization, M.N.; supervision, Y.I.; project administration, Y.I.; funding acquisition, Y.I. All authors have read and agreed to the published version of the manuscript.

Funding

This study was supported by the Tokyo Metropolitan Government Advanced Research Grant Number (R4-2) and the Tokyo Global Partner Scholarship Program.

Institutional Review Board Statement

The study was conducted in accordance with the Declaration of Helsinki, and the protocol was approved by the Ethics Committee of Ministry of Interior General Department of Administration (No. 090 N./GDA.) on 5 March 2025.

Informed Consent Statement

Informed consent was obtained from all participants involved in the study.

Data Availability Statement

Restrictions apply to the availability of these data due to ethical and privacy considerations. Publicly available datasets were analysed in this study. Flood extent data were obtained from the Global Flood Database (GFD), which provides satellite-derived flood maps for individual flood events from 2000 to 2018 (available at https://global-flood-database.cloudtostreet.ai/, accessed on 4 January 2025). Global terrain data were sourced from the FABDEM V1-2 dataset, which is openly available through the University of Bristol data repository (available at https://doi.org/10.5523/bris.25wfy0f9ukoge2gs7a5mqpq2j7, accessed on 27 June 2025). Population data at the Sangkat/Commune level were provided by the Ministry of Planning (MOP), Cambodia, and are available from the corresponding author upon reasonable request and with the MOP’s permission. Some datasets generated and analysed during the current study are not publicly available, as they form part of an ongoing research project. Requests for access to these data should be directed to the corresponding author.

Acknowledgments

The authors gratefully acknowledge the Phnom Penh municipality and Sangkat authorities for their support and coordination during the fieldwork, as well as the students of the Department of Sustainable Urban Planning and Development at the Royal University of Phnom Penh for their valuable assistance in data collection.

Conflicts of Interest

The authors declare no conflicts of interest.

Abbreviations

The following abbreviations are used in this manuscript:
GFDGlobal Flood Database
MOPMinistry of Planning
MOVEMethods for the Improvement of Vulnerability Assessment in Europe
MOWRAMMinistry of Water Resources and Meteorology

Appendix A. Survey Questionnaire

Appendix A.1. Introduction

We are students from the Department of Sustainable Urban Planning and Development at the Royal University of Phnom Penh (RUPP), conducting doctoral research in collaboration with the Hydrology Laboratory at Tokyo Metropolitan University (TMU). This research project, titled “Urban Flood Risk and Integrated Social Flood Vulnerability Assessment in Phnom Penh City, Cambodia,” aims to assess urban flood risks and socioeconomic impacts. This survey involves interviewing households in randomly selected villages and peri-urban areas in Phnom Penh, where we will ask the household head or another knowledgeable household member to participate. The interview will take approximately 20–30 min, and you are free to pause or discontinue at any time.

Appendix A.2. Consent

Are you comfortable proceeding with the interview? If yes, we can begin with the following questions.

Appendix A.3. Survey Questions

A. Survey and Respondent Details
A.1. Khan (district)/Sangkat (Commune): ____________
A.2. Geographic coordinates (latitude and longitude): X = ____, Y = _____
A.3. Date (MM.DD.YY): _________________
A.4. Respondent No.: ___________________
A.5. Name (optional): ___________________
A.6. Contact Detail: ___________________
A.7. Current Address: __________________
A.8. Age:______________ (years)
A.9. Sex: [1] Male; [2] Female; [98] Don’t want to mention
A.10. Age of the household head: ______________ years
A.11. Household size: _________________________
A.12. Date of moving in or living (year): ____________
A.13. Original residence (province/city): ____________
I. Flood History and Frequency
Q1. In what year was the most severe flooding in your area/village/Sangkat? _____ (Year)
Q2. How often has your neighborhood experienced flooding (for example, in 2024)? __________
Q3. What is the typical height of floodwater measured from the local roads in your neighborhood during a flood? (in meters) ___________
Q4. How long does the floodwater usually stay in your neighborhood during a flood event? _____ (in days)
II. Housing and Location
Q5. Please describe the material the wall of your house is made of. (Choose all that apply)
1. Zinc; 2. Wood; 3. Mixed Concrete; 4. Concrete; 99. Other (Specify): _______
Q6. How many floors does your house have?
1. One storey; 2. Two-storey; 3. Three or more; 99. Other (Specify): _______
Q7. Do you or your family own the house/apartment you currently live in?
1. Yes; 2. No
Q8. How far is your house from a river or lake?
1. <10 m; 2. 11–50 m; 3. 51–100 m; 4. 101–1000 m; 5. 1 Km
Q9. Household head’s occupation:
1. Government & services; 2. Trade and commerce; 3. Garment and construction; 4. Daily wages & agriculture; 5. Unemployed & retirement; 99. Other (Specify): _______
Q10. Household head’s education:
1. No education; 2. Primary and secondary school; 3. High school; 4. University
III. Flood Information and Adaptation
Q11. Do you receive flood advisories or warnings before a flood event?
1. Yes; 2. Sometimes; 3. No
Q12. Are any of your family members attending training on flood prevention in the area?
1. Yes; 2. No; 98. Don’t know
Q13. Have you renovated your house?
1. Yes; 2. No; 98. Don’t know

References

  1. Parmesan, C.; Morecroft, M.; Trisurat, Y. Climate Change 2022: Impacts, Adaptation and Vulnerability. 2022. Available online: https://hal.science/hal-03774939/document (accessed on 4 October 2025).
  2. UNDRR. Global Assessment Report on Disaster Risk Reduction 2019. 2019. Available online: https://www.undrr.org/media/73965 (accessed on 24 August 2025).
  3. Tierolf, L.; Moel, H.D.; Vliet, J.V. Modeling urban development and its exposure to river flood risk in Southeast Asia. Comput. Environ. Urban Syst. 2021, 87, 101620. [Google Scholar] [CrossRef]
  4. Poaponsakorn, N.; Meethom, P. Impact of the 2011 Floods, and Flood Management in Thailand. In Resilience and Recovery in Asian Disasters; Springer: Berlin/Heidelberg, Germany, 2013. [Google Scholar]
  5. World Bank. Thai Flood 2011: Rapid Assessment for Resilient Recovery and Reconstruction Planning; World Bank: Bangkok, Thailand, 2012; Available online: https://hdl.handle.net/10986/26862 (accessed on 24 August 2025).
  6. Birkmann, J.; Cardona, O.D.; Carreño, M.L.; Barbat, A.H.; Pelling, M.; Schneiderbauer, S.; Kienberger, S.; Keiler, M.; Alexander, D.; Zeil, P.; et al. Framing vulnerability, risk and societal responses: The MOVE framework. Nat. Hazards 2013, 67, 193–211. [Google Scholar] [CrossRef]
  7. Imamura, Y. Development of a method for assessing country-based flood risk at the global scale. Int. J. Disaster Risk Sci. 2022, 13, 87–99. [Google Scholar] [CrossRef]
  8. Adger, W.N. Social and ecological resilience: Are they related? Prog. Hum. Geogr. 2000, 24, 347–364. [Google Scholar] [CrossRef]
  9. Folke, C.; Carpenter, S.R.; Walker, B.; Scheffer, M.; Chapin, T.; Rockstrom, J. Resilience Thinking: Integrating Resilience, Adaptability and Transformability. Ecol. Soc. 2010, 15, 20. [Google Scholar] [CrossRef]
  10. Liao, K.H.; Le, T.A.; Van Nguyen, K. Urban design principles for flood resilience: Learning from the ecological wisdom of living with floods in the Vietnamese Mekong Delta. Landsc. Urban Plan. 2016, 155, 69–78. [Google Scholar] [CrossRef]
  11. Leitner, H.; Sheppard, E. Provincializing Critical Urban Theory: Extending the Ecosystem of Possibilities. Int. J. Urban Reg. Res. 2016, 40, 228–235. [Google Scholar] [CrossRef]
  12. Quesada-Román, A. Disaster Risk Assessment of Informal Settlements in the Global South. Sustainability 2022, 14, 10261. [Google Scholar] [CrossRef]
  13. Rana, I.A.; Routray, K.J. Integrated methodology for flood risk assessment and application in urban communities of Pakistan. Nat. Hazards 2018, 91, 239–266. [Google Scholar] [CrossRef]
  14. Erena, S.H.; Worku, H. Urban flood vulnerability assessments: The case of Dire Dawa city, Ethiopia. Nat. Hazards 2019, 97, 495–516. [Google Scholar] [CrossRef]
  15. Nop, S.; Thornton, A. Urban resilience building in modern development. Ecol. Soc. 2019, 24, 23. [Google Scholar] [CrossRef]
  16. Karunarathne, A.Y.; Lee, G. Developing a multi-facet social vulnerability measure for flood disasters at the micro-level assessment. Int. J. Disaster Risk Reduct. 2020, 49, 101679. [Google Scholar] [CrossRef]
  17. Thanvisitthpon, N.; Shrestha, S.; Pal, I.; Ninsawat, S.; Chaowiwat, W. Assessment of flood adaptive capacity of urban areas in Thailand. Environ. Impact Assess. Rev. 2020, 81, 106363. [Google Scholar] [CrossRef]
  18. Few, R.; Ramírez, V.; Armijos, M.T.; Hernández, L.A.Z.; Marsh, H. Moving with risk: Forced displacement and Vulnerability to hazards in Colombia. World Dev. 2021, 144, 105482. [Google Scholar] [CrossRef]
  19. Rehan, M.B. Accounting public and individual flood protection measures in damage assessment: A novel approach for quantitative assessment of Vulnerability and flood risk associated with local engineering adaptation options. J. Hydrol. 2018, 563, 863–873. [Google Scholar] [CrossRef]
  20. Mialhe, F.; Gunnell, Y.; Navratil, O.; Choi, D.; Sovann, C.; Lejot, J.; Gaudou, B.; Se, B.; Landon, N. Spatial growth of Phnom Penh, Cambodia (1973–2015): Patterns, rates, and socio-ecological consequences. Land Use Policy 2019, 87, 104061. [Google Scholar] [CrossRef]
  21. Marks, D.; Baird, G.I. The urban political ecology of worsening flooding in Phnom Penh, Cambodia: Neopatrimonialism, displacement, and uneven harm. Int. J. Disaster Risk Reduct. 2025, 118, 105229. [Google Scholar] [CrossRef]
  22. World Population Review. Phnom Penh Population 2025. 2025. Available online: https://worldpopulationreview.com/cities/cambodia/phnom-penh (accessed on 24 August 2025).
  23. World Population Review. Manila Population 2025. 2025. Available online: https://worldpopulationreview.com/cities/philippines/manila (accessed on 24 August 2025).
  24. World Population Review. Jakarta Population 2025. 2025. Available online: https://worldpopulationreview.com/cities/indonesia/jakarta (accessed on 24 August 2025).
  25. World Population Review. Bangkok Population 2025. 2025. Available online: https://worldpopulationreview.com/cities/thailand/bangkok (accessed on 24 August 2025).
  26. Flower, B.; Fortnam, M. Urbanising Disaster Risk: Vulnerability of the Urban Poor in Cambodia to Flooding and Other Hazards. 2015. Available online: https://www.preventionweb.net/files/submissions/47109_urbanisingdisasterriskreportinteractive.pdf (accessed on 29 July 2025).
  27. Hawker, L.; Uhe, P.; Paulo, L.; Sosa, J.; Savage, J.; Sampson, C.; Neal, J. A 30 m global map of elevation with forests and buildings removed. Environ. Res. Lett. 2022, 17, 024016. [Google Scholar] [CrossRef]
  28. Councils of Sangkats. Statistics of the Population of Sangkats: Dangkao, Prey Veaeng Cheung Aek, and Chaom Chau Ti2 2025; Unpublished Data; Councils of Sangkats: Phnom Penh, Cambodia, 2025. [Google Scholar]
  29. Ministry of Planning (MOP). Commune Database: 2005 and 2015; Unpublished Excel Data Set; Ministry of Planning (MOP) Commune Database: Phnom Penh, Cambodia, 2016.
  30. National Institute of Statistics (NIS). General Population Census of Cambodia 2008; NIS: Phnom Penh, Cambodia, 2008.
  31. National Institute of Statistics (NIS). General Population Census of the Kingdom of Cambodia 2019; NIS: Phnom Penh, Cambodia, 2020.
  32. Tellman, B.; Sullivan, J.A.; Kuhn, C.; Kettner, A.J.; Doyle, C.S.; Brakenridge, G.R.; Slayback, D.A. Satellite imaging reveals increased proportion of population exposed to floods. Nature 2021, 596, 80–86. [Google Scholar] [CrossRef] [PubMed]
  33. Yamane, T. Statistics: An Introductory Analysis, 3rd ed.; Harper and Row: New York, NY, USA, 1973. [Google Scholar]
Figure 1. Spatial distribution of the study Sangkats. Elevation (meters above sea level) is derived from FABDEM V1-2. Major rivers, the Lower Prek Thnot River Basin, and surveyed households are shown. Relief shading covers the entire metropolitan area.
Water 18 00583 g001
Figure 2. Relationship between annual population growth rate and flood hazard index across Phnom Penh’s districts.
Water 18 00583 g002
Figure 3. Physical Vulnerability of Migrant Groups by Years of Residence.
Water 18 00583 g003
Figure 4. Socioeconomic and Flood Preparedness Characteristics of Migrant Groups by Years of Residence.
Water 18 00583 g004
Table 1. Population Trends and Annual Population Growth Rate in Peri-Urban Sangkats (2005–2025).
SangkatPopulation 2005Population 2015Population 2025Growth 2005–2015 (%/Year)Growth 2015–2025 (%/Year)Growth 2005–2025 (%/Year)
Dangkao12,38120,38562,9735.111.98.5
Prey Veaeng3985611189914.43.94.2
Cheung Aek5000990224,3487.19.48.2
Chaom Chau Ti210,66735,86649,06012.93.27.9
Table 2. Flood Hazard Indicators by Settlement Duration.
Flood Indicators1–10 Years
(%)
11–30 Years
(%)
>30 Years
(%)
χ2 (p-Value)
Flood Frequency (per year)
 No flood38.632.045.29.81 (0.044)
 1–5 times38.644.239.8
 >5 times22.923.915.1
Flood Duration
 <1 day43.459.546.28.66 (0.070)
 1 day–1 week33.626.131.8
 >1 week23.014.422.0
Flood Depth
 <0.5 m69.670.263.64.56 (0.335)
 0.5–1 m25.223.625.0
 >1 m5.26.211.4
Disclaimer/Publisher’s Note: The statements, opinions and data contained in all publications are solely those of the individual author(s) and contributor(s) and not of MDPI and/or the editor(s). MDPI and/or the editor(s) disclaim responsibility for any injury to people or property resulting from any ideas, methods, instructions or products referred to in the content.